
Abstract
Background:
Antenatal depressive symptoms adversely affect the health and well-being of women, babies, and their families. This study aimed to explore the prevalence and probable associated factors of depressivse symptoms.
Methods:
A prospective cohort approach was adopted, and 435 pregnant women were assessed longitudinally at an antenatal clinic in the first, second, and third trimesters. Edinburgh Postnatal Depression Scale (EPDS) was used to measure self-reported depressive symptoms. The multivariate approach of the general linear model was used to evaluate the mean differences of depression scores among the trimesters. To investigate the associated factors of depressive symptoms, generalized estimating equation (GEE) was used to take into account the clustering effect.
Results:
More than half (58.13%) of the pregnant women had antenatal depressive symptoms in at least one trimester. Depressive symptoms decreased throughout the pregnancy; they were higher in the first trimester and declined toward the third trimester. Significant mean differences were found in depression scores among the three trimesters. GEE showed that trimester, education, family income, and body mass index (BMI) are significantly associated with antenatal depressive symptoms.
Conclusions:
First trimester is the most critical period for identification of depressive symptoms. At-risk women need to be treated. Proper education achievement, economic solvency, and adequate nutrition could reduce the depressive symptoms.
Rate and the mean of depression were higher in the first trimester and declined toward the third trimester. Education, family income, and body mass index were also significantly associated with antenatal depression.Key Messages:
Previous research suggests that the rate of the mother having depressive symptoms decreases from 22% in the first trimester to 20.6% and 18.5% in the second and third trimesters, respectively. 11 In contrast, Bennett et al. 12 revealed an opposite trend: a prevalence rate of 7.4% in the first trimester and 12.8% and 12% in the second and third trimesters, respectively.
The prevalence rate of mothers with depressive symptoms during pregnancy varies from 7% to 20% in high-income countries and 20% or higher in low- or middle-income countries. However, limited data are available for low- or middle-income countries. 13 Specifically, depression rates are 20% in Malaysia, 14 46.8% in Thailand, 15 and 25% in Pakistan. 3 In Bangladesh, estimates vary from 18% to 33% in the rural areas of two subdistricts of the Mymensingh 6 and Matlab subdistricts, 8 respectively; however, no research is available from the urban areas of Bangladesh. Moreover, this lower prevalence of Mymensingh may be due to previous maternal support provided by Bangladesh Rural Advancement Committee (BRAC), a nongovernmental organization (NGO).
Research on ADS is rare in Bangladesh. Only a few cross-sectional studies concerning prevalence rates and associated sociodemographic factors are available for village women. There is no available information on the prevalence of depressive symptoms in all the three trimesters or how the nutritional and physiological parameters affect their severity. Exploration of point prevalence of maternal depressive symptoms may identify the vulnerable trimesters of pregnancy, which helps to take corrective measures. Urban women may show diverse levels and patterns of depressive symptoms.
The objectives of this study were to investigate the point prevalence of depressive symptoms in the three trimesters of pregnancy and to identify the sociodemographic and nutritional factors associated with the depressive symptoms.
Materials and Methods
Study Setting and Design
The data were obtained from Surjer Hashi Clinic, an antenatal care (ANC) clinic in Chattogram city, an NGO comprising 12 subbranches that provide low-cost services for pregnant mothers and children. The city is at the center of the Chattogram districts in the southeastern part of Bangladesh, 265 km from the capital, Dhaka. We conducted this prospective study among mothers under ANC from September 2015 to August 2017.
Sample Details and Procedures
Ethical approval was obtained from the “Medical Ethical Committee” of the health care clinic. Health care promoters and trained investigators explained the study to women. During the study period, 2,760 women visited the clinic, of whom 1,380 (50%) were pregnant. We invited all 466 (33.8%) women who were 8–12 weeks pregnant and explained the study, out of which 435 (93.3%) agreed to participate. Later, 17 women shifted home and dropped out of the study. The remaining 418 (96.1%) were followed up for the whole study period. The sociodemographic profile of those who dropped out was almost similar to that of our study sample. Written consent was obtained from the mothers after discussing the purpose of the study with them and assuring them about the confidentiality of their data that this research would not be harmful to them. Data were collected with a prestructured and pretested questionnaire at gestational age 8–12 weeks (first trimester). The women were requested to visit again during their second (13–28 weeks of gestation) and third (29–40 weeks of gestation) trimesters.
Study Variables
The sociodemographic factors hypothesized to have an association with depressive symptoms were trimester, mother’s age, mother’s age at marriage, mother’s education, family income, household living situation, professional status, maternal parity, pregnancy type, preparation for delivery, father’s age, and father’s education because there is a potential association between antenatal depression and age, education, professional status, income, parity, and unwanted pregnancy.4, –7 The nutritional parameters expected to be associated were mid-upper arm circumference (MUAC), body mass index (BMI), and hemoglobin (Hb) levels, because ADS have also been associated with inadequate nutrition. 13
MUAC was measured during the first, second, and third trimesters with a Talc insertion tape (MUAC Tape-Measure style, Health Books International/TALC, England). This tape can be used for children, pregnant mothers, and adults. The circumference was measured from the left arm midpoint, between the acromial and olecranon processes of the scapula and ulna, respectively, while the arm was hanging freely down the side. The tape was placed in a horizontal position that touched the skin and followed the contours of the limb, but not compressing the underlying tissue. MUAC was categorized into ≤24 cm (wasting) and >24 cm (normal), according to the World Health Organization (WHO, 1995). 16
Prepregnancy weight was based on self-report obtained during the first-trimester visit and verified by asking the information again in the second-trimester visit to the clinic. Height was measured with a portable Harpenden stadiometer (Holtain Ltd, London, United Kingdom/UK). The measurement was recorded while the participant stood, without shoes, on a horizontal flat plate attached to the base of the stadiometer, with heels together and fully stretched upward, with the head in the Frankfurt plane, as described by Kitange. 17 Prepregnancy BMI was categorized according to WHO (2003): underweight (<18.5 kg/m 2 ), normal (18.5–24.9 kg/m 2 ), and overweight (25–29.9 kg/m 2 ). 18
Only 138 women provided consent for blood samples to be collected. Hb concentration was determined with the HemoCue technique, during the first visit after recruitment. An electrical or battery-operated HemoCue photometer (HemoCue AB, Ängelholm, Sweden) with a disposable cuvette was used as suggested by Shirima and Kinabo (2005) and categorized as anemic (<11 g/dL) or normal (≥11 g/dL). 19
Measurement of Depressive Symptoms
Depressive symptoms were assessed with the Edinburgh Postnatal Depression Scale (EPDS). 20 This self-reported questionnaire comprises ten items that are measured on a four-point Likert scale (0–3). The total score ranges from 0 to 30, with higher scores indicating more severe depression. This scale measures the intensity of depressive symptoms over the previous seven days and is widely used with both pregnant and postpartum women. 21 Two bilingual social science researchers did the translation of all items of the scale. In-depth interviews about the items, with other pregnant women from outside the sample, confirmed that the Bengali terminology is accurate. Women with scores ≥10 were considered depressed, as described by Gausia et al. 8 and Nasreen et al. 6 The internal validity of the instrument was also checked (Cronbach’s α = 0.84), which ensured the internal consistency of the instrument.
Statistical Analysis
Multivariate analysis of variance of the general linear model was used to check the mean differences of depression score among the three trimesters. Repeated measures from the same unit over time can lead to clustering, and observations within the same cluster are usually correlated. To handle repeated and clustered data, Liang and Zeger proposed generalized estimating equation (GEE), which is a nonlikelihood method that corrects for the clustering effect and uses correlations to capture associations within clusters. 22 GEE with binary response variable using the logit link function was used to estimate the parameters. Exchangeability and autoregressive first-order working correlation assumptions were compared to observe the association of repeated measures within the cluster (respondent). The closest standard error of empirical and model-based estimates identified the best working correlation structure. Statistical package SAS version 9.3 23 was used for analysis. P value less than 5% was considered as the threshold for statistical significance.
Results
Sociodemographic and Obstetric Characteristics
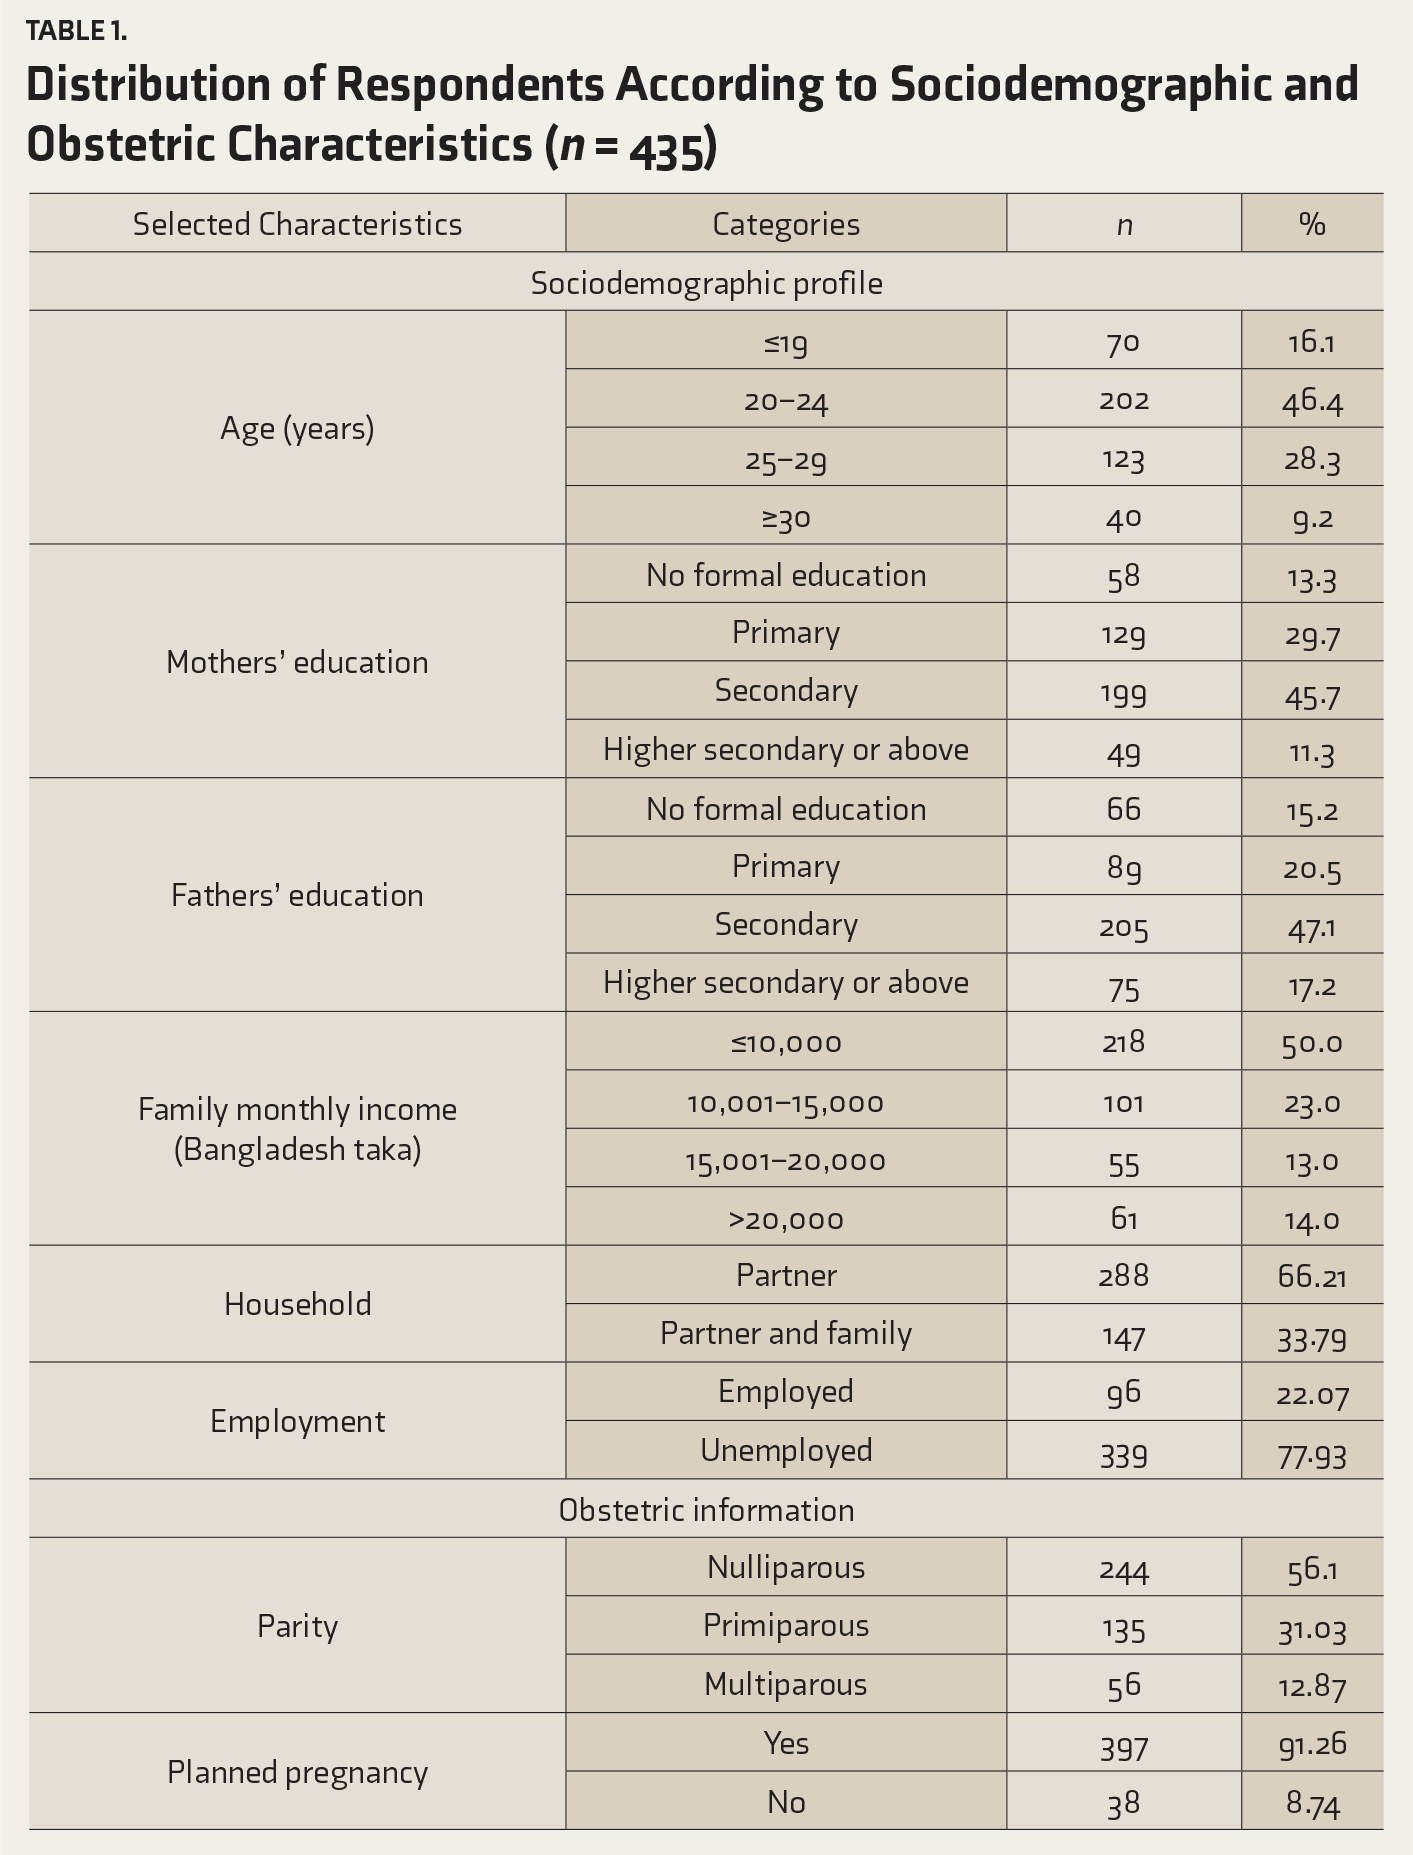
Distribution of Respondents According to Sociodemographic and Obstetric Characteristics (n = 435)
Nutritional Parameters
MUAC, BMI, and Hb Concentration in Pregnant Women
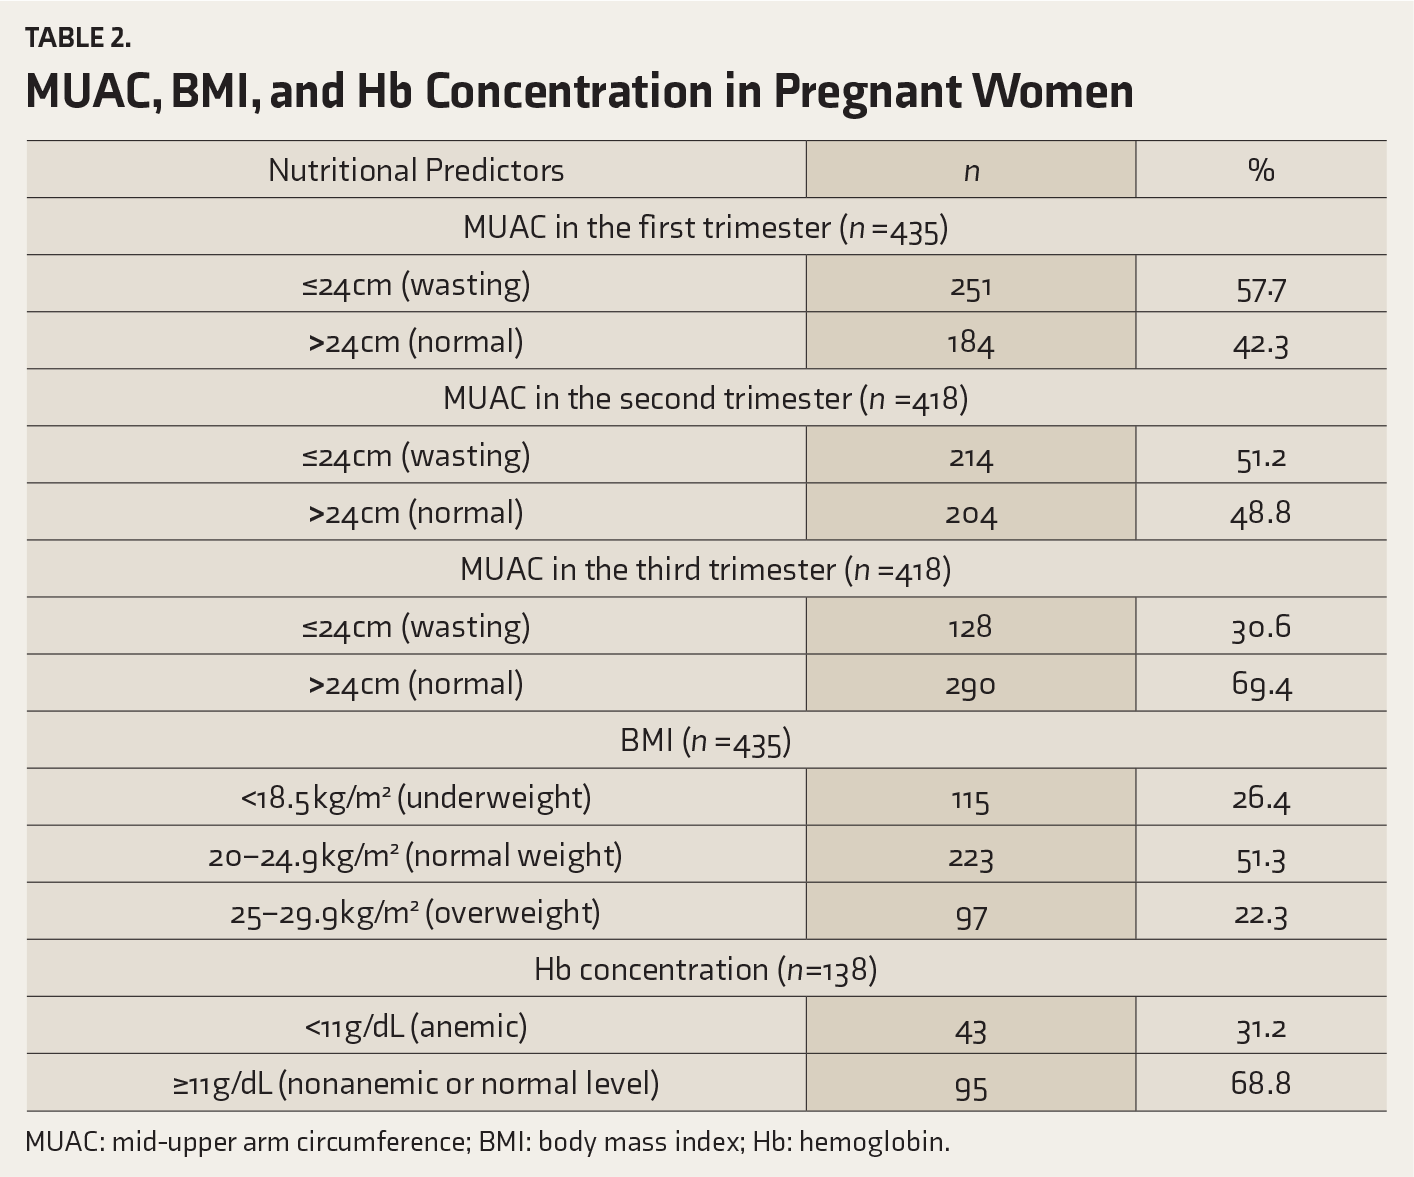
MUAC: mid-upper arm circumference; BMI: body mass index; Hb: hemoglobin.
Prevalence of Depression
The point prevalence was 35.4% (95% CI: 30.82%–40.20%) at the first trimester, and it decreased to 33.7% (95% CI: 28.51%–37.62%) and 30.1% (95% CI: 25.78%–34.79%) during the second and third trimesters, respectively. The percentage of women with depressive symptoms in all three trimesters was 12.9% (95% CI: 9.86%–16.52%), in at least one trimester was 58.13% (95% CI: 53.24%–62.91%) and in at least two trimesters was 28.71% (95% CI: 24.42%–33.31%). The average depression scores in the first, second, and third trimesters were 11.53 ± 4.75 (95% CI: 11.07–11.99), 10.01 ± 3.29 (95% CI: 9.68–10.31), and 9.62 ± 2.87 (95% CI: 9.34–9.89), respectively. Women with planned pregnancy had lower rates of depression than those with unplanned pregnancy. Rates of depression were 35.2%, 33.1%, and 30.1% for planned pregnancies and 43.3%, 41.7%, and 35.0% for unplanned pregnancies in the first, second, and third trimesters, respectively.
Correlation of Depression Scores Among Trimesters
The pairwise correlation structure for depression across the different trimesters was 0.45 for first and second trimesters, 0.33 for second and third trimesters, and 0.20 for first and third trimesters, revealing a significant (P = 0.001) correlation between the trimesters. In general, the pairwise correlation appeared to decrease over time as the lag between the measurements increased. This declining correlation satisfied the autoregressive first order, or AR (1), among the correlation structures.
Multivariate Approach and GEE
Significant mean differences were found in the depression scores among the three trimesters by Pillai’s trace statistic (test value = 0.14, P = 0.001). Self-reported pregestational weight was highly correlated with recorded weight of all three trimesters (r = 0.95, P = 0.001; r = 0.94, P = 0.001; r = 0.97, P = 0.001).
The empirical standard error was closest to the model-based standard error with the autoregressive working assumption in comparison to exchangeable one. This implies that an autoregressive working correlation assumption reflects the true structure of the data.
Parameter Estimate of GEE Considering Autoregressive Correlation Structure (N = 418)
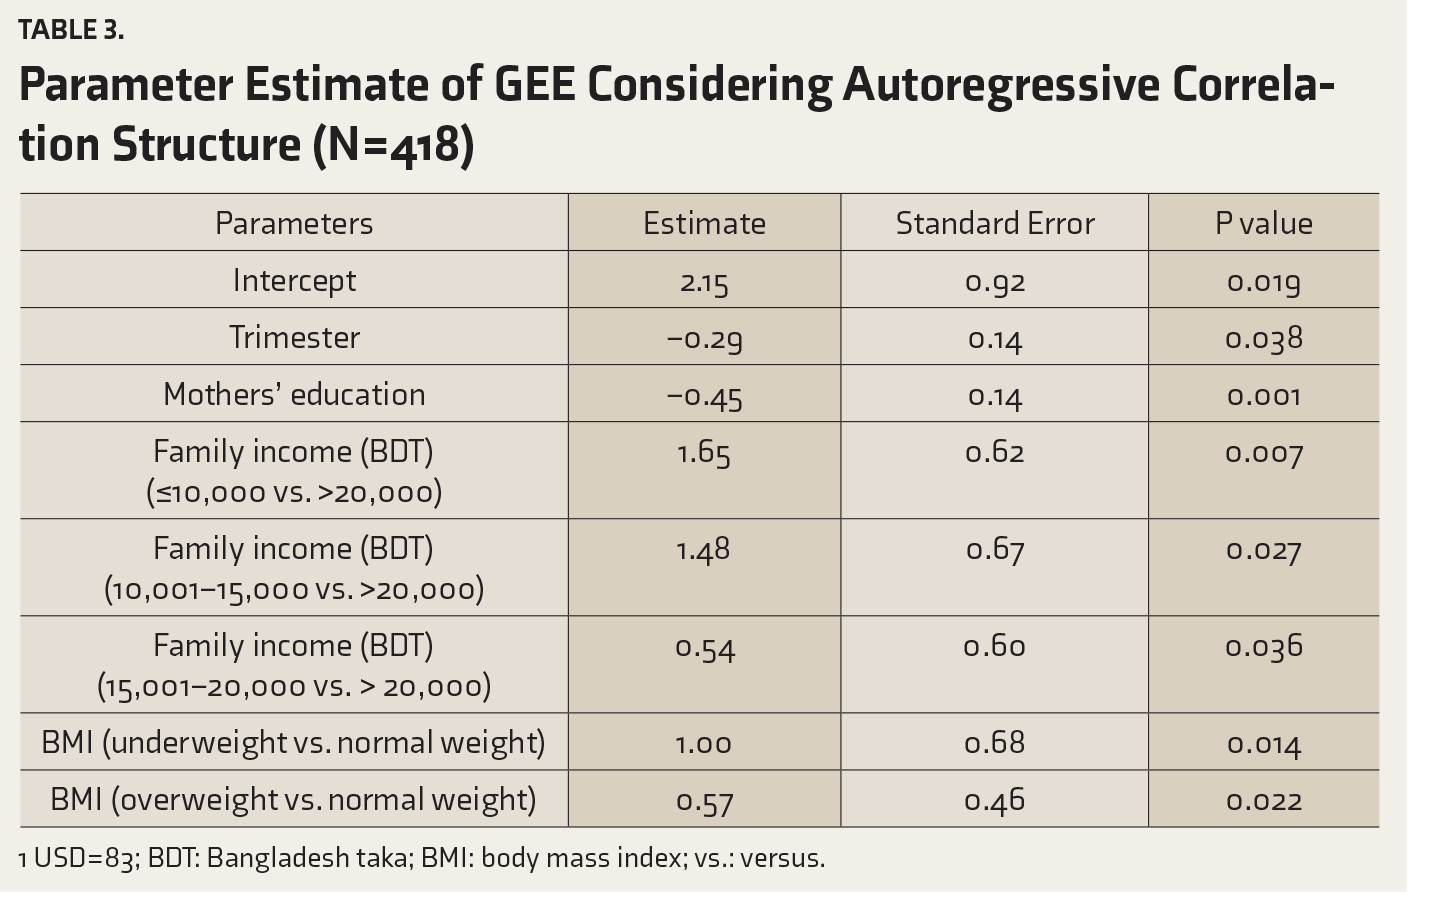
1 USD = 83; BDT: Bangladesh taka; BMI: body mass index; vs.: versus.
Specifically, both trimester and education were inversely related to depression. Regarding income, women with a family income ≤10,000 BDT/month, 10,001–15,000 BDT/month, and ≥15,001–20,000 BDT/month showed ADS higher than women who had income ≥20,000 BDT/month: e1.65 = 5.21, e1.48 = 4.39, and e0.54 = 1.72, respectively. Underweight women had higher odds of ADS than their normal-weight counterparts (e1.00 = 2.72). Women with overweight had higher rates of depressive symptoms than normal-weight women (e0.57 = 1.77).
Discussion
In this study, more than half (58.13%) of the pregnant women were depressed in at least one of the trimesters. This is a higher rate than that of Lee et al. 24 who, in a similar hospital-based longitudinal study, reported that 37.1% of women were depressed. Our higher rate may be due to the lower socioeconomic status of our participants. Previously reported depression rates in low- and middle-income countries have been 20% or more. 25 We found that symptoms of depression decreased throughout pregnancy, which is consistent with previous investigations. 11 The high frequency found at the beginning of this study may have been a result of the changes occurring in women’s bodies and minds to adopt with pregnancy conditions.
However, Bennett et al. 12 found that rates increased from the first to second trimester before decreasing the third trimester. Also, Lima et al. 26 documented that, in mothers in 12 health units in Sao Paulo, Brazil, the rates were higher at the first trimester (27.2%), fell to 21.7% in the second trimester, and again rose to 25.4% in the third trimester. The higher prevalence in the third trimester may be due to the proximity of labor and birth.
Concerning specific countries, slightly lower (27%) rates were found in the first trimester in Soweto, South Africa; however, that study employed a higher cutoff score for depression (i.e., ≥13). 27 The rate of depression was 18% in Hyderabad, Pakistan, during the second trimester, 28 and this lower rate may be due to the higher standards of skilled pregnancy care. The prevalence of depression among women who were 28–32 weeks pregnant was 16.9% in Melbourne, Australia. 29 In the third trimester, the rate of depression was 25% in southern Kahuta, Pakistan, 3 and 13.8% in Sabah, Malaysia. 30 Besides, the present findings agree with those of Gausia et al. 8 who found that in rural areas of Bangladesh, 33% of mothers in their third trimester were depressed. Further, a cross-sectional survey in Turkey revealed that 33.1% of women experienced depression during the third trimester. 31 Nasreen et al. 6 identified a depression rate of 18% among pregnant women in a rural subdistrict of Bangladesh. This lower prevalence may be due to the inclusion of all women in the society and previous maternal support from BRAC. In the current study, two-third of the participants came from single families, which may also have contributed to the increased prevalence of depression.
In our research, trimester, education, family income, and BMI were significantly associated with depression. Education was negatively associated with depression, which supports earlier findings. 8 Further, educated women were more likely to experience symptoms of depression than noneducated women in Malawi 32 and Pakistan; 25 however, no association between education and antenatal depression was reported by Senturk et al., 31 Leigh and Milgrom, 29 or Zeng et al. 33 Education may increase the awareness among mothers, which at least partly minimizes the depression. However, inconsistencies among studies may be due to the differences in the research design or population or possible confounders.
Regarding income, women with a family income ≤10,000 BDT/month (≤120 United States Dollar [USD]), 10,001–15,000 BDT/month (>120–180.7 USD), and 15,001–20,000 BDT/month (>180.7–240.9 USD) were more likely to have ADS than women who had an income >20,000 BDT/month (>240.9 USD). This result agrees with that of Leigh and Milgrom; 29 however, it is opposite to the findings of Molyneaux et al. 10 and contrasts with the findings of Zeng et al. 33 who reported no association between monthly income and depression. A mother with financial hardship may become socially vulnerable and show depressive symptoms.
Women who were underweight or overweight were more likely to have ADS than their normal-weight counterparts. This result supports Molyneaux et al. 34 who found that overweight women had significantly higher odds of depressive symptoms than normal-weight women. However, in another study, no association was found between prepregnancy overweight and antenatal depression. 10 Depressive symptoms and overweight may interplay with each other. Overweight might make the woman more afraid and depressed to be pregnant.
In Bangladesh, the mental health care system suffers from a lack of mental health facilities and skilled staff. We have no specific mental health policy for strengthening the overall mental health system. This study implicates that ADS are pervasive but overlooked problems among the city women. This demands the integration of mental health services with maternal health policy. Preparation for pregnancy among mothers and their family is also a crucial but ignored issue. More focus should be given on proper planning of pregnancy.
Limitations
This study had some limitations. First, the women had to agree to participate; therefore, many depressed mothers may have chosen not to participate, which may have led to an underestimation of the rates. Second, this study was conducted in a clinic, with limited sample size; therefore, the generalizability of the results is limited. Third, self-reported depression might differ from clinically diagnosed depression, and the self-reporting may have led to an overestimation of the rates. An objective assessment should have been done after the initial screening with EPDS. Fourth, other unknown, uncontrolled, extraneous sociodemographic, and physiologic factors may have biased the results. For example, spousal abuse may play a vital role in women’s depression; however, this item had to be excluded from interviews because the participants were not interested in answering such a personal question. Further community-based studies, assessing partner violence, physiological factors, and birth outcomes, should be designed to explore accurate rates, risk factors, and effects of antenatal depression in Bangladesh.
Conclusion
Childbearing women are at risk for depression, especially during the first trimester. This may lead to some unwanted consequences in the growing fetus. Therefore, women should obtain thorough, routine screening during pregnancy, particularly in the first trimester, to identify this morbidity and to identify any need for intervention for an early prevention of adverse pregnancy outcomes. Socioeconomic security and mother’s education are also critical variables. Also, prepregnancy nutritional status should be measured before women plan to get pregnant. Further, physicians need to be familiar with the prevalence and course of these disorders, particularly during pregnancy. Formal childbirth education by respective authorities who utilize proper psychological and nutritional information may help mothers face the challenges of pregnancy and childbirth appropriately.
Footnotes
Declaration of Conflicting Interests
The authors declared no potential conflicts of interest with respect to the research, authorship, and/or publication of this article.
Funding
The authors received no financial support for the research, authorship, and/or publication of this article.