
Abstract
Behavior intervention plans (BIPs) represent an important document in communicating a set of strategies to ameliorate behavior problems of students with disabilities. However, little is known about how in-service teachers implement a range of these strategies. Using a large-scale survey, this study examined teachers’ use of 18 behavior support strategies and statistical predictors of their use. Respondents included 655 certified special educators (pre-K through transition) with at least one student with a BIP. Results indicated that teachers use general strategies, like modeling and consistent routines, most frequently and specialized strategies, like visual schedules or token economies, least frequently. Factor analyses showed that teachers package these strategies into three factors: General Behavior Supports, Promoting Independence Supports, and Specialized Behavior Supports. Some statistical predictors were unique to one factor, while others, like behavioral internship experiences and school supports, were consistent across all factors. In addition, teachers who had caseloads with neither an emotional disturbance (ED) nor autism diagnosis implemented behavior support strategies less frequently. Future research, training, and policy implications are discussed.
Students with interfering behaviors may experience challenges with their teachers, their peers, and within themselves (Cook, 2001; Cook et al., 2000). Such challenging behaviors, which at heart involve difficulties in the student communicating to others (Carr & Durand, 1985), require interventions from teachers and other school personnel. For students with the most intensive needs, schools develop behavior intervention plans (BIPs) to outline a collection of strategies to help students achieve behavior-specific goals. Based on function-based assessments of student behavior, BIPs outline strategies to modify supports, instruction, and the environment. The goal of BIPs is for practitioners to teach students socially acceptable behaviors that serve the same function as the challenging behavior (Dunlap & Carr, 2007). To realize positive benefits, BIPs should utilize best-practice recommendations (Collins & Zirkel, 2017), like evidence-based practices (EBPs).
Although emotional disturbance (ED) and autism are distinct eligibility categories under Individuals with Disabilities Education Act (IDEA) and usually distinct areas of EBP research (e.g., Riden et al., 2022; Steinbrenner et al., 2020), students with these disabilities may share several overlapping characteristics. For example, teachers of students with autism or ED report the presence of behaviors interfering with learning (Chazan, 1994; Sansosti & Sansosti, 2012). These behaviors may be externalizing (e.g., aggression, noncompliance) or internalizing (e.g., anxiety, depression, withdrawal) for both autism (Bauminger et al., 2010) and ED (Forness et al., 2012). These interfering behaviors observed in both eligibility categories may adversely impact students’ social relationships (e.g., Granger et al., 2025; Kasari et al., 2011) and require additional supports to access inclusive instruction (e.g., Lory et al., 2024; Mitchell et al., 2019). Therefore, both populations may receive BIPs providing teachers with similar strategies to address challenging behavior and increase socially acceptable replacement behaviors. Furthermore, variability may exist in these populations because a student may be classified with ED without autism, autism without ED, or both ED and autism.
Since students with ED and/or autism may exhibit behaviors interfering with learning, they may benefit from behavioral supports at both the classroom (e.g., structured environments, clear expectations) and individualized levels (e.g., token economies). At the classroom level, comprehensive behavioral management helps proactively prevent challenging behavior before it occurs, thereby creating contexts that facilitate learning. In addition to these strategies, students with more intensive behavioral needs across these two eligibility categories may benefit from additional strategies, oftentimes in BIPs, that make the challenging behavior inefficient, irrelevant, and ineffective. For example, teachers may teach students a new skill (e.g., social skills training, self-management), change the environment (e.g., using an ecological inventory to identify necessary skills to be successful in school), and increase reinforcement for replacement behaviors instead of challenging behaviors (e.g., token economies). Many of these strategies are not specific to one eligibility category and are often used in tandem with others.
But in order to help students, regardless of their disability label, with challenging behavior in the classroom, teachers of students with BIPs must actually implement these EBPs. In real-life classrooms, however, using such strategies may be incongruent with everyday realities (Berliner, 2002), and it may be difficult to implement such strategies with all “the devilish details involved” (Cook & Odom, 2013, p. 136). For example, given the different IDEA eligibility categories on their caseloads, how do teachers of students with intensive behavior support needs implement EBPs that researchers determined for students with specific disabilities and under certain conditions? When exploring teachers’ everyday implementation of EBPs, we must consider the contexts that might influence such implementation (Toste et al., 2023), such as the facilitators or barriers to implementing EBP strategies that relate to teachers, students, and classrooms and schools (Bauer & Kirchner, 2020; Fixsen et al., 2005). By more closely examining large-scale implementation (i.e., with a large sample size across many states), the field might move toward Lloyd and colleagues’ (2019) call to develop frameworks to guide practitioner decisions regarding behavior support selection and use.
Factors Impacting Implementation
Essential Features
While IDEA provides definitions for different disability eligibility categories, the law does not stipulate how these categories should be partitioned across classrooms and caseloads. Thus, teachers can have “broad caseloads” with students eligible under multiple, different IDEA categories. Since there is a gap between researchers’ identification of EBPs according to disability labels and teachers’ everyday use of behavior strategies to meet the individualized needs of students across their broad caseloads, examining such use could be beneficial to the field. To do so, teachers must have knowledge of the essential features of the intervention, or its or core components, so that teachers can implement strategies flexibly, without compromising desired outcomes (Damschroder et al., 2009; Fixsen et al., 2005). As Harn and colleagues (2013) suggest, teachers use practices “that are empirically validated yet designed flexibly to match various contexts and student populations” (e.g., students with autism and students with emotional behavior disorders; p. 181). Given teachers’ broad caseloads, it is important to examine teachers’ everyday use of behavior EBPs within natural contexts.
It is also important to consider how teachers use different strategies together. To effectively intervene, meta-analysts suggest that teachers should use data to identify student needs and align their practice with evidence-based strategies to address those needs (Ledford et al., 2021; Wong et al., 2015). For example, would the use of modeling occur together with the use of reinforcers? It remains unknown which strategies teachers simultaneously use to address challenging behaviors, and this timing nuance is often obscured in the meta-analytic process (Ledford et al., 2021). Thus, it is important to understand the ways that teachers group diverse strategies to address challenging behavior.
Practitioners Implementing EBPs
An additional potential correlate of implementation involves the teachers themselves. As Fixsen et al. (2009) note, the practitioner constitutes a critical component in making implementation happen. As teachers vary in their comfort and capacity to implement these practices (e.g., Brock et al., 2014; McNeill, 2019; Moore et al., 2017), potential barriers and facilitators to implementing BIP strategies might include teachers’ educational background, previous experiences, and certification status (Fixsen et al., 2009). In one study of 70 teachers (38 special education and 32 general education), Westling (2010) found that teachers’ use of behavior support strategies was related to the quality of preservice training, the quality of in-service training, and a teacher’s status as a special versus general educator. That study, however, did not measure the frequency of students’ challenging behavior, nor did the study specifically examine teachers who taught students with BIPs whose needs would necessitate strategy use. Questions thus remain concerning special educators’ use of strategies to ameliorate challenging behaviors.
The School’s Organizational Structure
Implementation of EBP behavioral strategies may also relate to characteristics of the schools themselves (Fixsen et al., 2009). In exploring EBP implementation under natural conditions, we look specifically at schools’ readiness for implementation defined by leadership support, available resources, and accessibility of knowledge and information (Damschroder et al., 2009). As most teachers may be unprepared to implement positive behavior support and applied behavior analytic strategies (Westling, 2010), supportive school structures are important. To support teachers of students with BIPs, important resources may include educational specialists, Board-Certified Behavior Analysts (BCBAs), special education consultants, and related service providers. Not surprisingly, professional development (and preservice teaching programs) efforts aim to increase the use of these behavior support strategies (Lindström & Roberts, 2022; Myers et al., 2017). But existing studies question special educators’ access to professional development regarding EBPs (Hamrick et al., 2021), as well as the impact of these trainings on the implementation of EBPs (Moore et al., 2022).
This study, then, uses a large-scale survey to describe teachers’ implementation of behavioral EBPs under naturally occurring conditions. We specifically focus on only those teachers who have at least one student with a BIP on their caseloads. This approach ensured teachers were working with at least one student who had a history and/or current presentation of challenging behavior, which would necessitate teachers’ use of more intensive behavior support practices. Thus, we were interested in the adaptability of the behavioral EBPs across their broad caseloads. Specifically, we more closely examined two federal eligibility categories that have core diagnostic criteria related to behavioral and social differences that can adversely impact educational performance: autism and ED 1 (IDEA, 2004). We chose not to examine the Other Health Impairment category because the federal definition comprises a wide range of health concerns beyond behavior (Briesch et al., 2023; IDEA, 2004), and students with attention-deficit/hyperactivity disorder (ADHD) can also be served under the ED category (Forness & Kavale, 2001; Schnoes et al., 2006).
By using a survey of special educators who have one or more students needing intensive behavior strategies, we can glean useful information about strategies these teachers report using. We asked the following research questions:
Method
Participants
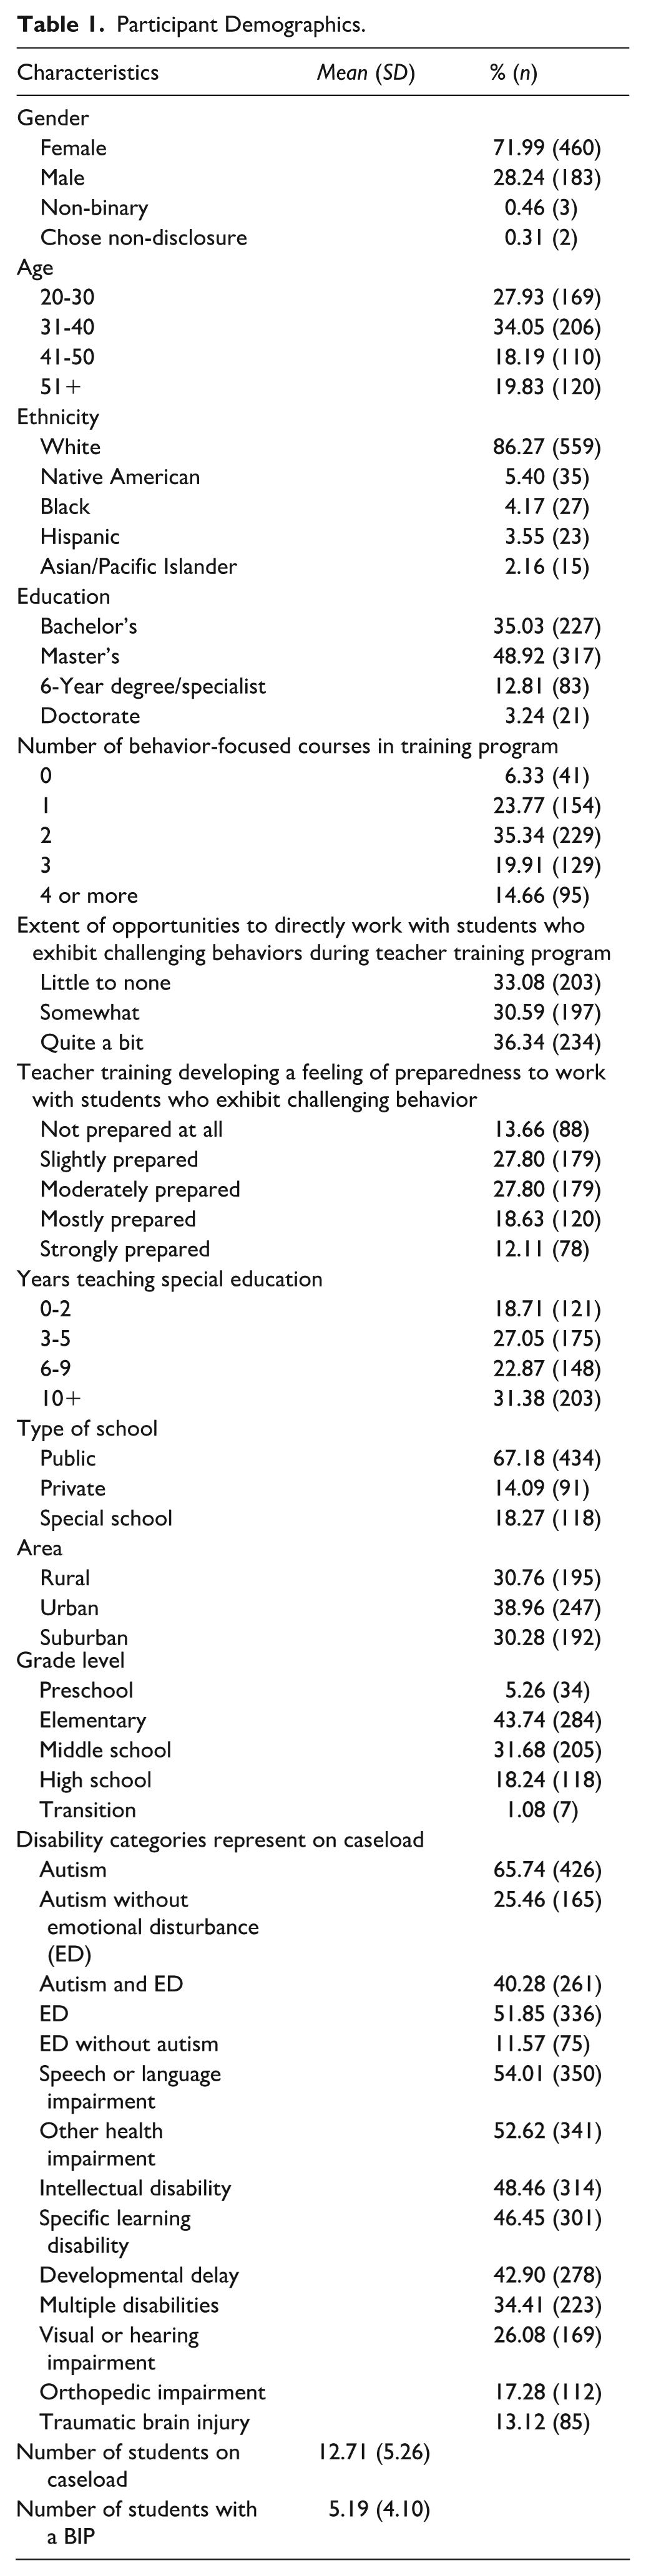
Participants included 655 special education teachers from all 50 U.S. states and Washington, D.C. On average, there were 20.86 respondents per state (SD = 15.78), with a range from 68 (California; 10.38% of sample) to 1 (Nebraska; 0.15%). Most participants were White, female public-school teachers with bachelor’s or master’s degrees, with 75.42% working in either elementary or middle schools. To be included in the study, potential participants needed to be current special education teachers with at least one student with a BIP, ensuring participants would have one or more students necessitating more intensive strategy use. Potential participants were excluded if they were not special educators and/or did not currently work with one or more students with BIPs. All teachers had at least one student with a BIP on their caseload, with a mean of 5.19 (SD = 4.10). Teachers’ caseloads had students with autism and ED (40.28%), autism without ED (25.46%), and ED without autism (11.57%). Participants were roughly evenly distributed across urban (38.96%), rural (30.76%), and suburban (30.28%) areas (see Table 1).
Participant Demographics.
Procedures
With the help of experts in special education and applied behavior analysis, from both high- and low-incidence fields and across different eligibility categories, we developed an anonymous, web-based 114-item survey via an iterative process. It was developed using concepts and literature related to special education and teacher implementation of evidence-based behavioral supports (e.g., Steinbrenner et al., 2020). Experts who provided feedback about initial survey composition included three faculty with doctorate degrees in special education and applied behavior analysis who regularly publish research in their respective fields. The revised survey collected data regarding teachers’ experiences in working with students with challenging behavior. The survey was then piloted with five special education master’s candidates, as well as four doctoral candidates who were BCBAs with classroom teaching experience. After revisions, we submitted the study to the Institutional Review Board (IRB) and, once approved, disseminated the survey. The survey was designed to be completed in less than 30 minutes, and participants were offered a chance to participate in an anonymous card raffle for a $25 gift card. Ten gift cards were given.
Once approved by the IRB, we recruited special educators from across the United States. We first contacted each state’s University Center for Excellence in Developmental Disabilities (UCEDD) to help with recruitment by posting the IRB-approved flyer and recruitment script on the Internet and email listservs. Special education program alumni from a university in the southeastern United States were also invited to participate. Within each U.S. state, we then randomly selected five counties. Research assistants searched for publicly available special educator email addresses to create contact lists for these counties. They used these lists to disseminate IRB-approved flyers and email scripts with the study’s purpose; an explanation of the optional, anonymous $25 gift card raffle; and survey link. Although we were unable to calculate a response rate of actual respondents as opposed to potential respondents (i.e., those eligible special educators who heard about this study), our sample was reasonably similar to American special educators in terms of gender (71.99% female vs. 75.4% of U.S. special educators), slightly more educated (MA = 48.92%; BA = 35.03% vs. MA = 27%; BA = 66% in the United States), and slightly younger (20–40-year age group = 61.98% vs. 41% of the United States), compared to percentages derived from U.S. Census data (Zippia, n.d.).
We managed data collection via REDCap, a secure web-based platform (Harris et al., 2009). Data were collected from October 15, 2021, through December 15, 2021. When data collection was completed, we exported all records to Statistical Package for the Social Sciences (SPSS), Version 26 for analyses.
Survey Instrument
In addition to collecting data regarding participants’ use of behavioral support strategies, we also collected information about such potential correlates as participant demographics, school and class information, and students’ behaviors and educational diagnoses. Response formats included multiple choice, select all that apply, Likert scale, open-ended response, and text entry.
Outcome Variable
Behavior Support Strategies’ Implementation
Participants were asked to rate the extent to which they used 18 behavioral support strategies when working with students with challenging behaviors. Participants rated the extent of their use on a 5-point Likert scale: (1) Never; (2) Rarely; (3) Sometimes; (4) Often; and (5) Always. We chose these support strategies as they have been determined as EBPs by Steinbrenner and colleagues (2020). However, since Steinbrenner and colleagues report umbrella practices encompassing specific strategies, we asked about teachers’ use of specific strategies; this approach aided in teachers’ comprehension of the strategies themselves. For example, teachers might not understand elements of antecedent-based interventions, but they would understand clear expectations, consistent routines, and proximity. To support accurate responding, strategy definitions were provided so participants could differentiate between similar strategies. For example, consistent routines were defined as “routine is predictable for students,” while clear expectations were “expectations are visually present, frequently repeated.”
We further selected EBPs that may also be relevant to additional students with challenging behavior (Riden et al., 2022; Sutherland et al., 2019). For example, Riden and colleagues (2022) identified several similar strategies, including token economies, video modeling, peer-mediated interventions, and function-assessment–based interventions. Likewise, Sutherland and colleagues (2019) identified as EBPs consistent routines, reinforcement, modeling, and social skills instruction. Furthermore, they defined practices like active supervision to include verbal or gestural prompting and proximity. Such practices are often included in school-wide positive behavior support systems, which are approaches used with students with emotional behavior disorders (Lewis et al., 2010). After extensive discussion with our advisors, a team of faculty, BCBAs, and practicing SPED teachers, we landed on the 18 EBPs chosen for this study.
Identifying Correlates
To identify correlates, we collected data across several domains: (a) the participant, (b) the school and classroom, and (c) the students.
Participants
In addition to answering basic demographic items (e.g., gender, age, ethnicity, degree), participants responded about their teacher preparation program, including their number of courses or internships supporting challenging behaviors, and their overall preparedness to teach students with challenging behaviors; their special education teaching experiences; years in their current position; and their number of students with BIPs (see Table 1).
School and Classroom
Data were collected regarding the participant’s school and classroom across eight items, including its U.S. state, school type (i.e., public, private, or special), and area (i.e., urban, suburban, or rural). In addition, we examined the frequency of school-level supports. Some commonly available school supports included behavior-related professional development trainings; paraprofessional assistance for challenging behaviors; administration; and education specialists or other service providers. We recoded these variables as occurring never, annually, quarterly, monthly, and weekly-or-daily (five categories). But as BCBA supports are not regularly available to schools (Burke & Sandman, 2015), BCBA access was coded as occurring never-or-rarely, monthly, weekly, or daily (four categories).
Students
Teachers reported the ages and specific disability eligibility categories of their students (i.e., autism, developmental delay, intellectual disabilities, etc.). For a list of 11 disability types and an “other” option, teachers checked which eligibility categories were represented on their caseload (and could check all that apply). Given the problematic associations with “emotional disturbance” (Mattison, 2015), emotional and behavioral disorder (EBD) and ED were combined as one response “Emotional behavior disorder, emotional disturbance” category and will be referred to as the ED eligibility category. To compare the use of teacher behavior support strategies by eligibility categories, we created four variables: caseloads with students with autism and ED; with autism, but without ED; with ED, but without autism; and with neither autism nor ED.
We also collected data regarding the overall frequency of challenging behaviors on teachers’ caseloads. Our BCBA consultants identified the seven most often-occurring challenging behaviors as: self-injurious behavior; physical aggression; property destruction; verbal aggression/threats; elopement; tantrums; and noncompliance (Simó-Pinatella et al., 2019). Teachers were asked to report, “Across all students on your caseload, how often do you experience the following behaviors?” For each challenging behavior, participants rated how frequently students on their caseload exhibited the behavior on a 6-point Likert scale: (1) Never; (2) Quarterly; (3) Monthly; (4) Weekly; (5) Daily; and (6) Hourly. Although respondents also rated challenging behavior’s duration (from 1—less than a minute to 5—more than 30 minutes) and intensity (3 points, mild to severe), the levels of frequency, duration, and intensity were highly correlated. Furthermore, duration and intensity data occur only when teachers reported the occurrence of a behavior. We therefore entered in the regression models only the total combined frequency of the seven challenging behaviors (alpha for seven frequencies = .88).
Analyses
Data Preparation
Prior to conducting analyses, the data were screened for errors (i.e., values outside the range of possible values for each variable) by examining frequencies for each variable. Descriptive statistics were then conducted to describe the sample characteristics, assess normality, and address specific research questions. When the data did not meet the assumption of normality, non-parametric alternatives were employed (e.g., Welch’s test in place of a one-way analysis of variance (ANOVA) when Levene’s test indicated violation of the equal variances assumption).
Analyses by Research Question
Analyses related to the study’s four research questions. First, to describe the participants’ use of the 18 behavior support strategies, means and standard deviations were calculated for each rating of use from “1—Never” to “5—Always.” We then calculated a Grand Mean (i.e., average of the 18 individual items’ means) for the 18 behavior support strategies; as opposed to post-hoc analyses separately comparing each behavior against one another, we were thus able to examine the extent to which each item deviated from the group’s overall average (Silverstein, 1975). A one-way repeated measures ANOVA determined whether items showed different mean values, with comparisons to the Grand Mean identifying which strategies teachers used most and least frequently.
Our second research question targeted the extent to which the 18 behavior support strategies occurred together. To condense these scaled variables into smaller, interrelated, and more manageable “chunks” for data analyses (Pallant, 2020), we performed an exploratory factor analysis on the behavior support strategies using a principal component analysis with varimax rotation. Only those survey items loading at an absolute value of .41 or greater were considered as contributing to a particular factor (see Supplementary Materials). Based on these findings, we then computed mean item scores for the strategies included in each factor. Then, using the calculated individual participant’s factor means, we addressed missing data. When a participant (n = 47; 7.25%) had one missing variable from the 18 supports, we imputed that participant’s corresponding factor average. We excluded the five participants with 4 to 18 missing behavior support variables.
In the third research question, we identified correlates of behavior support strategies using separate univariate analyses. For each factor (i.e., outcome variable), one-way ANOVAs were used for variables with three or more groups and t-tests for two groups. If the Levene’s test showed a violation of homogeneity, we used Welch’s statistic. For correlates that were continuous, in univariate analyses, we displayed quartile means and standard deviations (see Supplementary Materials), although data were left continuous in subsequent regressions.
To determine statistical predictors for each of the three factors, we then ran three separate regressions (one for each behavior support factor). For each regression, the same identified correlates were entered into the models. If correlates showed significance at p < .01 for any of the three factors, they were examined for multicollinearity. If correlates showed significance at p > .40, then consideration was given to eliminating variables that seemed redundant (Cohen et al., 2003). For example, respondent’s age, years in special education, years in the current district, and years in current position were all correlated, but for model parsimony, only years in their current position was retained for regressions.
Finally, a one-way between-groups multivariate analysis of variance (MANOVA) was performed to investigate possible differences in teacher behavior support strategies across eligibility categories represented on teachers’ caseloads. We examined caseloads comprised of ED without autism, autism without ED, both autism and ED, and neither autism nor ED. Given that our independent variable had four groups, follow-up one-way ANOVAs were conducted to examine differences in the behavior strategies that were significant in the MANOVA.
Results
Teachers’ Use of Behavior Support Strategies
Overall, teachers’ use of these 18 strategies was rated as 3.74 (SD = .61) or between “sometimes” and “often.” Compared across the 18 behavior support strategies, significant differences emerged, F(17, 586) = 33.34, p < .001. Teachers more frequently used clear expectations, consistent routines, prompting, proximity, and reinforcers; teachers less frequently used ecological inventories, first-then boards, peer supports, self-management, and social stories (all ps < .001 greater or lower vs. Grand Mean, respectively). Stated differently, the percentages of teachers reporting “often” or “always” using the following “high-use” strategies were proximity (79.79%), prompting (78.98%), consistent routines (77.62%), reinforcers (73.14%), and clear expectations (72.78%). In contrast, fewer teachers often or always used such “low-use” strategies as self-management (38.42%), social stories (44.81%), peer supports (49.54%), first-then boards (50.62%), and ecological inventories (55.07%). All five high-use strategies were used significantly more often than the five low-use strategies, McNemar’s ps < .001.
Commonalities Across Behavior Support Strategies
To examine co-occurrences of behavior support strategies, we conducted an exploratory factor analysis. Using a principal component analysis with varimax rotation, three factors emerged, cumulatively accounting for 54.78% of the variance. The first factor related to General Supports (Eigenvalue = 6.35; 35.26% of the variance). This factor was comprised of eight items: proximity, clear expectations, consistent routines, prompting, modeling, reinforcers, data collection, and communication with parents or caregivers. The second factor, accounting for 12.13% of variance, related to Promoting Independence Supports (Eigenvalue = 2.18). This factor was comprised of six strategies: peer supports, self-management, ecological inventories, social skills training, communication training, and task analysis. Accounting for 7.39% of the variance, the third factor related to Specialized Supports (Eigenvalue = 1.33) and involved four strategies: first-then boards, visual schedules, social stories, and token economies (see Supplementary Materials). Comparing across factors, teachers differed in their use of the three factors, F (2, 645) = 144.18, p < .001, with post-hoc analyses revealing that teachers more often used General Behavior Supports (M = 4.01, SD = .68) compared to both Promoting Independence Supports (M = 3.49, SD = .72) and Specialized Behavior Supports (M = 3.49, SD = .86), ps < .001.
Statistical Predictors of Behavior Support Strategies
Using the univariate analyses to identify correlates to each of the three behavior support factors, we identified 21 correlates (see Supplemental Materials). Six correlates related to the respondent: degree, number of students with BIPs, number of students on their caseloads, years in their current position and placement, and extent of experience with challenging behavior during internships. The sixth correlate was gender. Due to small cell sizes (non-binary [N = 3] and prefer not to disclose [N = 2]), we grouped gender according to female and other. Three correlates related to the school: paraprofessional support frequency, professional development frequency, administrative support frequency, educational specialist support frequency, BCBA access, and grade level. Student correlates included their frequency of challenging behaviors and several eligibility categories, including dummy codes (yes-no) for diagnoses of autism, intellectual disability, multiple disabilities, orthopedic impairment, emotional disturbance, speech or language impairment, specific learning disability, and developmental delay. All 21 variables were then entered into each of the three regressions to determine significant, independent predictors.
General Supports
The regression examining independent statistical predictors of teachers’ use of General Supports was significant, F(21, 572) = 18.64, p < .001, accounting for 38.45% of the variance. Although nine variables emerged as independent predictors, the most striking predictor for General Supports related to the frequency of student challenging behaviors. As students’ frequency of challenging behavior increased, teachers’ use of General Supports consistently increased from 3.67 (SD = .68) in the first quartile to 4.49 (SD = .45) in the fourth quartile, a large effect size (Cohen’s d = 1.42). In addition, those teachers having one or more autistic students had a greater mean use of General Supports (M = 4.24, SD = .57) compared to those who did not (M = 3.56, SD = .63); similarly, teachers of students with a specific learning disability (M = 4.25, SD = .57) showed greater use of General Supports compared to those who did not (M = 3.81, SD = .70) (see Table 2).
Multilinear Regression Analyses for Three Domains of Behavior Support Strategies (N = 596).
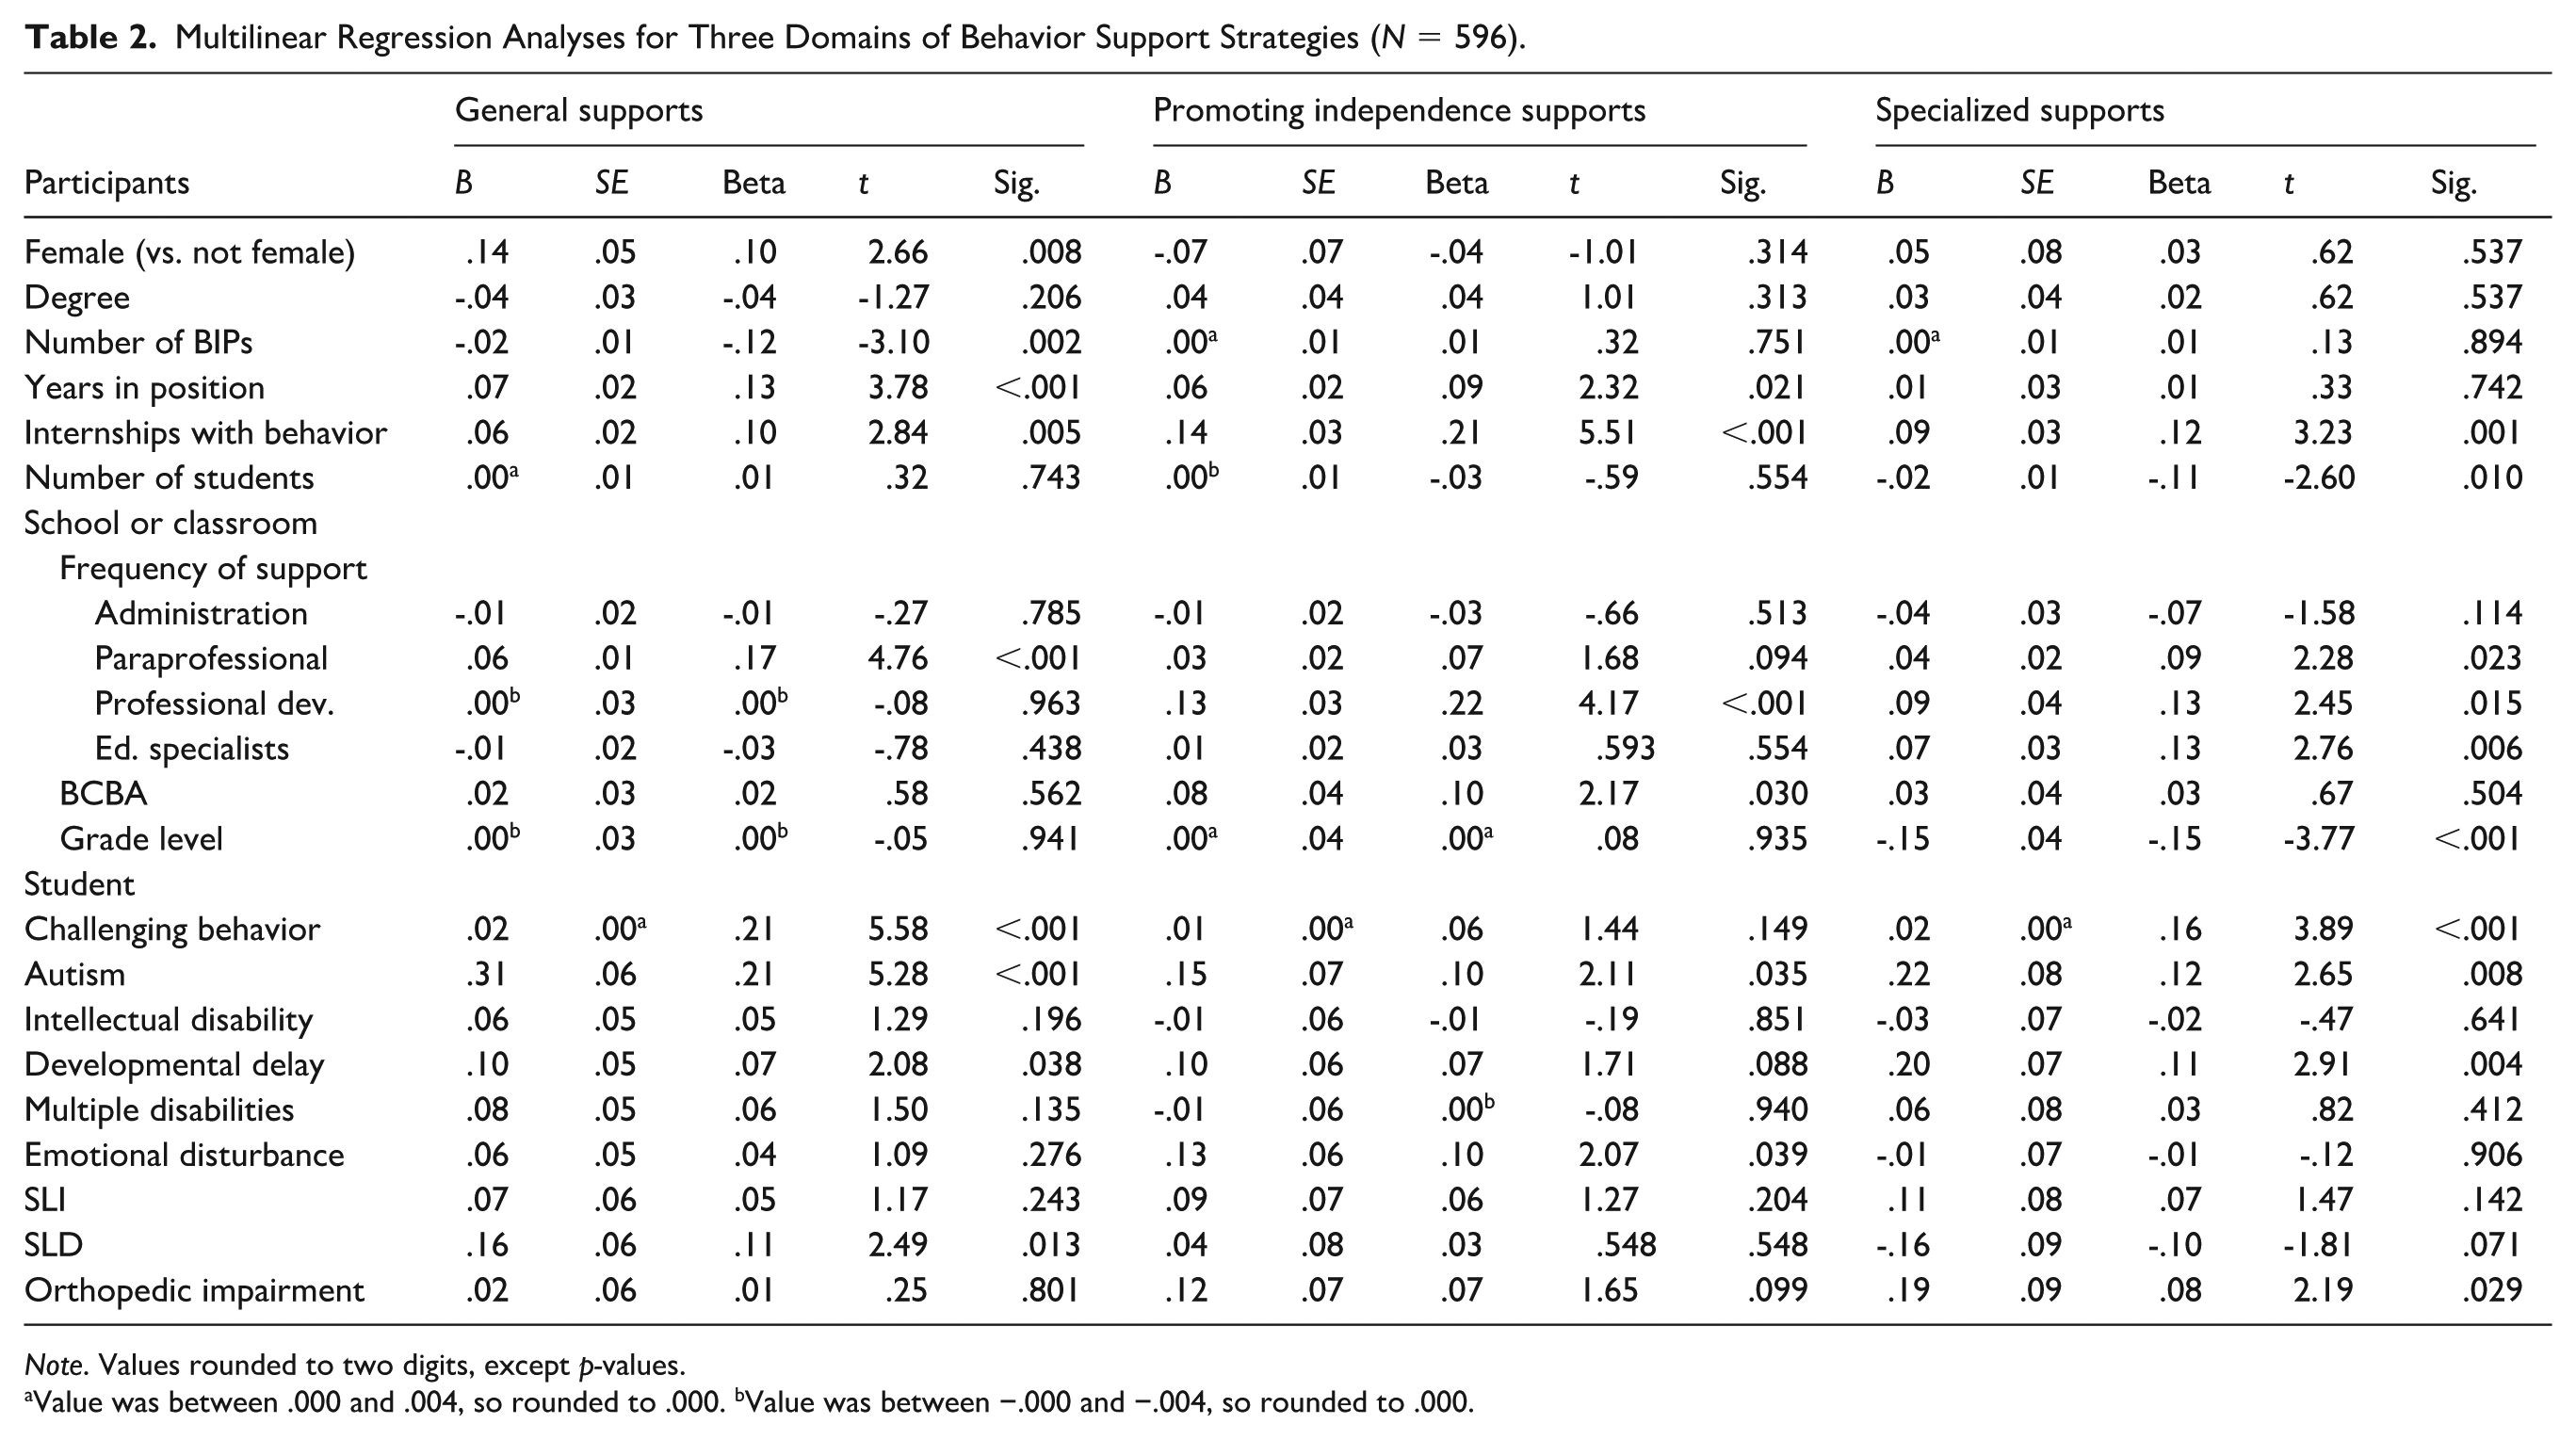
Note. Values rounded to two digits, except p-values.
Value was between .000 and .004, so rounded to .000. bValue was between −.000 and −.004, so rounded to .000.
Several significant predictors also related to teacher and school characteristics. Specifically, as teachers were in their current position longer, their mean use of General Supports consistently increased from 3.83 (SD = .77) for teachers with less than a year to 4.20 (SD = .62) for teachers with 10 or more years. Similarly, teachers who reported “a great deal” of behavior internship experiences more frequently used General Supports (M = 4.34, SD = .50; means of teachers with less experience ranged from 3.80 to 4.12). Conversely, as teachers had caseloads with more students with BIPs, they used these strategies less frequently. Teachers with seven or more students with BIPs rated their use of these strategies, on average, at 3.72 (SD = .68) compared to those with 1 or 2 students with BIPs at 4.23 (SD = .54), a large-sized effect (d = .83). Finally, of the commonly available school supports, only paraprofessional frequency was found to be a predictor. Teachers who had weekly or daily access to paraprofessionals had an average use of General Supports of 4.30 (SD = .55), whereas those with less frequent access (monthly to never) showed less frequent use of such strategies (M = 3.84, SD = .69).
Promoting Independence Supports
The regression to determine the frequency of teachers’ promoting Independence Support Strategies was also significant, F(21, 572) = 7.17, p < .001, accounting for 17.94% of the variance. Six independent statistical predictors emerged, with the strongest predictors related to frequency of professional development, access to BCBAs, and teachers having had behavior-focused internships. Access to BCBAs had a large effect (Cohen’s d = .90) on teachers’ use of Promoting Independence Supports, with average factor scores strongly increasing from “rarely” (M = 3.38, SD = .75) to “daily” (M = 3.99, SD = .61). In addition, as teachers’ access to professional development increased, their mean use of Promoting Independence Supports consistently increased, from 3.26 (SD = .84) for teachers with the lowest access to 4.00 (SD = .66) for teachers with the greatest access (Cohen’s d = 1.02).
Associations were also found with characteristics of teachers and their training. In addition to teachers with more years in their current positions reported greater implementation of Promoting Independence Supports, those with greater amounts of prior behavior internship experience showed greater use of such supports, with consistent increases from 3.18 (SD = .86) for teachers with no experience to 3.78 (SD = .75) for teachers with a “great deal” of behavior internship experience (Cohen’s d = .73). Although significant, student variables were less strongly associated with use of Promoting Independence Supports. Teachers who had (vs. did not have) one or more students with ED (M = 3.56 vs. M = 3.43) or autism (M = 3.53 vs. M = 3.42) were more likely to employ these strategies.
Associations were not found with the number of students, number of students with BIPs, nor reported challenging behavior. For all non-significant associations, see Table 2.
Specialized Supports
Accounting for 23.51% of the variance, the regression on the use of teachers’ specialized support strategies was also significant, F(21, 572) = 9.68, p < .001. Ten independent predictors emerged. As teachers’ access to paraprofessionals, professional development, and educational specialists increased, their use of Specialized Supports consistently increased. The only significant predictors related to the respondent were the extent of internships with behavior. Teachers who reported “quite a bit” (M = 3.71, SD = .75) of behavior internship experience used more Specialized Supports compared to teachers who had no internship experience (M = 3.25, SD = 1.07), with a medium magnitude of effect (Cohen’s d = .50). The number of students on a respondent’s caseload decreased teachers’ use of Specialized Supports. Specifically, teachers with 18 or more students on their caseload provided lower levels of Specialized Supports (M = 3.23, SD = .96) compared to any other group (means from 3.43 to 3.66), with magnitude of effects ranging from small to medium (Cohen’s ds from .23 to .50). The grade level was also related to Specialized Supports, as did the student’s frequency of challenging behavior and the presence (vs. absence) of autism, developmental delay, orthopedic impairment, and specific learning disability. Associations were not found with the frequency of BCBA support or the number of students with BIPs on their caseloads. For all non-significant associations, see Table 2.
Eligibility Category Differences in Behavior Strategy Use
The MANOVA to examine behavior strategy use across eligibility categories on teachers’ caseloads was significant, F(54, 1887) = 5.85, p < .001; partial η2 = .14. When results for individual teacher use of behavior support strategies were considered separately (with a Bonferroni adjusted alpha level of .01), significant differences were noted for all 11 behavior support strategies from the MANOVA, including prompting, proximity, reinforcers, data collection, clear expectations, frequent communication, modeling, routines, task analysis, and visual schedules. Those teachers who had neither students with autism nor ED on their caseloads utilized evidence-based behavior support strategies the least. Conversely, teachers used these behavior strategies the most when they had students with both eligibility categories (i.e., autism + ED) or only students with autism (see Supplementary Materials).
Discussion
Although behavioral strategies have been shown to be successful in working with students with challenging behaviors, this exploratory study is among the first to measure teachers’ everyday use of such supports within a large, heterogeneous sample. We examined how often teachers of students with BIPs use a range of behavioral strategies, how the strategies are used together, the potential predictors and identified statistical predictors of strategy use, and whether teachers with caseloads of students with and without ED and autism used differential amounts of specific strategies. Our study produced four major findings, each with research and practical implications.
Our first finding described how teachers of students with BIPs supported intensive behavioral needs across their broad caseloads by implementing evidence-based strategies. Teachers used the greatest levels of proximity, clear expectations, consistent routines, prompting, and reinforcers, with mean ratings for each between “often” and “always.” Given these strategies’ compatibility with schools’ widespread use of universal positive behavior support strategies (Carr et al., 2002; Greenhalgh et al., 2004; Horner et al., 2005), this finding is important when developing future implementation frameworks (Fixsen et al., 2005). In contrast, more intense behavior supports—self-management, peer supports, first-then boards, and social stories—were used minimally. In fact, sizeable percentages of teachers of students with BIPs used these strategies at lower levels. Comparing to greater-used strategies, teachers may view these more intensive strategies as more complex to implement or lacking more beneficial outcomes, thus hindering their everyday use (Greenhalgh et al., 2004). The relatively greater use of reinforcement and prompting, along with lower use of peer supports and self-management strategies, aligned with previous research (Brock et al., 2020; Morin et al., 2021). Social stories were ranked higher in this existing research. Of note, many of these behavioral strategies are highly individualized and appropriate for certain conditions at certain times. Therefore, teachers’ use of strategies may vary depending on individual student needs, especially if the teacher is reporting use on just one student.
Our second finding explored the co-occurrence of these 18 strategies in teachers’ everyday practice. Teachers’ strategy use related to three distinct factors: supports that were general, promoted independence, and specialized. The first factor, General Supports, included proximity, clear expectations, consistent routines, prompting, modeling, reinforcers, data collection, and communication with caregivers or parents. The second, Promoting Independence Supports, included peer supports, self-management, ecological inventories, social skills training, communication training, and task analysis, while the third, Specialized Supports, included first-then boards, visual schedules, social stories, and token economies. More generally, these three factors highlight that teachers employ these 18 behavioral supports in three distinct groupings.
Third, we identified statistical predictors of all three factors relating to the respondents themselves and the organizational structure of their schools. Consistent with other research (Lukins et al., 2023) and highlighting the critical role of the practitioner (Fixsen et al., 2009), teachers who had experienced more behavior internships during their training years showed increased use of all three types of supports. Essentially, teachers’ presumed knowledge predicted their greater use of evidence-based supports (Morin et al., 2021). The use of behavior supports was also related to aspects of the school supports that teachers received, although different supports related to different factors. Specifically, as paraprofessional support, professional development, and support from educational specialists each increased in frequency, teacher’s use of Specialized Supports also increased. Those teachers afforded higher amounts of professional development also consistently increased in Promoting Independence and Specialized Supports.
Finally, teachers implemented behavioral strategies with students of different eligibility categories (Fixsen et al., 2005; Harn et al., 2013). Most notably, those teachers of students who did not have either ED or autism showed the lowest levels of several supports (e.g., clear expectations, consistent routines, reinforcers, proximity). But as these strategies are also considered preventative for challenging behavior via school-wide positive behavior support systems (Horner et al., 2010), using such strategies only “sometimes” is troubling. Moreover, teachers of the group with ED (but without autism) never emerged as highest on any behaviors, even as many of these behaviors have been identified as evidence-based for students with ED (e.g., token economy, peer supports; see Riden et al., 2022, p. 261).
Implications
Research
This exploratory study establishes that teachers use behavior supports in three main groupings and that certain statistical predictors link to each behavior support factor. We now need to tie this knowledge to the settings (where) and the reasons (why) teachers use each group of behavior support strategies. Such drilling down will help provide the foundations for both pre- and in-service professional development efforts.
Second, across all three factors, teachers increased in their use of behavior support strategies with more frequent access to different school supports. Since we also know that teachers of students with BIPs more frequently use General Supports than the other two factors, future research might focus on identifying strategies or supports that increase teachers’ frequencies of the other two types of support. In addition, researchers should target the quality and context of school supports. By providing more effective and efficient school supports, such studies might facilitate teachers’ increased use of behavior supports at minimal cost to districts.
Third, and consistent with prior research dealing with caseload size (Dewey et al., 2017), those teachers with the greatest numbers of students used lower levels of Specialized Behavior Supports. Similarly, teachers with greater numbers of students with BIPs, and thus, with more intensive behavioral needs on their broad caseloads, used General Supports at lower levels. At the same time, the lack of difference between the number of students with BIPs on a caseload and teachers’ use of Specialized Supports is concerning. While we cannot determine an ideal level of behavior support implementation, these collective findings raise concerns about teacher quality and caseload assignments. As such, these findings raise important questions about teachers’ workload manageability relating to strategy use (proximally) and students’ behavioral outcomes (distally). We also need to learn more about how administrators determine teacher caseloads.
Finally, while the frequency of BCBA support was a significant correlate in all three univariate analyses, greater amounts of BCBA help independently predicted only Promoting Independence Supports. Granted, within the neurodiverse community there exists an ongoing debate about how—or even whether—behavior analysis can be ethically incorporated into intervention efforts (Schuck et al., 2021). But when supporting students with challenging behavior, the special educators in our study described needing additional supports beyond those commonly available in schools. When ethically and efficiently administered, BCBAs provide supports and services that allow students with disabilities to be educated in general education alongside their peers (Anderson & Carr, 2021; IDEA, 2004). Future research should target the support teachers receive from BCBAs, including their helpfulness, teachers’ perceptions of BCBAs, and the contexts under which teachers find BCBA support beneficial to improving student outcomes.
Practice
We must also look to practitioners to individualize their use of behavioral support strategies. To meet student needs while reducing challenging behaviors, meta-analysts suggest that teachers select evidence-based behavior support strategies based on student data and need (Ledford et al., 2021; Wong et al., 2015). From this study, teachers considered separately these three groups of strategies. Districts should ensure that they are placing students with BIPs on caseloads of teachers who skillfully implement all three behavior support factors. Our findings, however, suggest that this may not be happening. Instead, special educators mainly provided general strategies that do not amount to the specially designed instruction that these students require (IDEA, 2004). Moreover, the teachers who theoretically should be most adept at using behavior support strategies—those with the greatest numbers of students with BIPs necessitating more intensive supports—used behavior support the least. To ensure teachers implement all factors of support, districts should target supports to teachers who have high numbers of students with BIPs on their caseloads. These supports might also guide teachers in selecting the most parsimonious solutions and making complex strategies more manageable. Our findings also support calls for including BCBA services as a needed policy innovation (Burke & Sandman, 2015) and reducing caseload size to ensure that instruction is both individualized and specially designed.
Limitations
This study had several limitations. First, the survey did not have a calculable response rate, even as our sample was similar to national figures on several demographic characteristics. Also, the final response option for survey items related to caseload size and number of students with BIPs was “20 or more,” which might have impacted granularity compared to more specific numerical choices. We also did not provide numerical qualifiers for each response option in the survey Likert scale for our outcome variable; therefore, we cannot determine the exact number of times in which teachers used each strategy. Furthermore, we cannot determine an ideal level of strategy implementation without additional research, especially since our predictors are not causal and results are not generalizable beyond our sample. In addition, given the self-report data, teachers might be biased in reporting students’ challenging behaviors and in how teachers themselves utilize behavioral support strategies. Although more research is needed around the separate issues of identifiability and anonymity in web-based survey research (Gnambs & Kaspar, 2017), not controlling for socially desirable responding is a limitation. Similarly, our list of behavior supports was also weighted toward supports used for students with autism (our largest group of students receiving BIPs), although several ED strategies were also included. Furthermore, we combined ED and EBD as one response option for teachers in the selection of eligibility categories on their caseloads. Finally, we did not collect data regarding the school setting in which respondents most frequently delivered behavior supports for students with BIPs, nor did we explore behavior support use differences between states; both constitute important considerations for future studies.
Summary
This study examined how special educators use behavior support strategies with students with challenging behavior “in typical school systems under naturally existing conditions” (Odom et al., 2005, p. 146). Surveying a large group of those special educators who teach one or more students with BIPs, the study examined the extent of teachers’ use of behavior supports, how individual supports go together, the predictors of each group of supports, and how often teachers utilize specific strategies for students with autism, emotional disorders, both, and neither. Only by understanding how special education teachers implement a range of behavior support strategies will policymakers, implementation researchers, and districts help teachers to improve outcomes for students with challenging behavior.
Supplemental Material
sj-docx-1-bhd-10.1177_01987429261416531 – Supplemental material for Special Educators’ Use of Behavior Support Strategies for Students With Behavior Intervention Plans
Supplemental material, sj-docx-1-bhd-10.1177_01987429261416531 for Special Educators’ Use of Behavior Support Strategies for Students With Behavior Intervention Plans by Elizabeth Burnett Rossi, Brittney L. Goscicki, Aunna M. Colter and Robert M. Hodapp in Behavioral Disorders
Supplemental Material
sj-docx-2-bhd-10.1177_01987429261416531 – Supplemental material for Special Educators’ Use of Behavior Support Strategies for Students With Behavior Intervention Plans
Supplemental material, sj-docx-2-bhd-10.1177_01987429261416531 for Special Educators’ Use of Behavior Support Strategies for Students With Behavior Intervention Plans by Elizabeth Burnett Rossi, Brittney L. Goscicki, Aunna M. Colter and Robert M. Hodapp in Behavioral Disorders
Supplemental Material
sj-docx-3-bhd-10.1177_01987429261416531 – Supplemental material for Special Educators’ Use of Behavior Support Strategies for Students With Behavior Intervention Plans
Supplemental material, sj-docx-3-bhd-10.1177_01987429261416531 for Special Educators’ Use of Behavior Support Strategies for Students With Behavior Intervention Plans by Elizabeth Burnett Rossi, Brittney L. Goscicki, Aunna M. Colter and Robert M. Hodapp in Behavioral Disorders
Supplemental Material
sj-docx-4-bhd-10.1177_01987429261416531 – Supplemental material for Special Educators’ Use of Behavior Support Strategies for Students With Behavior Intervention Plans
Supplemental material, sj-docx-4-bhd-10.1177_01987429261416531 for Special Educators’ Use of Behavior Support Strategies for Students With Behavior Intervention Plans by Elizabeth Burnett Rossi, Brittney L. Goscicki, Aunna M. Colter and Robert M. Hodapp in Behavioral Disorders
Footnotes
Funding
The first author was funded by the U.S. Department of Education Office of Special Education Programs (Grant# H325D170005).
Declaration of Conflicting Interests
The authors declared no potential conflicts of interest with respect to the research, authorship, and/or publication of this article.
Supplemental Material
Supplemental material is available on the webpage with the online version of the article.
Notes
References
Supplementary Material
Please find the following supplemental material available below.
For Open Access articles published under a Creative Commons License, all supplemental material carries the same license as the article it is associated with.
For non-Open Access articles published, all supplemental material carries a non-exclusive license, and permission requests for re-use of supplemental material or any part of supplemental material shall be sent directly to the copyright owner as specified in the copyright notice associated with the article.