
Abstract
This study uses data from the US Department of State and other sources to examine inequalities in the use of visas to regulate population mobility to the United States. The results showed that between 2006 and 2021, visitor visa rejection rates were higher for applications submitted in the Global South than in the Global North. For example, the top 15 countries with the lowest rejection rates were mostly wealthy states in the Middle East and Europe. On the contrary, two-thirds of the top 15 countries with the highest rejection rates were in Africa. Results from mixed-effects regression models indicated that visa rejection rates in Africa were more than double those in Europe. These differences were not explained by disparities in economic, demographic, and social factors. Sensitivity tests further suggested that regional disparities were not explained by higher visa overstay rates in non-European than in European countries. Additionally, the results showed that there were differential patterns of responses to visa approvals across regions. In Africa, increases in visa approvals were followed by increases in visa rejections the following year. However, increases in visa approvals elsewhere, especially in Europe, were followed by decreases in visa rejections. Overall, the study demonstrates that visas regulate migration in ways that make it more difficult for people in the Global South than the Global North to enjoy the benefits associated with travelling to the United States. Moreover, they suggest that this disparity cannot be explained by country-level variations in overstay rates and other socioeconomic factors.
Keywords
Introduction
The use of visas to regulate population mobility has had significant implications for research on international migration (Czaika and De Haas 2017; Jansen and Piermartini 2009; Rosenberg 2022). Apart from determining access to opportunities for legal travel between countries (Jacobs 2022; Neumayer 2010; Niezna 2022; Whyte 2008), visas also affect international trade as well as the flow of goods and services (Czaika and Neumayer 2017; Umana-Dajud 2019). Most studies on the role of visas in regulating migration flows focus on migration to Western countries (e.g., Czaika and Hobolth 2016; Kovak and Lessem 2020). However, visas are widely used in other countries to determine who is eligible to enter their territories (e.g., Bedford and Lidgard 2019; Hirsch 2021; Rosenberg 2022). The central mechanism that determines how visas are used to achieve this goal is the decision on whether to approve or reject visa applications. While several previous studies have examined the dynamics of this decision (e.g., Kuzey, Karaman and Akman 2019; Tanelorn and Anderson 2019), there is limited research assessing the extent to which they create systematic patterns of inequality.
One issue that is yet to be comprehensively addressed in the existing literature is the question of whether there are notable trends in visa rejection decisions that create disparities in access to migration to the West. A few studies have shown that there are indeed country-level inequalities in access to visas needed for travel to the West (Mau 2010; Neumayer 2006; Satzewich 2014), as well as inequalities in the social characteristics of visa applicants (Jasso 1988; Satzewich 2015). However, there is limited research examining whether these differences are part of a broader pattern that has remained stable across time. A central part of this gap in the literature is the lack of clarity on the specific ways in which visitor visa rejection decisions create differential patterns of opportunity to migrate to the United States. Several studies have examined similar visa inequalities by quantitatively identifying countries and regions that are most affected by consular decisions on Green Cards, H1-B visas, and other types of US admissions mechanisms (Dombe, Rewale and Swain 2020; Rissing and Castilla 2014). However, limited attention has been given to the quantitative assessment of the corresponding dynamics of visitor visa application decisions.
Apart from these issues, larger theoretical questions remain about the extent to which the factors that determine the outcomes of visa applications vary based on differences in visa type (e.g., visas for employment, visitors, students) and where visa applications are submitted. While some visas have unique requirements such as the need to have a sponsor, a common attribute of most decisions on visa applications is that they are made in the origin-country of visa applicants. However, few studies have examined whether the macrolevel processes that contribute to regional disparities in visa rejection rates for travel to the United States are similar to those associated with visa-rejections for travel to other world regions (e.g., Cangönül and Temel 2025; Cangönül and Yildiz 2024).
To address these gaps in the literature, this study uses data from the US Department of State and other sources to examine inequalities in the rejection of US visitor visa applications over the past two decades. In the process, it achieves three specific objectives. First, it empirically describes overall trends in the rejection rate for visitor visa applications submitted at US embassies and consulates around the world, to assess the extent to which these visas have become more or less accessible to potential migrants. Second, it investigates whether there are inequalities in the visa rejection trends observed among countries in five major world regions. Third, the study examines the demographic, economic, and social determinants of these inequalities. In the process, it assesses the extent to which these inequalities are influenced by factors such as changes in population size and gross domestic product (GDP) per capita, in ways that shape access to opportunities for travel to the United States from other countries. As such, the study uniquely contributes to the literature by evaluating whether regional disparities in visitor visa rejection rates for travel to the United States are similar to those associated with travel to other industrial societies (e.g., the Schengen region), while uniquely assessing the determinants of visitor visa rejection rates to the former.
Background: Critical Perspectives on Visa Acquisition Policies
Many legal experts and migration scholars have described the visa acquisition process as a systemic barrier to global equality (Mau 2010; Sharma 2015; Wilson and Bigs 2016). In fact, some scholars have argued that visa rejections are extra-territorial measures used to reduce migration flows or curb unwanted migration (Czaika and Hobolth 2016; Gammeltoft-Hansen 2011). Compared to territorial measures that aim to limit the rights and privileges of migrants after their arrival (Hatton 2011; Neumayer 2004), extra-territorial measures aim to restrict the ability of prospective migrants to pursue the rights and privileges available at their desired destination countries. Discourses on visa acquisition processes have also been contentious and rife with fiery debates. On one side of these debates are those who push ideas about safeguarding civic and ethnic identity in light of conservative fears of an invasion of immigrants (Czaika and Hobolth 2016). On the other side are the arguments of those who call for more liberal visa regimes that secure and promote the free international movement of persons (e.g., Kukathas 2012).
The most critical perspectives on visa rejections, however, are based on studies that look beyond the US context. Much of this literature argues that countries in the Global North cooperate and act to restrict migration from the Global South (Nicolosi 2020; Smith 2022). Smith (2022), for example, refers to these restrictions as global regimes of closure, and posits that these migration controls and policies ultimately lead to global visa inequality. Such inequalities have emerged from the policies of nation states such as Canada and countries in Europe that target candidates who they consider to be desirable to their national profiles and exclude those they deem undesirable.
Other scholars have argued that such visa policies are directly and indirectly associated with racial discrimination (e.g., Villazor and Johnson 2019). However, this perspective is seldomly used in empirical studies because overt and explicitly racist migration policies are no longer used extensively. Recent evidence, however, suggests that prejudicial selection criteria that discriminate on the basis of race and national origin persist through covert, colorblind, and seemingly neutral measures (Hainmueller and Hangartner 2013; Rosenberg 2023). Rosenberg (2023) has referred to these measures as indirect discrimination and describes them as being either unconditional or conditional. The former refers to policies that disproportionately affect marginalized groups and the latter refers to those that create patterns of inequality that remain after controlling for mitigating factors that attribute any observed disproportionalities to random chance.
Another set of scholars underscores the significance of government adjudicators, who may approve or reject applicants based on their own personal biases– leading to the systemic institutionalization of racist and subjective personal prejudices (Wildes 1989; Tanelorn and Anderson 2019). These prejudices may contribute to regional disparities in visa acquisitions (Gilboy 1991), as scholars have observed in refugee status admissions (Schrag, Schoenholtz and Ramji-Nogales 2009) and labor certification approvals (Rissing and Castilla 2014; Dombe, Rewale and Swain 2020). Moreover, a key contributor to regionally disparate visa acquisition processes is the significant gap in visa costs between Global North and South countries, a paradox Recchi et al. (2021) describe as the “global visa cost divide.” The literature suggests that foreign nationals from the Global South are generally more likely to pay higher visa costs, both in relative and absolute terms, compared to those from the Global North.
Visitor Visas and the US Visa Regime
Global inequities in visa acquisitions can further be understood by distinguishing between what scholars refer to as permanent and temporary mobility aspirations (Bell and Ward 2000; Mau 2010). The former describes the aspirations of foreign nationals who intend to live or work indefinitely in the destination country and achieve citizenship rights (Massey and Malone 2002), while the latter includes those who aspire to engage in temporary travel to a destination country. Both types of mobility are subject to restrictive controls in the international visa regime (Bell and Ward 2000; Mau 2010), though temporary mobility aspirations warrant special interrogation (Foreman and Monger 2015) because they are typically seen as a catalyst for eventual migration intentions (Koslowski 2011; Mau 2010).
In most Western countries, temporary mobility is regulated using “visitor visas.” These visas impose stringent requirements on temporary travelers that include restrictions on their duration of stay and on permissible activities (Neumayer 2006; Neumayer 2010). These requirements are particularly notable to the US context, where foreign nationals are generally eligible to apply for two primary visa types (Lopez 2012). First, those who intend to secure Lawful Permanent Resident (LPR) status can apply for immigrant-issued visas (green cards) through family or employment sponsorships, immigrant diversity lotteries, and/or asylee or refugee status. Second, applicants can pursue nonimmigrant-issued visas that correspond with temporary visitations or short-term residencies tied to business or tourism (Lee 2018; Lopez 2012; Monger and Matthews 2011). The US visitor visa, in particular, is a type of nonimmigrant visa that is subject to fixed and limited time constraints (Foreman and Monger 2015). It includes three distinct categories: the B-1 visa for temporary business travel, the B-2 visa for tourism, and the B-1/B-2 visa for individuals engaging in both activities (Tanelorn and Anderson 2019). 1
Tanelorn and Anderson's (2019) describe three of the most common reasons for US visitor visa denials. First, under provision 212(a) of the 1952 Immigration Nationality Act (INA), visa applicants can be rejected for various social life circumstances. Among them are applicants’ criminal background, their health status, being perceived as a security risk (e.g., suspicion of terrorist activity), and the likelihood that they will become a public charge; that is, a financial burden to the United States (Office of the Law Revision Counsel 2024). Second, under provision 221(g) of the INA of 1952, visa applications can be rejected if there are concerns that the submission is invalid, or if applicants fail to submit the documents required for visa acquisition.
Third, provision 214(b) of the INA of 1952 requires visa applicants to demonstrate to consular officers that they have strong ties to their home countries that will increase their likelihood of returning home after their visits to the United States. These ties can be established by providing evidence of family ties and assets (e.g., land) in their home countries that point to their willingness to return (Brown 2011). Significantly, however, provision 214(b) of the INA of 1952 also leaves all discretion for the determination of whether visa applications should be approved or rejected to the consular officer conducting the interviews. As some scholars argue, this provision allows consular officers to make decisions based on their own personal biases; in other words, as Tanerlorn and Anderson put it, “because I said so” (Tanelorn and Anderson 2019, 278).
Visitor visa applicants, like other nonimmigrant visa applicants, are particularly vulnerable to rejection because they are usually presumed to be prospective immigrants in accordance with section 214(b) of the 1952 INA (Lopez 2012). This means that nonimmigrant visa applicants must overcome what legal scholars refer to as the “presumption of immigrant intent” or risk their application being denied. Overcoming this presumption is particularly critical for visitor visa applicants for at least two reasons. For one, some nonimmigrant visas allow for applicants to later adjust their status to permanent residency (Hazen and Alberts 2006; Jacobs 2022; Obinna and Bacong 2024), while B visitor visas generally require that applicants do not have “dual intent” upon applying. Second, B visitor applicants must demonstrate to consular officers that they have strong ties to their home countries that point to their “willingness to return” (Brown 2011). Some scholars interpret this requirement as the primary reason for visitor visa rejections. Tanelorn and Anderson (2019) for instance find that between 58 and 80 percent of all nonimmigrant visa rejections between 2000 and 2016 were made at the discretion of consular officers (Tanelorn and Anderson 2019), that is, based on provision 214(b). These estimates are notable because visitor visas account for approximately 70 percent of all nonimmigrant-issued visas in the United States. (Batalova, Blizzard and Bolter 2019).
Despite decades of research based on critical perspectives in the US visitor visa acquisition process, empirical research on these perspectives is relatively scarce. There is, however, some anecdotal evidence to suggest that regional disparities in visitor visa rejections are shaped by discrimination. Existing literature indicates that visitor visa applicants may experience stricter vetting due to concerns that they may overstay their visa (Mau 2010; Neumayer 2006) or will misuse it to engage in activities beyond the scope of its intended purpose. This concern of visitor visa abuse is often tied to applicants from the Global South, who are deemed to be less desirable (Gordon 1998; Recchi et al. 2021). For instance, in 2024, the Department of Homeland Security (2024) reported that overstay rates were especially high for B visitor visa holders from Sub-Saharan Africa and Southeast Asia in the previous fiscal year.
Rosenberg's (2023) longitudinal analysis of visa waivers offers additional insights on these issues. His study concludes that countries in the Global South are less likely to obtain visa waivers than those in the Global North, and that these disparities mostly affected applicants from Sub-Saharan Africa and other low-income countries. While the study did not specifically examine US visitor visas, it is important to note that many nonimmigrant visitors can obtain B visa privileges through the Visitor Waiver Program (VWP), which allows nationals from 42 participating countries to forgo the standard application process and instead secure 90-day visitation rights via the Electronic System for Travel Authorization (ESTA) (Lopez 2012). Only travelers from Visa Waiver Program (VWP) countries who plan to stay in the United States for more than 90 days (but no more than 180 days) are required to apply for a traditional B visitor visa. It is important to note that VWP participating countries are mostly in the Global North (Johnson 2023), where applicants are less likely to be rejected compared to traditional B visa applicants (Vaughan and Huennekens 2018). Thus, foreign nationals from nonparticipating VWP countries, especially those in the Global South, face relatively more obstacles than their counterparts from VWP countries.
Theoretical Perspectives
Although previous studies provide insight into how measurable (e.g., economic assets) and non-measurable (e.g., discretion) factors affect visa rejection decisions, very little is known about how these decisions are themselves influenced by the characteristics of countries. These country-level characteristics are important because they capture the attributes of the national contexts in which these decisions are taken. For example, economic differences between countries imply that visa applicants in wealthy countries would have a greater likelihood of having their visa applications approved compared to those in poor countries. In part, this is because the former will be less likely to be viewed as a potential burden to the United States than the latter. For these reasons, it is important to develop a general theoretical understanding of the various factors that could explain how country-level differences could contribute to inequalities in visa rejection rates.
Some of the best explanations for these differences can be derived from neoclassical microeconomic theory of migration (Rooth and Saarela 2007; Todaro 1969). As the theory suggests, other things being equal, the probability of migrating to countries such as the United States will be higher in low-income than in high-income countries. Indeed, owing to liquidity constraints in low-income countries, most migrants tend to come from middle-income countries. From this perspective, US consular officers should be expected to see visitor visa applicants in the former as individuals who would be less willing to return to their home countries after their visits. As a result, such individuals would have a higher probability of having their visa applications rejected. However, this decision could also result from other factors. For example, applicants in low-income countries will find it more difficult to demonstrate possession of economic ties (e.g., real estate) that are among the main indicators used to assess the willingness of visa applicants to return to their home countries. As a result, they will face a high risk of having their visa applications rejected under provision 214(b) of the INA of 1952. Additionally, given the fact that applicants in low-income countries have more limited access to economic resources compared to those in high-income countries, the former will be at a greater risk of being rejected under provision 212(a), which excludes potential public charges from entering the United States. The socioeconomic divide between high- and low-income countries is further exacerbated by disparate visa costs that generally prove more costly for those from the Global South (Recchi et al. 2021). This implies that the link between limited economic resources and a visa rejection may impose greater economic and emotional impact on those from low-income countries.
Another set of theoretical influences that could influence the outcome of visa applications are those associated with demographic pressures on migration (e.g., Dao et al. 2021; Hatton and Williamson 2003). These pressures are mostly underscored by the positive association that exists between population size and the demand for migration (Hatton and Williamson 2003). This demand is expected to be high in countries with large numbers of youth, given the fact that the probability of migration is highest in the youthful ages (Rogers et al. 2010). At the same time, an increased demand for migration could likely lead to an expansion of strategies used to regulate this demand. For example, many US embassies abroad have increased the waiting times before visa applicants are interviewed by consular officers, as a way of regulating increases in the demand for visas (Jainchill 2023). Scholars further suggest that US consular offices could use another strategy to regulate this demand, which is to unofficially increase the number of visa applications they reject (Tanelorn and Anderson 2019). Accordingly, if visa rejections are used to regulate the growing demand for migration, visa rejection rates will be higher in countries where the demographic pressures on migration are most concentrated than in countries where the corresponding pressures are weaker.
Several other influences could also potentially affect visa rejection trends across countries. For example, countries with high levels of fertility could have low visa rejection rates because visa applicants in these countries may find it easier to demonstrate that they have family ties in their home countries, which will reduce their risk of visa rejection under provision 214(b) of the INA of 1952. Immigration lawyers and advocates typically advise visa applicants to submit copies of their children's birth certificates with their application materials to demonstrate these family ties (Moodie 2025; U.S. Immigration Law Counsel 2025).
Additionally, from the perspective of World Systems theory (Massey et al. 1998), foreign direct investment (FDI) inflows could negatively affect visa rejection rates because they reflect the penetration of global capitalism into countries in the form of the expansion of foreign business interests, which could increase the demand for business travel. Such investments could have specific implications for foreign firms that require their workers to be familiar with the production routines of their headquarters, which would necessitate travel abroad (Cherif and Hasanov 2014). While this mechanism is unlikely to affect tourist visas needed for travel, it suggests that employees of US firms located in other countries would need B visas for business travel to accomplish this purpose (Teich 2014). As a result, visa rejection rates are expected to decrease as FDI inflows increase since this increase could be positively associated with the demand for business travel among employees of US firms abroad. Previous studies also indicate that urbanization rates can positively affect international migration, because urban populations have more access to information and resources needed to facilitate migration compared to rural populations (Konadu-Agyemang and Takyi 2006). For example, urban applicants may have better access to information than rural applicants on the correct documents needed to submit with their visa applications. As a result, visa rejection rates are expected to decline as urbanization rates increase.
In summary, while previous studies provide useful insights into the dynamics of US visitor visa rejection processes, they do not sufficiently assess the social and economic contexts of the countries in which these decisions are made. Many previous studies further provide diverse and sometimes contrary expectations about what would emerge from the analysis of visa rejection rates. For example, some suggest that inequalities in these rates could primarily result from the discretion given to consular officers to make decisions (e.g., Tanelorn and Anderson 2019). However, others suggest that these inequalities could result from differences in the characteristics of countries, which could theoretically put visa applicants in developing countries at a disadvantage (e.g., Smith 2022).
This study adds to this discourse by examining three research questions. First, what do we know about the relationship between trends in US visitor visa rejection rates and the social, economic, and demographic characteristics of the countries of visa applicants? Second, are there systematic regional patterns of inequality in visitor visa rejection trends that continue to persist after accounting for variations in country-level characteristics? Third, are there inequalities in the ways in which social, economic, and demographic factors affect visitor visa rejection trends among regions?
Data and Methods
These questions are examined using a unique database constructed with data from the U.S. Department of State (USDS) and other sources for the period between 2006 and 2021. Each year, the USDS publishes a Report of the Visa Office that contains visa-related information collected by US embassies and consulates around the world. This study uses these reports to capture annual information on the main outcome of interest—adjusted visa rejection rates for visitor visas (the USDS only provides visa rejection information for all B visas combined). Adjusted visa rejection rates are important because they account for visa applications that were initially rejected on first contact with a US consular officer, but were subsequently issued after an appeal. Although these rates are only reported for B visas used for tourist and business travel, they have been used in previous studies examining how visas are used to regulate migration to the United States (e.g., Ramani and Rutkofsky 2021; Tanelorn and Anderson 2019).
Data on visa rejection rates are supplemented with country-level socioeconomic indicators derived from other sources. For example, the World Bank's World Development Indicators (WDI) database (World Bank 2024a) is used for data on population size, population between ages 15 and 29, percentage urban, and GDP per capita. WDI information on FDI flows is used to capture the infusion of foreign investment into national economies, while information on total fertility rates (TFRs) is used to assess the importance of average family sizes within countries. Other data sources include Macrotrends (2024), which provides information on trends in US GDP per capita, and the United Nations Department of Economic and Social Affairs (2024), which provides information used to identify the major regions used in the analysis. These regions are used to capture groups of countries with broadly similar historical, cultural, and geographic characteristics. Additionally, the study uses the actual numbers of all B visas approved by US embassies and consulates found in the annual Reports of the Visa Office. Overall, 4.2 percent of data available in the final dataset had missing values. Because this is below the 5 percent threshold sometimes used to justify multiple imputation (Myrtveit, Stensrud and Olsson 2001), missingness was addressed using listwise deletion.
Using information from multiple data sources requires making a few compromises because not all countries found in the USDS's Reports of the Visa Office are found in other databases. Accordingly, the analysis excludes a number of mostly small nation states and territories (e.g., Micronesia, Andora, Monaco, Taiwan, Vatican City) because they are either not found in the WDI database or lack significant information on specific data series (e.g., FDI net inflows) used in the analysis. Despite these exclusions, the final dataset contains information for 187 2 countries and territories.
Given the panel structure of the final dataset, the analysis of trends in US visitor visa rejection rates is conducted using panel data regression methods. These regression models are estimated in two stages.
In the first stage, regional inequalities in visa rejection trends are examined using mixed-effects regression models that account for the clustering of countries within regions. The basic form of these estimation models is as follows:

Sensitivity tests are subsequently used to examine whether regional differences in visa rejection rates are explained by visa overstay rates. These tests are conducted using data on recent trends in visa overstay rates from the US Department of Homeland Security (2015 to 2021). The tests are also conducted separately from the analysis described in equation 1 because the data on visa overstay rates have several limitations. First, they are only available for the period between 2014–2020. Second, overstay rates that are specific to B visas are only available for non-Visa Waiver countries. As a result, the sensitivity tests only use data for about 35 percent of the observations found in the original sample.
The second stage of the analysis examines visa rejection trends and their determinants using fixed-effects models that account for unobserved country-level characteristics that are constant across time. The basic form of these regression models is as follows.

Results
Summary characteristics of the sample used in the analysis are presented in Table 1. Tables A1 and A2, respectively, present a correlation matrix of these variables and the summary distribution showing log transformations of the variables used in the analysis. Furthermore, Table A3 presents the distribution of the respective summary characteristics of the sample for the major regions used in the study.
Descriptive Characteristics of the Sample Used in the Analysis.
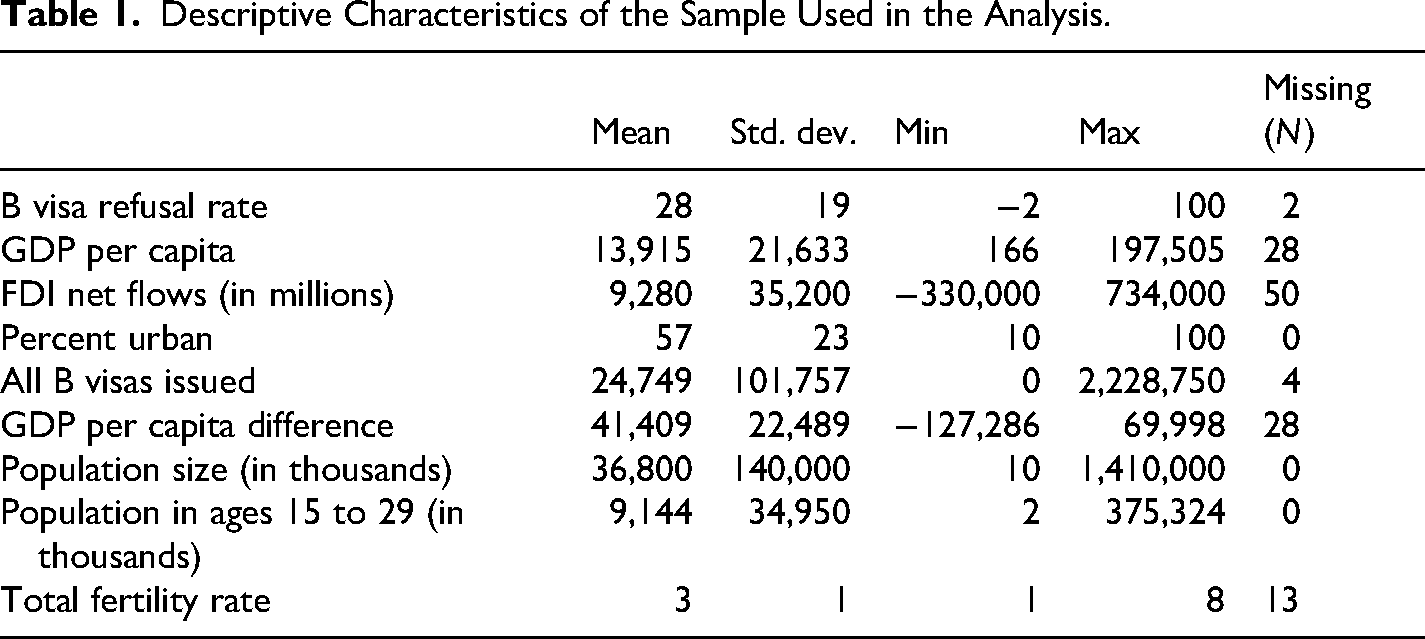
In Table 1, the summary statistics indicate that, on average, 28 percent of all visitor visas applications submitted at US embassies and consulates in the countries used in the analysis were rejected. The minimum and maximum values of the overall visa rejection rate show vast differences in the experiences of countries. For example, the highest adjusted rejection rate in the sample is 100 percent while the lowest is −2 percent. Negative visa rates such as the latter are peculiar and were observed in only two countries—Luxembourg in 2006 and Kuwait in 2009. These negative rejection rates reflect the fact that some rejections that occurred at first contact between applicants and US consular officers during a prior year can be reversed on appeal in a subsequent year (U.S. Department of State 2006). Table 1 also shows that, on average, 24,749 B visas were actually issued for the country-years found in the observation period. However, the actual range of the number of these visas issued extends from 0 to more than 2.2 million.
Additionally, Table 1 indicates that there is considerable variation in the economic and demographic characteristics of the countries in the sample. For example, GDP per capita estimates ranged from $166 to approximately $180,000. In terms of demographic characteristics, the sample includes observations from countries/territories with populations that were as small as 10,000 people and as large as 1.4 billion people. Similarly wide variations are observed in the other indicators, including FDI net inflows, percentage of population living in urban areas, the number of people in the youthful ages, and the TFRs.
Mean annual estimates of the trend of the adjusted visa rejection rate for all countries in the sample during the period between 2006 and 2021 are presented in Figure 1. In general, the average annual trend for all countries was above 25 percent per year for much of the observation period. The only exception to this was the systematic increase in the visa rejection trend to close to 35 percent in the years leading up to 2020, which was around the height of the COVID-19 pandemic. However, the trend quickly returned to its pre-pandemic level of about 25 percent in 2021.
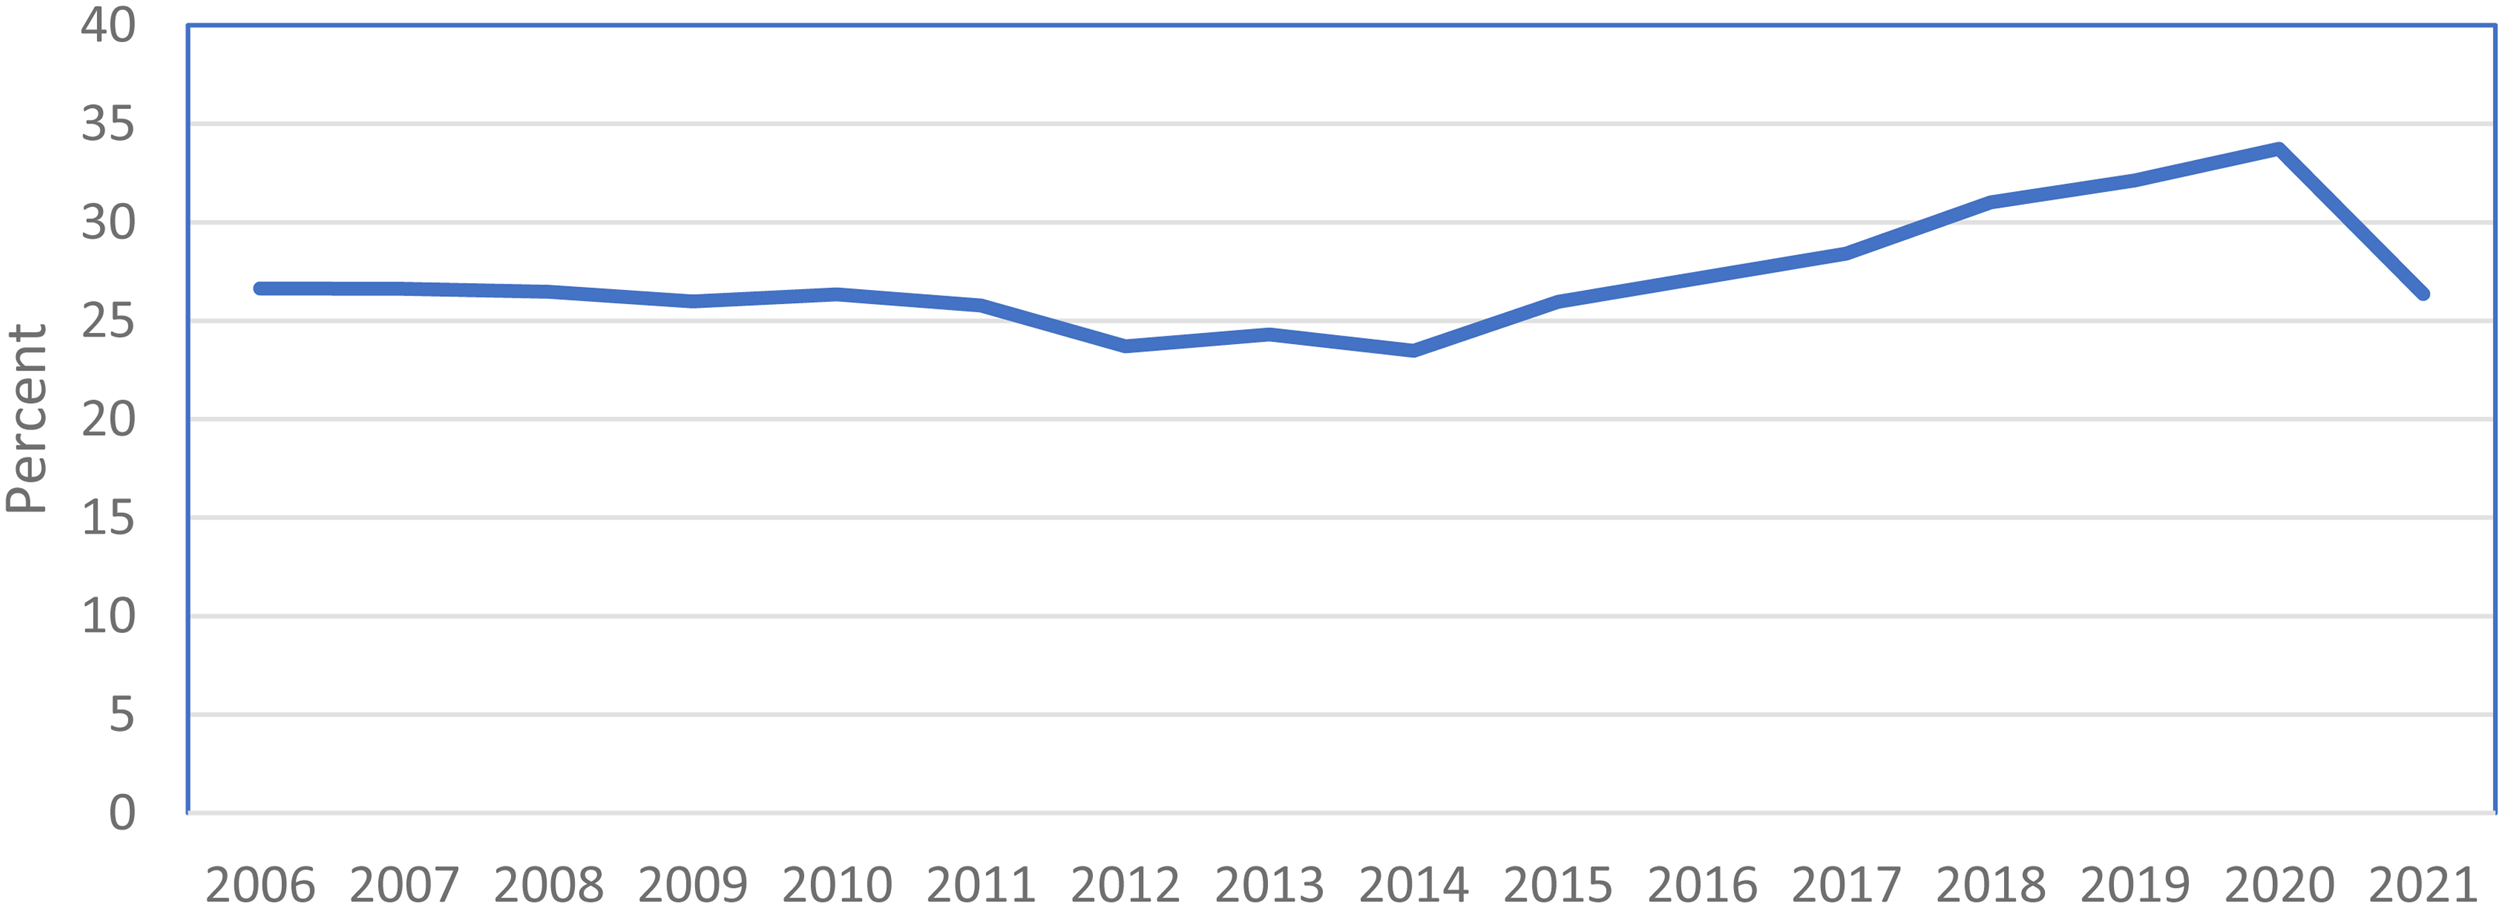
Average adjusted visitor visa rejection rates for all countries between 2006 and 2021.
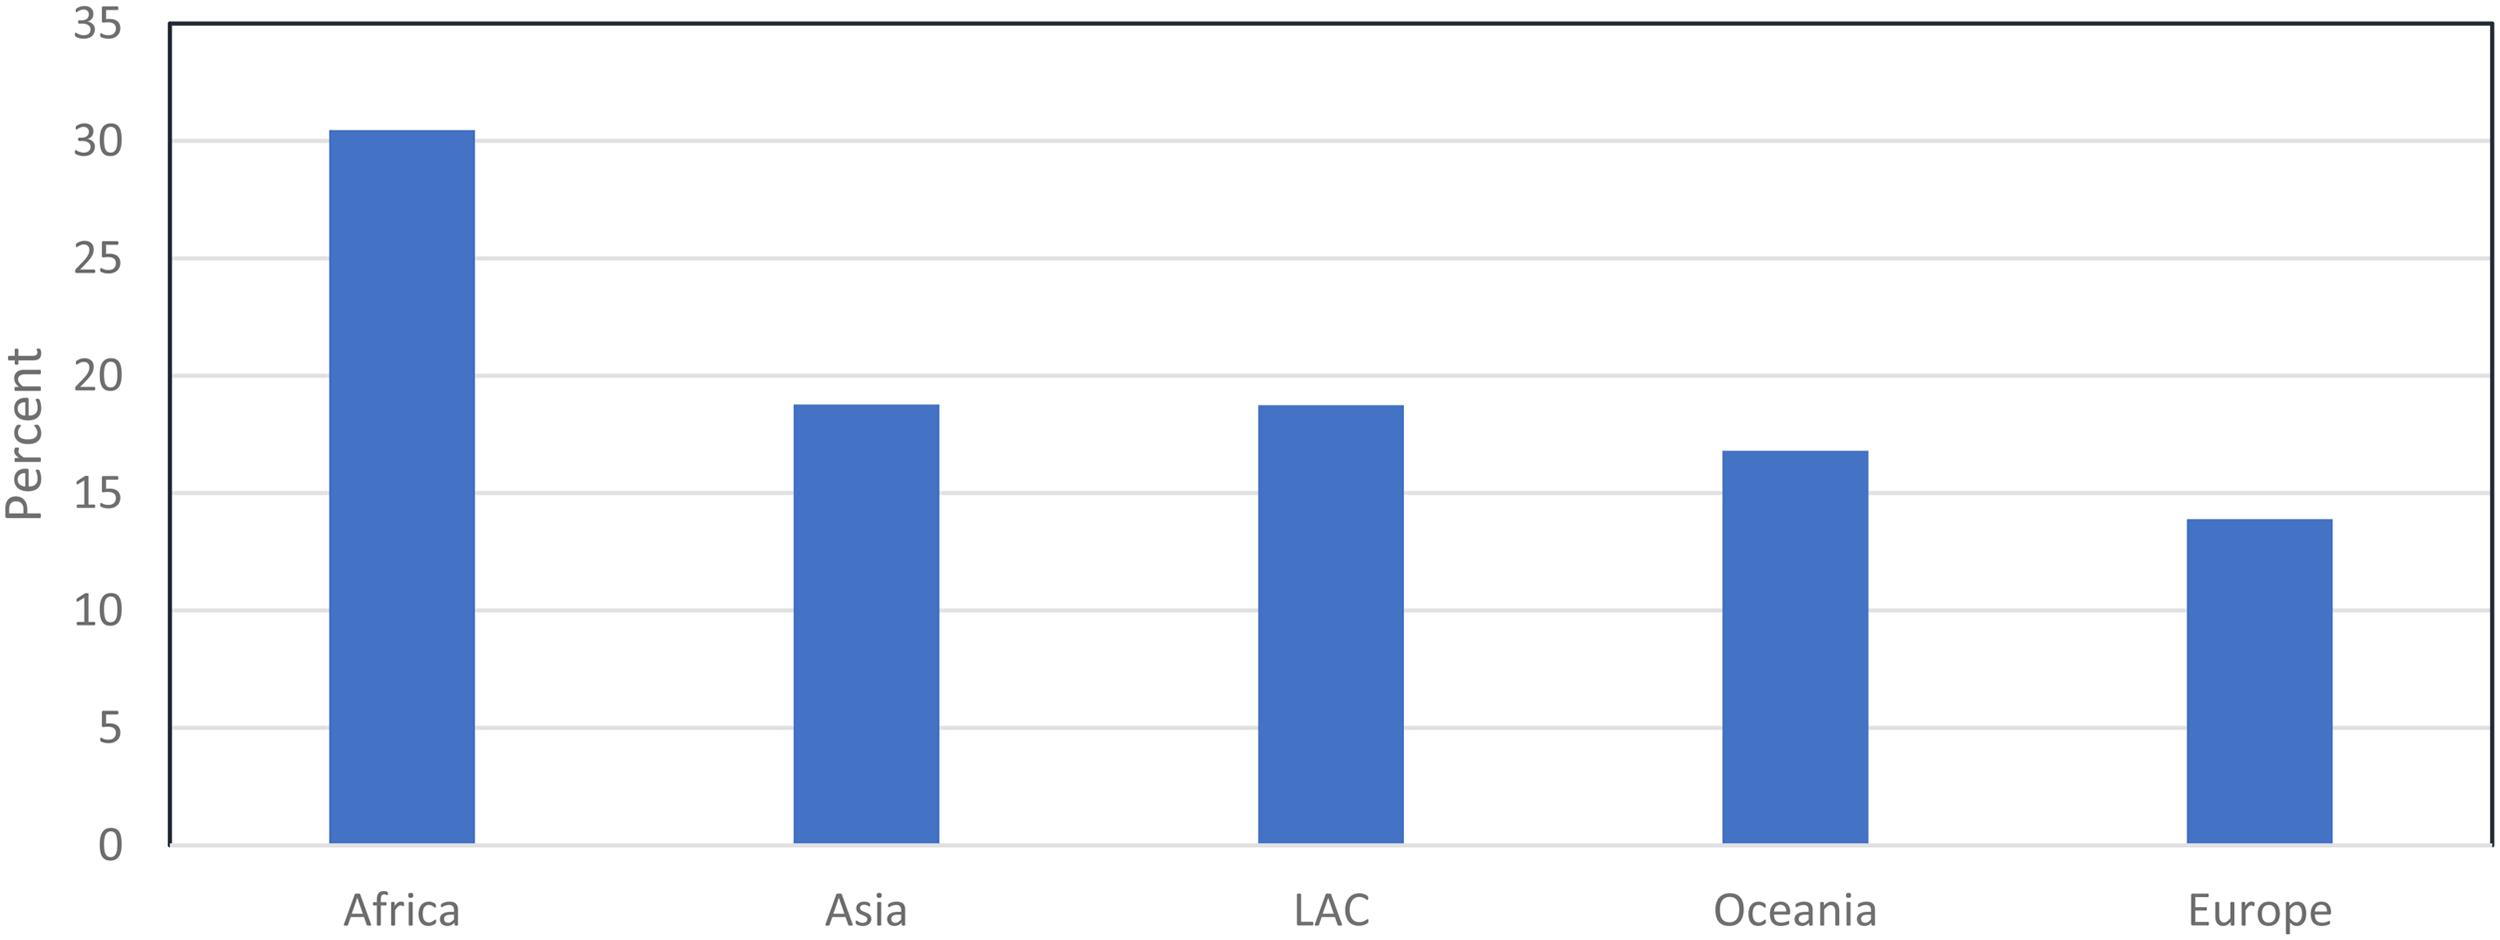
The global trend shown in Figure 1, however, masks significant variation in the visa rejection trends observed in specific world regions. These inequalities are presented in Figure 2. At one end of the spectrum is the rejection trend in African countries, which was consistently over 30 percent during the past two decades and captures the highest regional rejection rates in the sample. Indeed, Figure 2 suggests that the overall increase in the global visa rejection rate observed between 2016 and 2020 (Figure 1), a period that coincided with the first term of the Trump administration, was largely driven by the rejection trend observed in Africa. At the other end of the spectrum is the visa rejection trend of European countries, which was mostly under 20 percent during the observation period. This contrast between the African and European trends is distinctive. In fact, the overall mean rejection rate for European countries during the observation period (17.4%) was slightly less than half of the respective mean observed in African countries during the same period (37.0%). The respective trends of Asia, Latin America and the Caribbean (LAC), and Oceania fell somewhere between these two extremes. These patterns are generally similar to the types of regional disparities in the rejection of Schengen visa applications observed in previous studies (Cangönül and Temel 2025; Cangönül and Yildiz 2024). They are also similar to the distribution of countries reported by the Department of Homeland Security (2024) as having higher overstay rates during the 2024 fiscal year.
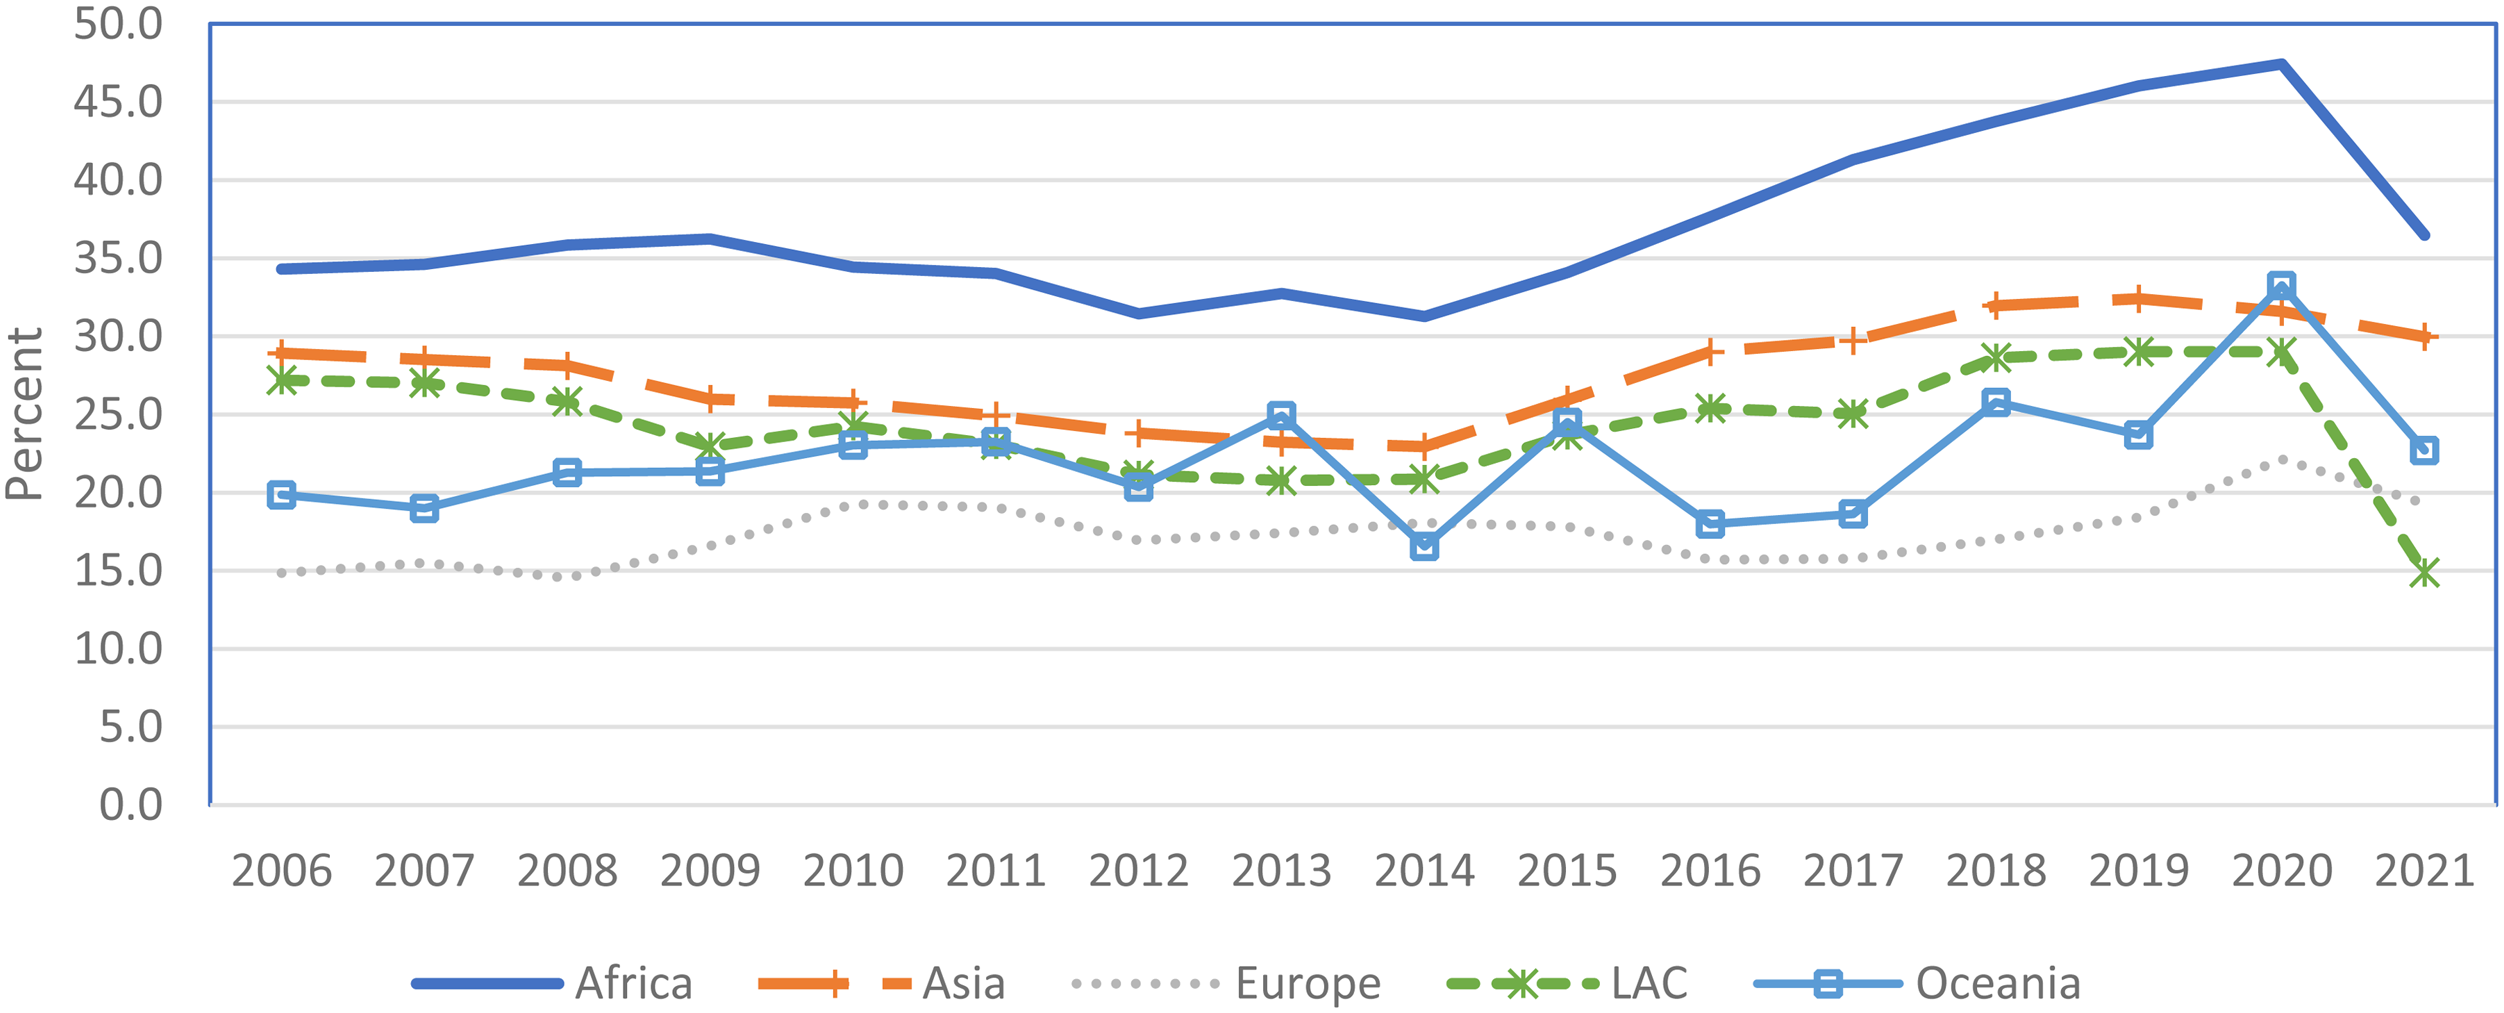
Regional trends in average adjusted visa rejection rates between 2006 and 2021.
Figures 3 and 4 provide additional perspectives on inequalities in visa rejection rates by showing the composition of the top 15 countries that, respectively, had the lowest and highest mean rejection rates between 2006 and 2021 3 . Figure 3 indicates that the top 15 countries with the lowest rejection rates were mostly found in Europe, the Middle East, and Asia. Among countries in this group, the lowest rate was observed in Argentina (2.7%) and the highest rate in Luxembourg (6.4%).
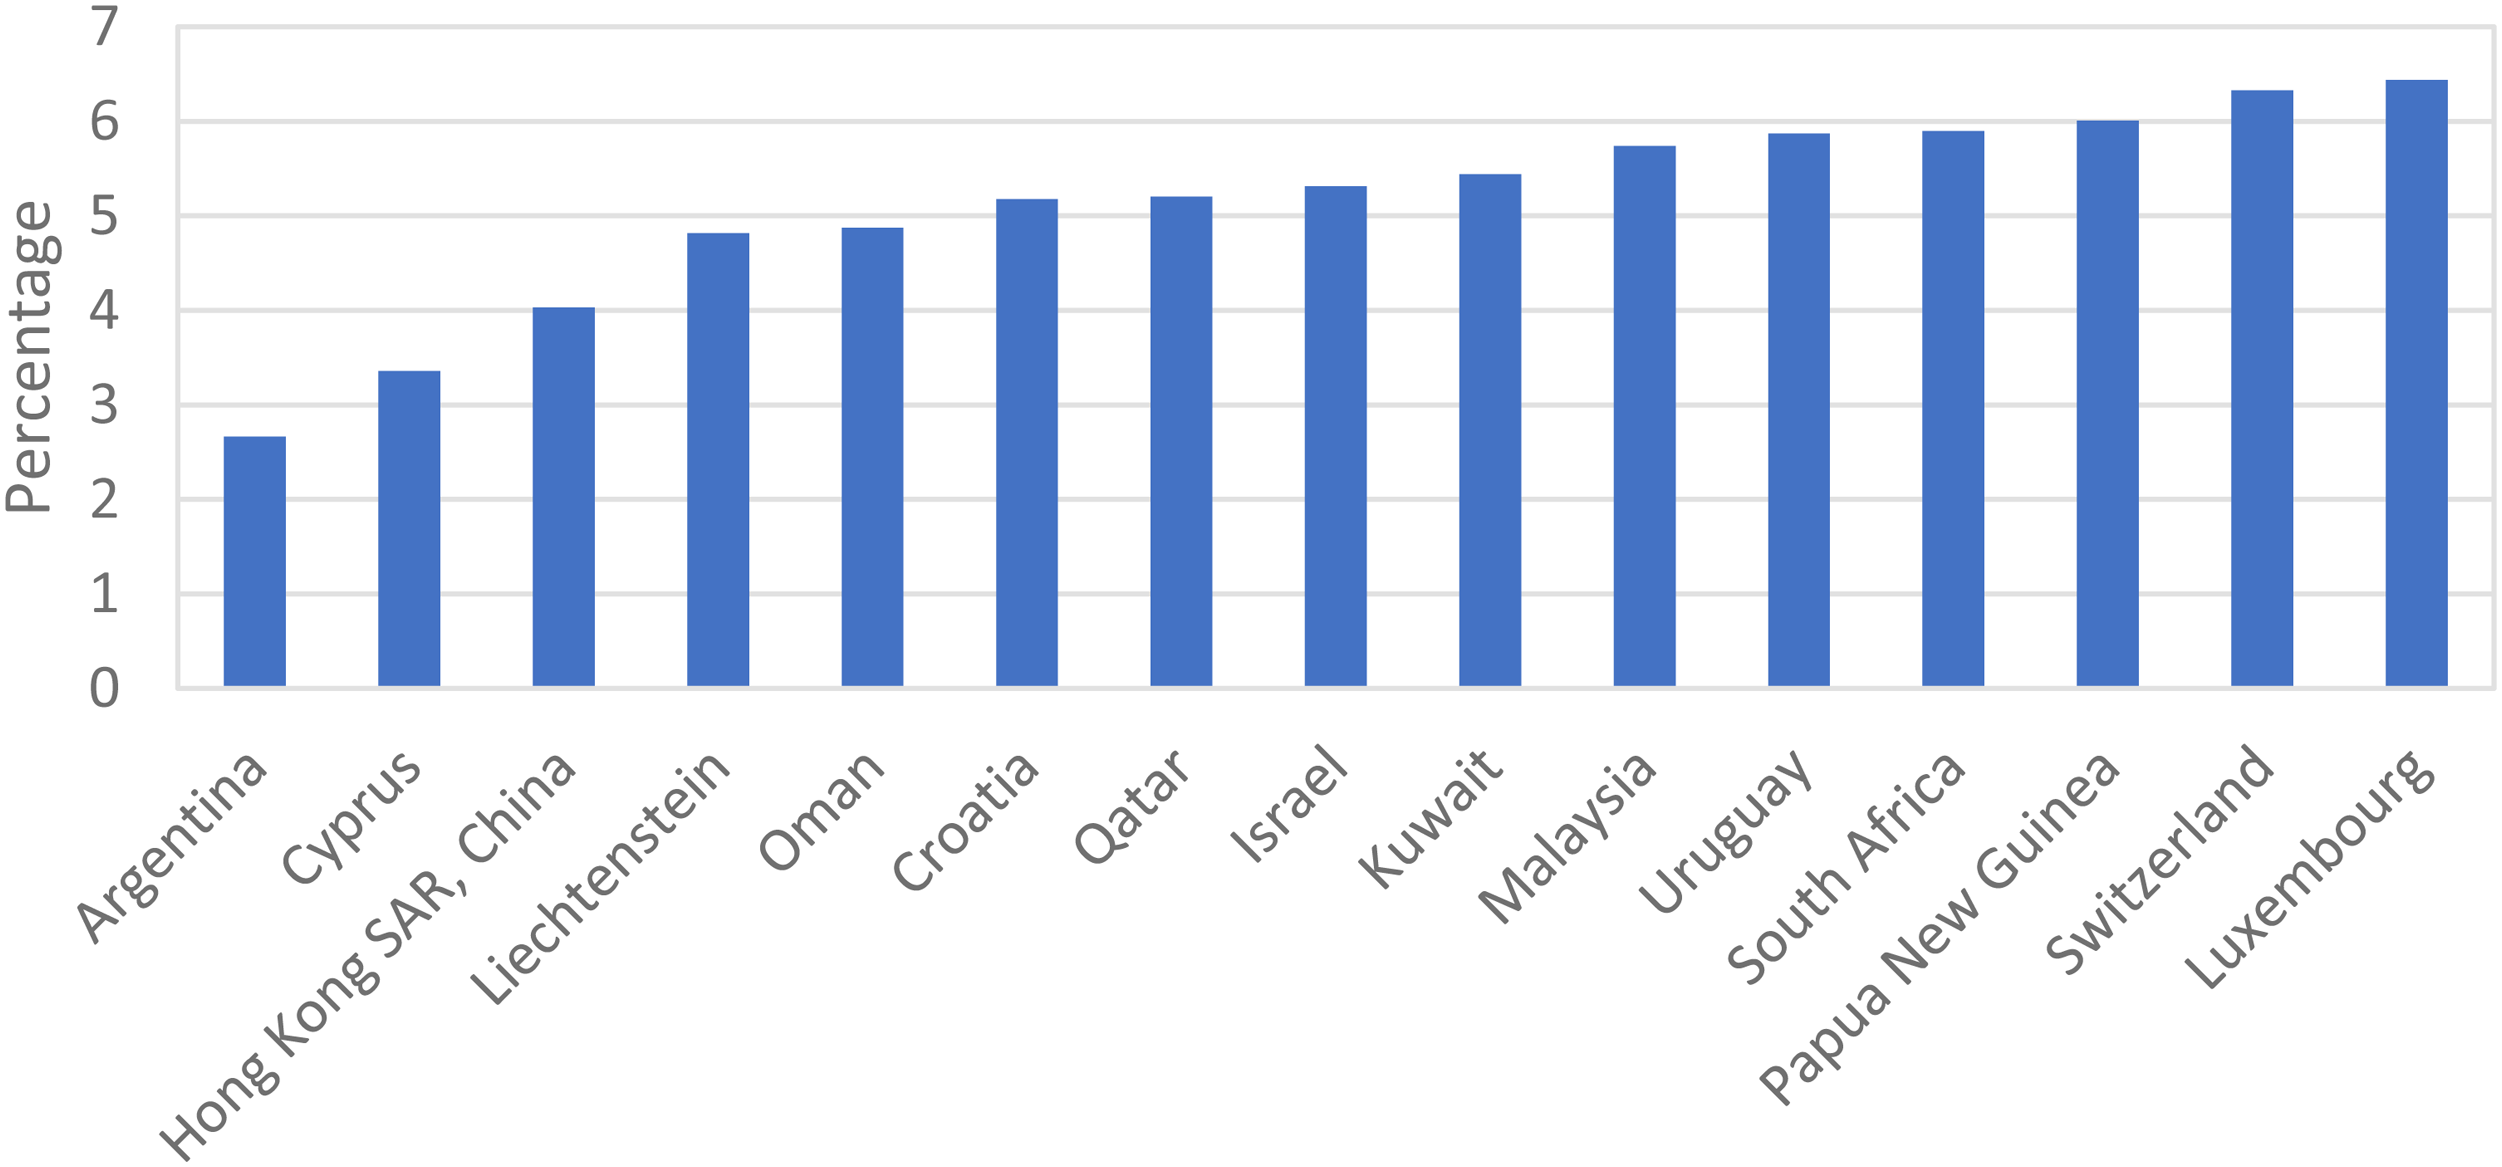
Top 15 countries with the lowest average adjusted visa rejection rates between 2006 and 2021.
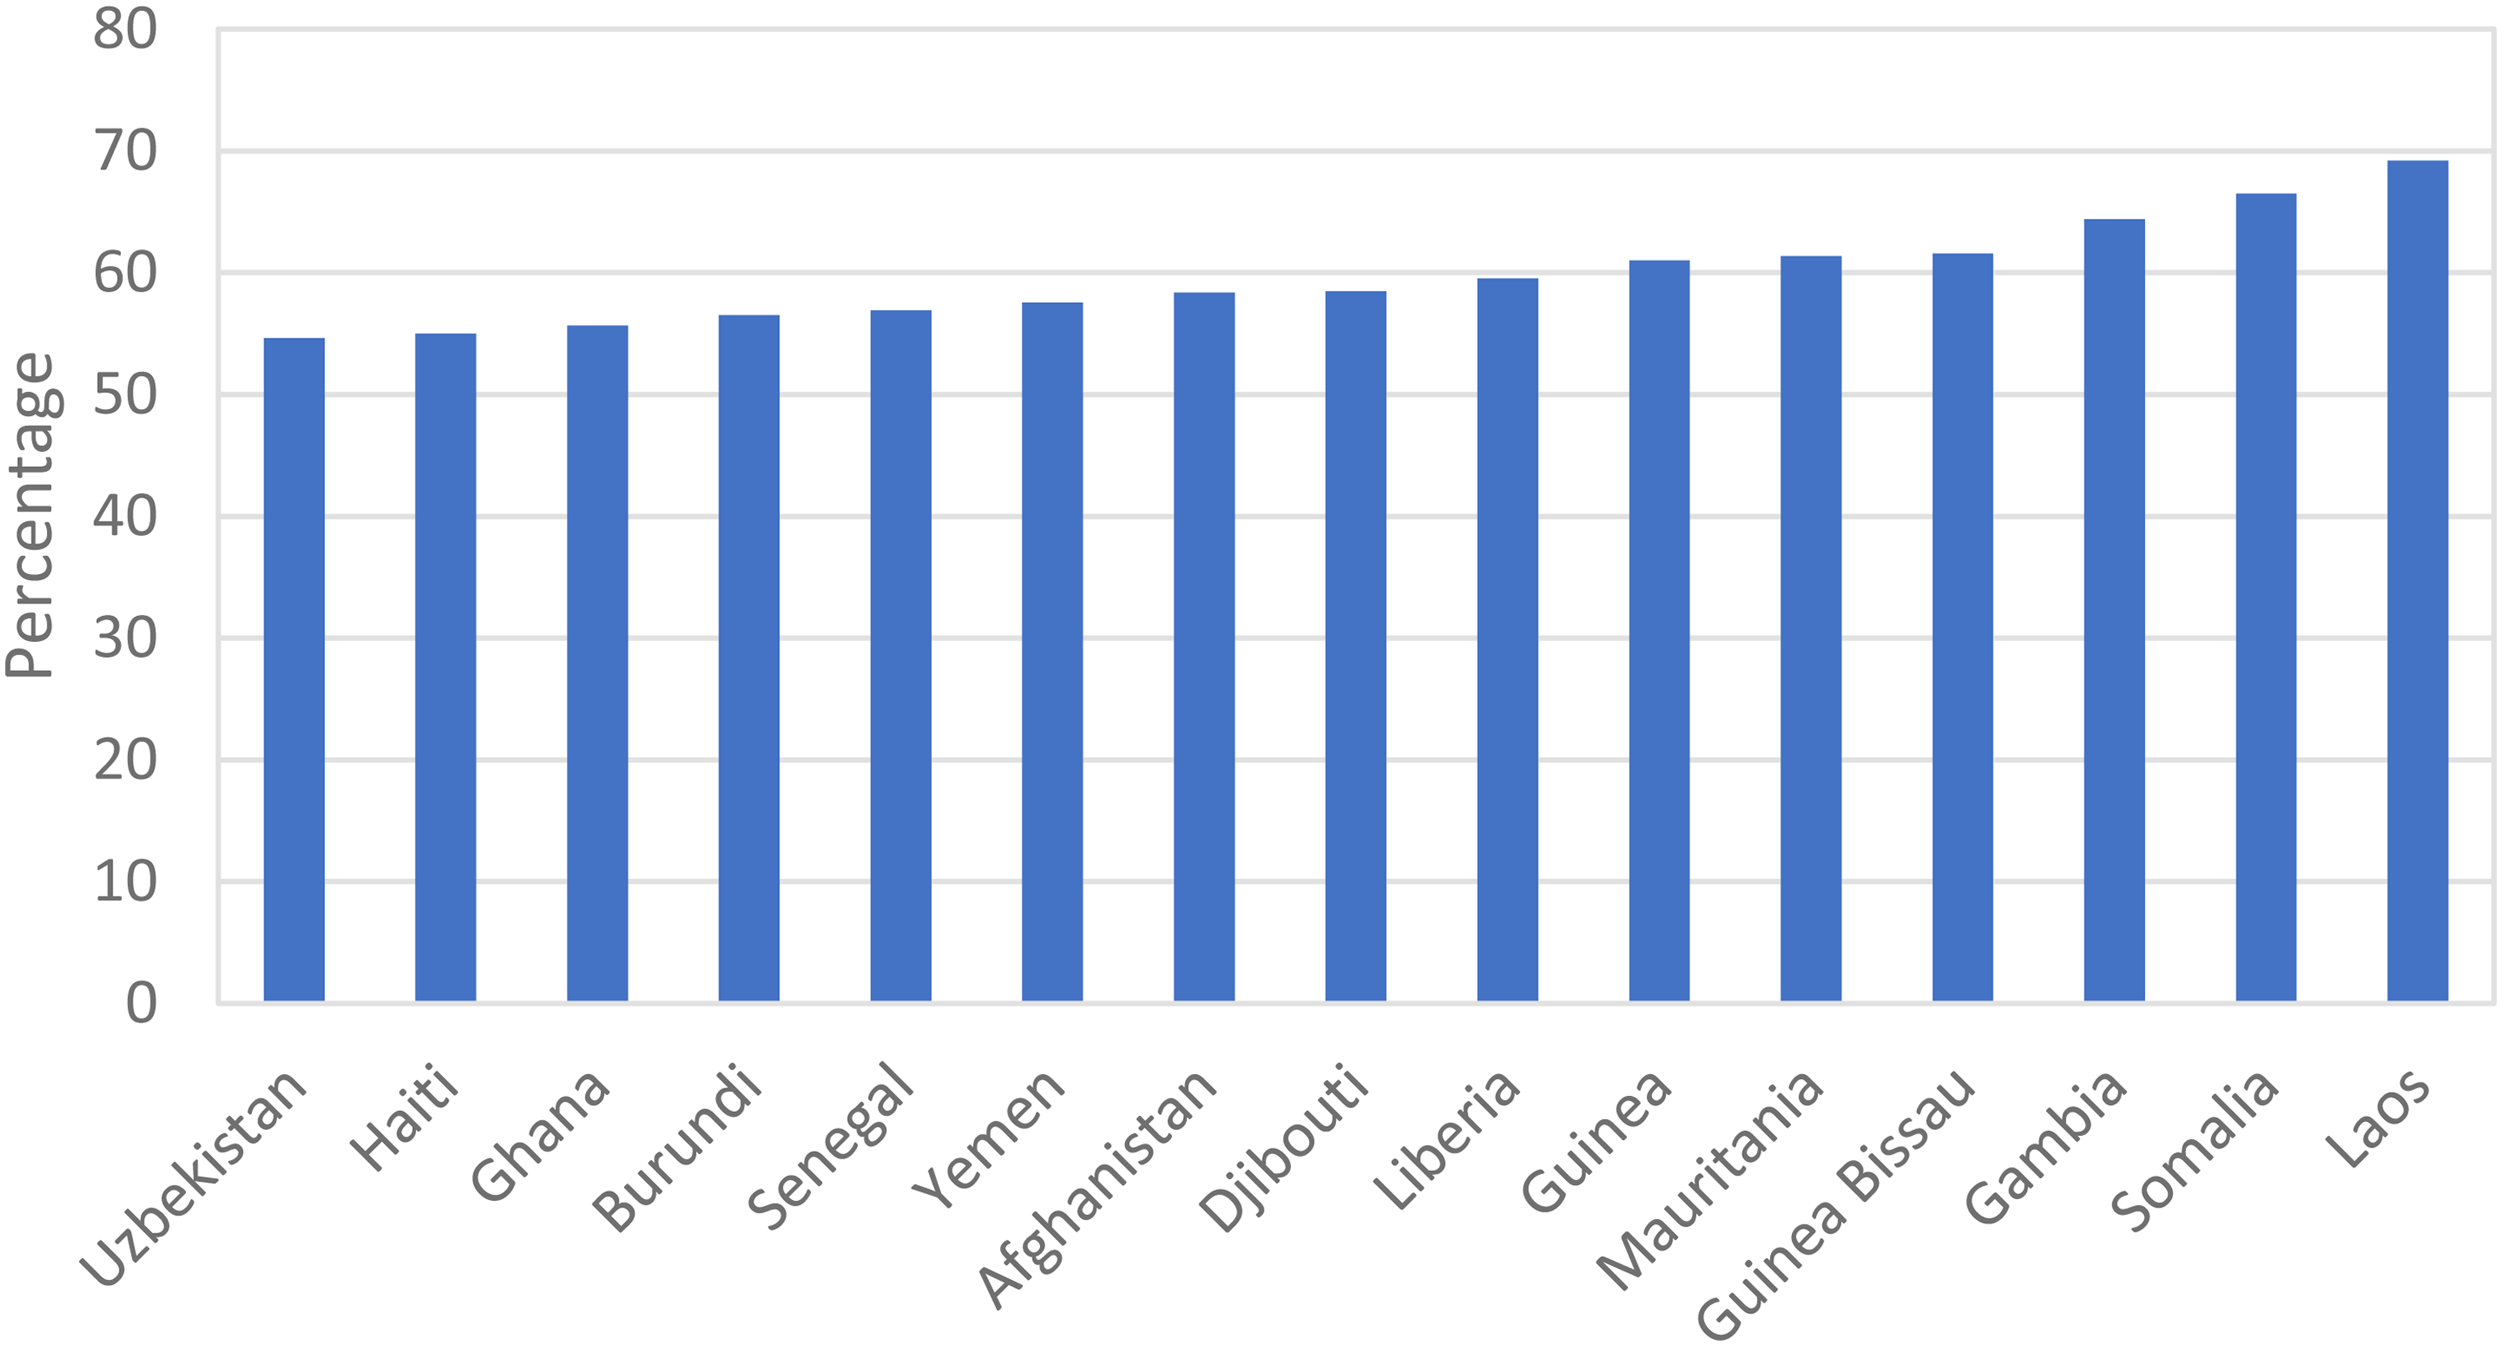
Top 15 countries with the highest average adjusted rejection rates between 2006 and 2021.
Correspondingly, Figure 4 shows the top 15 countries with the highest rejection rates observed during the same time period. In general, there are two characteristics that distinguish these countries from those with the lowest visa rejection rates. The first is that the majority of these countries—10 of the top 15—are found in Africa. The second is that among the top 15 countries with the highest rejection rates, 50 percent or more of all visitor visa applications submitted were rejected. Indeed, the mean rejection rates for these countries ranged from 54.6 percent in Uzbekistan to 69.2 percent in Laos. The countries identified in these findings overlap with those reported by the U.S. Department of Homeland Security (2024) as having higher B visa overstay rates during the 2024 fiscal year.
A more robust analysis of regional inequalities in adjusted visa rejection rates is provided by results from mixed-effects regression models presented in Table 2. The table presents models that iteratively add social, demographic, and economic control variables to provide a sense of the consistency of the regional-level main effects. Model 1 is a baseline model that controls only for world regions. It confirms that the visa rejection rates observed in world regions in the Global South are generally higher compared to those observed in Europe (the reference group). For example, the adjusted visa rejection rate observed in Africa is about 120 percent higher (i.e., 100 *e(0.79)−1) than that observed in Europe. Similarly, the corresponding rates for Asia, LAC, and Oceania are between 32 percent and 35 percent higher than that observed in Europe. The region-specific main effects are not statistically significant between Models 2 and 6 after accounting for factors such as GDP per capita and FDI inflows. Thereafter, the regional differences reappear (i.e., between Models 7 and 9) with the inclusion of demographic variables, suggesting that, had there been no regional differences in demographic characteristics, most of the regional disparities would have been explained by variations in economic conditions.
Results from Mixed-Effects Regression Models Examining the Regional Disparities in US Visitor Visa Rejection Rates.
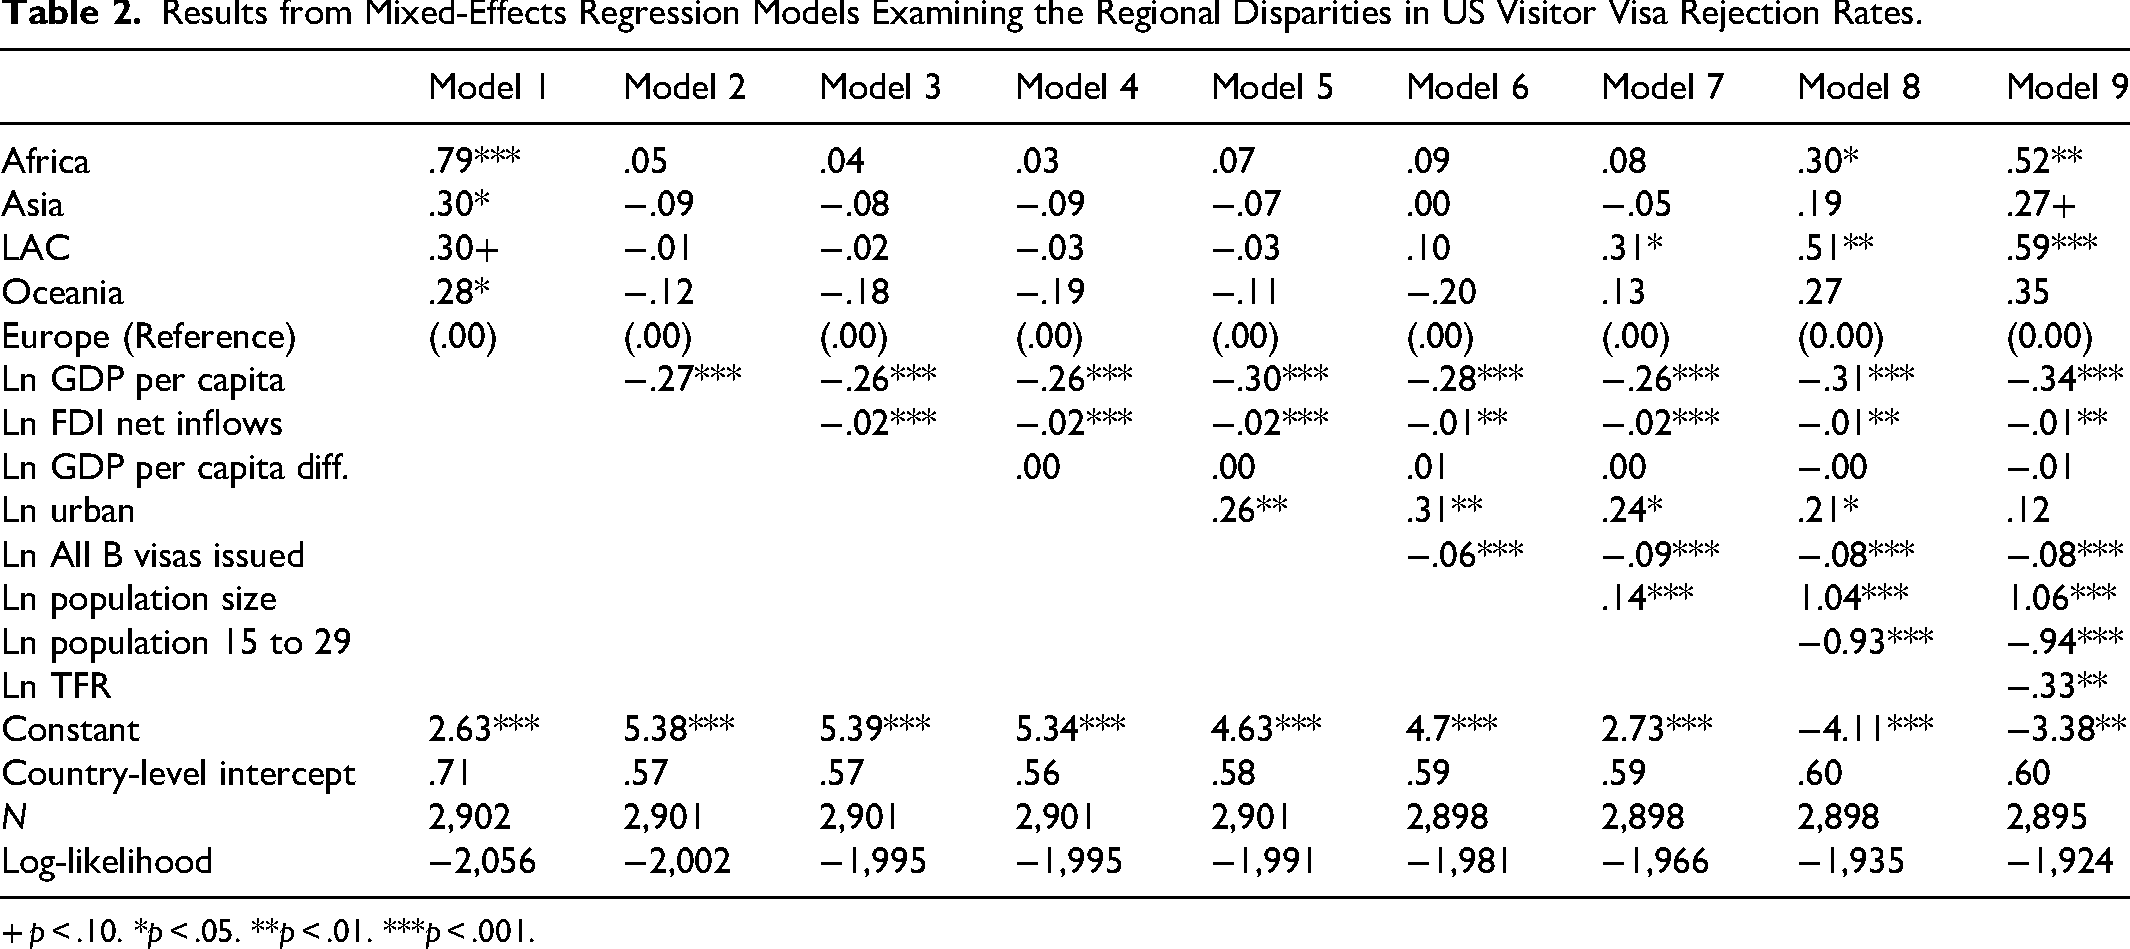
+ p < .10. *p < .05. **p < .01. ***p < .001.
In Model 9, the analysis specifically shows what happens to regional inequalities after controlling for all country-level differences observed in the data. Although accounting for these factors results in a modest reduction in the relative difference between Africa and Europe, the adjusted visa rejection rate of the former remains approximately 70 percent higher (i.e., 100 * e(0.54)–1) than that of the latter. Additionally, the comparative rate for Asia slightly declines after accounting for other characteristics, while that for LAC increases.
Model 9 also provides insight into some of the specific ways in which social, economic, and demographic factors are associated with visa rejection rates. As expected, it shows that visa rejection rates decline as GDP per capita increases. This is consistent with economic perspectives that suggest that at the global level, US visitor visa applicants in high-income countries will be better able to meet the economic criteria needed for visa approval compared to those in low-income countries. Model 2 further shows that FDI net flows are negatively associated with visa rejection rates, which implies that applicants seeking visitor visas for business travel are rejected at lower rates in countries that receive high levels of FDI inflows. Notably, however, the collective number of B visas actually issued is negatively associated with visa rejections. Given the fact that the variable measuring the number of B visas issued is a lagged variable, this finding indicates that countries where large numbers of these visas were issued during the previous year were also less likely to reject applications for similar visas in the subsequent year.
Other results presented in Table 2 underscore the role of demographic factors in predicting visa rejection rates. For example, the results show that visa rejection rates increase as population size increases. As such, demand pressures on US visitor visas in countries such as China, India, Pakistan, and Nigeria appear to contribute to an increased likelihood of having visitor visa applications rejected. At the same time, the results indicate that visa rejection rates are negatively associated with youth population size and TFRs. The latter finding is particularly important because it suggests that applicants in countries with high birth rates may have an advantage in showing family connections at home, which is critical for demonstrating a willingness to return under provision 214(b) of the INA of 1952.
Notwithstanding the importance of these findings, the results presented in Table 2 have two important implications for understanding regional inequalities. First, they suggest that the lower rejection rate observed in Europe than in regions such as Africa, LAC, and Asia is not explained by the fact that European countries are wealthier compared to countries in these regions. As the results demonstrate, the European visa rejection advantage persists even after controlling for differences in factors such as GDP per capita. Indeed, Figure 5, which shows the predicted visa-rejection rates estimated from Model 9 in Table 2, also indicates that the lowest predicted rejection rate is observed among applicants in Europe. Second, the results imply that the comparatively high visa rejection rates observed in the Global South are not explained by other theoretical influences suggested in previous studies. For example, the comparatively higher rejection rates observed in Africa and Asia do not appear to be explained by demand pressures on US visas since these inequalities persist even after accounting for differences in their demographic characteristics.
Regional disparities in predicted B visa rejection rates.
A major question raised by the regional disparities described above is whether they are explained by the differences in visa overstay rates. This question is important because the US government usually justifies its decision to impose visa restrictions on certain countries by arguing that their nationals have very high visa overstay rates (e.g., The White House 2025). To examine this concern, data on recent trends in visa overstay rates from the US Department of Homeland Security (US Department of Homeland Security 2015, 2016, 2017, 2018, 2019, 2020), are used to conduct sensitivity tests that examine whether they explain regional disparities in visa rejection (Table 3).
Results from Mixed-Effects Regression Models Examining the Role of Visa Overstay Rates in Explaining Regional Disparities in US Visitor Visa Rejection Rates.
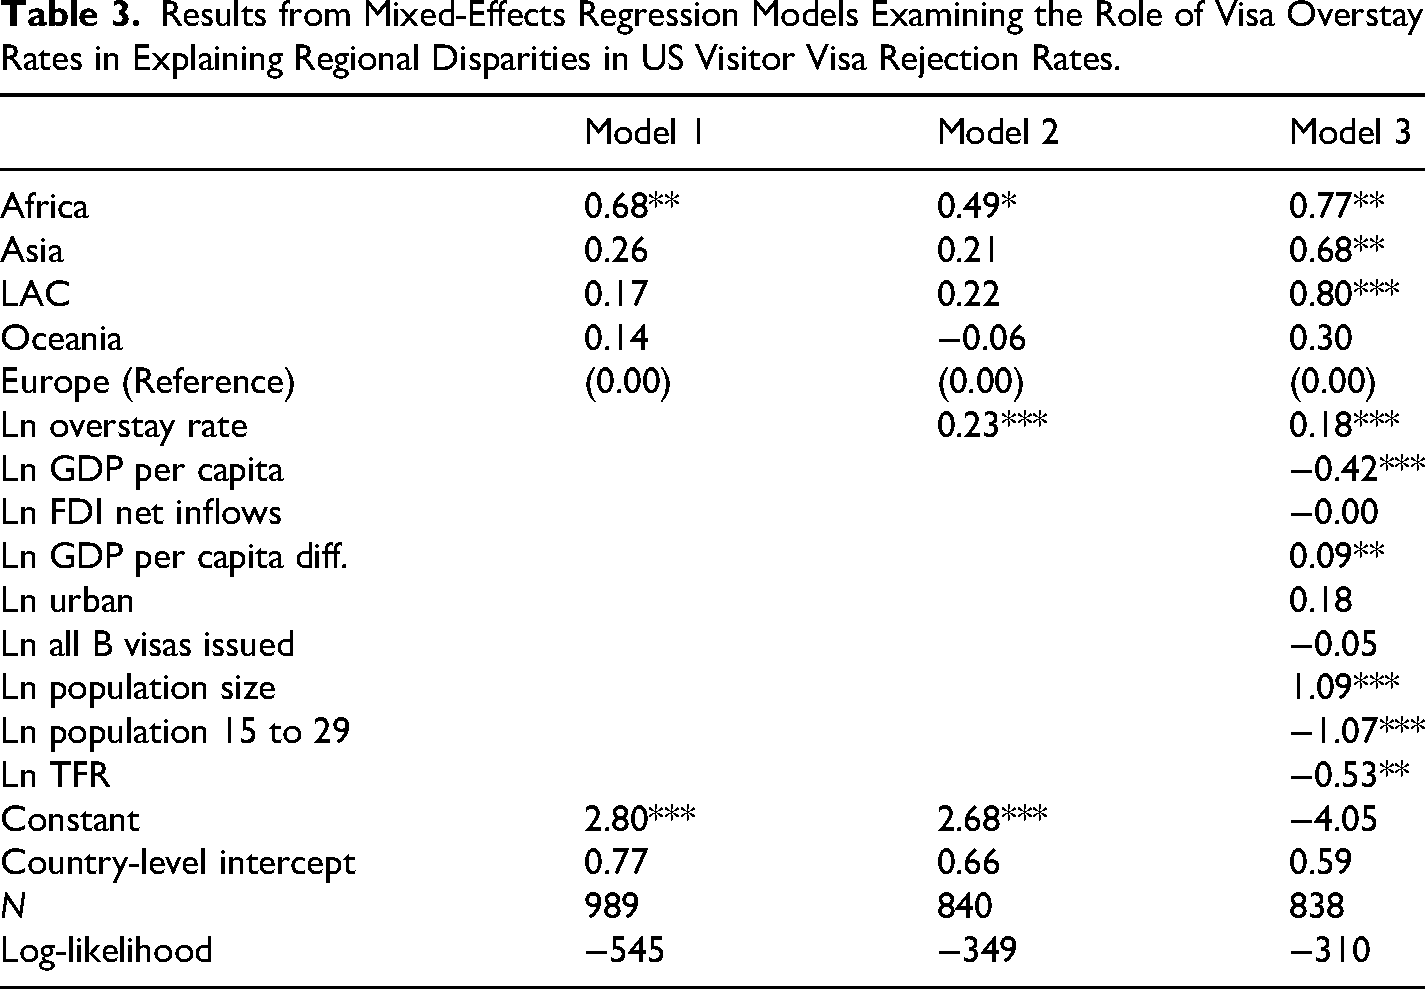
Overall, the sensitivity tests show several important findings. For example, Model 1, the baseline model, shows that the highest rates of visa rejection in the restricted sample are still observed among applicants in African countries. While applicants in LAC, Asia, and Oceania continue to have slightly higher rates of visa rejection, their outcomes are not significantly different from those of visa applicants in Europe. At the same time, the results also show that regional disparities in visa rejection rates still persist after additionally accounting for just the lagged measure of visa overstay rates (Model 2) and the role of overstay rates and other social, economic, and demographic factors (Model 3). Moreover, they show that after other factors are accounted for (Model 3), visa overstay rates increase the risk of visa rejection by about 20 percent.
In general, these findings are important for two reasons. First, they suggest that the higher visa rejection rates observed in non-European regions, especially in Africa, compared to European countries, are not explained by higher visa overstay rates in the former than the latter 4 . Second, the results in Model 3 show that three of the four regions have significantly higher visa rejection rates compared to Europe after controlling for other factors. This suggests that, among countries in the restricted sample, visa rejection rates would have been much higher among those in Africa, LAC, and Asia than among those in Europe had there been no differences in visa overstay rates and other socioeconomic factors during the observation period.
The next stage of the analysis focuses on the examination of visa rejection trends and their determinants, for all countries and for countries in specific world regions. To start the process, Table 4 presents results from fixed-effects regression models examining visa rejection trends for all countries in the analysis. Model 1 indicates that the annual trend, which is captured by the coefficient for year, is positive. Specifically, the coefficient indicates that the overall global visa rejection trend increased by about 1 percent per year between 2006 and 2021. In Model 2, the absolute value of this annual trend remains unchanged after controlling for country-level differences. However, it is not statistically significant. As such, the annual trend in visitor visa rejection rates observed around the world over the past two decades remained stable despite the effect of changes in country-level factors such as the population size that could have increased the trend. Model 3 shows that the relationship between visa rejection rates and the other predictors largely remains the same when the analysis excludes the time trend. As will be shown the subsequent analysis, there are important variations in the influence of these specific predictors across world regions.
Results from Fixed-Effects Regression Models Examining Trends in US Visa Rejection Rates Between 2006 and 2021 for all Countries in the Sample.
+p < .10. *p < .05. **p < .01. ***p < .001.
Turning its attention to specific world regions, Table 5 presents baseline estimates of the annual trend observed in the five main regions used in the analysis. The results present coefficient estimates for models that only control for year (i.e., annual trend) for each region. At the same time, these results show only slight differences in these regional trends. For example, between 2006 and 2021, visa rejection trends significantly increased by between 1.2 percent and 1.5 percent in Africa, Asia, and Europe. However, no significant increase was observed in either LAC or Oceania during this period.
Results from Fixed-Effects Regression Models Examining Base-Line Annual Trends in US Visitor Visa Rejection Rates for Each Region.
+p < .10, *p < .05.
Table 6 presents results from regional fixed-effects regression models that control for the full range of country-level factors. With the inclusion of these controls, the annual trends in Africa and LAC decline by approximately 7 percent per year. Accordingly, the modest annual increases in visa rejection trends in these regions observed in Table 4 appear to have been mostly due to changes in the social, economic, and demographic characteristics of countries during the last two decades.
Results from Fixed-Effects Regression Models Examining the Determinants of US Visa Rejection Rates Within Specific World Regions.
+p < .10. *p < .05. **p < .01. ***p < .001.
Apart from showing differences in regional trends, Table 6 also helps to answer the question of whether there are disparities in the effects of social, demographic, and economic factors on the visa rejection rates observed among regions. The results show several examples of such disparities. One of them is that the negative relationship between GDP per capita and visa rejection rates is statistically significant in Africa, Asia, and Oceania, but not in Europe and the LAC region. As such, while GDP per capita is negatively associated visa rejection rates at the global level (Table 4), which is consistent with neoclassical economic theory, its influence within specific regions is circumscribed. Specifically, across regions, increases in GDP per capita mostly helped to reduce visa rejection rates in contexts such as Africa, Asia, and Oceania. In two of these regions—Africa and Asia—income growth in recent years was concentrated among populations with the world's lowest levels of income (World Bank 2024b). As such, Table 6 suggests that it is mostly to these contexts that the neoclassical economic perspective is likely to apply.
Two other notable regional disparities are shown in Table 6. The first is associated with the effect of the difference between the per capita income of the United States and the per capita incomes of the countries where visa applications are submitted. These relative income differences were only significant predictors of visa rejection rates in countries in Africa and LAC. This finding is important because these are the two regions with populations that earn some of the lowest levels of income compared to those found in the United States. Thus, the results suggest that visitor visa applicants in Africa and LAC were the most at risk of having their applications rejected under provision 214(b) of the INA of 1952 due to fears that they will choose to remain in the United States to maximize their income-earning opportunities.
The second notable disparity is associated with the contrasting effect of increases in the number of B visas issued in previous years on visa rejection rates. On the one hand, among visa applicants in Africa and Oceania, the number of these visas issued, which is a lagged variable, increases visa rejection rates in the following year. On the other hand, the same patterns of changes in the number of B visas issued the previous year among applicants in Asia and Europe, are subsequently followed by significant decreases in visa rejection rates. The larger of these two declines is observed among applicants in Europe. In other words, the results imply that, across world regions, there may be differential policy responses, government adjudicator biases, and unobserved variation in applicant-level characteristics associated with changes in the number of visitor visas issued in the previous year. These factors appear to combine to make it more difficult to obtain such visas in the future in Africa and Oceania than it is in Asia and Europe.
Discussion and Conclusion
Concerns about the use of visa policies to regulate migration have been expressed in previous studies critical of how Western countries have used strategies of “remote control” to discourage migrants in the Global South from leaving their countries (Fitzgerald 2019, p. 4). Although there is no doubt that such restrictions can negatively affect population mobility (Fitzgerald 2019; Neumayer 2010), few studies have empirically assessed the processes that affect how these restrictions are deployed. Building on previous studies on inequalities created by such restrictions (e.g., Mau 2010; Neumayer 2006; Satzewich 2014), this study extends the literature by improving our understanding of the dynamics of the rejection of US visitor visa applications across countries. In particular, it demonstrates that global visa rejection trends are poor indicators of how visas are used to restrict population mobility, because they conceal significant patterns of inequality among world regions. Moreover, the study underscores the importance of country-level socioeconomic conditions and demographic processes for understanding these inequalities. Altogether, these contributions are reflected in four specific findings that emerged from the study.
First, the analysis demonstrates that there are major inequalities in visa rejection rates across world regions that have remained largely consistent over the past two decades. During this period, US consular officers were least likely to reject visa applications submitted in Europe, but most likely to reject those submitted in Africa. The magnitude of the disparity between both regions was so significant that the rejection rate observed in the latter was at least twice as high as that observed in the former. Visa rejection rates were also higher in Asia, LAC, and Oceania, than in Europe, but not as much as they were in Africa. Notably, the analysis also showed that these regional inequalities are not explained by differences in country-level factors such as per capita income or population size. It is not clear whether these trends will continue in the future. However, the study's findings for the period between 2006 and 2021 are consistent with the view that policies used to regulate migration to the West impose greater restrictions on the movement of people departing from the Global South than on those departing from the Global North (e.g., Ullah, Chattoraj and Kathy 2024).
While the analysis was not designed to test claims of a racial nexus in these inequalities, it seems clear that its findings imply that the negative consequences of visa rejection decisions are mostly borne by populations in the Global South. For example, restricted access to US visitor visas among African and Asian nationals will make them less able to make temporary visits to family members in the United States (Monger and Mathews 2011) and experience the benefits of tourism (Ilincic 2014) compared to their counterparts in Europe. Similarly, because visitor visas are also used for business purposes (Teich 2014), visa applicants in the Global South will be less favorably positioned to explore economic opportunities in the United States compared to those in Europe. However, the implications of visa restrictions extend beyond these inequalities. As shown in previous studies, restrictive visa regimes can also reduce the incentive of migrants to return to their home countries after their visits (Czaika and De Haas 2017). As such, high rejection rates among applicants in Africa and LAC could have the unintended consequence of discouraging those who do receive visas from these regions from returning home after visiting the United States.
Second, the results show that the annual rate of growth of visitor visa rejection rates over the past two decades was generally limited. Baseline growth rates of about 1 to 2 percent year in regions such as Africa, Asia, and Europe were counterbalanced by the zero or negative growth rates observed in LAC and Oceania. There is no doubt that governments maintain strict oversight over the implementation of their visa policies (Mau 2010; Wright 2012). As such, the relative stability of US visitor visa rejection rates over the past two decades suggests that the percentage of visas approved has not been responsive to recent increases in the demand for US visas. Several factors could have accounted for this apparent lack of response. One of them is that the increased demand for US visas may not have been matched by a corresponding increase in the number of applicants eligible to receive these visas. At the same time, as suggested by previous studies (Tanelorn and Anderson 2019), visa rejection rates may have been held constant due to unofficial efforts used to regulate migration from countries with a high demand for migration to the United States.
Third, the analysis suggests that there are differential patterns of visa rejection that follow periods of increases in visa approvals. Across all countries, for example, the results show that an increase in the number of visitor visas issued in the previous year is typically followed by a decline in visa rejection rates (Table 4). However, among specific regions, the results show two contrasting responses. The first is observed among countries in Africa and Oceania, where estimates of the lagged effect of the number of B visas issued the previous year indicate that these increases are followed by an increase in visa rejection rates (Table 6). The second is observed in European countries, where the number of such visas issued the previous year is followed by a decrease in visa rejection rates. More research is needed to identify the causes of these differences, given recent scholarly arguments that suggest that they may be driven by racial discrimination (Rosenberg 2023).
A final set of findings underscore the significance of other inequalities in the effects of economic and demographic factors among regions. Consistent with neoclassical migration theory (Rooth and Saarela 2007; Todaro 1969), for example, visa rejection rates increase as the relative gap in national incomes in both Africa and LAC compared to incomes in the United States increases. Thus, within these regions, visa applications were less likely to be rejected in countries where the relative income gap was smaller than in those where the gap was larger. The results also show a positive relationship between population size and visa rejections in Africa, Asia, and Europe. By contrast, there is a negative association between youth population size and visa rejection rates in Asia and Europe, which suggests that the mobility of youths may be more highly encouraged compared to that of other segments of the population in these regions.
What remains unclear, however, is the question of what the study's main findings imply for inequalities in access to other types of visas. Public information on country-level rejection rates for other types of visas is generally unavailable. This makes it difficult to determine whether the regional inequalities observed in the analysis are similar to those associated with applications for H1B, K, and E, and other types of visas. Also unclear is the question of how the discretion given to consular officers to make decisions on visa applications operate. Without information on the parameters that determine how this discretion is used, it would be difficult to assess how cultural stereotypes that could potentially influence the use of discretion affect these decisions.
For these reasons, it is important to understand the study's main findings within the context of such limitations. Some of these limitations are due to obvious data constraints. For example, the database used in the analysis does not include information on other factors known to affect visa rejection trends. These omitted measures include, but are not limited to, information on how visa policies are used to achieve diplomatic objectives such as the isolation of state sponsors of terrorism. Additionally, the analysis does not include rejection rates that are specific to the B1, B2, and the B1/B2 visas because the visa database of the US State Department only provides rejection rates for all B visas combined. Furthermore, the database lacks measures of criminality, fraud in visa application documents, and health related issues that could increase the likelihood of rejection. Another limitation is that the study's units of analysis (i.e., countries) use a higher level of aggregation to understand visa rejection decisions that mainly occur at the level of individuals. While this strategy is warranted given the lack of available data at the individual level, it is unsuitable for understanding the role individual-level characteristics such as gender and educational attainment in shaping these decisions. Lastly, the data used in this study do not allow users to delineate between all visitor visas and the number of visas issued under the Visa Waiver Program.
Future studies could provide needed clarity on how these and other related factors affect visa rejection rates. For example, they could weigh the relative significance of supply-side (e.g., applicant's educational attainment and employment status) versus demand-side (e.g., US social connections, changes in immigration policy preferences) factors in determining the outcomes of visa application processes. Future studies could also use more robust strategies to identify the specific causal pathways that exist between the characteristics of visa applicants and the outcomes of their visa applications. For example, audit studies (Gaddis 2018) could be used to accomplish this by generating random variation in the characteristics of visa applicants interacting with the US consular officers making decisions on their applications. Such studies could help to identify the specific sources of bias that affect visa applicants in various world regions. This study is not structured to identify such sources of individual-level bias. However, its key findings provide an important step in clarifying our understanding of the inequalities in US visitor visa rejections that were observed across world regions over the past two decades.
Footnotes
Funding
The authors disclosed receipt of the following financial support for the research, authorship, and/or publication of this article: This work was supported by the National Institute of Child Health and Human Development (grant number: P2CHD042849).
Declaration of Conflicting Interests
The authors declared no potential conflicts of interest with respect to the research, authorship, and/or publication of this article.
Data availability
Notes
Appendix
Mean Visa Rejection Rates for 2006 to 2021 for All Countries in the Sample.
| Country | Visa rejection rate (Mean) |
|---|---|
| Afghanistan | 58.38 |
| Albania | 39.40 |
| Algeria | 30.49 |
| Angola | 31.59 |
| Antigua and Barbuda | 19.30 |
| Argentina | 2.67 |
| Armenia | 49.52 |
| Australia | 18.39 |
| Austria | 9.79 |
| Azerbaijan | 16.98 |
| The Bahamas | 9.28 |
| Bahrain | 7.26 |
| Bangladesh | 44.53 |
| Barbados | 9.40 |
| Belarus | 20.04 |
| Belgium | 11.29 |
| Belize | 26.43 |
| Benin | 38.86 |
| Bhutan | 54.38 |
| Bolivia | 19.93 |
| Bosnia and Herzegovina | 18.48 |
| Botswana | 15.35 |
| Brazil | 9.83 |
| Brunei | 7.67 |
| Bulgaria | 15.62 |
| Burkina Faso | 48.13 |
| Burundi | 56.52 |
|---|---|
| Cabo Verde | 41.22 |
| Cambodia | 40.37 |
| Cameroon | 43.27 |
| Canada | 45.30 |
| Central African Republic | 39.94 |
| Chad | 47.28 |
| Chile | 8.42 |
| China | 18.98 |
| Colombia | 25.55 |
| Comoros | 41.81 |
| Congo, Democratic Republic of the | 43.12 |
| Congo, Republic of the | 40.73 |
| Costa Rica | 14.88 |
| Côte d'Ivoire | 36.55 |
| Croatia | 5.18 |
| Cuba | 53.92 |
| Cyprus | 3.36 |
| Czech Republic | 9.46 |
| Denmark | 15.26 |
| Djibouti | 58.47 |
| Dominica | 29.37 |
| Dominican Republic | 35.93 |
| East Timor | 12.53 |
| Ecuador | 28.06 |
| Egypt | 32.01 |
| El Salvador | 48.45 |
| Equatorial Guinea | 22.55 |
| Eritrea | 53.12 |
| Estonia | 16.63 |
| Eswatini | 9.66 |
| Ethiopia | 41.79 |
| Fiji | 32.44 |
| Finland | 14.34 |
| France | 13.27 |
| Gabon | 26.83 |
| Gambia | 64.39 |
| Georgia | 52.04 |
| Germany | 12.68 |
| Ghana | 55.66 |
| Greece | 13.54 |
| Grenada | 27.07 |
| Guatemala | 40.35 |
| Guinea | 61.02 |
| Guinea Bissau | 61.59 |
| Guyana | 51.44 |
| Haiti | 55.00 |
| Honduras | 38.02 |
| Hong Kong SAR, China | 4.03 |
| Hungary | 19.62 |
| Iceland | 10.06 |
| India | 23.78 |
| Indonesia | 16.91 |
| Iran | 52.45 |
| Iraq | 44.72 |
| Ireland | 22.13 |
| Israel | 5.31 |
| Italy | 14.23 |
| Jamaica | 41.57 |
| Japan | 11.49 |
| Jordan | 37.94 |
| Kazakhstan | 21.08 |
| Kenya | 35.71 |
| Kiribati | 21.94 |
| Korea, Republic of | 10.02 |
| Kuwait | 5.44 |
| Kyrgyzstan | 40.84 |
| Laos | 69.22 |
| Latvia | 19.36 |
| Lebanon | 25.29 |
| Lesotho | 25.07 |
| Liberia | 59.51 |
| Libya | 41.51 |
| Liechtenstein | 4.82 |
| Lithuania | 24.43 |
| Luxembourg | 6.44 |
| Madagascar | 13.30 |
| Malawi | 24.71 |
| Malaysia | 5.74 |
| Maldives | 25.06 |
| Mali | 53.60 |
| Malta | 10.31 |
| Marshal Islands | 16.03 |
| Mauritania | 61.35 |
| Mauritius | 7.25 |
| Mexico | 16.99 |
| Moldova | 43.08 |
| Mongolia | 44.02 |
| Montenegro | 32.10 |
| Morocco | 24.76 |
| Mozambique | 12.15 |
| Myanmar (Burma) | 30.46 |
| Namibia | 7.84 |
| Nauru | 22.66 |
| Nepal | 48.76 |
| Netherlands | 15.14 |
| New Zealand | 15.57 |
| Nicaragua | 40.03 |
| Niger | 42.58 |
| Nigeria | 42.84 |
| North Macedonia | 28.55 |
| Norway | 15.93 |
| Oman | 4.87 |
| Pakistan | 41.48 |
| Palau | 50.21 |
| Panama | 13.29 |
| Papua New Guinea | 6.01 |
| Paraguay | 10.72 |
| Peru | 25.59 |
| Philippines | 28.51 |
| Poland | 11.06 |
| Portugal | 10.94 |
| Qatar | 5.21 |
| Romania | 18.10 |
| Russia | 12.28 |
| Rwanda | 46.84 |
| Saint Kitts and Nevis | 24.19 |
| Saint Lucia | 24.03 |
| Saint Vincent and Grenadines | 22.77 |
| Samoa | 30.32 |
| Sao Tome and Principe | 21.42 |
| Saudi Arabia | 6.82 |
| Senegal | 56.90 |
| Serbia | 18.63 |
| Seychelles | 10.61 |
| Sierra Leone | 50.80 |
| Singapore | 15.60 |
| Slovakia | 13.75 |
| Slovenia | 13.03 |
| Solomon Islands | 8.33 |
| Somalia | 66.48 |
| South Africa | 5.90 |
| Spain | 12.82 |
| Sri Lanka | 28.21 |
| Sudan | 45.03 |
| Suriname | 11.82 |
| Sweden | 17.66 |
| Switzerland | 6.33 |
| Syria | 49.00 |
| Tajikistan | 44.20 |
| Tanzania | 21.74 |
| Thailand | 17.17 |
| Togo | 46.93 |
| Tonga | 41.60 |
| Trinidad and Tobago | 20.74 |
| Tunisia | 20.13 |
| Turkey | 12.84 |
| Turkmenistan | 34.96 |
| Tuvalu | 25.41 |
| Uganda | 39.56 |
| Ukraine | 33.76 |
| The United Arab Emirates | 7.20 |
| The United Kingdom | 20.98 |
| Uruguay | 5.87 |
| Uzbekistan | 54.62 |
| Vanuatu | 22.95 |
| Venezuela | 28.92 |
| Vietnam | 27.61 |
| Yemen | 57.54 |
| Zambia | 30.23 |
| Zimbabwe | 24.90 |