
Abstract
Comprehensive data on refugee migration flows over space and time only exists for a limited number of countries and is prone to various problems, including quality issues, completeness, and different collection methods. This paper addresses these obstacles by presenting global bilateral five-year refugee migration flows between 1990 and 2015 that are derived from available stock data. The estimates, which reflect short-term rather than long-term movements captured by stock data, provide valuable insights into past refugee migration patterns. The results suggest a substantial worldwide decline in refugee migration flows after the early 1990s and a focus shift from African to Asian countries. Furthermore, the data show that global refugee migration flows are highly spatially concentrated and fluctuate between 0.11 and 0.33 percent of the world's population.
Introduction
Data on annual global refugee stocks, which comprises the number of refugees per country of destination and per country of birth or citizenship, is readily available and published by the UNHCR. While the stock data reflects long-term refugee migration patterns, the underlying short-term movements in space and time can only be roughly approximated (e.g., differences in successive refugee stocks). In fact, comprehensive data on refugee migration flows over space and time only exists for a limited number of countries and is prone to various problems, including quality issues, completeness, and different collection methods. Given these issues, this paper serves two purposes. First, it intends to raise awareness of the limitations and problems when working with refugee data, particularly when used as a proxy for short-term refugee migration. Second, it aims to fill the data gap on comparable global refugee migration flows by further developing an existing state-of-the-art method for estimating migration flows from sequential stock data and applying it to the available UNHCR (2017b) refugee data set.
As highlighted in the article Data on movements of refugees and migrants are flawed (Nature 2017, 5–6), “We simply do not know the true figure” when it comes to cross-border refugee movements. “Similar uncertainty surrounds data on asylum applications. […] Misinterpretation and misrepresentation of data on population movements is rife. Official numbers are often mistakenly taken at face value, when further examination shows the underlying data are a mess”. In view of this problem, Eurostat (2018) also emphasizes the importance of accurately measuring refugee movements and stresses the need to improve existing data on refugees and make it internationally comparable. This includes not only the collection of data but also its validation, for example, through the use of alternative methods such as statistical estimations. Outflows, in particular, are sometimes poorly recorded and often not measured (Eurostat 2018). One reason is the lack of adequate administrative capabilities in cases of mass refugee movements (Sarzin 2017; Eurostat 2018), leading to a situation where reported refugee migration inflows and outflows rarely match between sending and receiving countries. In addition, as Abel (2018a) points out, estimated migration flows obtained from stock data offer several potential advantages. Most importantly, measuring stocks is simpler than measuring migration flows. The tracking and recording of refugee movements usually lack quality, simply due to the dynamic nature of the migration process and its often chaotic circumstances. Moreover, when collection methods differ between countries, comparability becomes increasingly difficult. Finally, it is undoubtedly harder to track persons who, for whatever reasons, do not want to be monitored. Therefore, stock data on refugees are far more complete and available across countries and time.
This paper addresses the mentioned obstacles by presenting comparable global bilateral five-year refugee migration flows between 1990 and 2015 that are derived from available stock data. For this purpose, an existing state-of-the-art method for estimating migration flows from sequential stock data is further developed and applied to the UNHCR (2017b) refugee data set. The estimates reflect short-term rather than long-term movements typically captured by stock data and provide valuable insights into past refugee migration patterns without the drawbacks associated with the direct collection of the data.
The next section provides a brief overview of the existing data on refugee stocks and flows and reviews the methods that link migration flows to stocks. Afterwards, the methodology is outlined and illustrated using simple dummy data in the “Methodology” section. A detailed description of the estimation is provided in Supplemental Appendix S1. The model builds on an existing state-of-the-art technique for estimating migration flows from sequential stock data, as presented by Abel (2013) and Abel and Sander (2014), and it is further developed to be meaningfully applicable in the context of refugee migration. The new methodology is applied to the UNHCR (2017b) refugee data set in the “Results” section, producing 35,759,040 estimates of bilateral refugee migration flows in five-year intervals from 1990 through 2015. Altogether, the estimation includes 193 countries for which the required data was available and covers more than 99.9 percent of the entire world population in 2015. The results are subsequently presented and discussed. The “Validation Exercise” section compares the aggregated estimates, first with Eurostat data for a limited set of countries for which the data was available, and second with an approximation of refugee migration flows obtained via a simple stock differencing method. The final section, “Summary and Discussion”, concludes with a brief summary and discussion of the methodology and the results.
Literature
Collecting and compiling data on refugees across various countries is a complex process that involves multiple sources such as registrations, censuses, and immigration authorities. The UNHCR gathers this data and publishes a global database comprising annual refugee stocks and asylum seeker flows, along with additional information on returnees and naturalisations. To address the data needs on population movements, particularly in acute crisis situations caused by disasters or conflicts, the UNHCR and other organizations have developed additional population movement tracking systems in more than 30 countries. However, the accuracy of these systems in monitoring refugee movements is limited (UNSD 2014).
Several studies in academic literature, such as Abel et al. (2019), Barthel and Neumayer (2015), Bermeo and Leblang (2015), Matsui and Raymer (2020), and Salehyan and Gleditsch (2006), have utilized the UNHCR's annual dyadic data on refugee stocks and asylum seeker flows. However, both data sources have significant drawbacks, particularly when used as a proxy for short-term refugee migration flows. First, the stocks represent long-term migration patterns, and second, the asylum seeker flow data can considerably deviate from actual refugee movements. This is demonstrated in Appendix S2, “stock_diff vs pos_fi_asy_dec.xlsx.” Essentially, annual refugee stock differences, adjusted for returnees and naturalisations, show substantial deviations from positive first-instance asylum applications in some cases. For example, the UNHCR (2017b) refugee data shows that there were 1,557,899 and 2,503,549 Syrian refugees in Turkey in 2014 and 2015, respectively. Even after adjusting for naturalisations and returnees, the difference of 945,650 refugees still stands at 937,421. However, between 2014 and 2015, the data shows that there were only 8,229 positive first-instance asylum decisions (and zero complementary protection decisions) for Syrians in Turkey.
Several methods have been developed in the literature for estimating migration flows from available data. However, these methods are generally not suitable for the specific case of refugee migration. Moreover, they have additional limitations that make them less appropriate for estimating refugee migration flows. In the following part of this section, a brief overview of these methods is provided, and their shortcomings when used to estimate such flows are explained.
Geolocated Big Data
Recent studies, such as Andrienko et al. (2020), Ali, Crandall and Levin (2018), and Garimella et al. (2014), evaluate how the increasing availability of geolocated big data, such as GPS information obtained from mobile phones, social media content, or online services, can be used to infer migration flows. While these methods show some promise, they are subject to several caveats, including geographic restrictions, selection bias, data access and legal barriers. Moreover, the results obtained through these methods represent mixed migration, and there are currently no instruments to reliably distinguish refugees from other migrants. As a result, these methods are considered complementary to existing data (Sarzin 2017; Eurostat 2018).
Flows from Stocks / Log-Linear Models
Attempts to link general migration flows to stocks have repeatedly been made and are well documented in the literature. Earlier research, such as Rogers and von Rabenau (1971), Rogers and Raymer (2005), and Rogers and Liu (2005), focus on regional data from the United States. More recent studies also address global migration and include for example Abel (2013), Abel and Sander (2014), and Azose and Raftery (2019). However, applying these methods directly to refugee migration does not work for two main reasons. First, these methods rely on differences in contingency tables of general migration, so the estimates they provide represent general migration flows and not refugee migration flows. Second, these methods do not account for the fact that refugee migration, by definition, does not allow for returning to the country of birth.
Asylum Applications
Data on asylum applications, as collected and published by the UNHCR, is sometimes used as a proxy for short-term refugee migration flows (e.g., Abel et al. 2019; Matsui and Raymer 2020). However, this data suffers from shortcomings, such as multiple counting. Matsui and Raymer (2020) address this problem in their analysis by using only positive first-instance asylum applications, but this means that in some cases, the data may not accurately reflect the actual destinations of refugees, but rather transit countries. This was prominently observed in Europe between 2015 and 2016 when a significant number of asylum seekers travelled across Europe (see, for example, UNHCR 2018). Another reason to be cautious when using positive first-instance asylum application data as a proxy for refugee migration patterns is the substantial deviation from flows obtained via stock differencing, as mentioned earlier.
Stock Differencing
Stock differencing and dropping resulting negative values is another common method used to approximate refugee migration flows (e.g., Moore and Shellman 2007; Dreher, Fuchs and Langlotz 2019). While this approach is simple and easy to implement, the resulting flows only capture the two dimensions place of birth and destination, and their accuracy is limited mainly due to the disregard for demographic accounting (for a more detailed explanation see Abel and Cohen 2019).
As a result, directly gathered data on refugee migration flows only exists for a limited number of countries and is subject to various limitations. Additionally, applying existing indirect estimation methods to obtain refugee migration flows or simply differencing stock figures has significant drawbacks. The key contribution of this paper is the development of a framework that applies a state-of-the-art migration estimation method to the separate study of refugee migration, resulting in five successive refugee flow tables for 193 countries from 1990 to 2015. These estimates provide new and more detailed insights into refugee migration patterns, benefitting various research areas, including demography, geography, and economics. This new methodology improves upon previous methods and estimates in three important aspects. First, it eliminates the need to directly collect flow data, instead relying on more complete and available stock data. Second, the estimates are derived using an established demographic accounting method that has been adjusted to produce estimates that respect the limitations inherent in the definition of refugee migration. Third, the resulting estimates are along three dimensions: place of birth, origin, and destination, which is more detailed than simple stock differencing. However, a current limitation of the framework is the availability of the required data in only five-year spans (as opposed to annual data), which can only be overcome with more frequent data in the future.
Methodology
Quantifying (refugee) migration is commonly accomplished through the use of either migrant stocks or migration flows. Stock figures represent the number of migrants who are residing in a country at a particular point in time, while flow figures represent the number of migrants who enter or leave a country within a specified time period. Typically, the data is displayed in square tables where rows represent places of birth or alternative measures such as citizenship or places of origin, and columns represent places of residence (Abel 2013; Abel and Sander 2014).
Basic Model
First, let us assume that refugee status is lifelong and that all the migration that is happening in the example is refugee migration. This condition will be dropped in the subsection “Model Extensions”, but for now, it is essential to estimate refugee migration flows instead of general or mixed migration flows. Second, consider two consecutive migrant stock tables as represented in the top panel of Table 1. Values in non-diagonal cells show some sort of movement, whereas values in diagonal cells represent the native-born population, i.e., people whose place of residence matches their place of birth. To keep it simple, we assume that there are no births and deaths, meaning that the row totals must remain the same in t and
Deriving Bilateral Flow Tables from Consecutive Stock Tables Based on Example Data.
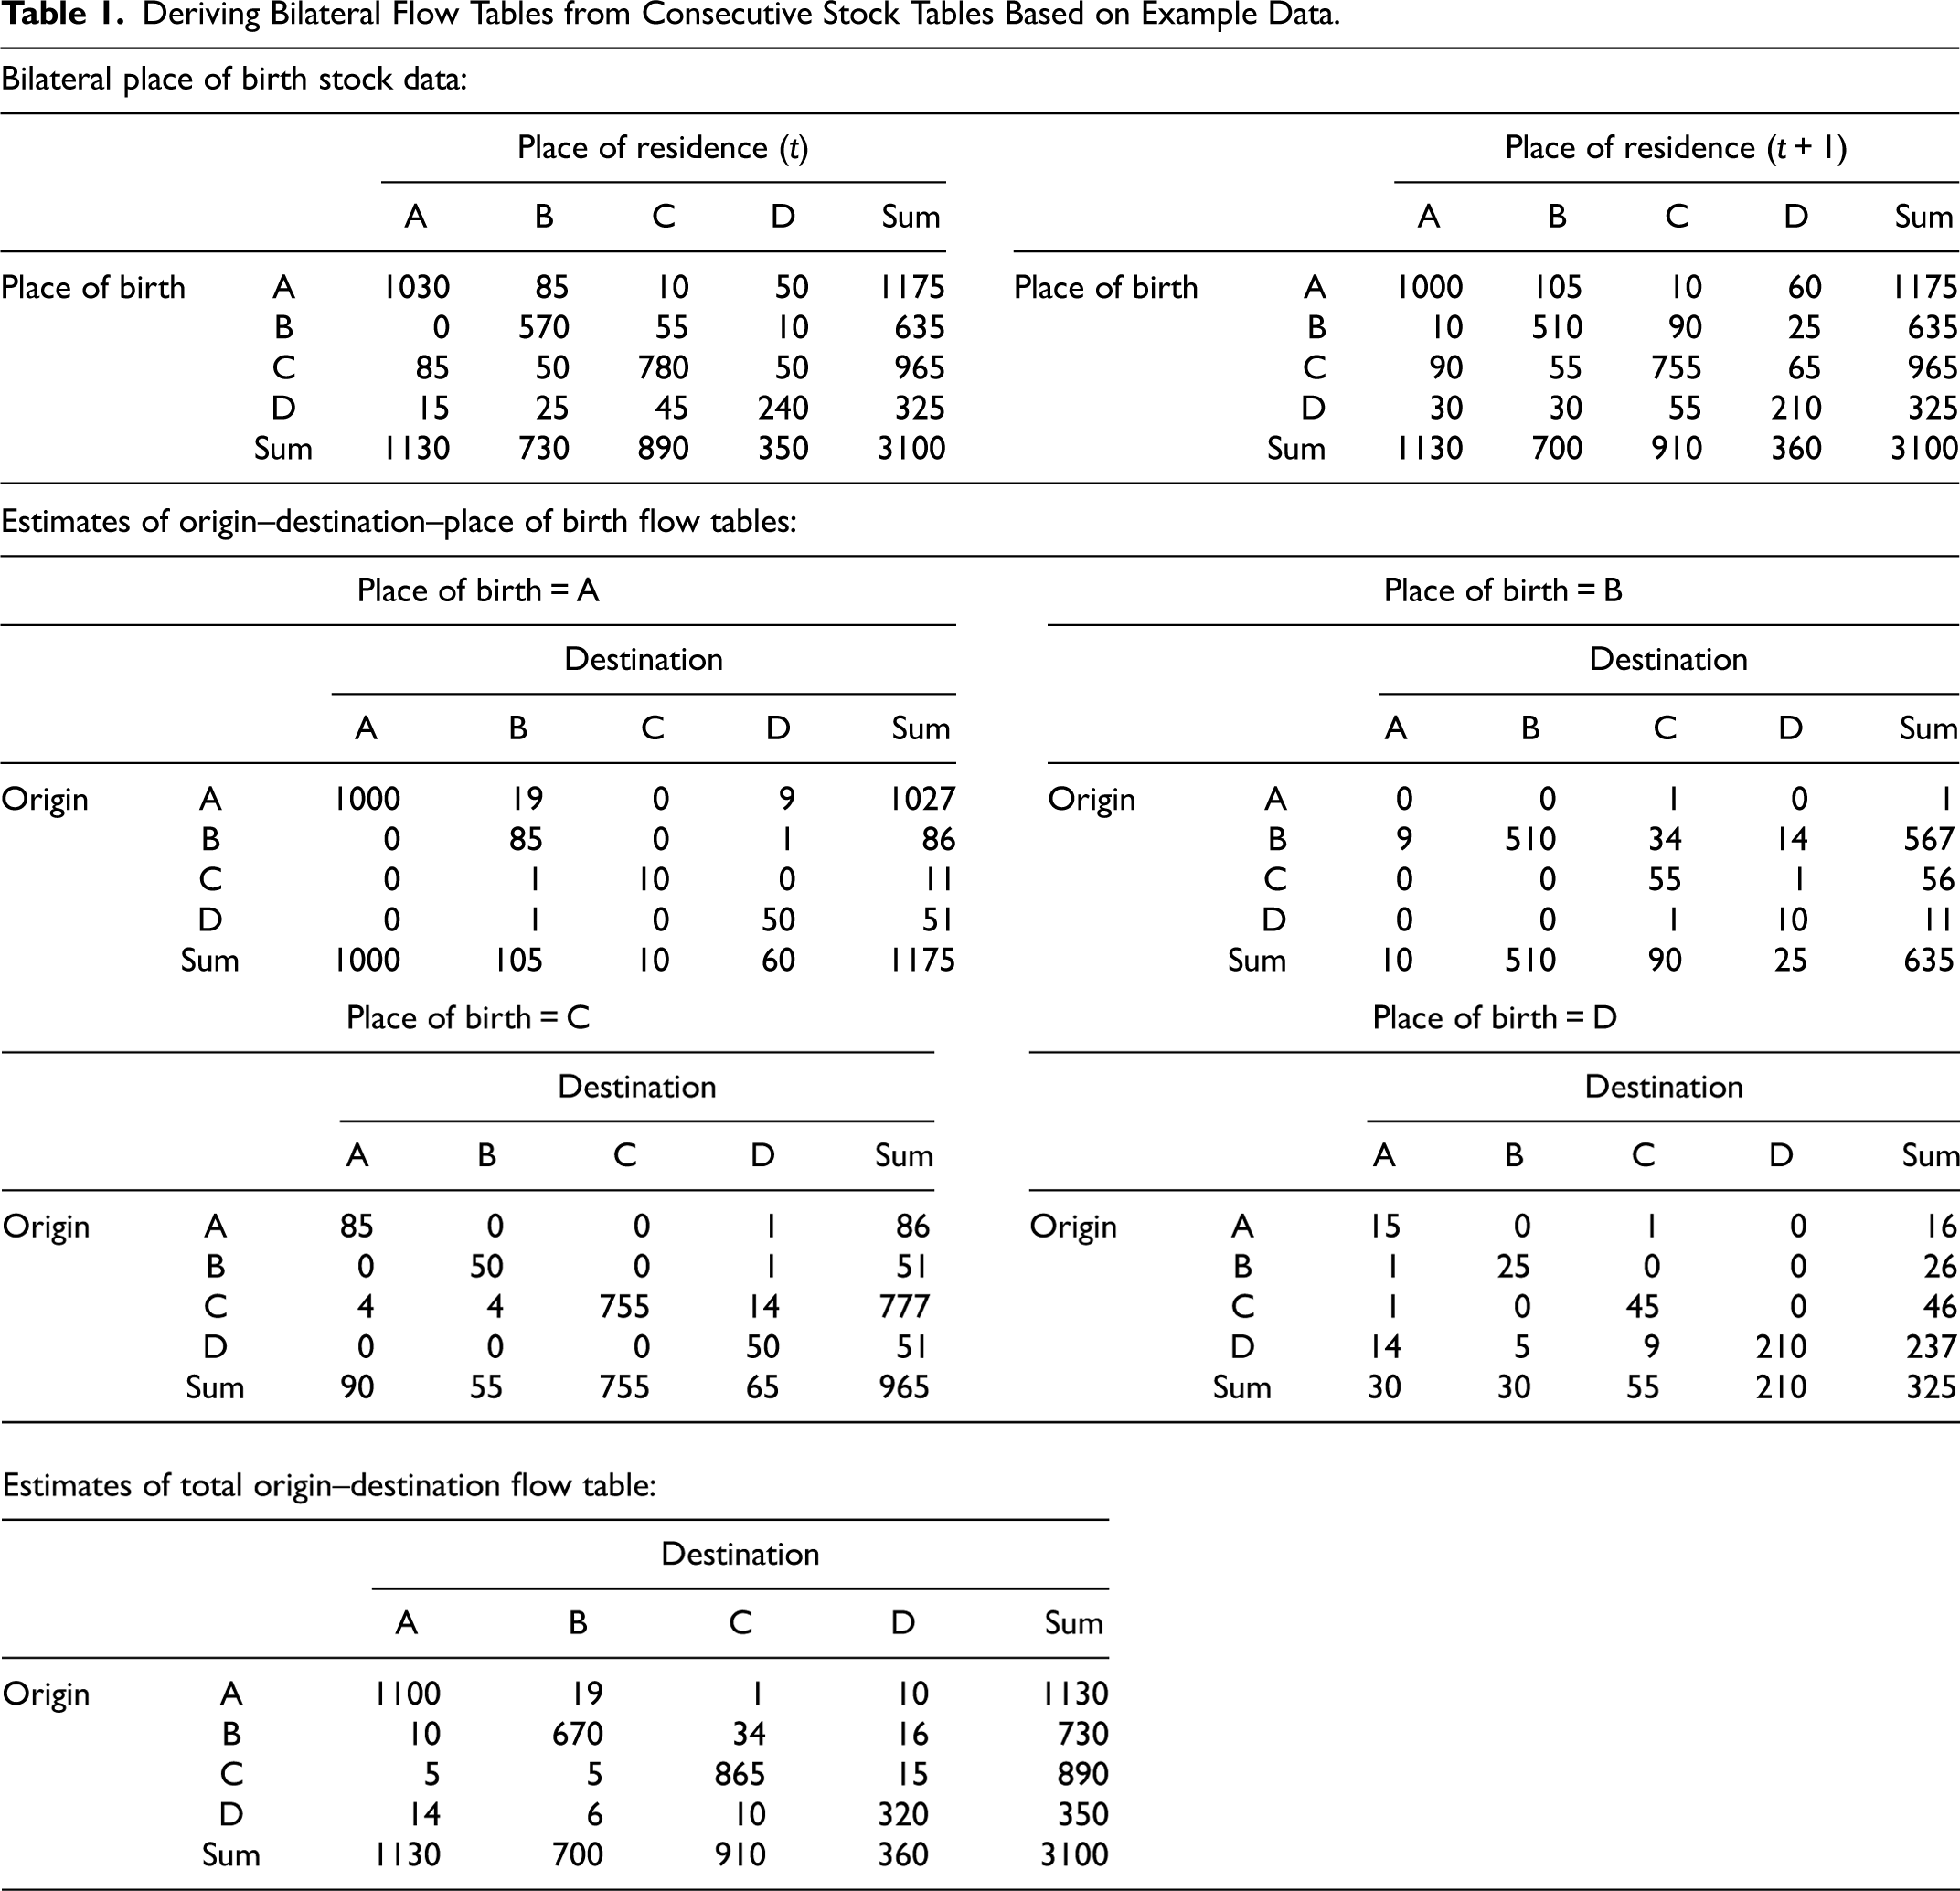
Abel (2013) showed that these stock tables can be represented as birthplace-specific origin–destination flow tables, where only the margins are known. The missing non-diagonal entries represent migrant transition flows from origin i to destination j, while the missing diagonal cells represent so-called stayers, individuals whose place of residence at time points t and
To link distance and the variable of interest, consider a spatial interaction model as described by Willekens (1999) and further developed by Abel (2013) along with the extension for refugee migration:
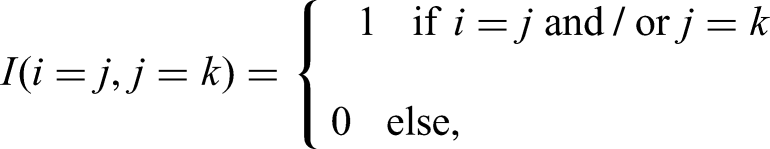
To account for both stayers and returnees, first, following Abel (2013), all diagonal entries in each flow table are fixed to their maximum possible values. This constraint ensures that our estimation only reflects refugee transitions and effectively sets the diagonal cells to the minimum of their corresponding marginal values. Consequently, aggregated estimated non-diagonal values represent a lower bound of overall refugee transition flows. Second, we set cells with matching place of birth and destination to zero. This restriction is inherent in the definition of refugees, which requires the person in question to cross the border of their country due to persecution, war or violence.
Complete observations on refugee migration flows are related to the unobserved data through a probability distribution. To specify the probability model, we assume that the number of refugee transition flows between origin i and destination j is drawn from a Poisson distribution. Poisson regression is a common approach to model count data, such as the number of migrations within a unit of time. This approach relies on the assumptions that (refugee) migrations occur independently of each other, at the same rate, meaning that the mean of the Poisson variable equals its variance, and that they occur within a fixed time interval.
Let 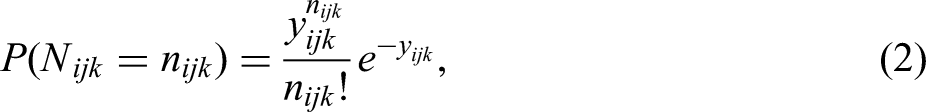
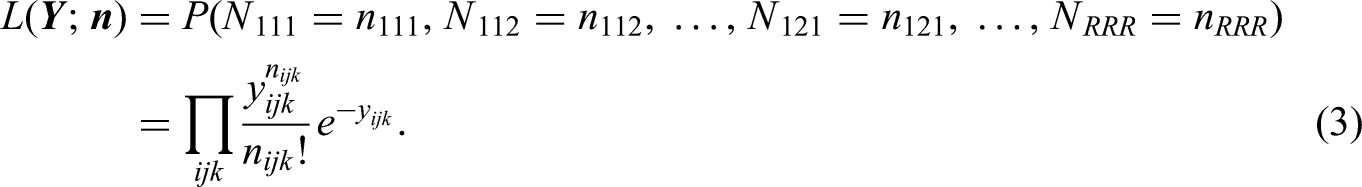

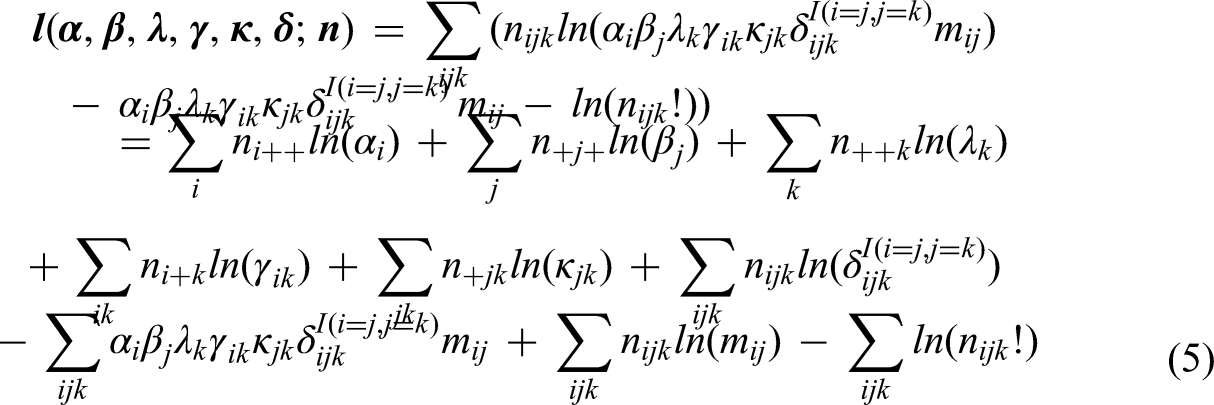
Estimating the model yields maximum likelihood estimates of
Applying the described method to the dummy example in the upper panel of Table 1 returns estimated values for each birthplace-specific table. The results are displayed in the middle panel of Table 1. By aggregating these tables, estimates of the total origin–destination flows, as depicted in the bottom panel of Table 1, can be obtained. To perform the estimation, the R package migest (Abel 2018b) was used, including a slight extension to the incorporated ipf3_qi routine, which had to be adjusted so that cells with matching place of birth and destination were set to zero. The function arguments were set to d_por = rep(0,4), b_por = rep(0,4), and stayer_assumption = TRUE. The offset term was automatically fixed to
Model Extensions
So far, it has been possible to attribute differences between consecutive stock tables exclusively to refugee migration, which is a crucial aspect of the model and essential for estimating refugee transition flows as outlined. However, this required two key assumptions to make the estimation practical and ensure that consecutive stock totals matched. First, the assumption was made that refugee status is lifelong and that refugee migration is the only type of migration. Second, natural changes in population due to births and deaths were disregarded. To incorporate general migration into the model, the first assumption must be dropped. Consequently, additional steps are necessary to attribute differences between stock tables exclusively to refugee migration. In addition, allowing for natural changes is likely to result in differences in row totals between consecutive stock tables, which must also be addressed. Finally, the model must account for any remaining unequal row totals.
In this subsection, the extensions are incorporated into the model and depicted on the basis of a new set of hypothetical place of birth stock data, which is presented in the upper panel of Table 2. Note two things: first, in contrast to the previous dummy example (Table 1), row totals between t and
Deriving Bilateral Flow Tables from Consecutive Stock Tables Based on Example Data.
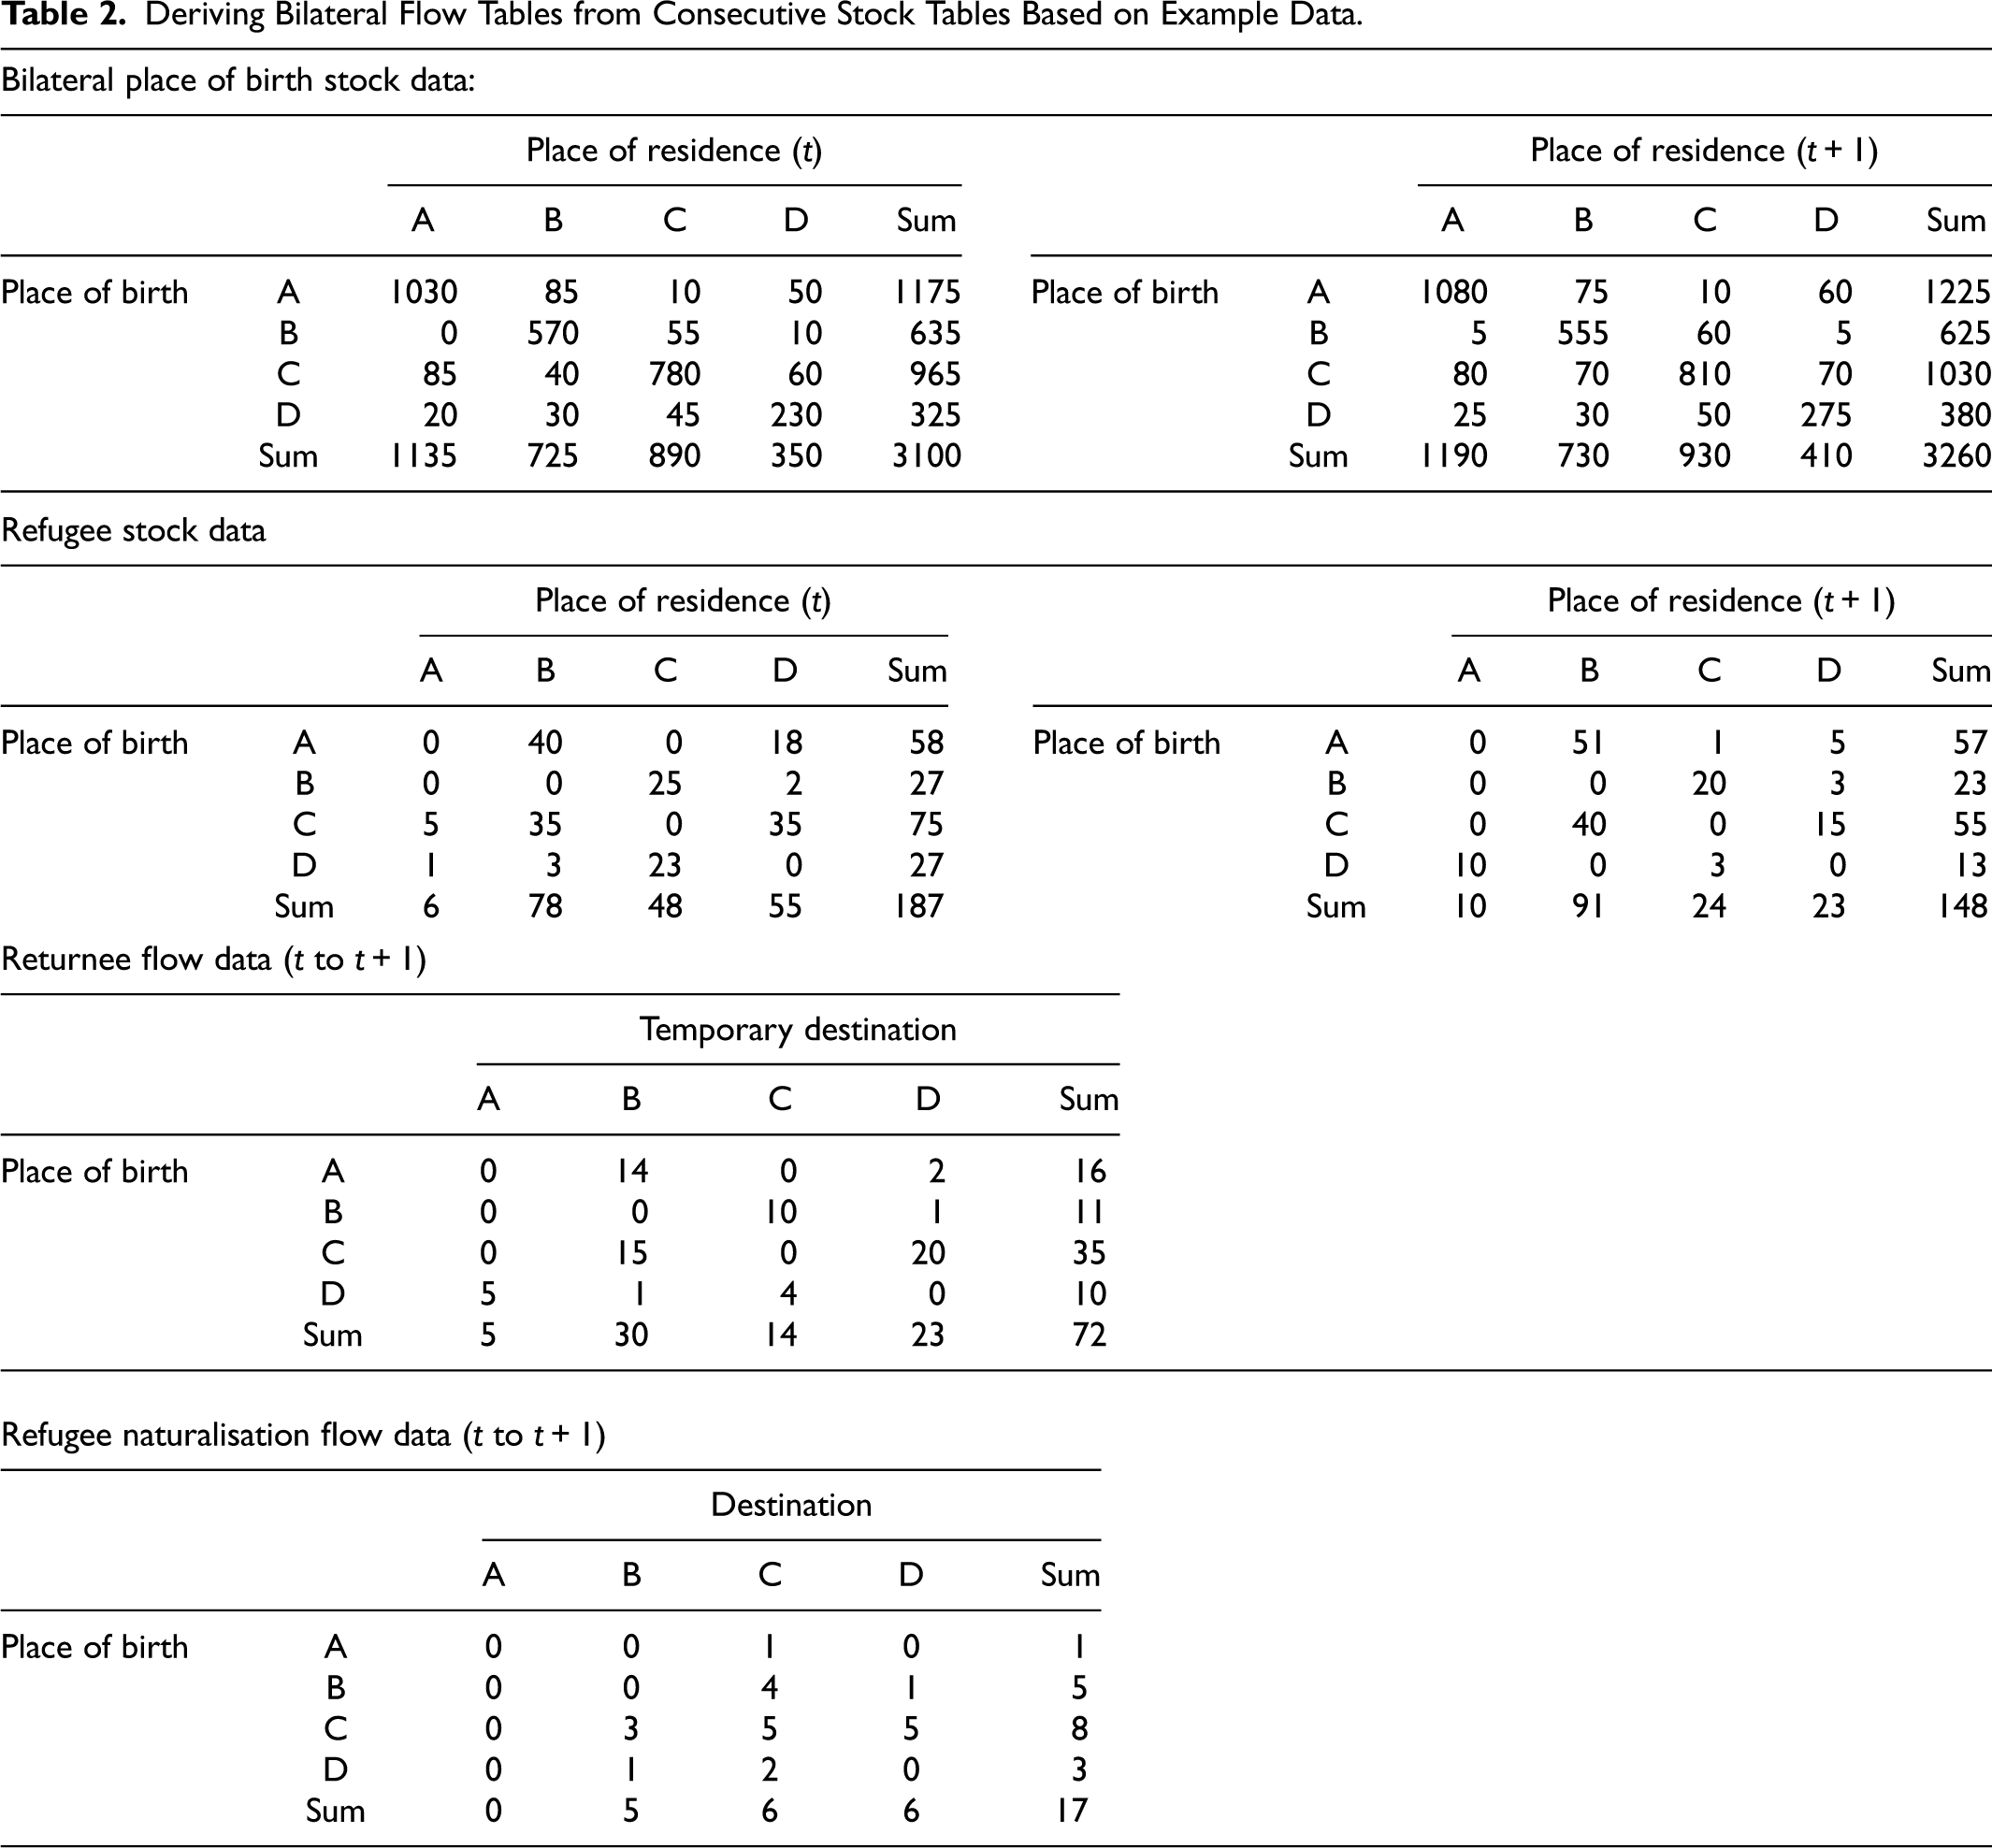
In the subsection “Model Extensions” of the Supplemental Appendix S1, a detailed description of the steps taken to prepare the stock data is provided. In summary, the process involves multiple steps. First, non-refugee migrants, returnees, and naturalized refugees are reallocated to correct for non-refugee migrations and naturalisations. This results in two estimated place of birth stock tables, as shown in Table A-1 of S1. In these tables, the only remaining type of migration is refugee migration. Second, births and deaths are taken into account to prevent changes in stocks from being mistakenly attributed to refugee migration flows, even if they result from natural changes in population. To achieve this, the number of deaths between t and
In contrast, Abel and Sander (2014) introduced a closed demographic accounting system where migrations take place only within the set of countries under observation. They apply a simple algorithm which equally scales each stock so that differences between their row margins match. However, estimating refugee flows based on this approach resulted in strange flows that have no match in the real world. For completeness, estimates obtained using the closed demographic accounting system are listed in the Online Supplementary Material.
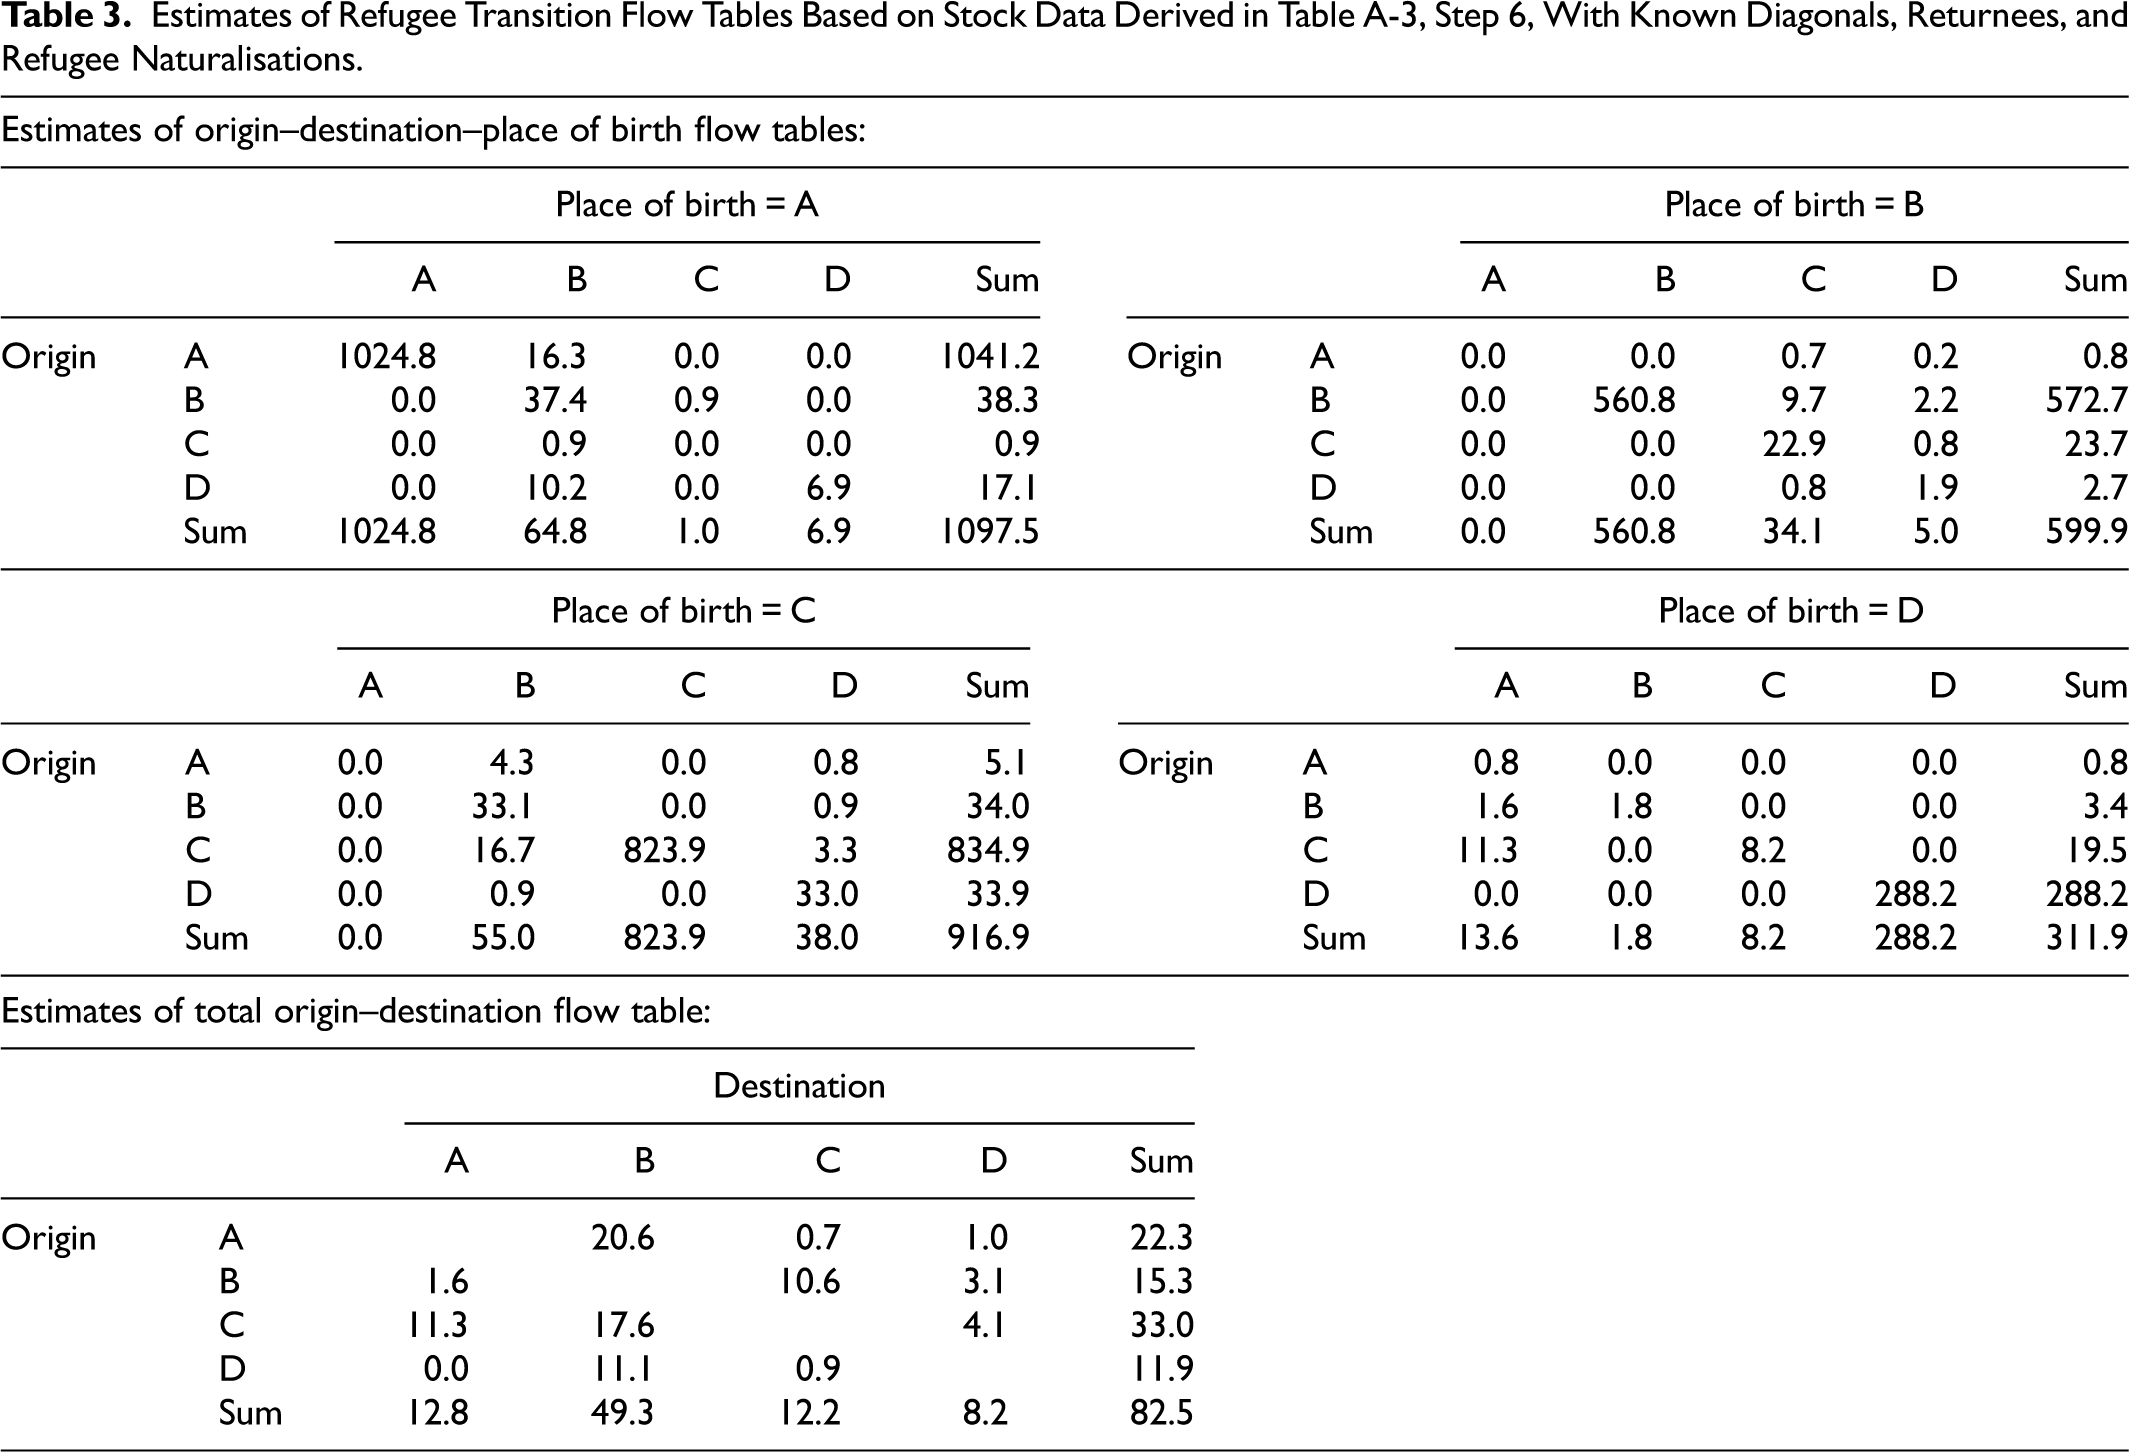
As in Table 1, the re-re-estimated stocks from Step 6 of Table A-3 in the Supplemental Appendix can be seen as four birthplace-specific flow tables. Applying the outlined estimation methodology to the prepared data yields the maximum likelihood estimators
Estimates of Refugee Transition Flow Tables Based on Stock Data Derived in Table A-3, Step 6, With Known Diagonals, Returnees, and Refugee Naturalisations.
Results
This section outlines the application of real-world data to the above model, followed by an overview of the results. To provide a comprehensive analysis of the estimated flows and to contextualize the changes observed, a graphical representation is given alongside a brief interpretation of historical events. The ensuing summary highlights notable features of the global refugee migration system, and, lastly, the limitations of the estimates are discussed.
Application
The United Nations (2015a) provides migrant stock data for a total of 232 countries, in five-year intervals starting from 1990 and referring to mid-year values (1 July to 30 June). Most of the data is based on population censuses, with additional information obtained from population registers and nationally representative surveys. When necessary, refugee statistics from international agencies were included and the United Nations imputed data with divergent reference dates (United Nations 2015b). However, since these migrant stocks do not include numbers on the native-born population, as required for the estimation methodology outlined above, additional data from the United Nations (2017) on annual mid-year population totals by region j,
The UNHCR's global database on populations of concern (UNHCR 2017b) is publicly available and includes annual end-year refugee stocks, as well as returnee and naturalisation flows by place of origin and destination – analogous to the dummy example in Table 2 (middle and lower panel). 1 The data was primarily obtained from administrative sources and does not include numbers of Palestine refugees who fall under the mandate of the UNRWA (Eurostat 2018). 2 Note that with general migration, cross-border movements are sufficient to be part of the migrant population, but the situation is more complex in the context of refugee statistics. Persons may enter or exit the refugee stock at several points: by migration, naturalization, or changes in their international protection status (see Eurostat 2018). Consequently, estimated refugee flows based on the UNHCR refugee database do not necessarily represent cross-border movements at the time of entry into the stock but may reflect them with a time lag. Additionally, the UNHCR database is not free from data collection problems and has several shortcomings, such as undercounts and collection issues in general. To ensure compatibility across data sets, refugee and returnee data were imputed to their mid-year values, and missing data points were assumed to be zero. Furthermore, refugee origins labeled Various/Unknown or Stateless were dropped, resulting in a total loss of 6,460,639 observations (8.1 percent) within the considered periods.
Numbers of births and deaths were obtained from the UN's World Population Prospects (United Nations 2017). The data covers 201 countries and is measured in five-year steps from 1950 onwards. Unfortunately, information on the place of birth is not included, which would allow for a more precise estimation of natural changes in the population.
Overall, complete data on 193 countries were available and used to estimate quinquennial global refugee transition flows between 1990 and 2015. 3 Only five of the countries that had to be dropped had populations exceeding 100,000 people in 2015. 4 The remaining missing countries were almost exclusively small islands located in the Caribbean.
The offset term was specified as
The multi-step demographic correction method, as presented in Tables A-1, A-2, and A-3, was first applied to the prepared data. Then, the six resulting migrant stock tables were used to estimate 193 birthplace-specific refugee transition flow tables per period, starting from 1990. A list containing all included countries and their associated classifications can be found in the Online Supplementary Material.
Summary of the Estimation Results
A comprehensive graphical representation of the estimated flows is presented in the form of chord diagrams, as illustrated in Figure 1. Each circular plot, created using the R package circlize (Gu et al. 2014), showcases the aggregated refugee transition flows on a regional level and within a specific time frame. The regions were defined according to the United Nations (2015a) classification, and in some cases, further generalized. Note that the chord diagrams do not provide information about the place of birth, but rather display origin–destination flows, which are equivalent to Table 3, bottom panel. This type of visualization offers an intuitive understanding of the (larger) refugee flows and their direction, facilitating the comprehension of general spatial patterns. For a more detailed analysis and to identify the specific countries involved, Table 4 presents the ten largest estimated country-to-country inflows (upper panel) and outflows (lower panel) for each interval.
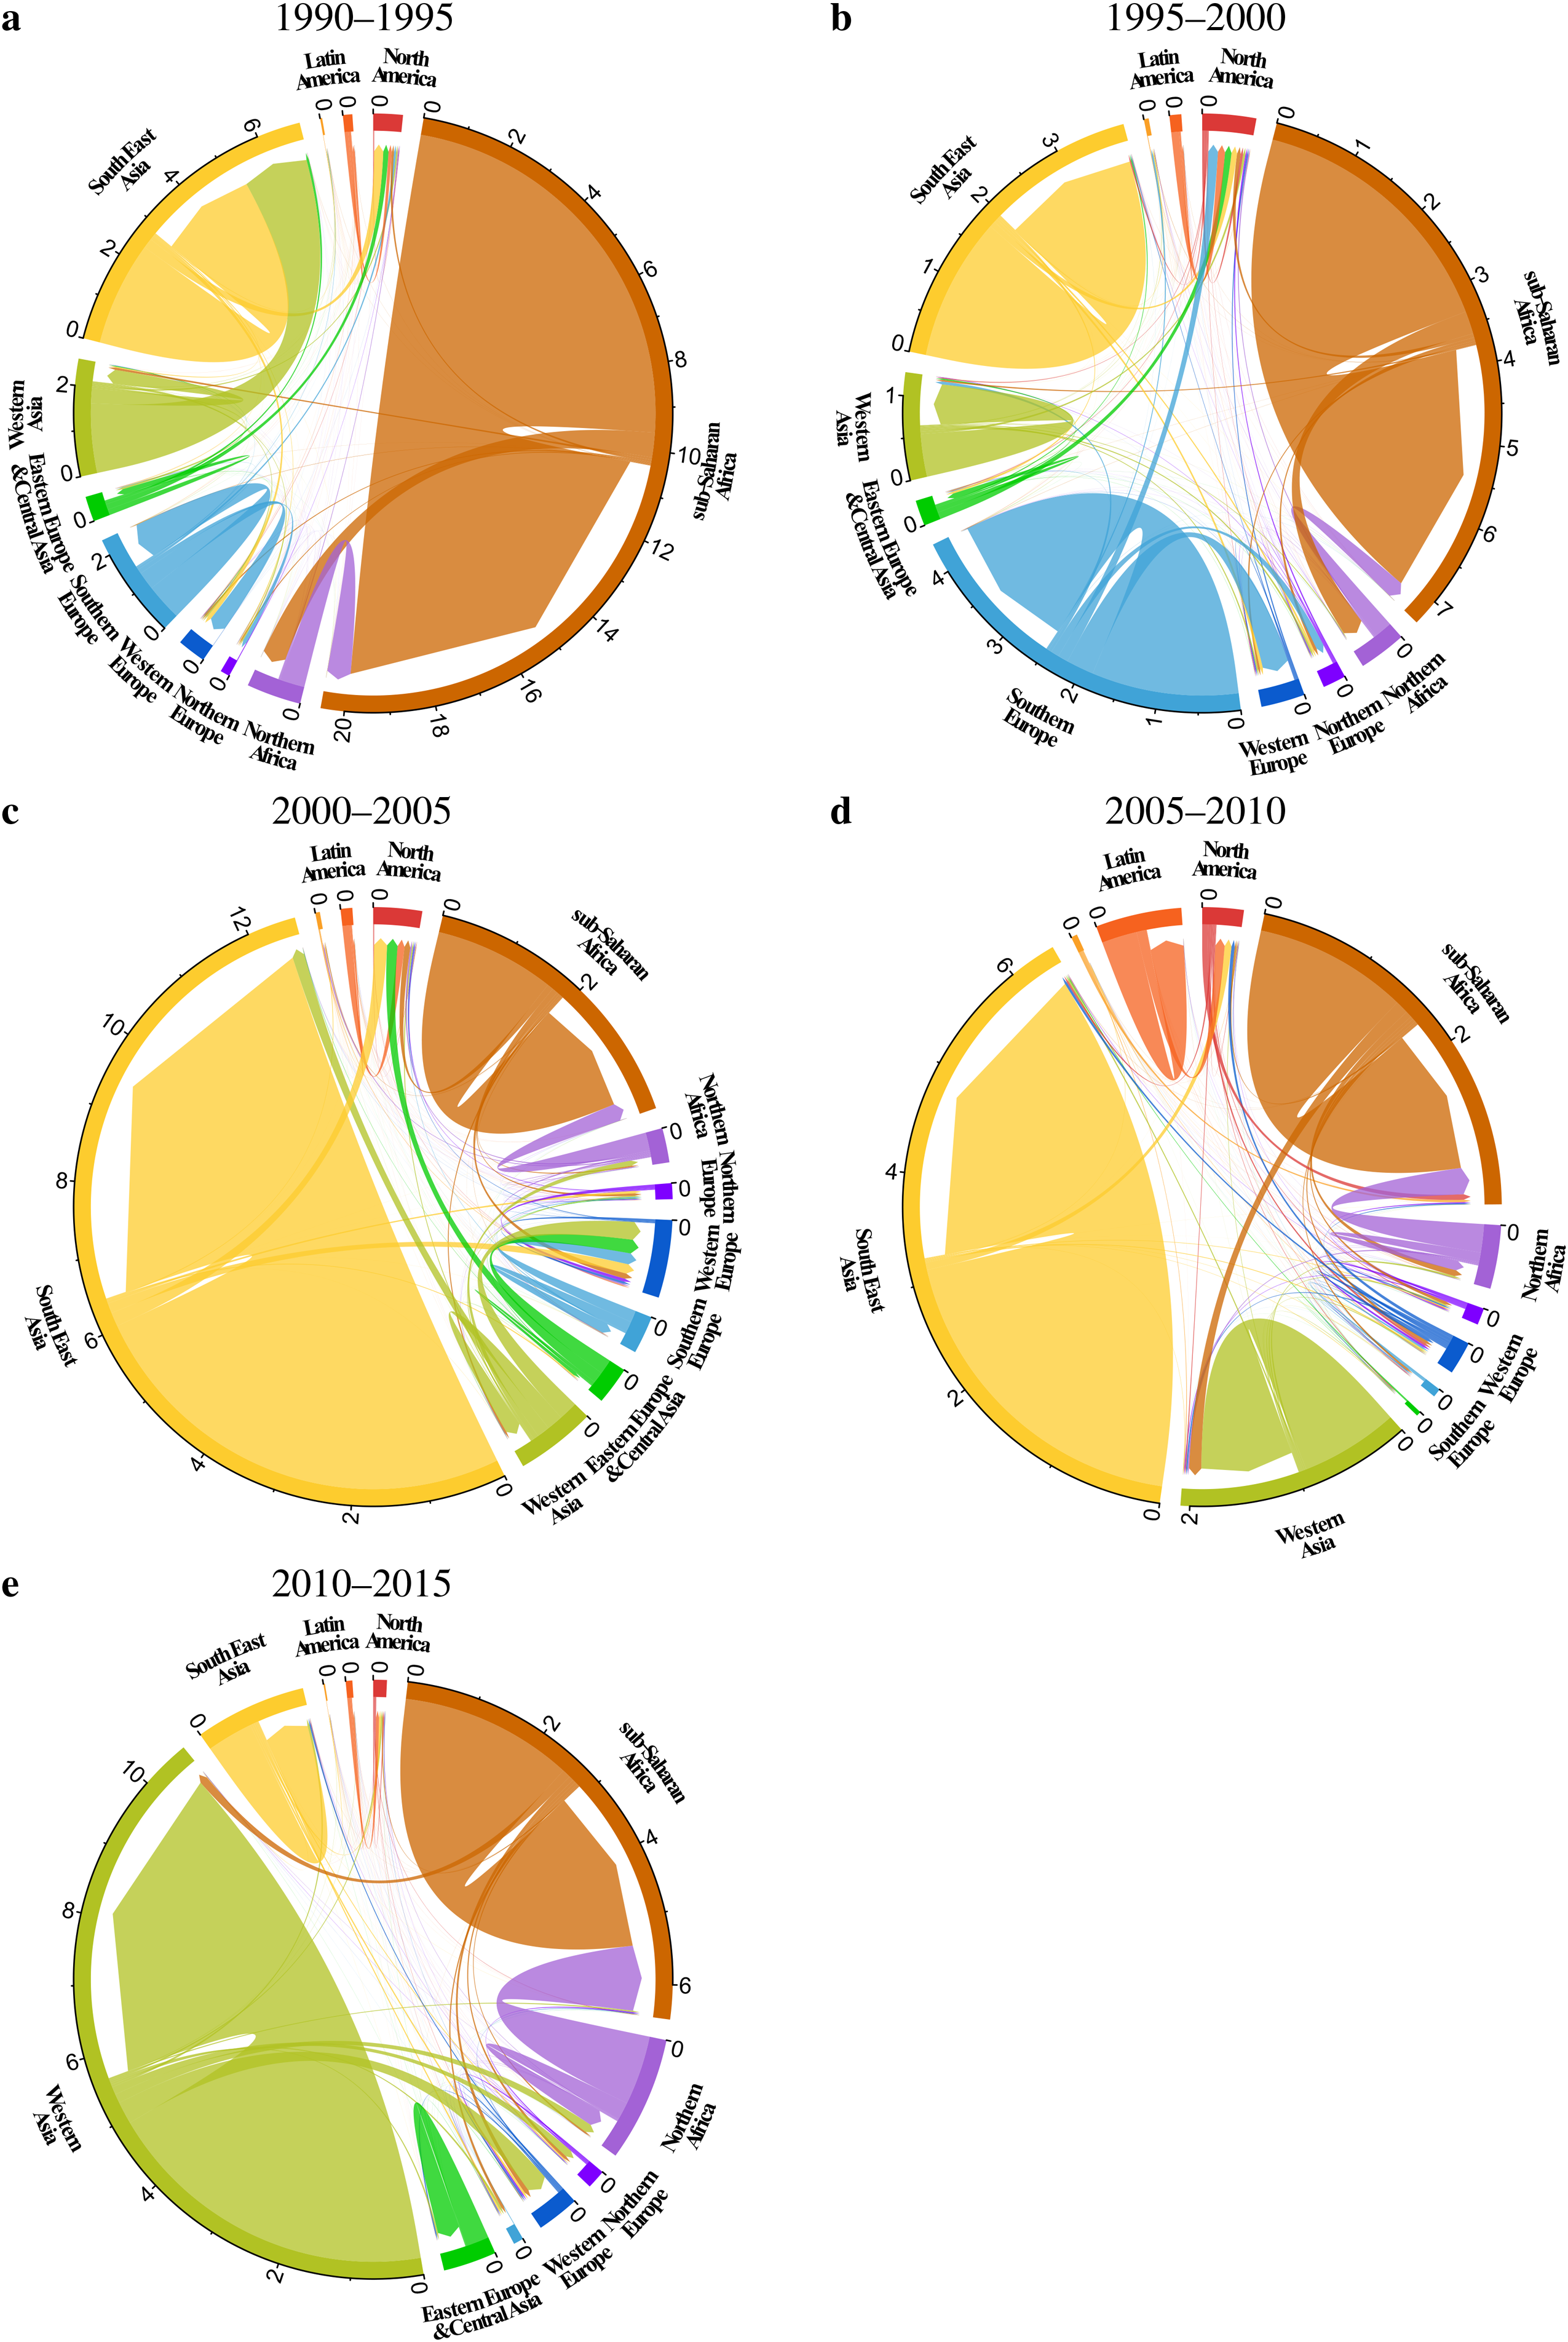
Estimated five-year refugee transition flows between and within world regions. Tick marks show the number of refugees (inflows and outflows) in millions.
The Top Ten Largest Estimated Five-Year Refugee Transition Inflows (Upper Panel) and Outflows (Lower Panel).
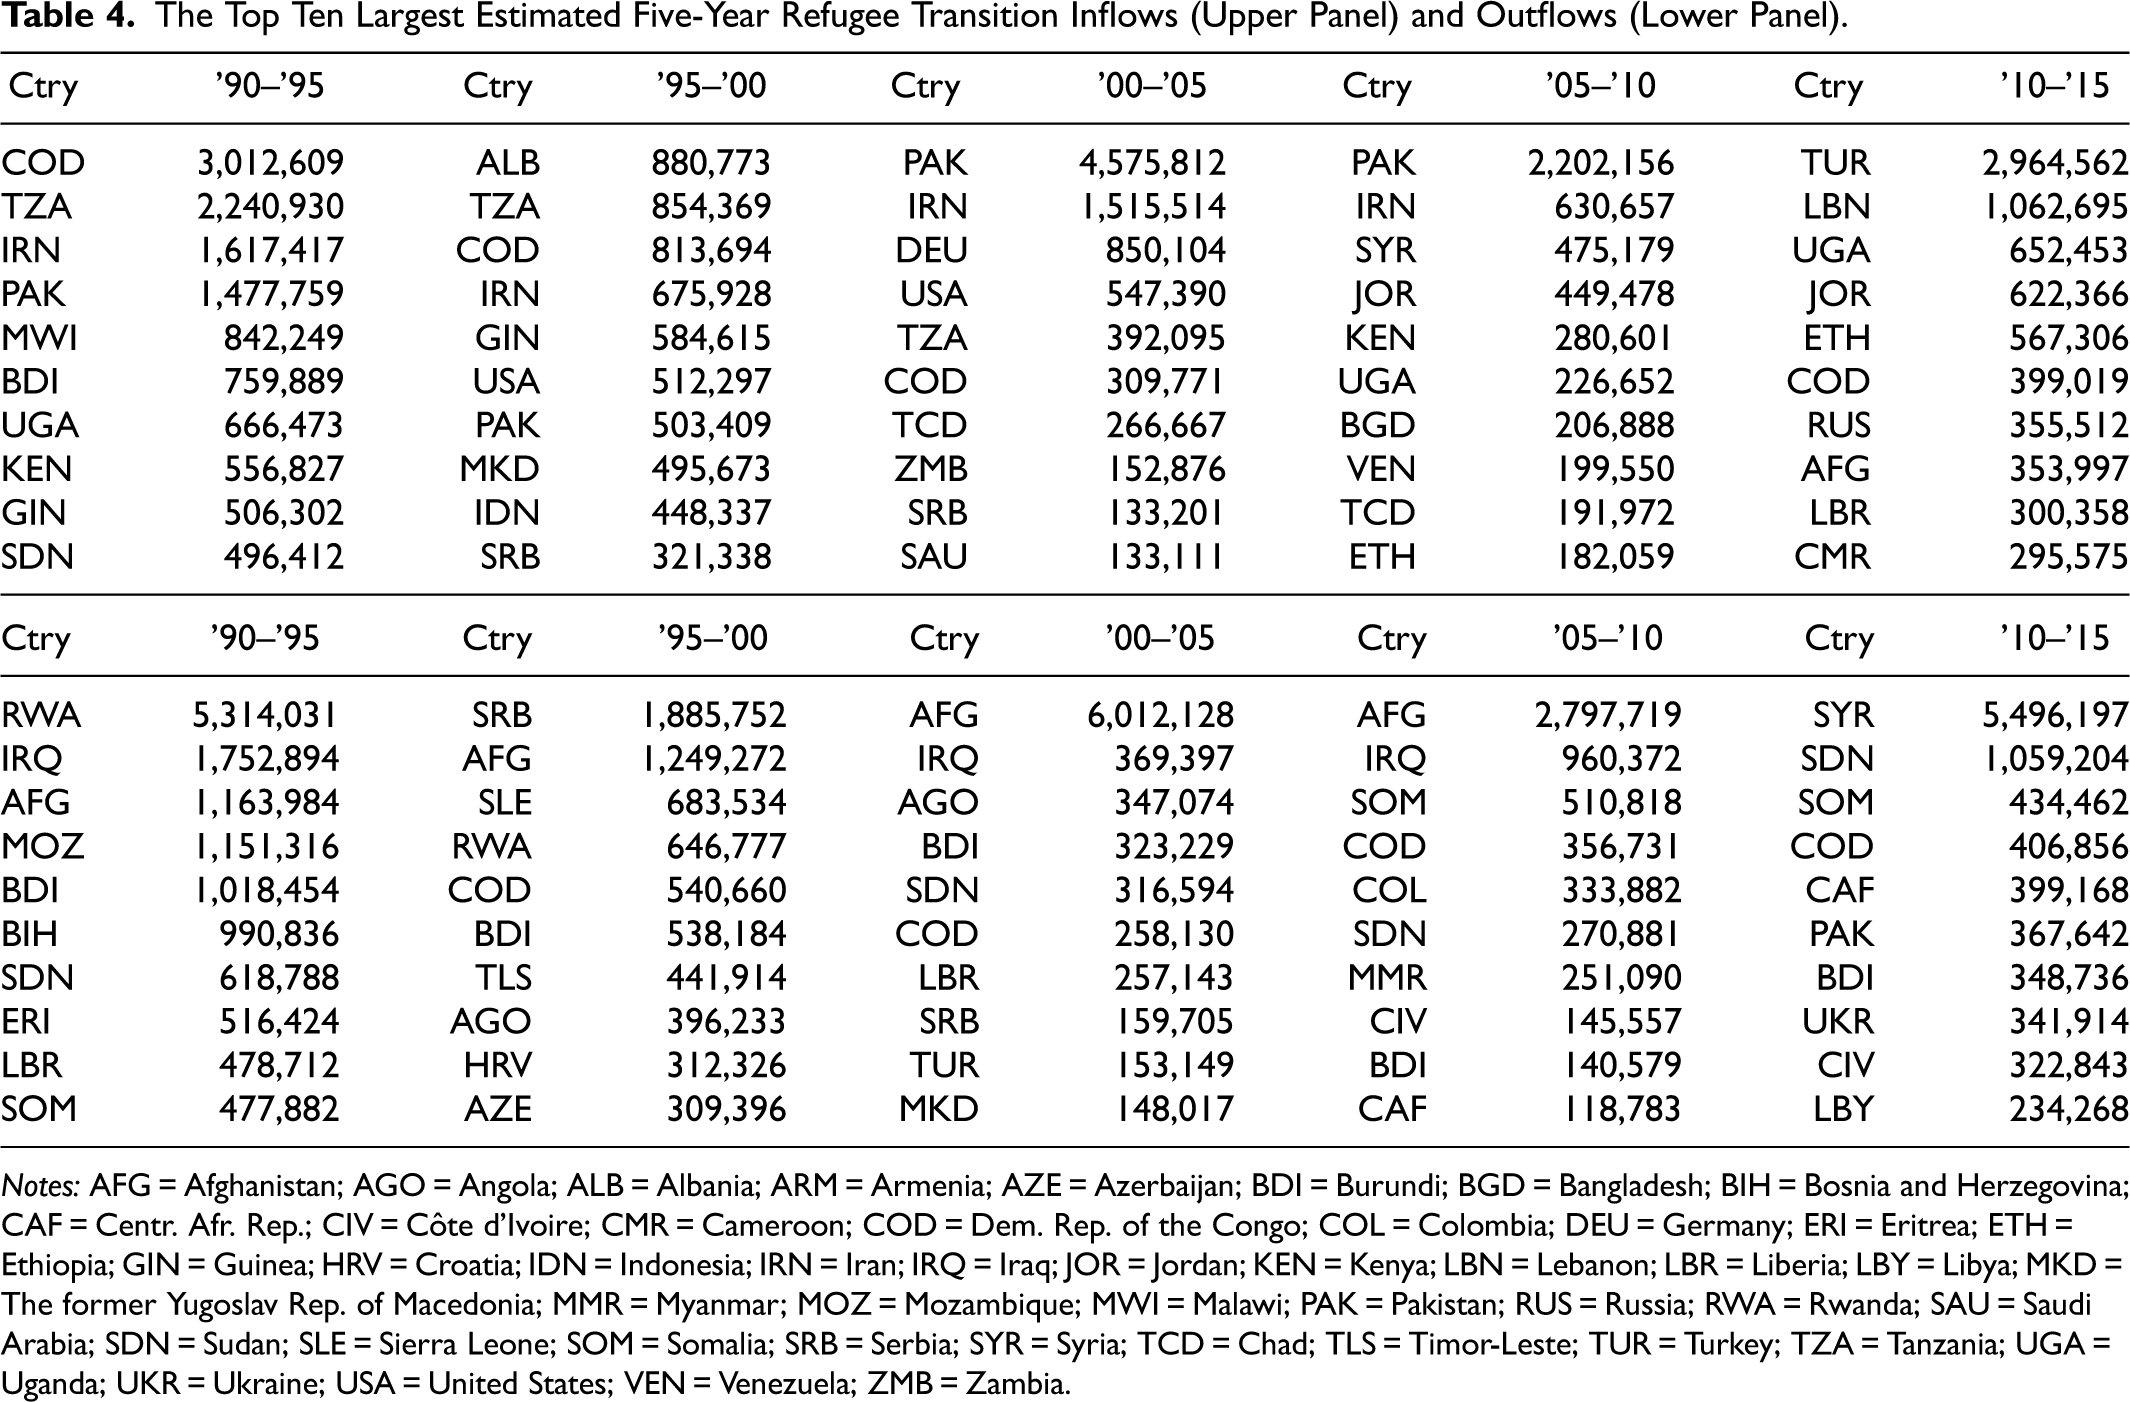
Notes: AFG = Afghanistan; AGO = Angola; ALB = Albania; ARM = Armenia; AZE = Azerbaijan; BDI = Burundi; BGD = Bangladesh; BIH = Bosnia and Herzegovina; CAF = Centr. Afr. Rep.; CIV = Côte d’Ivoire; CMR = Cameroon; COD = Dem. Rep. of the Congo; COL = Colombia; DEU = Germany; ERI = Eritrea; ETH = Ethiopia; GIN = Guinea; HRV = Croatia; IDN = Indonesia; IRN = Iran; IRQ = Iraq; JOR = Jordan; KEN = Kenya; LBN = Lebanon; LBR = Liberia; LBY = Libya; MKD = The former Yugoslav Rep. of Macedonia; MMR = Myanmar; MOZ = Mozambique; MWI = Malawi; PAK = Pakistan; RUS = Russia; RWA = Rwanda; SAU = Saudi Arabia; SDN = Sudan; SLE = Sierra Leone; SOM = Somalia; SRB = Serbia; SYR = Syria; TCD = Chad; TLS = Timor-Leste; TUR = Turkey; TZA = Tanzania; UGA = Uganda; UKR = Ukraine; USA = United States; VEN = Venezuela; ZMB = Zambia.
Circular plot 1a identifies sub-Saharan Africa as the region with the highest refugee outflow and inflow between 1990 and 1995. Remarkably, sub-Saharan Africa is estimated to have hosted over 57 percent of the emerging global refugees during the early to mid-1990s, with the region itself accounting for more than half of them. At the country level, the largest outflows during this period mainly originated from African and Asian nations, as indicated in Table 4 (lower panel). Rwanda, due to the outbreak of the Rwandan Civil War, generated the highest estimated number of refugee transition flows (>5.3 million) and held this unfortunate record for almost a decade until the escalation of the War in Afghanistan following the 9/11 attacks. Another significant outflow occurred due to Iraq's invasion and annexation of Kuwait in 1990, leading to the First Gulf War, with the majority of the displaced individuals finding refuge in Iran. In Europe, despite being relatively peaceful in the aftermath of World War II, the impact of the Bosnian War is evident. The largest and second-largest arrows originating from Southern Europe predominantly represent flows from Bosnia and Herzegovina to Germany and Croatia, and to a lesser extent, from Croatia to Serbia.
Between 1995 and 2000, a significant portion of the refugee inflows and outflows continued to take place in sub-Saharan Africa. However, compared to the previous five-year period, the distribution of refugee numbers across the African countries became more balanced. As a result, two non-African countries, Serbia and Afghanistan, dominated the refugee outflows. The Taliban seizing power over most of Afghanistan, including the capital Kabul, and the establishment of a totalitarian and brutal regime triggered a substantial exodus of people, with Iran and Pakistan being the primary host countries according to the estimates. In Southern Europe, the Kosovo War caused substantial migrations to neighbouring countries and, particularly, Germany.
From 2000 through 2005, the focus shifted from Africa to Asia, with the region as a whole accounting for more refugee outflows and inflows than sub-Saharan and Northern Africa combined. The intervention in Afghanistan, led by the Bush-Cheney administration in response to the 9/11 tragedy, along with the United States-led military forces invading Iraq in 2003, were the main drivers behind this shift. Combined, these two Asian countries were the source of almost 6.4 million estimated refugee transition flows, with Afghanistan alone accounting for a record-breaking 6 million. The majority of Afghan refugees sought refuge in neighbouring Pakistan. Iraqi refugees, on the other hand, primarily fled to Iran and Germany, but also to countries such as Saudi Arabia, Syria, Lebanon, and Egypt in the Middle East, potentially explaining ensuing instabilities in the area.
The period between 2005 and 2010 exhibits similar patterns to those observed in the preceding five-year timespan. However, Western Asia experienced a larger share of refugee outflows and inflows, while the focus on South East Asia weakened due to a decrease in the number of refugees originating from Afghanistan. Moreover, Colombia's intricate internal conflict, characterized by decades of drug-related violence, manifests itself in estimated refugee flows, particularly towards neighbouring states such as Venezuela and Ecuador.
Syria dominated the subsequent period by producing close to 5.5 million estimated forced transitions. Most of the refugees were taken in by Turkey, Lebanon, and Jordan. African conflicts, predominantly between Sudan, South Sudan, and neighbouring states, were responsible for a significant part of inner Northern African movements and refugee streams from Northern to sub-Saharan Africa. Even the first consequences of the Ukrainian crisis can be identified through the emerging refugee influx into Russia.
Across all time periods, the largest estimated flows of people whose origins do not match their place of birth consist of native Afghans, Ethiopians, Somalis, and Palestinians. The estimates suggest that a significant number of Afghan refugees migrated from Iran to Pakistan during the periods from 1990 to 1995 (338,575) and 2010 to 2015 (45,867). This pattern could potentially be explained by repeated media reports about Iran's treatment of Afghan refugees, which sharply contrast with the warm welcome in Pakistan (see, for example, Rahi 2020; Shams 2020). The estimated flows between East and Horn of Africa countries from 1990 to 1995 include, for example, native Ethiopians fleeing Sudan to Kenya (65,789) and from Somalia to Kenya (51,741), as well as a stream of Somali-born refugees from Ethiopia to Kenya (50,510). These movements are most likely caused by civil wars, famine, and economic misery in the region. Driving factors include the collapse of the Somali government in 1991 and the subsequent civil war and humanitarian crisis. The repercussions of the pre-1991 Ethiopian Civil War, combined with the aftermath of a severe drought and ensuing famine in the 1980s, also contributed to these migration patterns.
Throughout all periods, the estimates reveal four notable features of the global refugee migration system. First, refugee flows from every region tended to be highly spatially concentrated, with larger flows primarily occurring within their respective regions. Second, Europe and North America received relatively evenly distributed refugee flows from all over the world, indicating their attractiveness as destinations even across larger distances. In contrast, Africa was not a preferred destination, attracting very few refugees from other parts of the world. Third, there was a shift in focus from African to Asian countries. Although African countries combined dominated the size of refugee inflows and outflows during the 1990s, Asia took over as the primary destination, with its share of global refugee flows appearing to have stabilized at around a quarter to a third. Nonetheless, based on the flow estimates and United Nations (2017) population data, Africa still experienced higher per capita refugee inflows and outflows than any other region of the world, which is in line with Castles, de Haas and Miller (2013, 14), who confirm this finding for stock counts. Fourth, the estimates indicate a significant decrease in refugee transitions in the first two decades after the Cold War era (Figure 2). In relative terms, refugee transitions more than halved during this period, only showing a slight uptick from 0.11 percent to 0.16 percent in the last period. Nevertheless, the total number of refugee flows remained well below the corresponding figure from 1990 to 1995. Additionally, the share of refugee transitions in the world population consistently stayed below 0.17 percent after 1995 and remained relatively stable thereafter.
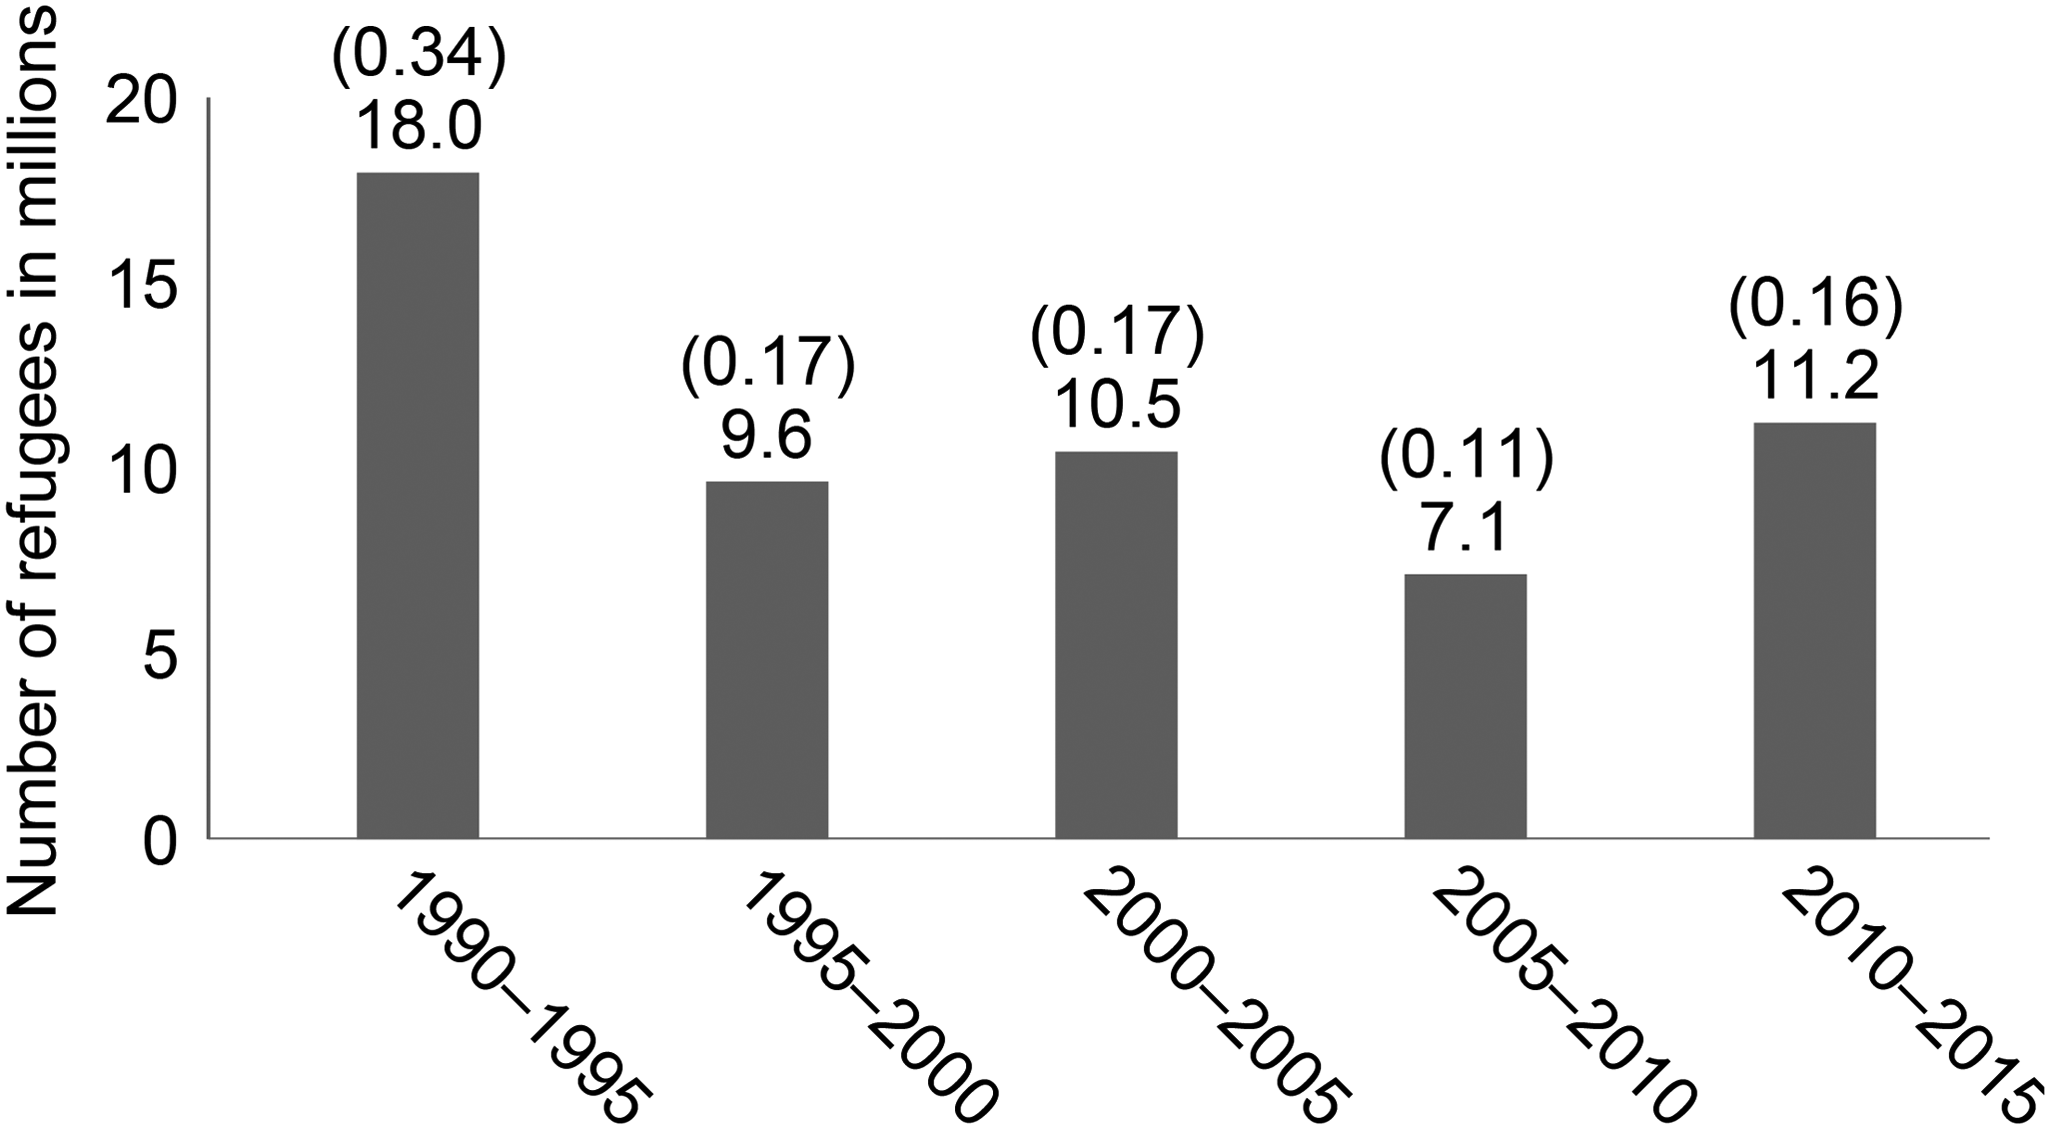
The global number of refugee transitions between 193 countries in five quinquennial periods, 1990 to 2015. Percentages (shown in parantheses) are calculated by using the world population at the beginning of each period.
Refugee stock figures offer valuable insights into long-term trends in refugee movements, while flow figures are more useful for analysing temporary tendencies in spatial patterns. Figure 3 displays flow estimates from 1990 to 1995 and 2010 to 2015 (top) in comparison with the underlying refugee stock data from 1990 and 2015 (bottom). The country labels developed, less developed, and least developed were chosen as defined by the United Nations (2015a). Both comparisons show considerably diverging patterns. Figure 3(a) reveals a 29-percentage-point lower share of refugee migration from the least developed to the less developed world compared to Figure 3(c). In contrast, the share of refugee migration between the least developed countries is 16-percentage-points higher, while within the developed countries, it is eight percentage points higher. These disparities are similar to those identified by Abel and Sander (2014) for overall global migration patterns and could, in fact, reflect “sudden changes in the global refugee migration regime driven by the fall of the Iron Curtain and armed conflicts in Asia and Africa” (Abel and Sander 2014, 1521). The similar outcomes, despite the different scope of migration versus refugee migration, further strengthen the argument, as Abel and Sander's less fluctuating results are expected as long as the differences are indeed predominantly driven by changing refugee migration patterns.
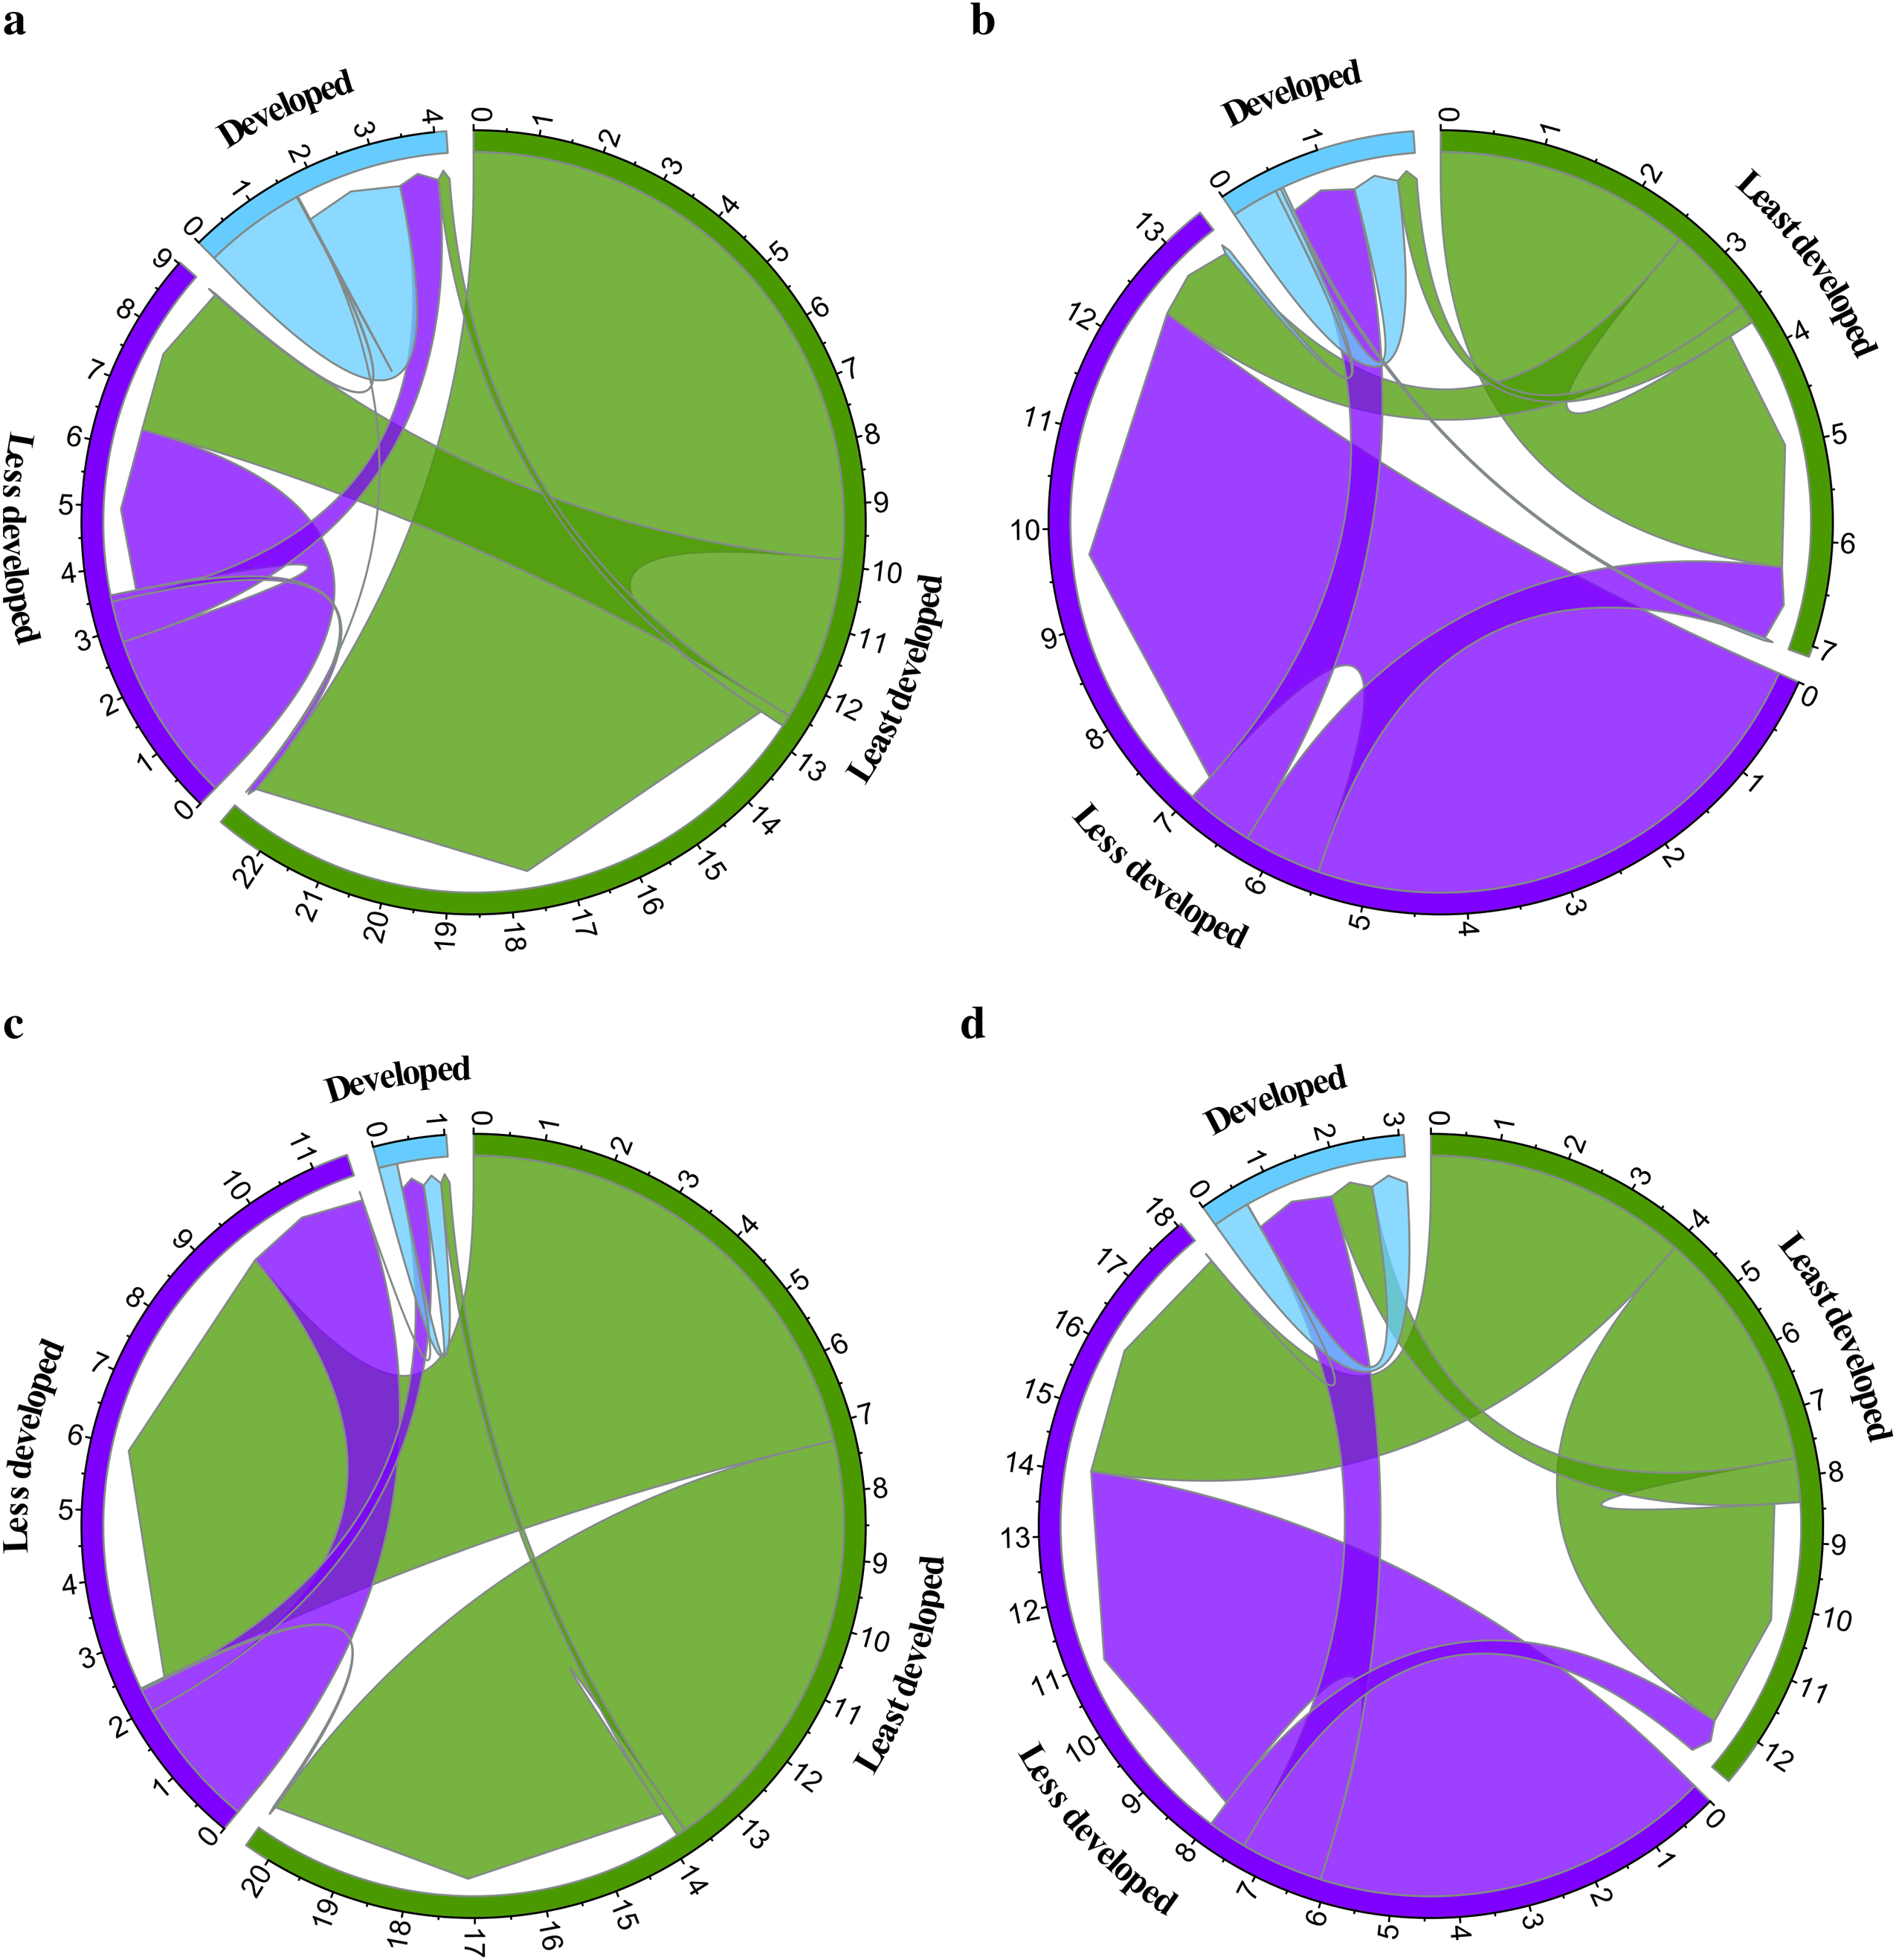
Comparing estimated refugee flows to stocks in the early 1990s and mid 2010s. Refugee transition flows between more developed (blue), less developed, (purple) and least developed (green) countries. (a) Flows during 1990 to 1995. (b) Flows during 2010 to 2015. (c) Stock data from 1990. (d) Stock data from 2015. Tick marks on the circle segments show the number of refugees (inflows and outflows) in millions.
The higher proportion of refugee migration between developed countries is primarily the result of a temporary short-term influence on refugee flow patterns caused by the Yugoslav Wars in Europe, which is not captured by the long-term trends reflected in the stock data. In comparison, Figure 3(b) and (d), display patterns much more alike. The most noticeable disparities are a 16-percentage-point lower share of refugee migration from the least to the less developed world and a 13-percentage-point higher share of refugee migration within the less developed world. These differences likely indicate the shift in focus from African to Asian countries, as mentioned earlier.
Table 5 presents the extent to which each region in the world is affected by refugee transition flows per capita. Throughout all intervals, Africa exhibits the highest relative involvement. Europe ranks among the top three regions in four of the five analysed periods, primarily due to internal flows within Southern Europe and Europe's overall attractiveness as a destination worldwide. Arguably, South America and, to a lesser degree, North America are comparably less affected by refugee inflows and outflows. This can be attributed to their significant distance from major conflict zones, their geographical location (largely surrounded by oceans), and relatively lower levels of internal continental refugee flows. Notably, this is remarkable in the case of the USA, considering its historical pattern of high overall migration inflows (see Zlotnik 1998; Abel 2013; Castles, de Haas and Miller 2013).
Refugee In- and Outflows Combined per Capita.
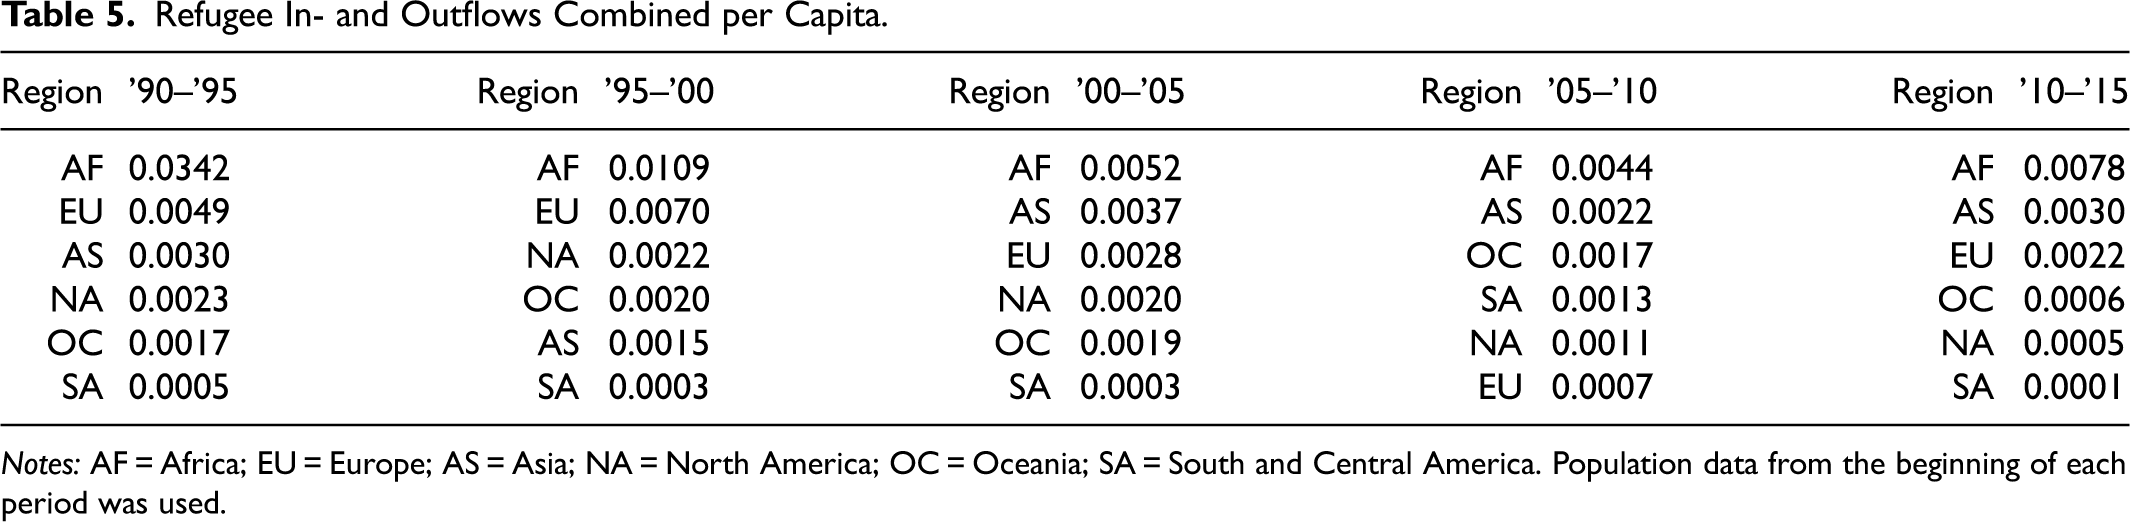
Notes: AF = Africa; EU = Europe; AS = Asia; NA = North America; OC = Oceania; SA = South and Central America. Population data from the beginning of each period was used.
Limitations
Recall that changes in the manipulated place of birth stock data can solely be attributed to refugee migration, as described in the methodology section. Therefore, these stocks can be used to derive flow estimates, which are ultimately based on differences between the stock figures. This implies that faulty data used to derive the final place of birth stocks could potentially distort the estimation results. For instance, consider a severe drop of refugees born in country A who resided in country B and let this drop be caused by returnees. If these returnee counts were not included in the UNHCR database, the difference in stocks would still show up in the data after applying the multi-step demographic correction method. Because estimated flows are constrained to match stock totals to balance out the stock differences, the decrease in the refugee stock of people from A residing in B would result in incorrectly estimated outflows to countries with an increase in A-born population. Other sources of potential estimation flaws include the linear imputation of both refugee stocks and returnee flows, as well as dropped refugee stock data with origins labelled Various/Unknown or Stateless. Additionally, remember that refugee stocks may reflect cross-border movements with a time lag, thus potentially assigning refugee flows to periods after the actual border crossing. Essentially, inconsistent or incorrect input data may propagate through, causing errors in refugee flow estimates. However, identifying unexpected estimated migration flows is a helpful tool to unveil missing or erroneous data. It is another feature of the above estimation methodology which might help improve existing data.
Regarding the estimation methodology, several specifications and assumptions made to achieve matching consecutive stock totals most likely contribute to an increased divergence from actual refugee migration flows. First, fixing the number of stayers to their maximum possible value minimizes estimated refugee flows. Second, assuming births only affect the native-born population and allocating deaths proportionally to the respective population stock. Third, assuming returnees’ arrivals to date before the considered period. Where available, including more detailed data such as age structures and returnees’ arrival dates would enable a more precise estimation of place of birth stocks. Fourth, moves to and from regions under consideration were assumed to be the only reason for the remaining differences between stock tables after correcting for non-refugee movements and accounting for natural population change. These differences are most likely caused by the data quality issues mentioned above. Note also that the diagonal values in the final estimated flow tables are constructed with the sole purpose of ensuring consecutive tables differ solely due to refugee migration. To avoid possible confusion and to display pure flow tables, the diagonal values should not be part of the final flow tables, equivalently to the representation in Table 3, lower panel. In addition, while this new methodology improves upon existing methods and estimates in many aspects, the availability of some of the required data only in five-year periods is another factor preventing more precise (e.g., annual) estimates of refugee migration flows. This current limitation can only be overcome with the potential availability of more frequent data in the future.
Validation Exercise
While formative historical events which caused and influenced refugee streams could easily be identified through the estimates, validating the results poses several challenges. First, the estimated refugee transition flows represent five-year periods rather than yearly movements, which are often captured by register data. Consequently, the estimated refugee transition flows are expected to be smaller than aggregated flow data that capture yearly movements within the same time interval. Second, reported refugee flows often lack the origin dimension, providing only details on the place of birth or nationality and destination. Third, comparing the flow estimates to media reports can be misleading as the terms refugee and asylum seeker are often used interchangeably, and even reported refugees may not necessarily align with the definition used in this paper, i.e., people who by international law fall under the mandate of the UNHCR and consequently are part of the UNHCR refugee database. Fourth, data on refugee migration flows with such level of detail is rare.
Since there is no database directly comparable to the estimates, it is not possible to assess the estimation results in terms of all three dimensions: origin, destination, and place of birth. However, Eurostat (2014) provides publicly accessible data from its European Union Labour Force Survey (EU LFS), particularly the ad hoc module lfso_14b1dr. This module contains information on first-generation immigrants aged 15 to 64, including their citizenship, length of stay, and reason for migration. Unfortunately, the module was collected for a single year only, 2014, and covers only a limited set of countries. To approximate the number of refugees who arrived in the host country between 2009 and 2014, we can utilize the Eurostat data by considering the number of individuals who migrated for international protection or asylum and have been in the country for a maximum of five years. Although these data may not perfectly align with the estimates, it is reasonable to expect them to exhibit a considerable degree of similarity. Furthermore, Eurostat collects and publishes data on asylum application decisions through the migr_asydcfsta module. This data set provides annual information on positive first-instance decisions regarding asylum applications. By aggregating the data over the respective five-year period, we can approximate the number of refugees who arrived in the destination country. The required data was available for 30 destination countries between 2010 and 2015.
In Figure 4, the Eurostat statistics are compared with the estimation results. The graphics include a 45-degree line which indicates a perfect fit between the estimation results and Eurostat data. Scatter plot 4a shows that most points lie close to the
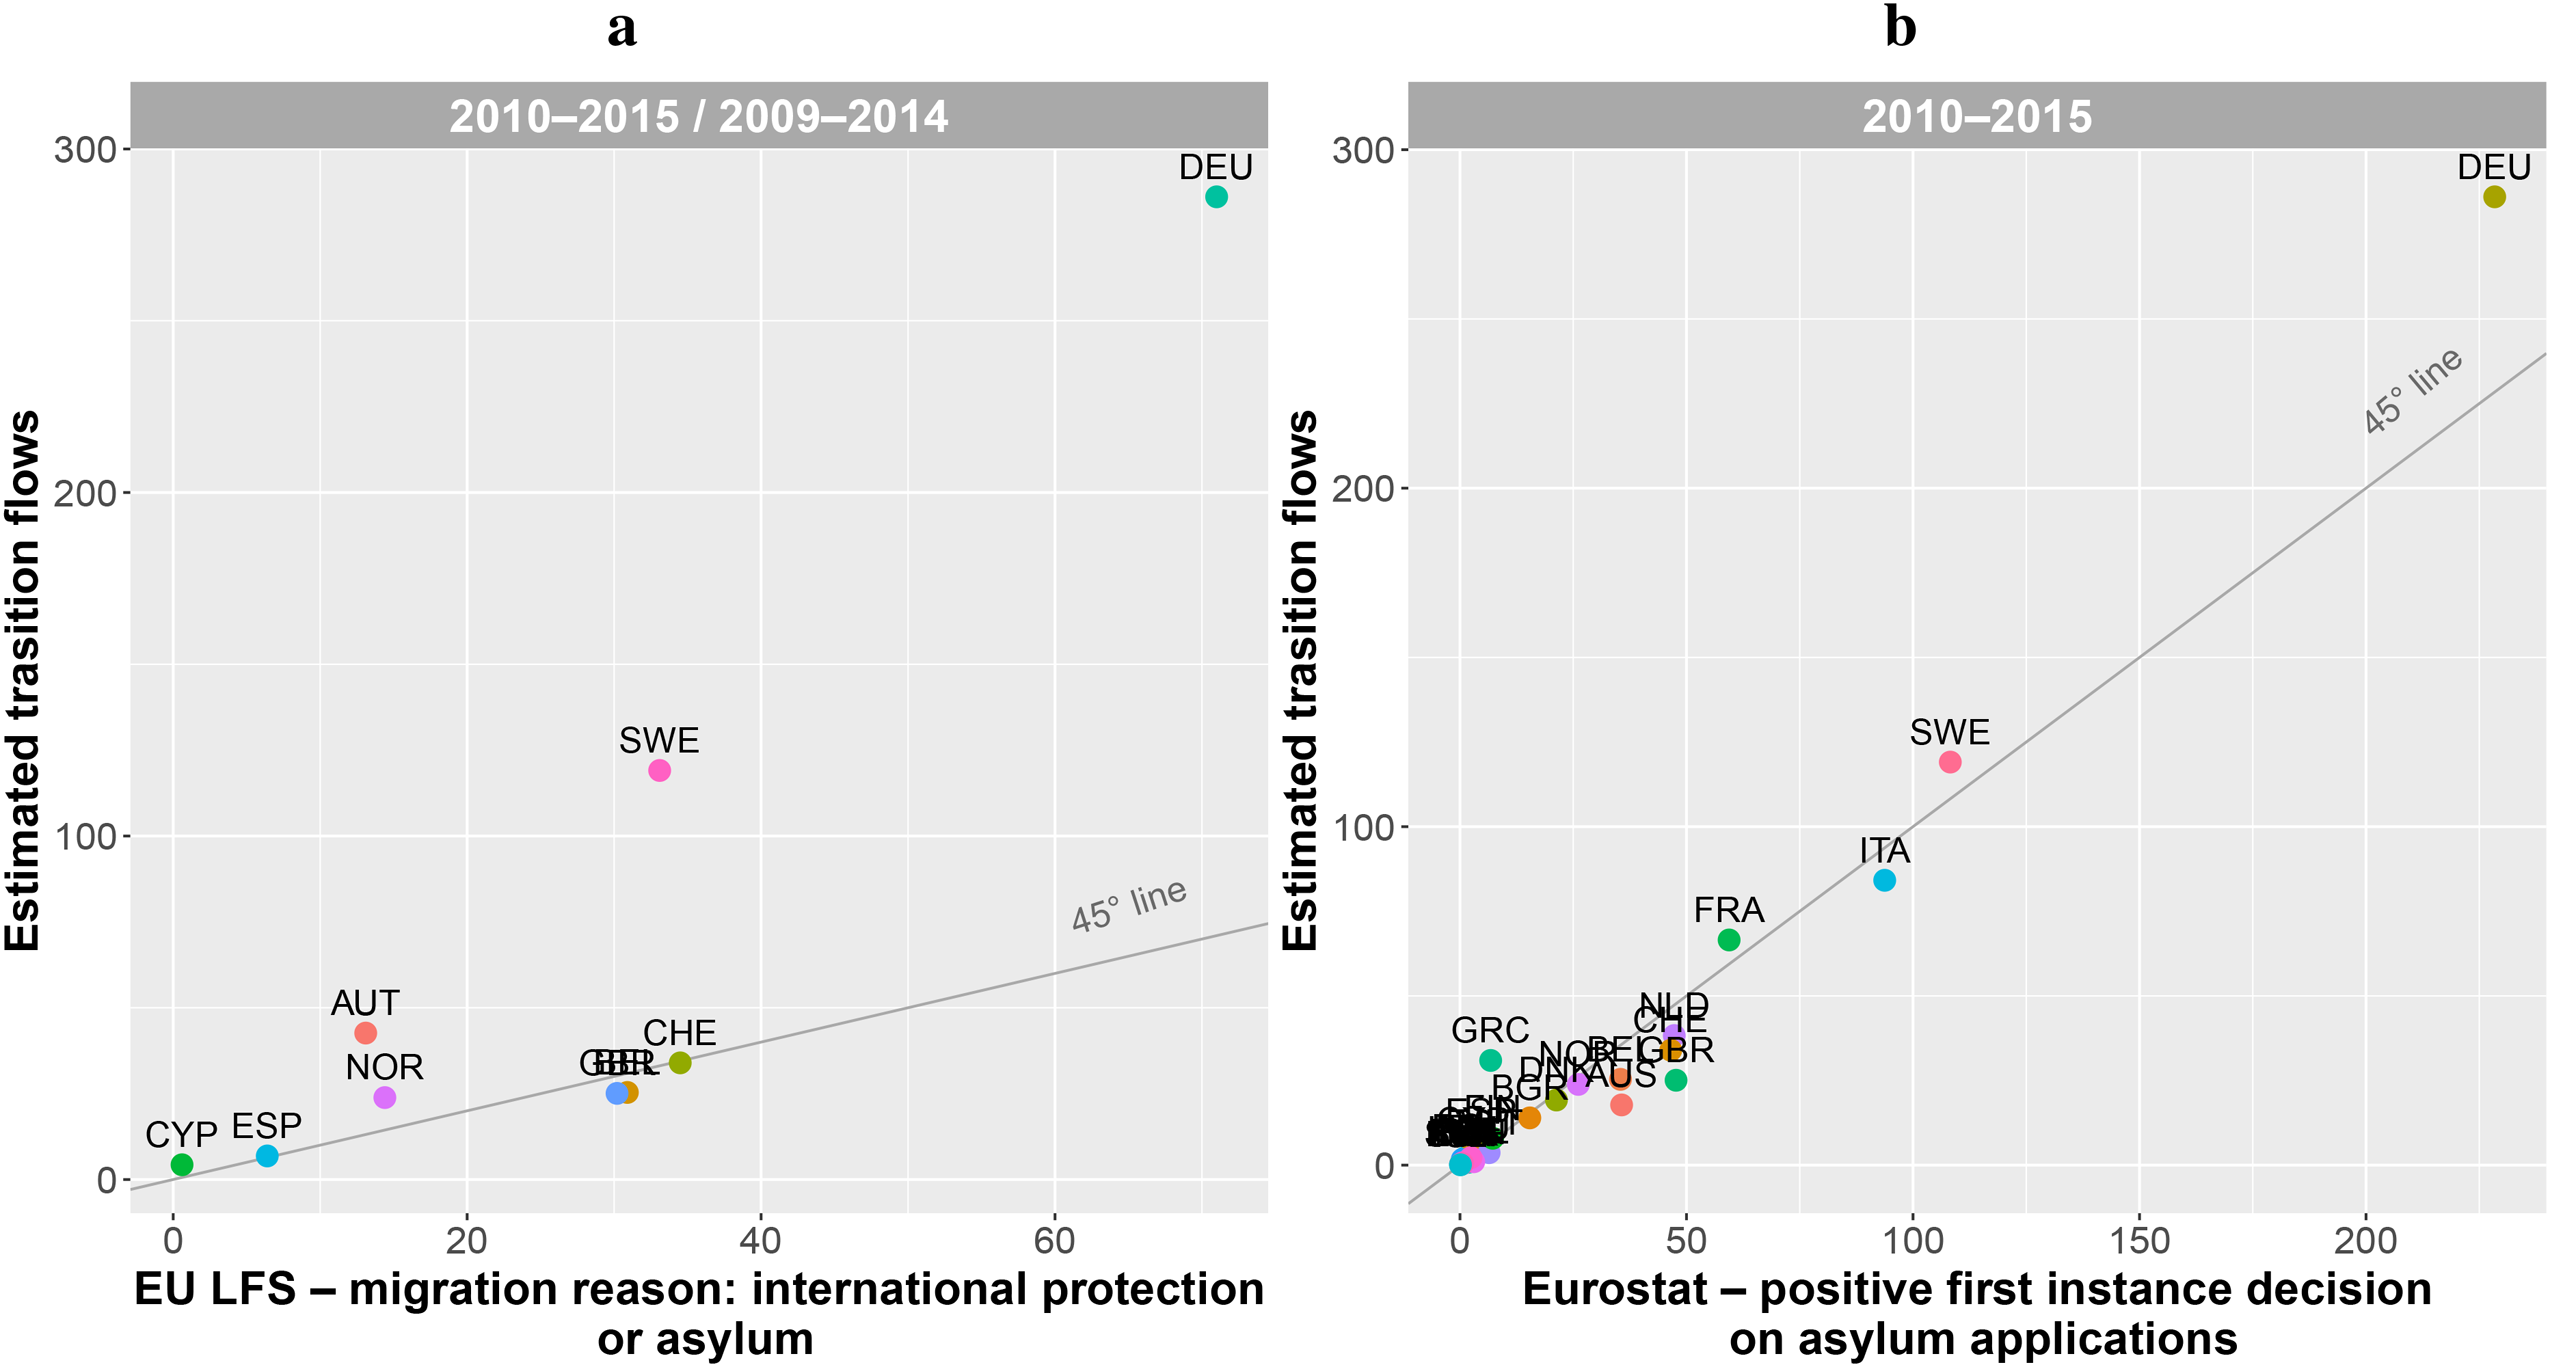
Correlation between (a) estimates and EU LFS figures on migrants who's length of stay was between one to five years and who came for international protection or asylum and (e) estimates and eurostat figures on positive first instance decisions on asylum applications between 2010 and 2015. In thousands.
This little exercise provides a rough indication of the performance of the estimation methodology. Furthermore, it suggests that although the estimation results represent a lower bound for refugee transitions, they are generally higher than comparable Eurostat data. Therefore, the refugee data collected by Eurostat may suffer from the aforementioned data issues, and the actual flows may be larger than indicated by other data sources, such as asylum applications. Nonetheless, further verification is recommended for future research.
Another way to assess the estimation results is to compare them with those obtained from different estimation techniques. One common and simple method of approximating migration flows from stocks is to differentiate between successive bilateral stock data. In the absence of valid and comparable data on migration flows, this method has been primarily used in statistical models to create the dependent variable (see Beine, Docquier and Diasporas 2011; Beine and Parsons 2015; Bertoli and Fernández-Huertas Moraga 2015; Drabo and Mbaye 2015). For instance, in the case of refugee migration, Buzurukov and Lee (2016) include the lagged refugee stock growth as a proxy for refugee flows in their analysis.
Applying the stock differencing method to the UNHCR refugee stock dataset results in approximate annual refugee migration flows. This is done in several steps. First, to enhance the precision of the estimates, the refugee stocks must be corrected for returnees and naturalisations, i.e., they must be summed up and added to the refugee stocks. Second, the flows are calculated by subtracting the stock at t from the corrected stock at 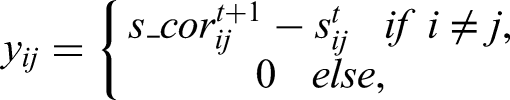
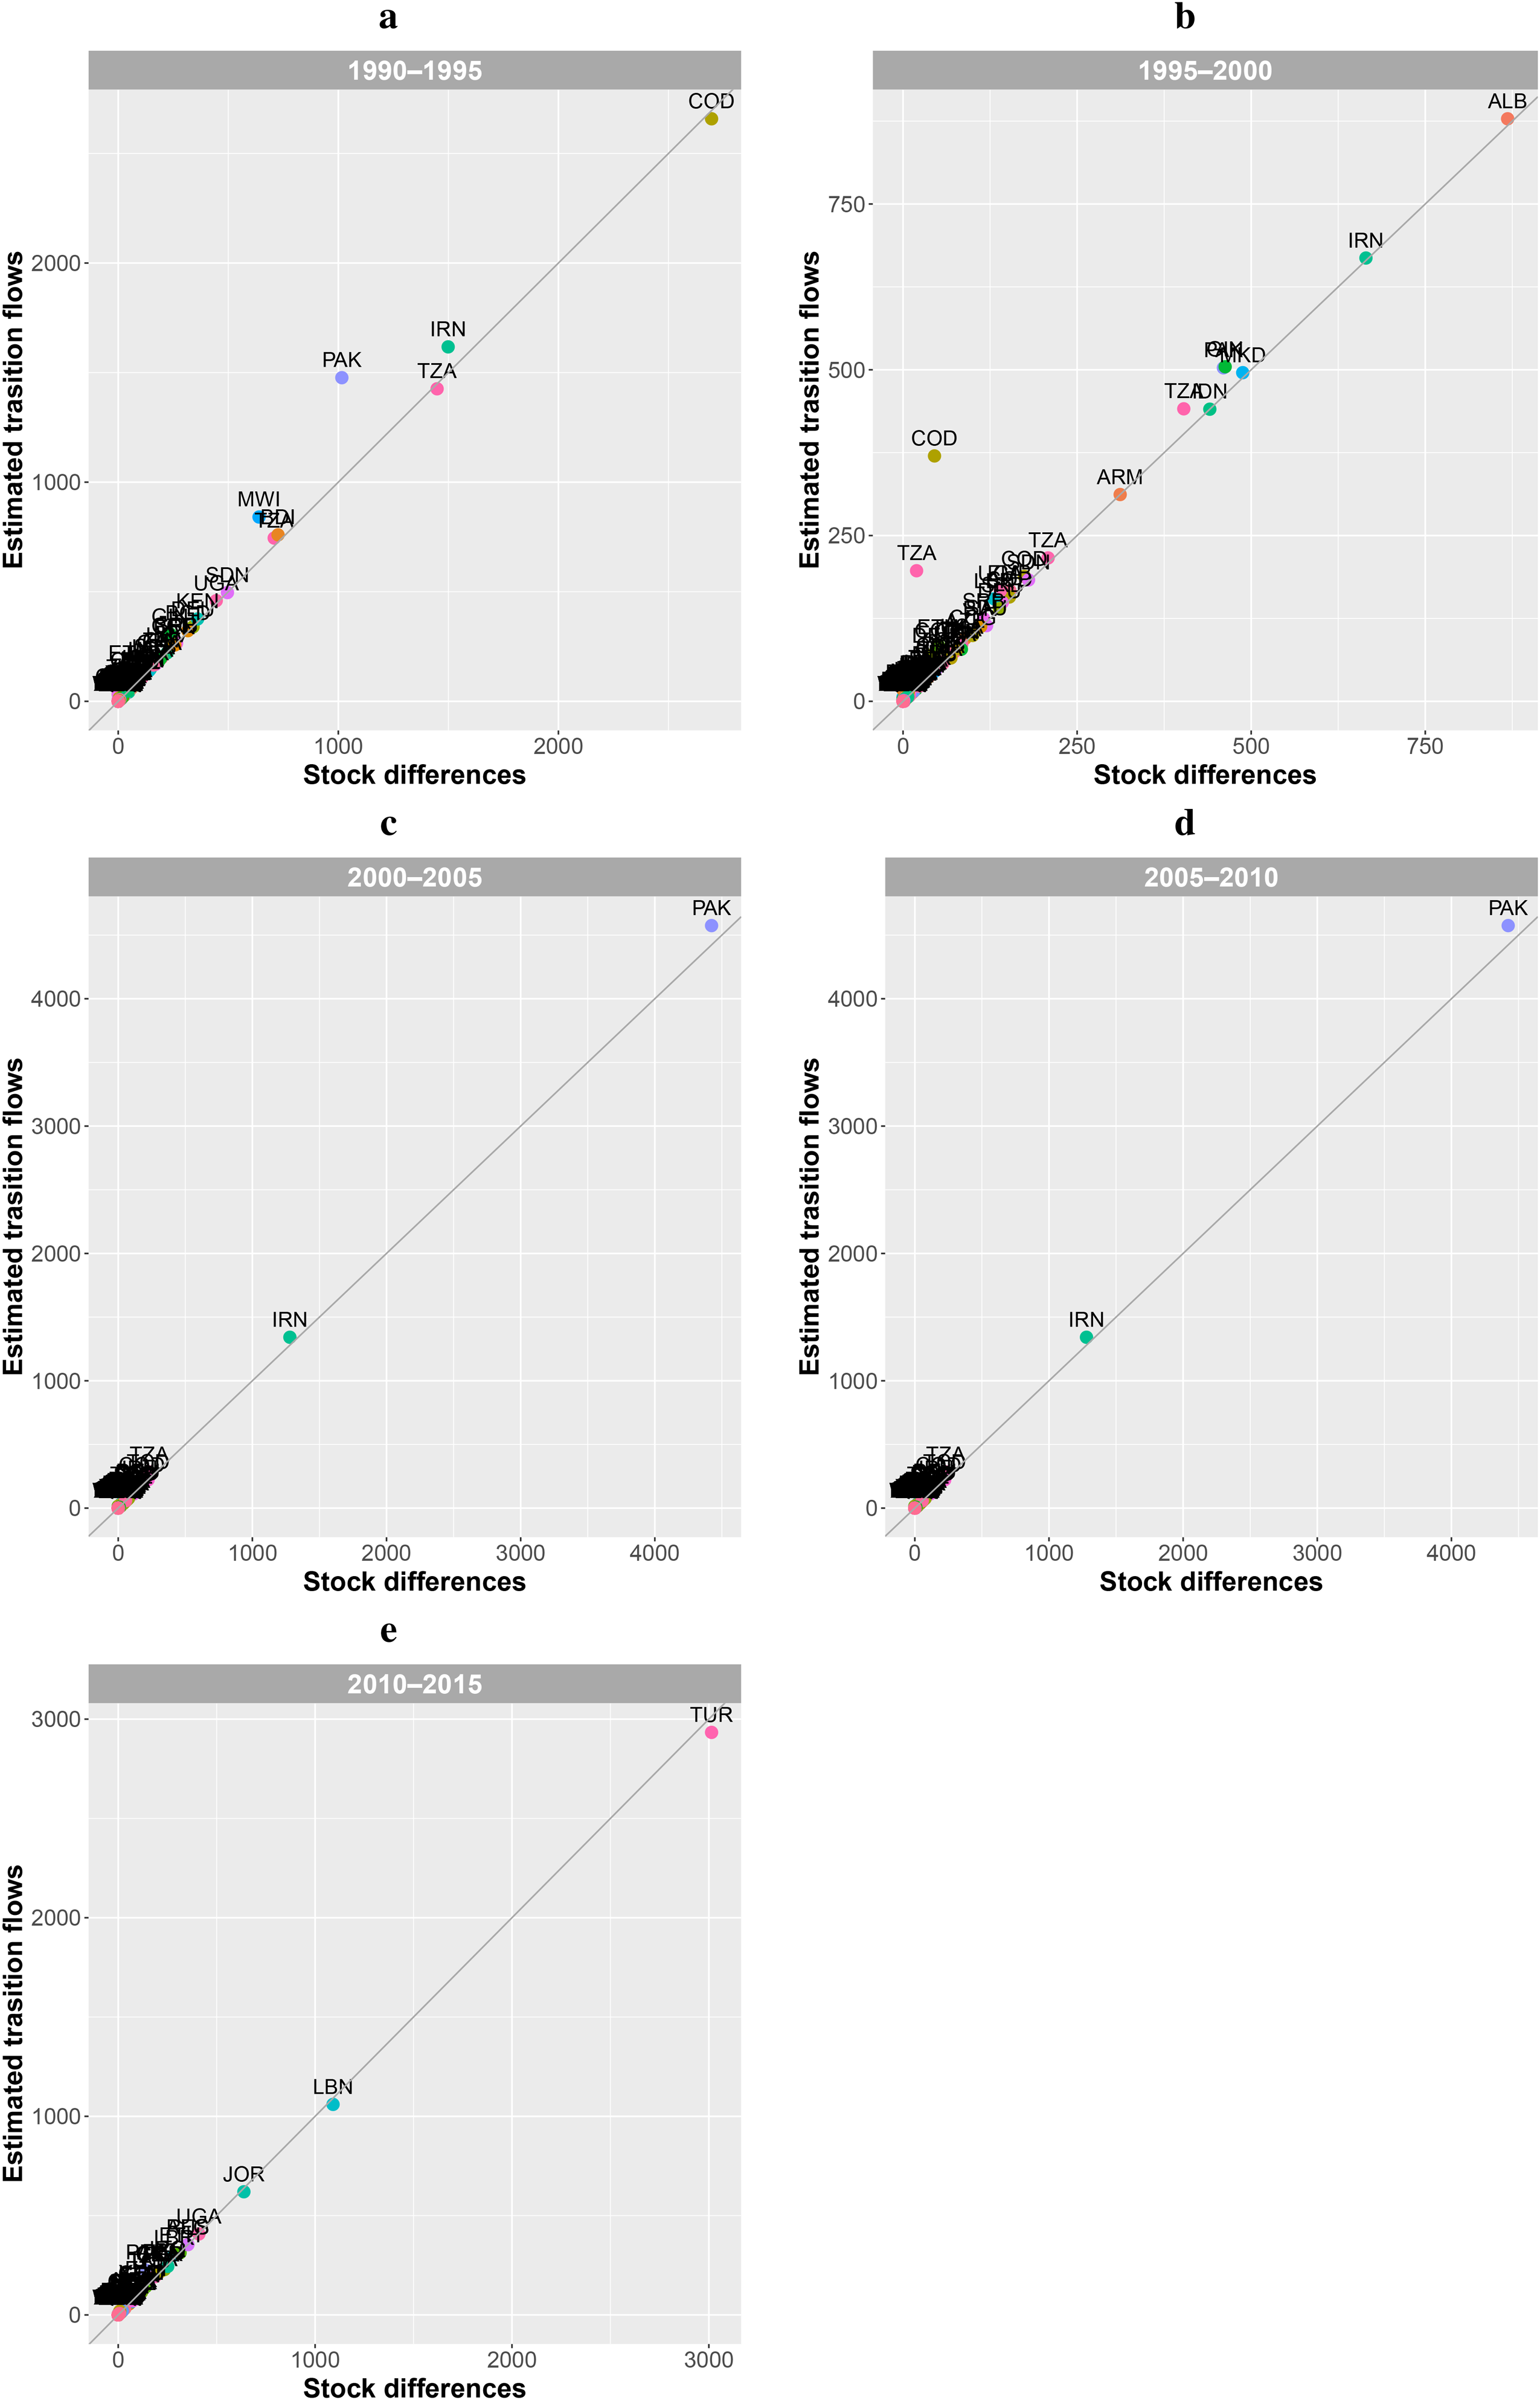
Correlation between transition estimates and stock differencing estimates. In thousands.
Summary and Discussion
In this paper, an existing method for estimating migration flows from stock data was further developed and applied to the UNHCR data set on refugees to close the gap of non-existent, incomplete, or incomparable global bilateral refugee migration flows. It improves upon existing indirect estimation methods in two key aspects. First, the estimates are derived using an established demographic accounting method that has been adjusted to generate estimates that respect the limitations inherent in the definition of refugee migration. Second, the resulting estimates encompass the three dimensions of place of birth, origin, and destination, making them a first-of-a-kind set of comparable global refugee migration flow data.
The illustrated methodology uses the maximum likelihood approach to estimate refugee migration flows from place of birth stock data. Beforehand, consecutive stock tables must be manipulated so that the only difference between them is attributable to refugee migration. Applying this methodology to real-world data yielded a total of 35,759,040 global bilateral five-year refugee migration flow estimates from 1990 through 2015. These were visually presented and discussed in the previous sections. Most notably, refugee migration flows were heavily spatially concentrated, with origin–destination combinations predominantly occurring within the same region. Furthermore, after 2000, Asian countries combined dominated the size of refugee inflows and outflows, although Africa remained the uncontested leader in terms of refugee migration flow involvement per capita. Finally, the results suggest a significant decrease in refugee migration flows in both absolute and relative terms during the initial two decades following the Cold War era. However, the subsequent spike in the size of global refugee migration flows, largely influenced by the Syrian Civil War, reached a level close to that observed during the period from 2000 to 2005. Does this contradict the repeated reports (UNHCR 2016, 2017a) of an all-time high in worldwide refugee numbers? No, because these reports refer to stock figures, which continuously rose from 2010 to 2015.
Although formative historical events which caused and influenced refugee streams could easily be identified through the estimates, validating the results is not straightforward. Nonetheless, the “Validation Exercise” section yielded promising results, indicating a high correspondence between Eurostat data on positive first-instance decisions on asylum applications and the estimation results. Generally, the estimates are higher than the Eurostat data, potentially revealing the frequently mentioned collection and undercounting problems of refugee statistics. Moreover, comparing estimates obtained from simple stock differencing also demonstrated a strong correspondence with the presented data on refugee migration flows. Nonetheless, it is crucial to be aware of the limitations. The estimates represent refugee transitions over five-year periods. However, an estimation of more frequent, for example, annual migration flows, is possible with the availability of appropriate input data. Moreover, the estimation results depend on differences between the prepared input stocks. If these differences stem from data imperfections or model inaccuracies, the estimation algorithm returns flow values that do not match the real world. On the other hand, unexpected flow outcomes can be used to identify flaws in the input data and help improve the quality of existing data. The volume of unexpected refugee migration flows even provides a hint to the order of magnitude to be expected for the flawed or missing numbers.
In conclusion, the outlined methodology provides a relatively simple way to create a first-of-a-kind global database on refugee transition flows between all pairs of countries. It offers an easy and cost-effective method of gaining valuable insights into refugee movements and serves as a solid approximation of worldwide refugee migration patterns. Future research utilizing refugee migration flows should not solely rely on approximations, such as simple stock differencing or asylum application data, but should also cross-check their results with alternatively created flow data. In addition, as input data quality, including frequency, improves, the illustrated methodology could serve as a legitimate alternative source for obtaining refugee migration flow data, bypassing the difficulties inherent in direct collection processes. It may even outperform tracking refugee movements and should be used to cross-check and validate other data sources.
Supplemental Material
sj-zip-1-mrx-10.1177_01979183231187621 - Supplemental material for Estimating Global Bilateral Refugee Migration Flows from 1990 to 2015
Supplemental material, sj-zip-1-mrx-10.1177_01979183231187621 for Estimating Global Bilateral Refugee Migration Flows from 1990 to 2015 by Stefan Schellerer in International Migration Review
Footnotes
Declaration of Conflicting Interests
The author declared no potential conflicts of interest with respect to the research, authorship, and/or publication of this article.
Funding
The author received no financial support for the research, authorship, and/or publication of this article.
Supplemental Material
Supplemental material for this article is available online.
Notes
References
Supplementary Material
Please find the following supplemental material available below.
For Open Access articles published under a Creative Commons License, all supplemental material carries the same license as the article it is associated with.
For non-Open Access articles published, all supplemental material carries a non-exclusive license, and permission requests for re-use of supplemental material or any part of supplemental material shall be sent directly to the copyright owner as specified in the copyright notice associated with the article.