
Abstract
The induced innovation hypothesis, initially proposed by Sir John Hicks, posits that as the cost of energy rises compared to other input factors, firms are motivated to engage in innovative practices to counteract the increased expenses related to energy consumption. This innovation can manifest through the development and implementation of technologies, processes, or methodologies that enhance energy efficiency or diminish overall energy dependency. In this study, we empirically examine and validate this hypothesis. By theoretically modeling how innovation responds to elevated energy costs, we exploit China’s substantial surge in energy demand as an external shock to global demand, to empirically test the predictions associated with our theoretical framework. We test these predictions using firm level data in Belt and Road Initiative (BRI) countries. Our findings strongly support the induced innovation hypothesis, revealing that, on average, a 1 percent rise in the relative cost of energy corresponds to a 2.1 to 5.1 percent increase in the likelihood of innovation in energy-exporting countries and a 0.5 to 3.6 percent increase in non-energy-exporting countries. These results are robust to various methodological variations and data restriction exercises.
Twitter summary
As shown in Figure 1, China’s oil imports have grown exponentially in the last two decades and this has pushed up global energy prices. With rising global energy prices, are firms more likely to innovate? We examine this question and find strong affirmative evidence in our paper. A 1 percent increase in energy costs prompts a noteworthy surge in the likelihood of innovation, ranging from 2.1 to 5.1 percent in energy-exporting countries and 0.5 to 3.6 percent in non-energy-exporting nations.
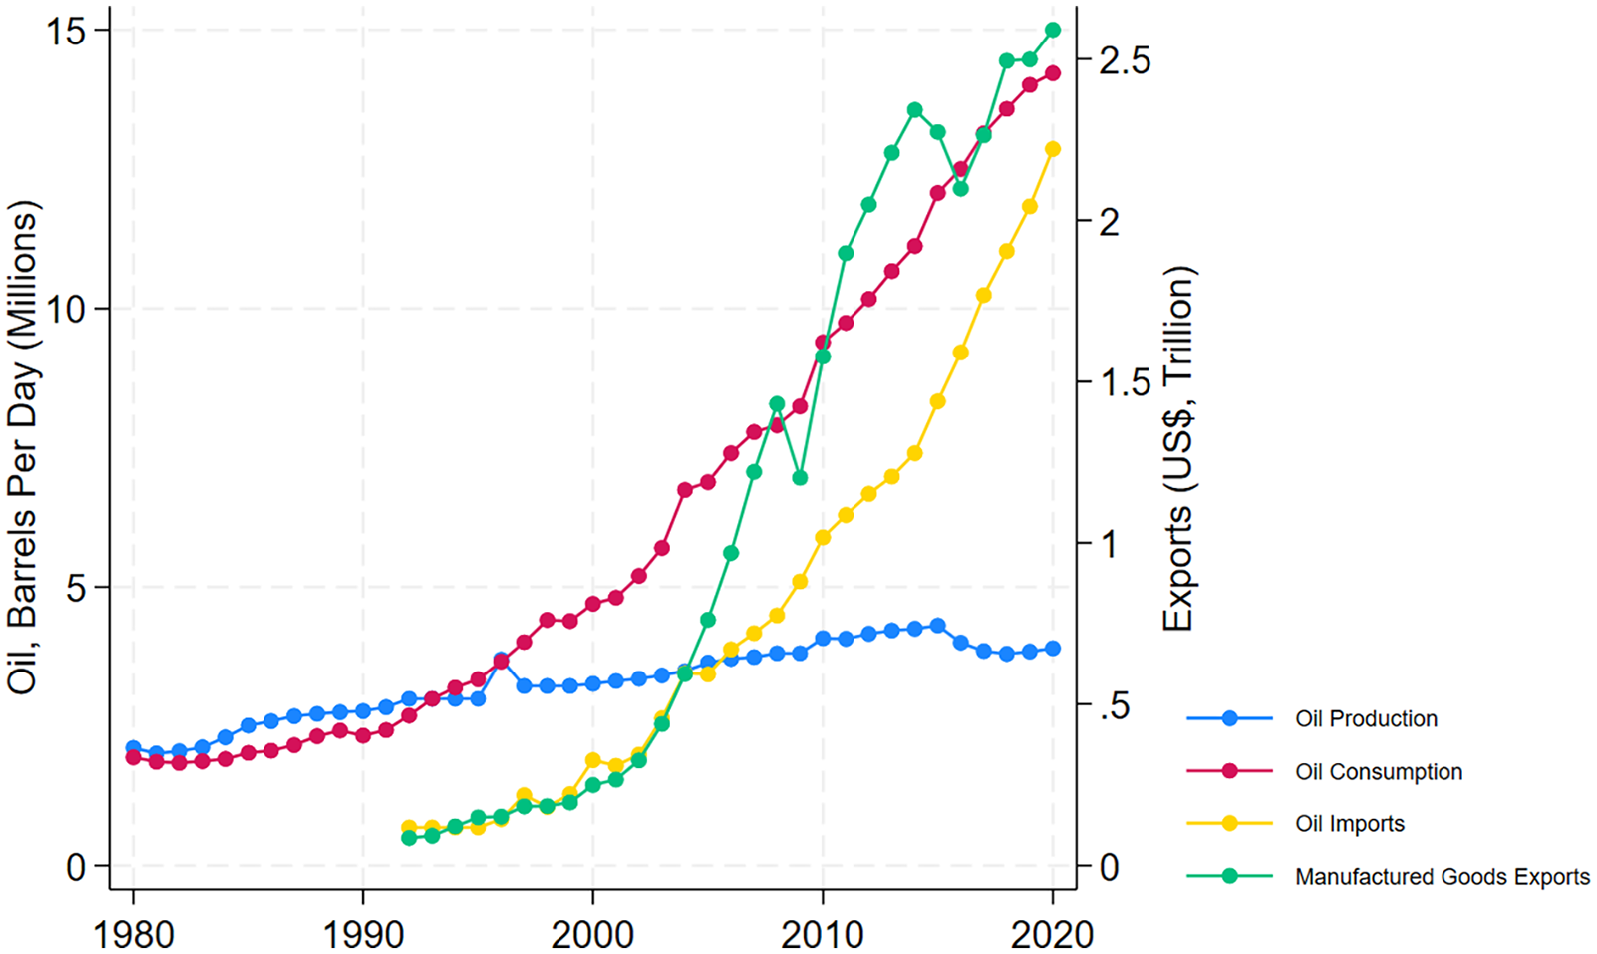
China’s imports and exports.
1. Introduction
. . . change in the relative price of the factors of production is itself a spur to invention, and to invention of a particular kind directed to economize the use of the factor which has become relatively expensive . . . (Hicks 1932)
In a world with increasing energy demand and finite supply, firms must compete for energy. This competition places an upward pressure on energy prices. The induced innovation hypothesis, proposed by Sir John Hicks suggests that increases in energy costs relative to other firm costs should lead to innovations that reduces energy usage. 1 This hypothesis has been widely tested and largely confirmed (see Popp [2002], Johnstone, Haščič and Popp [2010], Newell [2010], and Wurlod and Noailly [2018] as examples) but one glaring limitation of these studies is that although the induced innovation hypothesis isn’t exclusively tied to energy-saving frontier technologies, much of the existing research has predominantly taken a narrow view of innovation, often fixating on quantifiable metrics like the number of (registered or granted) patents (Marshall and Parra 2019).
While this focus is understandable, it overlooks the fact that firms may undergo significant changes in production processes and market orientation that are only tangentially related to energy reduction technologies. Such innovations, though crucial for economic development, often go unpatented. As such, we deviate from the existing literature by focusing on product innovation, process innovation, and investments in research and development (R&D), providing a more holistic view of innovation beyond patent-centric measures when evaluating the induced innovation hypothesis.
As a further extension to the literature, we develop a novel theoretical framework inspired by the work of Pindyck (1978), to demonstrate how an energy shock can lead to increased energy prices that catalyzes innovation. Our theoretical approach is also similar in spirit to the well-established agglomeration economics literature (e.g., Duranton and Puga 2004; Glaeser and Gottlieb 2009) and recent contributions in the energy economics literature that documented that firms benefit from knowledge spillover due to their proximity (backward and forward linkages) to the national oil and energy production sector (Badeeb, Lean and Smyth 2016; Fang and Chen 2017; Lim and Morris 2022). We add further context—in terms of the possible transmission mechanisms—by focusing on the firm level implications of shocks to domestic energy supply. This approach we argue is of great interest in the context of increased bilateral trade relations that are premised on “resource-for-capital” arrangements in developing economies, especially given the Arrow-Romer-Marshall spillover externality that promotes innovation.
To empirically operationalize an energy shock, we leverage the unique circumstances surrounding China’s rapid emergence as a manufacturing export powerhouse following its trade and investment liberalization in the early 1990s (see Figure 1). The surge in China’s manufacturing exports significantly impacted economies producing labor-intensive goods, creating a substantial rise in global competitive supply of manufactured goods. Conversely, economies supplying raw materials and other inputs witnessed a parallel surge in global demand for these inputs due to China’s increased demand for these inputs (Autor, Dorn and Hanson 2016). Of interest to us, the rise in China’s manufacturing exports corresponded with a substantial spike in the country’s energy imports, contributing to its role as a primary driver of the commodities super cycle from 2000 to 2014 (Gauvin and Rebillard 2018). Leveraging this, we investigate whether China’s increased energy demand had a discernible impact on global energy markets, subsequently influencing innovation at the firm level in other countries. As such, this approach employs the China trade shock as an exogenous instrument for import competition, a well-documented justification in the literature (Autor, Dorn and Hanson 2013, 2016; Utar 2014; Utar and Torres Ruiz 2013). This allows us to make a stronger case for a causal interpretation of our results compared to the existing literature. Moreover, we use the broadest cross-country firm level dataset to examine this relationship to date.
We focus on firms in ninety countries that are part of the Belt and Road Initiative (BRI) with China. 2 Notably, as illustrated in Figure 2, China’s energy imports now originate from around the world. In 1992, China sourced energy inputs from just twenty-three countries, a number that increased to eighty-five by 2020. We therefore focus on the BRI countries because the energy demand component of the China shock is more targeted in these countries due to the unique resources-for-capital arrangements employed by China under the initiative (Huang 2016). Under the initiative, loans of Chinese origin are collateralized either directly by natural resources or indirectly through future revenue streams from natural resources. As an example, these loan arrangements account for approximately a quarter of all Chinese loan commitments in Africa (Chuku, Lang and Lim 2023). Baniya, Rocha and Ruta (2020) points out that the trade effects of the BRI present a large variation across individual countries and across sectors. This suggests that there is increased competition from China in these countries in both goods and input markets and as such, our analysis presents a reference point for these increased competitive pressures.
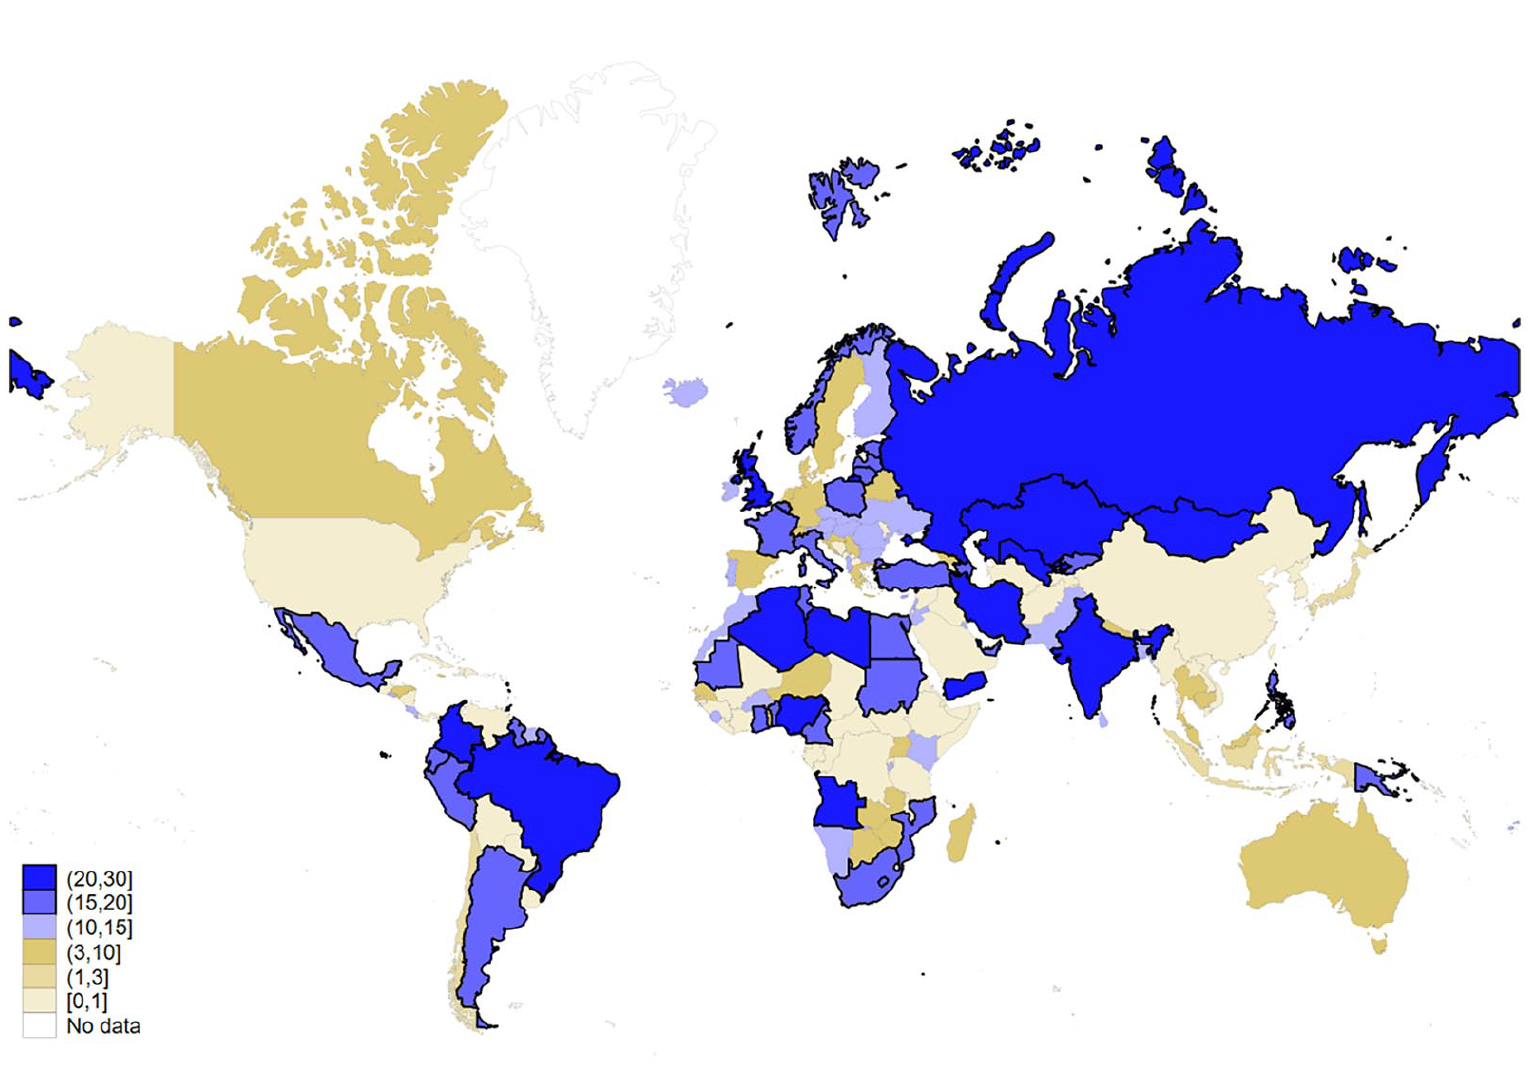
Change in China’s energy imports 1992 to 2020 (%).
To preview our findings, we consistently show that rising energy costs act as a catalyst for innovation across diverse measures of innovation, including product innovation, process innovation, and R&D. We find that a 1 percent increase in energy costs prompts a noteworthy surge in the likelihood of innovation, ranging from 2.1 to 5.1 percent in energy-exporting countries and 0.5 to 3.6 percent in non-energy-exporting nations. These results underscore the significance of energy cost dynamics in steering innovation strategies, irrespective of a country’s energy export status. From a policy standpoint, governments can leverage these insights to design targeted initiatives that incentivize innovation in response to changing energy cost dynamics, fostering a more adaptive and resilient business landscape. These results are robust to diverse methodological modifications to our baseline strategy and data restrictions.
The rest of the paper is organized as follows. Section 2 provides an overview of the relevant literature. Section 3 includes a theoretical framework for our analysis. Section 4 reviews the empirical strategy and describes the data. Section 5 contains the main results on the innovation–energy cost relationship. We discuss our results in Section 6 before offering some concluding remarks in Section 7.
2. Relevant Literature
As energy prices have risen recently, there is growing evidence confirming the induced innovation hypothesis (Crabb and Johnson 2010; Johnstone, Haščič and Popp 2010; Newell 2010; Popp 2002; Triguero, Moreno-Mondéjar and Davia 2014; Wurlod and Noailly 2018). While increased energy prices may reduce R&D investment and innovation by undermining profits, the high input cost may induce firms to explore energy-saving efforts, the crux of the induced innovation hypothesis. This hypothesis suggests that with increased energy prices there is a growth of innovation in energy saving technologies. These technologies include technologies that reduce pollution, such as scrubbers for use on industrial smokestacks or catalytic converters for automobiles and changes to the production process, such as improved energy efficiency, that lead to reduced energy use and negative environmental impacts.
Newell, Jaffe and Stavins (1999) develops a methodology for testing the induced innovation hypothesis by estimating a product-characteristics model of energy-using consumer durables and show that the direction of innovation was responsive to energy price changes for some products but not for others. Similarly, Popp (2002) used United States patent data from 1970 to 1994 to estimate the effect of energy prices on energy-efficient innovations and find that both energy prices and the quality of existing knowledge influences the incentives to innovate. Using cross country data, Wurlod and Noailly (2018) analyzes the impact of green innovation on energy intensity and shows that green innovation has contributed to the decline in energy intensity in most sectors. Similar findings were reported by Johnstone, Haščič and Popp (2010) and Newell (2010) who show that public policy has a significant role to play.
Interestingly, almost all these analyses use patent count as the measure of innovation. Of course, this limits our overall understanding of these relationships because patents are an imperfect measure of technological innovation (Morris 2018). For instance, Johnstone, Haščič and Popp (2010) point out that patent count is a subset of product innovation, and it is highly correlated with firm size and is a crude measure of innovation outputs that captures only some types of invention. Additionally, filing for a patent is driven in large part by the extent to which a firm’s management/and or ownership deems it important given the nature of the business, the institutional environment with regards to enforcement and appropriability, among other challenges. For developing countries, where patenting is less common (Zahler, Iacovone and Mattoo 2014), estimating the impact of energy prices on patent count may suffer purely because of the limited numbers of patents recorded in these countries.
Although binary in nature, studies such as Cirera and Muzi (2016) show that in some instances, measuring innovation more broadly as product and process innovation offers some improvement on patent count measurements which mainly accounts for radical product innovation. Moreover, these studies tend to focus on developed economies, where investment in R&D is higher and innovation tends to be on the technological frontier (Crespi, Tacsir and Vargas 2016). Our extension of the literature in this regard is to focus on the association between innovation (product and process innovation) and energy demand in mostly developing countries.
We also include services firms in our analysis. Morris (2018) points out that characteristics such as intangibility, simultaneity of production and consumption, and perishability, make innovation in the services sector different to manufacturing firms. For example, Zahler, Iacovone and Mattoo (2014) shows that services firms out innovate manufacturing firms in some industries, even though services innovations more often take a non-technological form. A similar finding was reported by Tether (2005) in several developed European countries. With these exceptions, analysis of innovation behavior in the services sector is limited, and as it regards the interaction with energy, there is a dearth of evidence. It is our intention to fill this gap in the literature by including both manufacturing and services firms in our analysis, covering firms across thirty-six industries in total. With many developing economies also currently being encouraged to undertake service sector liberalization, we believe the additional coverage on service sector firms will provide either alternative insights or further robustness to results obtained in our core analysis.
3. Theoretical Framework
We develop a theoretical framework that characterizes a non-oil price setting, oil producer that is engaging in a stylized “resource-for-capital” trade arrangement. In essence, we create a broad macro-environment for which the firms—which are our main research focus—are operating in, based on an extended optimal extraction and drilling problem in the tradition of Pindyck (1978). After establishing the macro-environment, we deviate from the general equilibrium set up in the standard macroeconomic modeling frameworks and focus on explaining analytically the effects of rising energy demand on firm level innovation choice.
With the theoretical intuition of competitive pressures resulting from rising energy demand shocks set in place, we consider separately the influence on innovation in energy exporting and importing countries. The firms we study are the “everyday” enterprises in the developing host economy, that are price takers.
In this setting, the energy price effect is transmitted via macroeconomic mechanisms associated with the national energy sector, which then spillover to the “everyday” small and medium sized enterprises. This theoretical approach is similar to Chuku, Lang and Lim (2023) but we generalize the mechanisms to highlight that in general, demand shocks that raise energy prices will have an impact on the competition for energy and consequently, will impact firm level activity globally.
3.1. Macro-environment
We characterize the macro-environment that the firms are operating in using a Pindyck (1978) style oil extraction and drilling framework, where the construction of the physical capital (equipment and machinery) used in the operation is funded by a “resource-for-capital” trade arrangement that is like Chuku, Lang and Lim (2023), and consistent with anecdotal evidence in Lin and Wang (2017) and Johnston (2019). Specifically, drilling activities involve the use of physical capital financed through a special purpose vehicle (SPV) funded from a foreign country (herein, “foreign donor”), where the equation of motion is

where
Given these, the aid funds’ flow constraint of the donor is given by:

where
Following the geological constraint-restricted extraction function of Okullo, Reynès and Hofkes (2015), period-specific oil extraction,

and would reduce existing reserves,


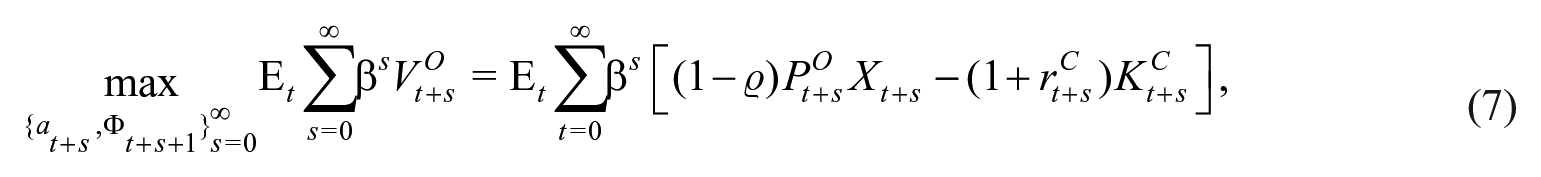
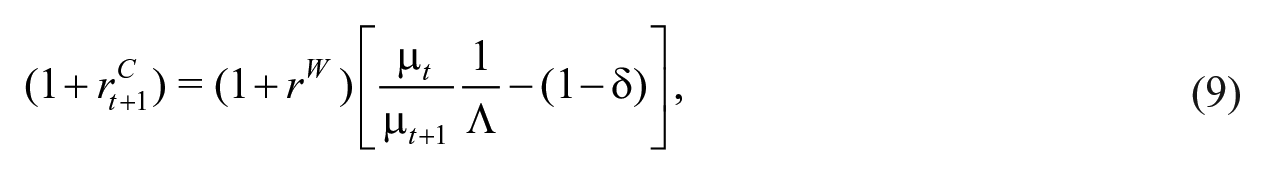
The energy operator chooses sequences of donor funds{at}0∙ (from choice of quantity of equipment, [3]), and next-period oil reserves
where
In terms of the rental rate,
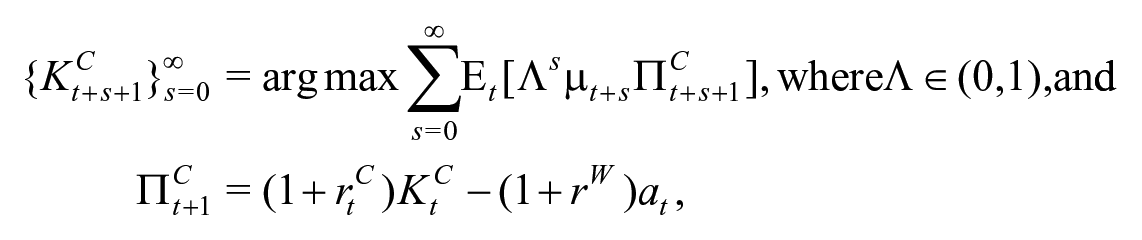
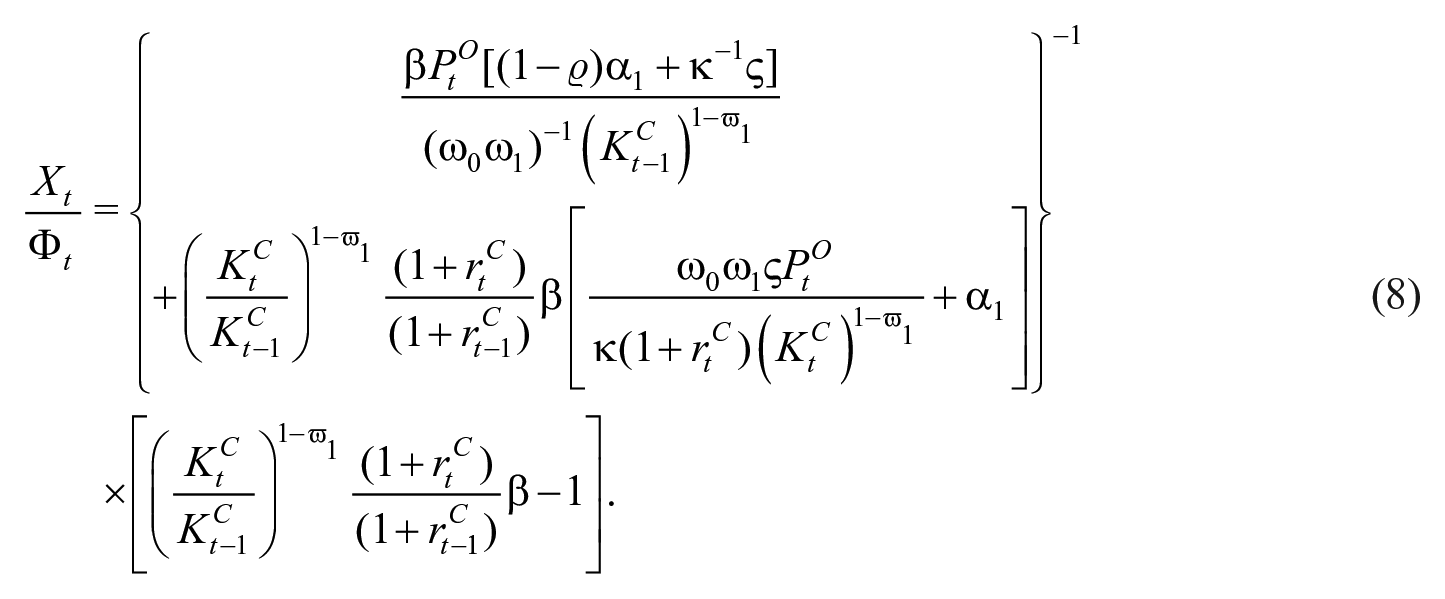
which, as shown in Supplemental Appendix A, yields
where µ t is the shadow price derived from the non-oil economy’s problem.
Having deducted the priority share claimed by the donor,

where
Finally, the home government, who saves by purchasing net foreign assets,
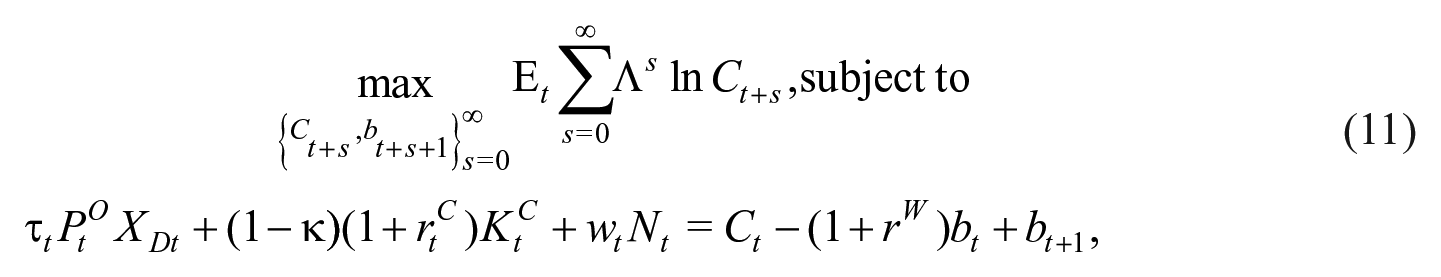
where
As shown in the Supplemental Appendix, let µ t be the shadow price of (11), we have:
3.2. Firms and Innovation Choice
There is a continuum number of firms indexed by
This type of two-step optimization approach is commonly used in the macroeconomic literature to model the firm’s problem in a developing small open economy setting, especially when the focus is on examining “macro-to-micro” spillover effect from the broader macroeconomic sectors. Examples focusing on spillover from the environment and the national energy sector to firms include Annicchiarico and Dio (2017) and Lim and Zhang (2023) respectively.
Collectively, goods market equilibrium requires that total consumption,
where
In the beginning of each period

where
where
For a more realistic characterization of firm heterogeneity in terms of cost structure, we assume that each firm j’s actual realized fixed,
where
Based on this, with monopolistically competitive pricing for its own product, a firm
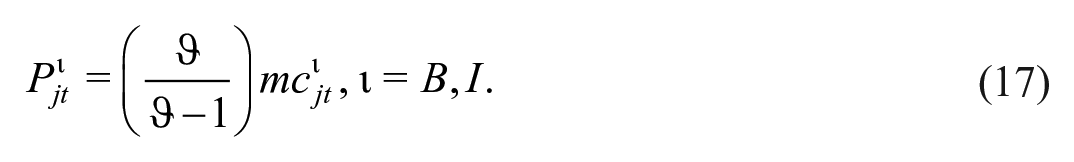
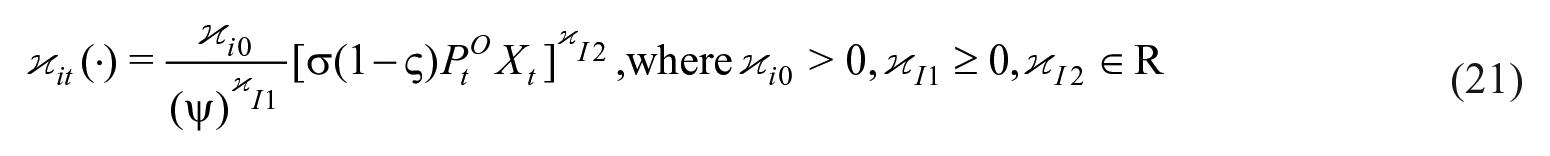
We model innovation investment (if successful) as resulting in some hybrid product and process innovation outcomes. Nevertheless, the effective cost of innovation is heterogeneous across firms due to all firms having different innovation efficiency,
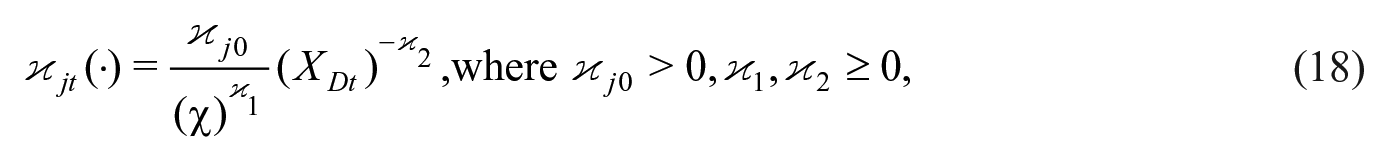
where in addition to firm-specific innovation efficiency, also depends negatively on the size of the domestic oil market, given by:
In other words, we account for the broad economic structure of the economy. Given the focus on economies with oil exports, as well as recent spillover evidence such as Mody (2023), it is reasonable to assume that innovation is pseudo-complementary to the domestic energy market, therefore a negative innovation cost-domestic energy market size nexus. Further, on top of innovative versus baseline product variety choice, a successful innovation endeavor would also result in a proportionate fixed cost saving at
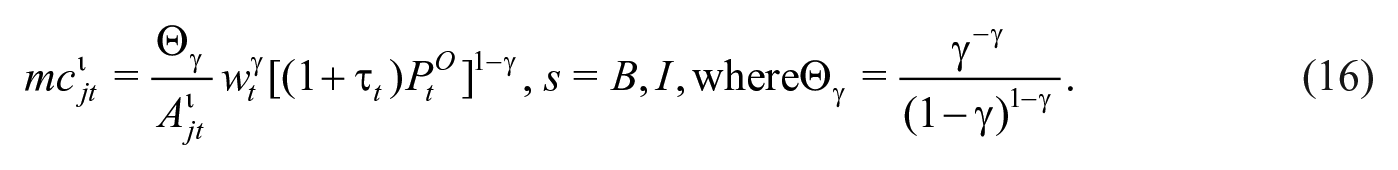
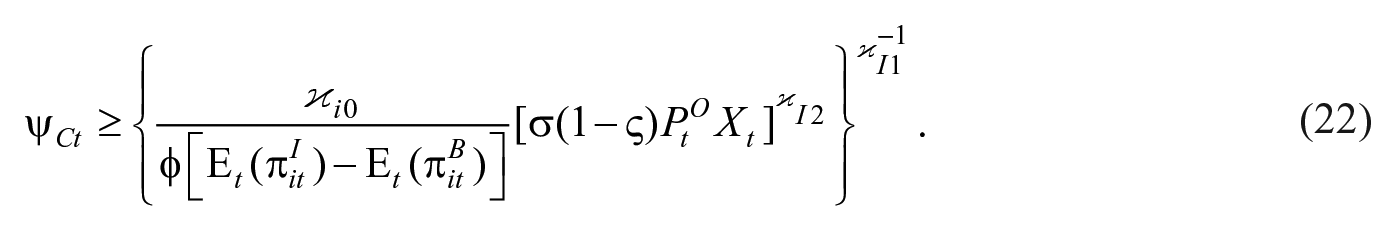
Given these, plus (18) and (19), a firm

which, as shown in Supplemental Appendix A, yields a threshold value of innovation efficiency,
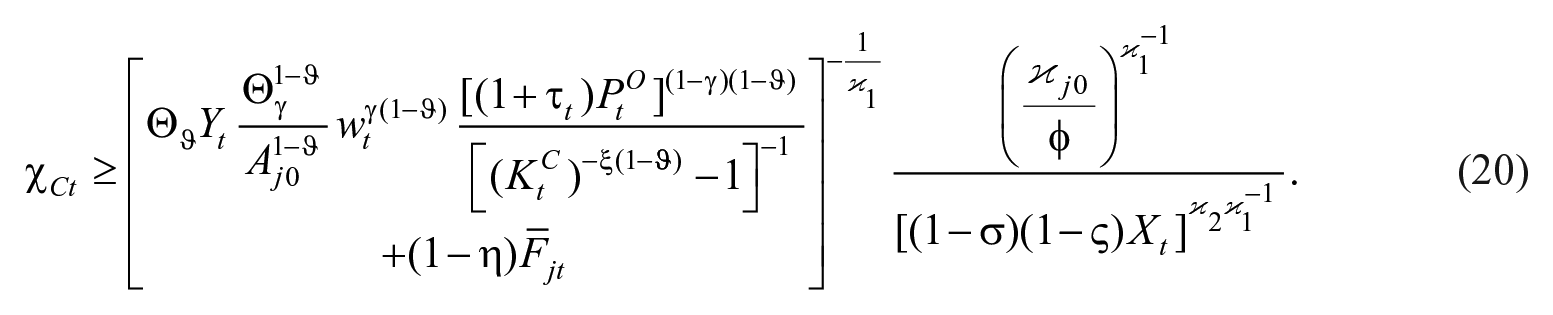
Proposition 1: In a small energy exporting economy—the effect of the share of energy exported
Proof: As shown in Supplemental Appendix A, differentiating (20) with regards to
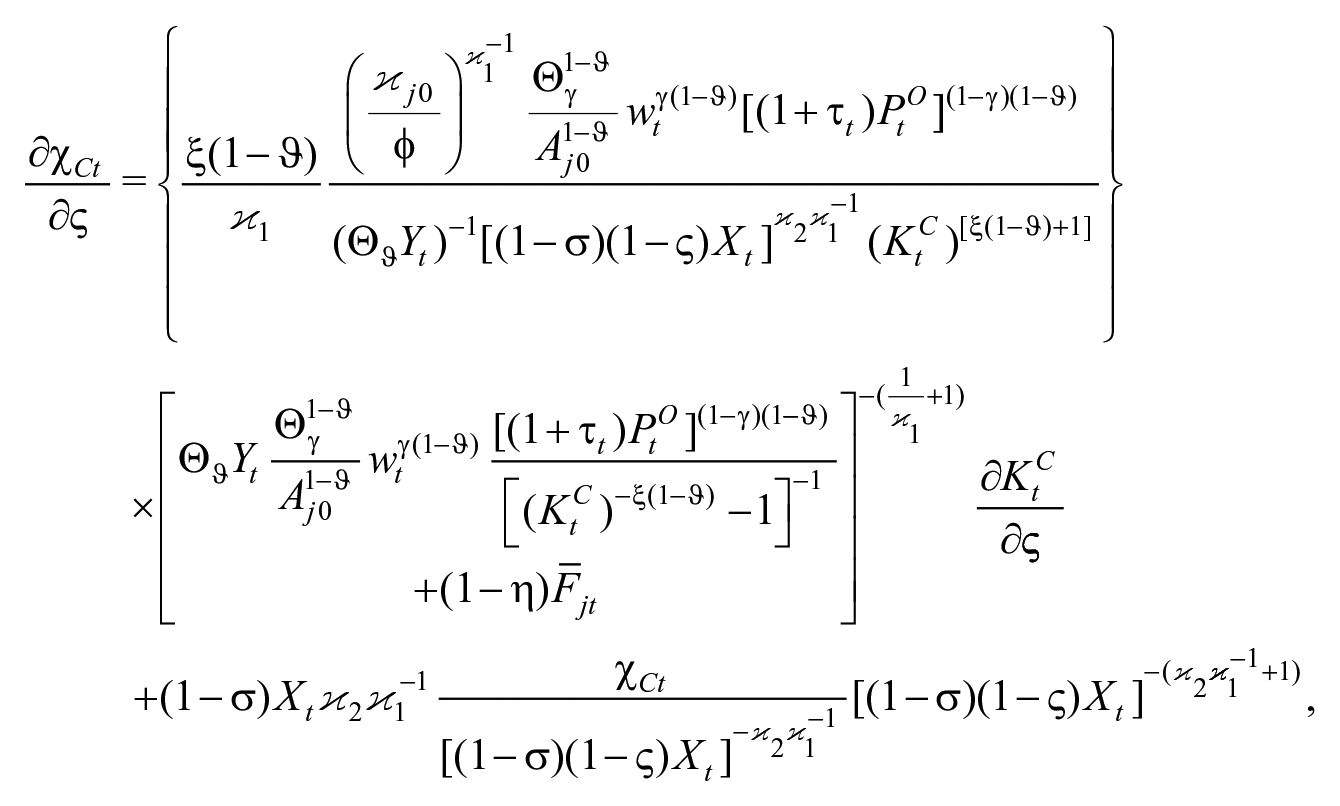
which is analytically ambiguous. The sign of this comparative static depends on the trade-off between the two expressions. Specifically, the sign of the first expanded expression, which represents marginal gains with respect to Arrow-Romer spillover effect, is negative, which suggests that greater oil exports would lead to lower threshold value,
3.3. Extension—Rest of Oil-Importing Small Economies
Given the benchmark characterization described by (1) to (20), to understand fully the impact of growing global energy demand on technological innovation of firms in developing economies, we turn our attention to the rest of the developing world, that is, small economies that may neither be oil exporters or recipient of “resource-for-capital” trade but are oil importers. Without a full-blown modeling of such an economy, we evaluate stylistically the impact on a typical firm
Without losing any generality, suppose there is only one such third-party, oil-importing economy. Recall that total oil imported from the oil-exporting economy in the benchmark model is then
where the oil-importing country’s corporate innovation efficiency is characterized by density function
Given such differences, the derivation of a threshold innovation efficiency level,
From this, it is straightforward to derive another empirically testable proposition (see Supplemental Appendix A for derivation).
Proposition 2: In a small energy importing economy—the effect of an increase in global energy demand on a domestic firm’s innovation depends on the difference between the magnitude of the competition effect and the energy efficiency effect.
4. Empirical Strategy and Data
4.1. Empirical Strategy
To evaluate the two propositions articulated above (with split sample) we can estimate:

where
This regression is the foundation for testing the induced innovation hypothesis and correlates firm level energy costs with innovation. For the hypothesis to be supported,
As such, to identify the causal effect of rising energy cost on firm level innovation outcomes, we exploit cross-industry-country differences in energy costs to isolate the long-run, quasi-fixed component of an energy shock that drives up demand and increases prices. To do this we focus on the drastic rise in energy demand in China that started in the early 1990s. Empirically we focus on the change in Chinese trade in energy between 1992 and 2007. Autor, Dorn and Hanson (2016) points out that this period is characterized by an export surge driven largely by productivity gains resulting from China’s market opening. This period also avoids an overlap in the time frame of the data from the World Bank Enterprise Surveys (WBES) on innovation (2008–2019), avoiding reverse causality from innovation to energy trade.
Consequently, our instrumental variables approach is as follows. For proposition 1, let

For proposition 2, since the countries in focus do not export energy, we replace

Our final IV approach therefore is to instrument EC in equation (23) with ∆

where
4.2. Data
Our analysis is based on cross-country firm level survey data from the WBES. In addition to information on innovation, this survey contains data on accounting characteristics such as sales, inputs, labor, stock of capital, investment, costs as well as broad cost-of-doing business indicators, and government ownership. Although data is available for over 177,000 firms in 153 countries, we restrict our attention to the ninety countries in the WBES that are part of the BRI. Of the included BRI countries, twenty-nine BRI exported energy (oil) over our sample period. Our final dataset is a cross section of firms surveyed once between 2011 and 2019. We combine WBES data with energy trade data from the United Nations Commodity Trade Statistics Database (UN Comtrade). We focus on imports under HS codes of Chapter 27: Mineral fuels, mineral oils, and products of their distillation; bituminous substances; mineral waxes. The appeal of this chapter for our analysis is that it contains all the energy inputs such as crude and other petroleum oils, coal, briquettes, liquefied gases, and similar. As such, to the extent that there are competitive pressures in import markets for energy, it should show up in the movements under this chapter in each country.
4.3. Key Variables
All the key variables used in our analyses are described in Table 1. Our dependent variable is innovation. To operationalize this variable, we focus on three questions in WBES which captures innovation output and input. Specifically, WBES asks: (i) Did this establishment introduce onto the market any new or significantly improved products (product innovation = 1 if yes, 0 otherwise); (ii) Has this establishment introduced any new or significantly improved production processes including methods of supplying services and ways of delivering products (process innovation = 1 if yes, 0 otherwise); and (iii) Did this establishment spend on research and development activities, either in-house or contracted with other companies, excluding market research surveys (R&D = 1 if yes, 0 otherwise). About 23.46 percent of the sample are process innovators and 25.61 percent are product innovators.
Definition and Basic Descriptive of Key Variables.
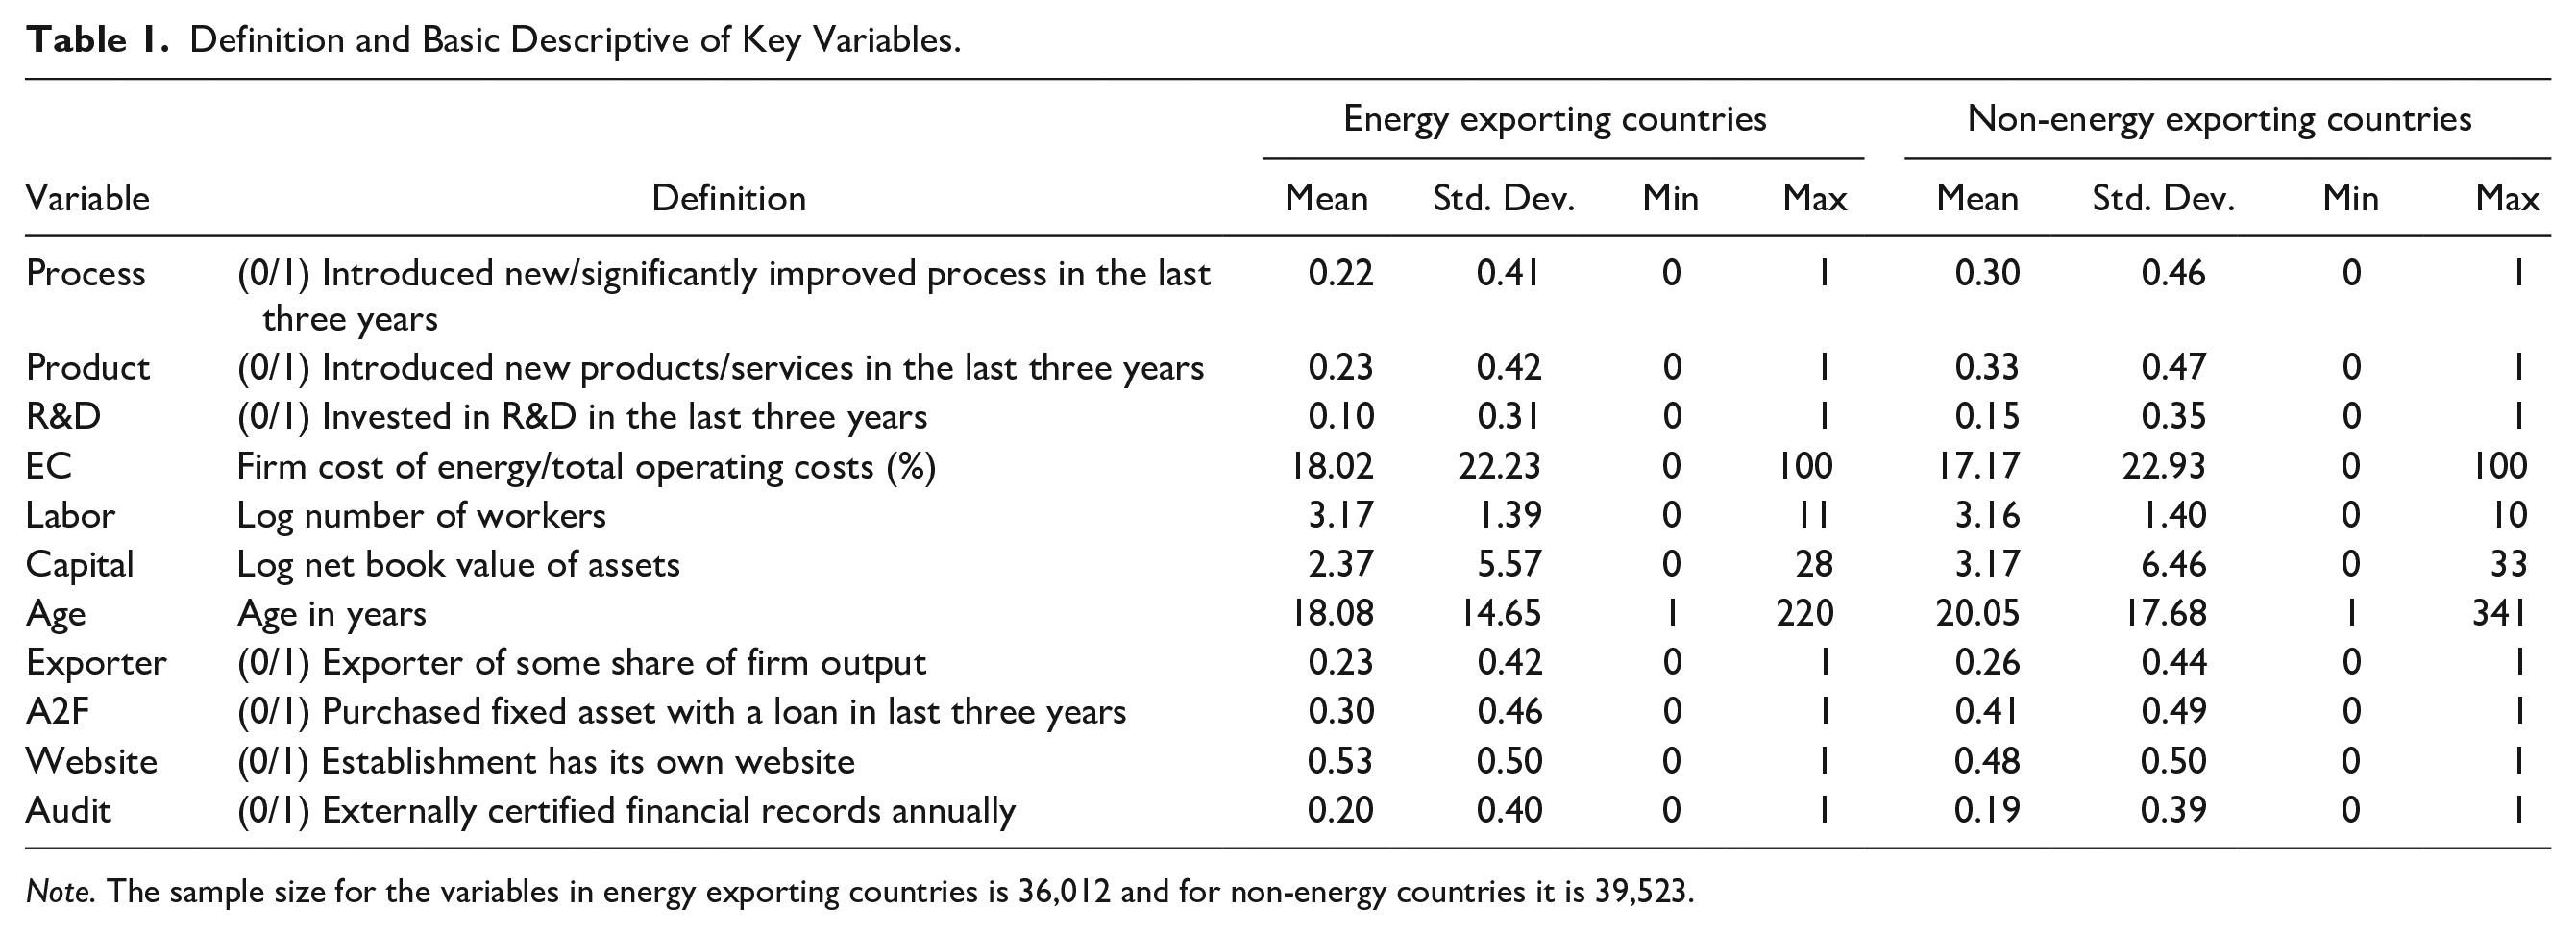
Note. The sample size for the variables in energy exporting countries is 36,012 and for non-energy countries it is 39,523.
There is a growing strand of literature that suggests that there is complementarity between different types of innovation (see Lewandowska, SzymuraTyc and Golkebiowski [2016], Doran [2012], and Bianchini, Pellegrino and Tamagni [2018] as examples). These studies point out that while product innovations create a differentiation effect focused on capturing new markets, process innovations are more oriented towards productivity increases and cost reduction. Similarly, Martínez-Ros and Labeaga (2009) argue that the manufacturing of a new product is often possible only if a new technological process is applied and, consequently, firms engaging in process innovation are more likely to engage in product innovation.
To examine if our results are robust to these complementarities, we develop two aggregate measures of innovation (Joint and Separate) that are also binary in nature but reflect the different strategies that firms use to innovate.
The key independent variable is relative energy cost
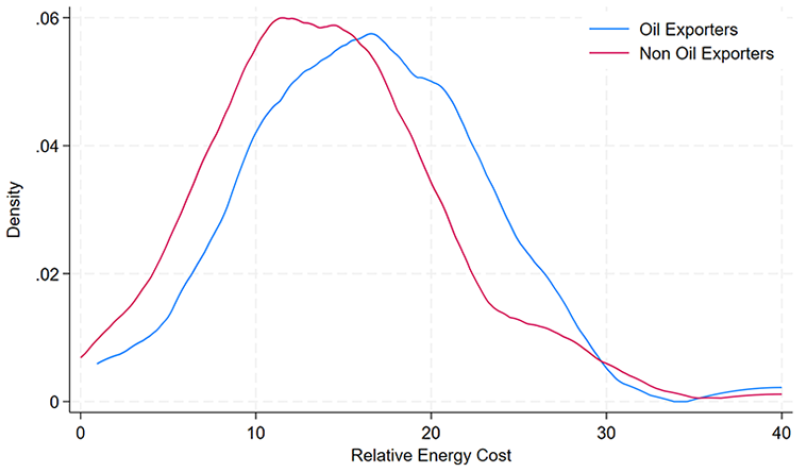
Kernel density plot of energy cost.
Control variables used in our regressions include size measured as log of the number of permanent employees (labor) and log net book value of assets (capital), foreign engagement measured as a dummy variable if the firm exports (exporter = 1 if yes, 0 otherwise), the firm’s access to finance measured as dummy variable if the firm used credit from a registered financial institution in the last three years to purchase fixed assets (A2F = 1 if yes, 0 otherwise), use of technology measured as a dummy variable if the firm own a website (website = 1 if yes, 0 otherwise), and a dummy variable if the firm gets its financial records audited by an independent accounting firm (audit = 1 if yes, 0 otherwise). To account for differences in country-industry specialization, we include a battery of country, industry, and time fixed effects and their interactions.
5. Results
Here we present our results after testing the two propositions highlighted above. We first present what we think is a naive approach to assess the relationship between relative energy costs and innovation in Table 2. In this table we run probit regressions consistent with equation (23). We present two panels of results corresponding to two sub-samples of BRI countries. Panel A are results using firms from energy exporting countries only and Panel B are regression results using only firms from countries that have no energy exports. The numbers shown are marginal effects computed at the sample mean with standard errors in parentheses. The dependent variable in columns 1 and 2 are process and product innovation respectively. Column 3 and 4 uses aggregate measures of innovation strategy (process & product = 1 [joint] for column 3 and process or product = 1 [separate] for column 4). Column 5 uses an innovation input measure, R&D. All regressions control for firm characteristics: labor, capital, age, exporting status, access to finance, technology usage, and audit.
Probit Results of Innovation and Energy Cost.
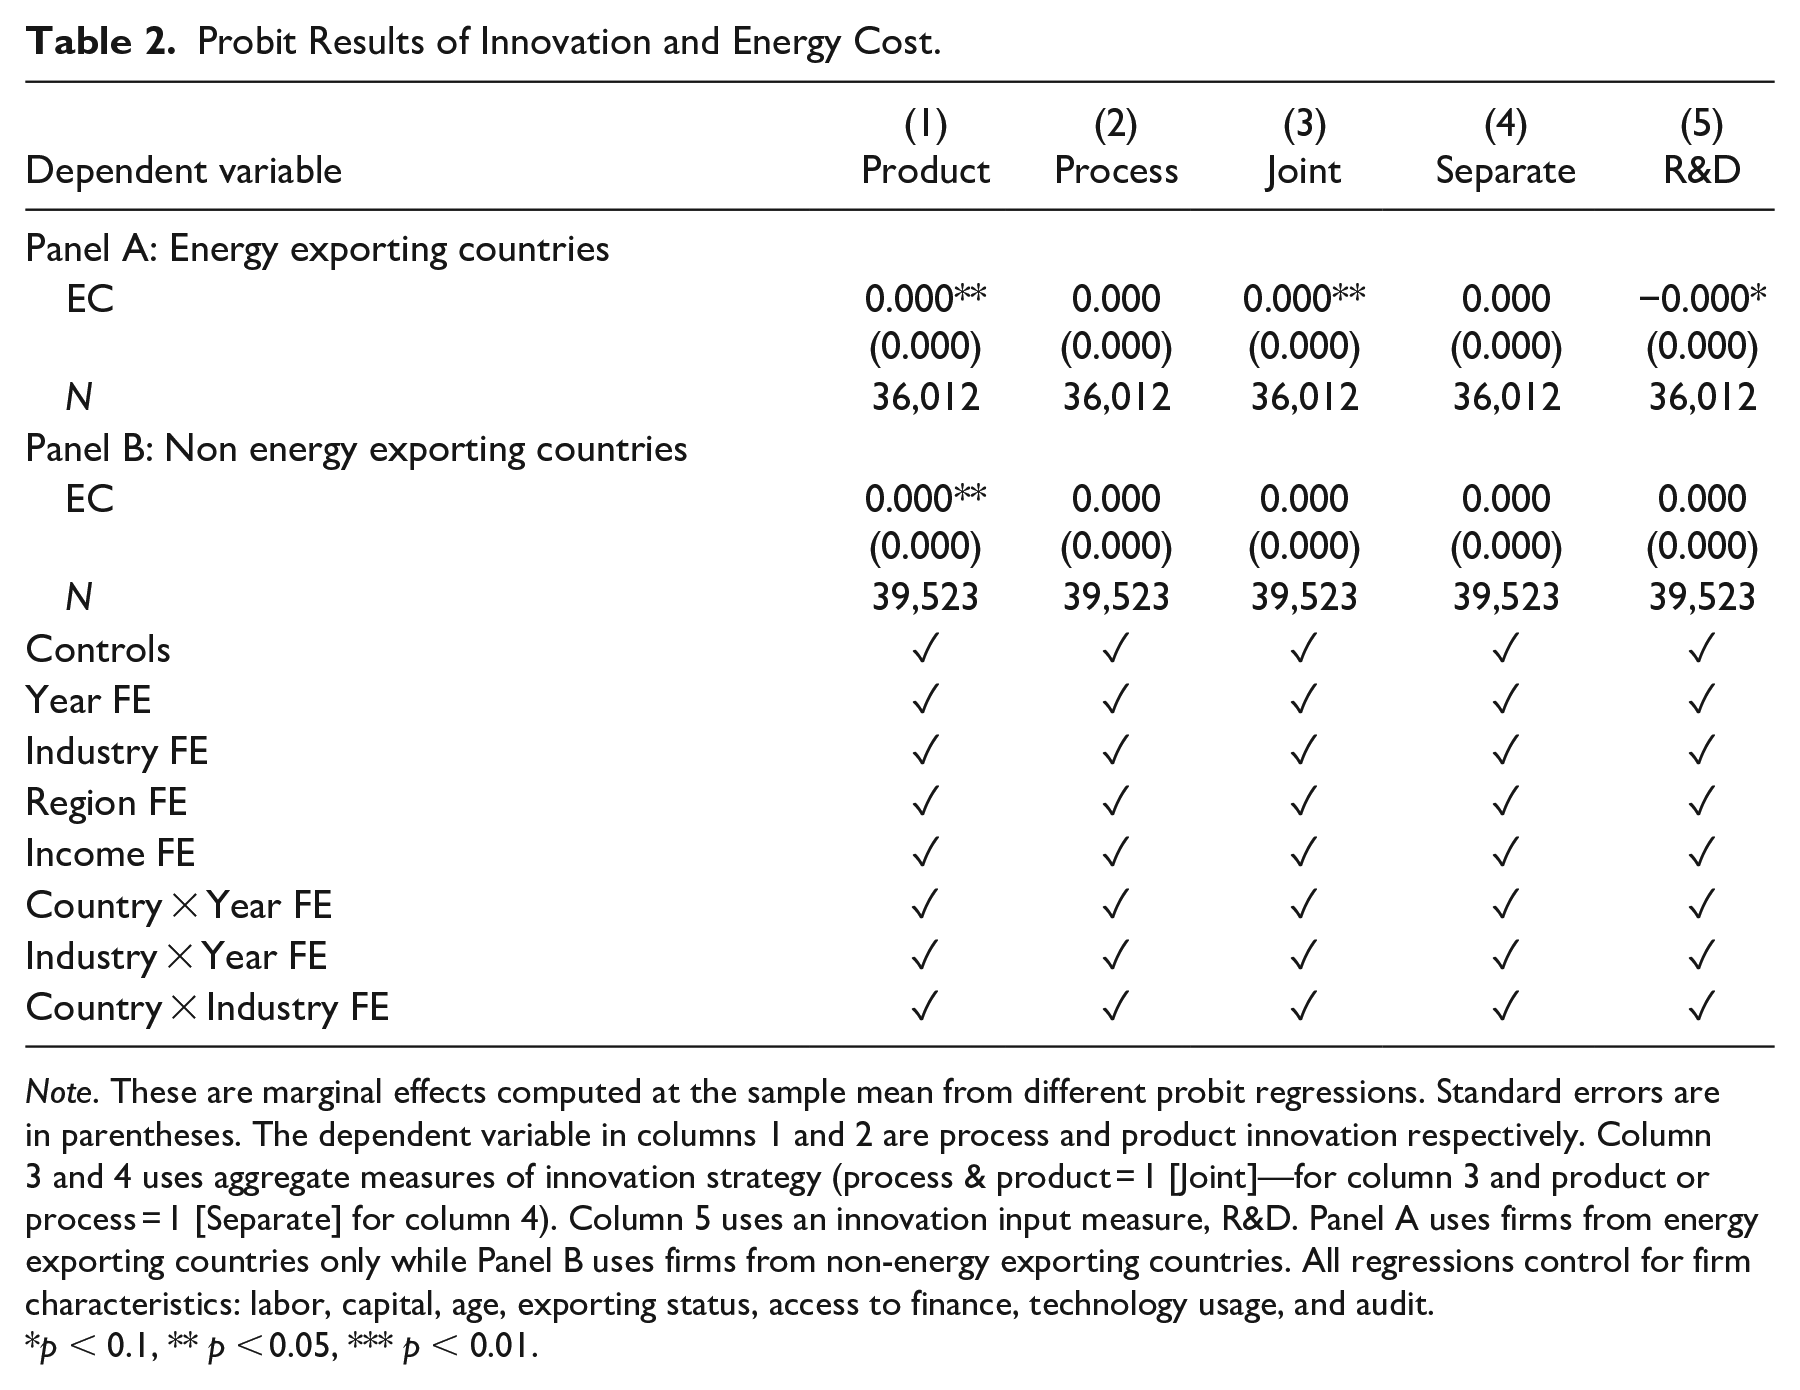
Note. These are marginal effects computed at the sample mean from different probit regressions. Standard errors are in parentheses. The dependent variable in columns 1 and 2 are process and product innovation respectively. Column 3 and 4 uses aggregate measures of innovation strategy (process & product = 1 [Joint]—for column 3 and product or process = 1 [Separate] for column 4). Column 5 uses an innovation input measure, R&D. Panel A uses firms from energy exporting countries only while Panel B uses firms from non-energy exporting countries. All regressions control for firm characteristics: labor, capital, age, exporting status, access to finance, technology usage, and audit.
p < 0.1, ** p < 0.05, *** p < 0.01.
From these results, consistent with the induced innovation hypothesis, the coefficient on
To address the endogeneity issues, we estimate equation (23) using an instrumental variables approach that instruments relative energy costs with
Second Stage Results: Innovation and Energy Cost.
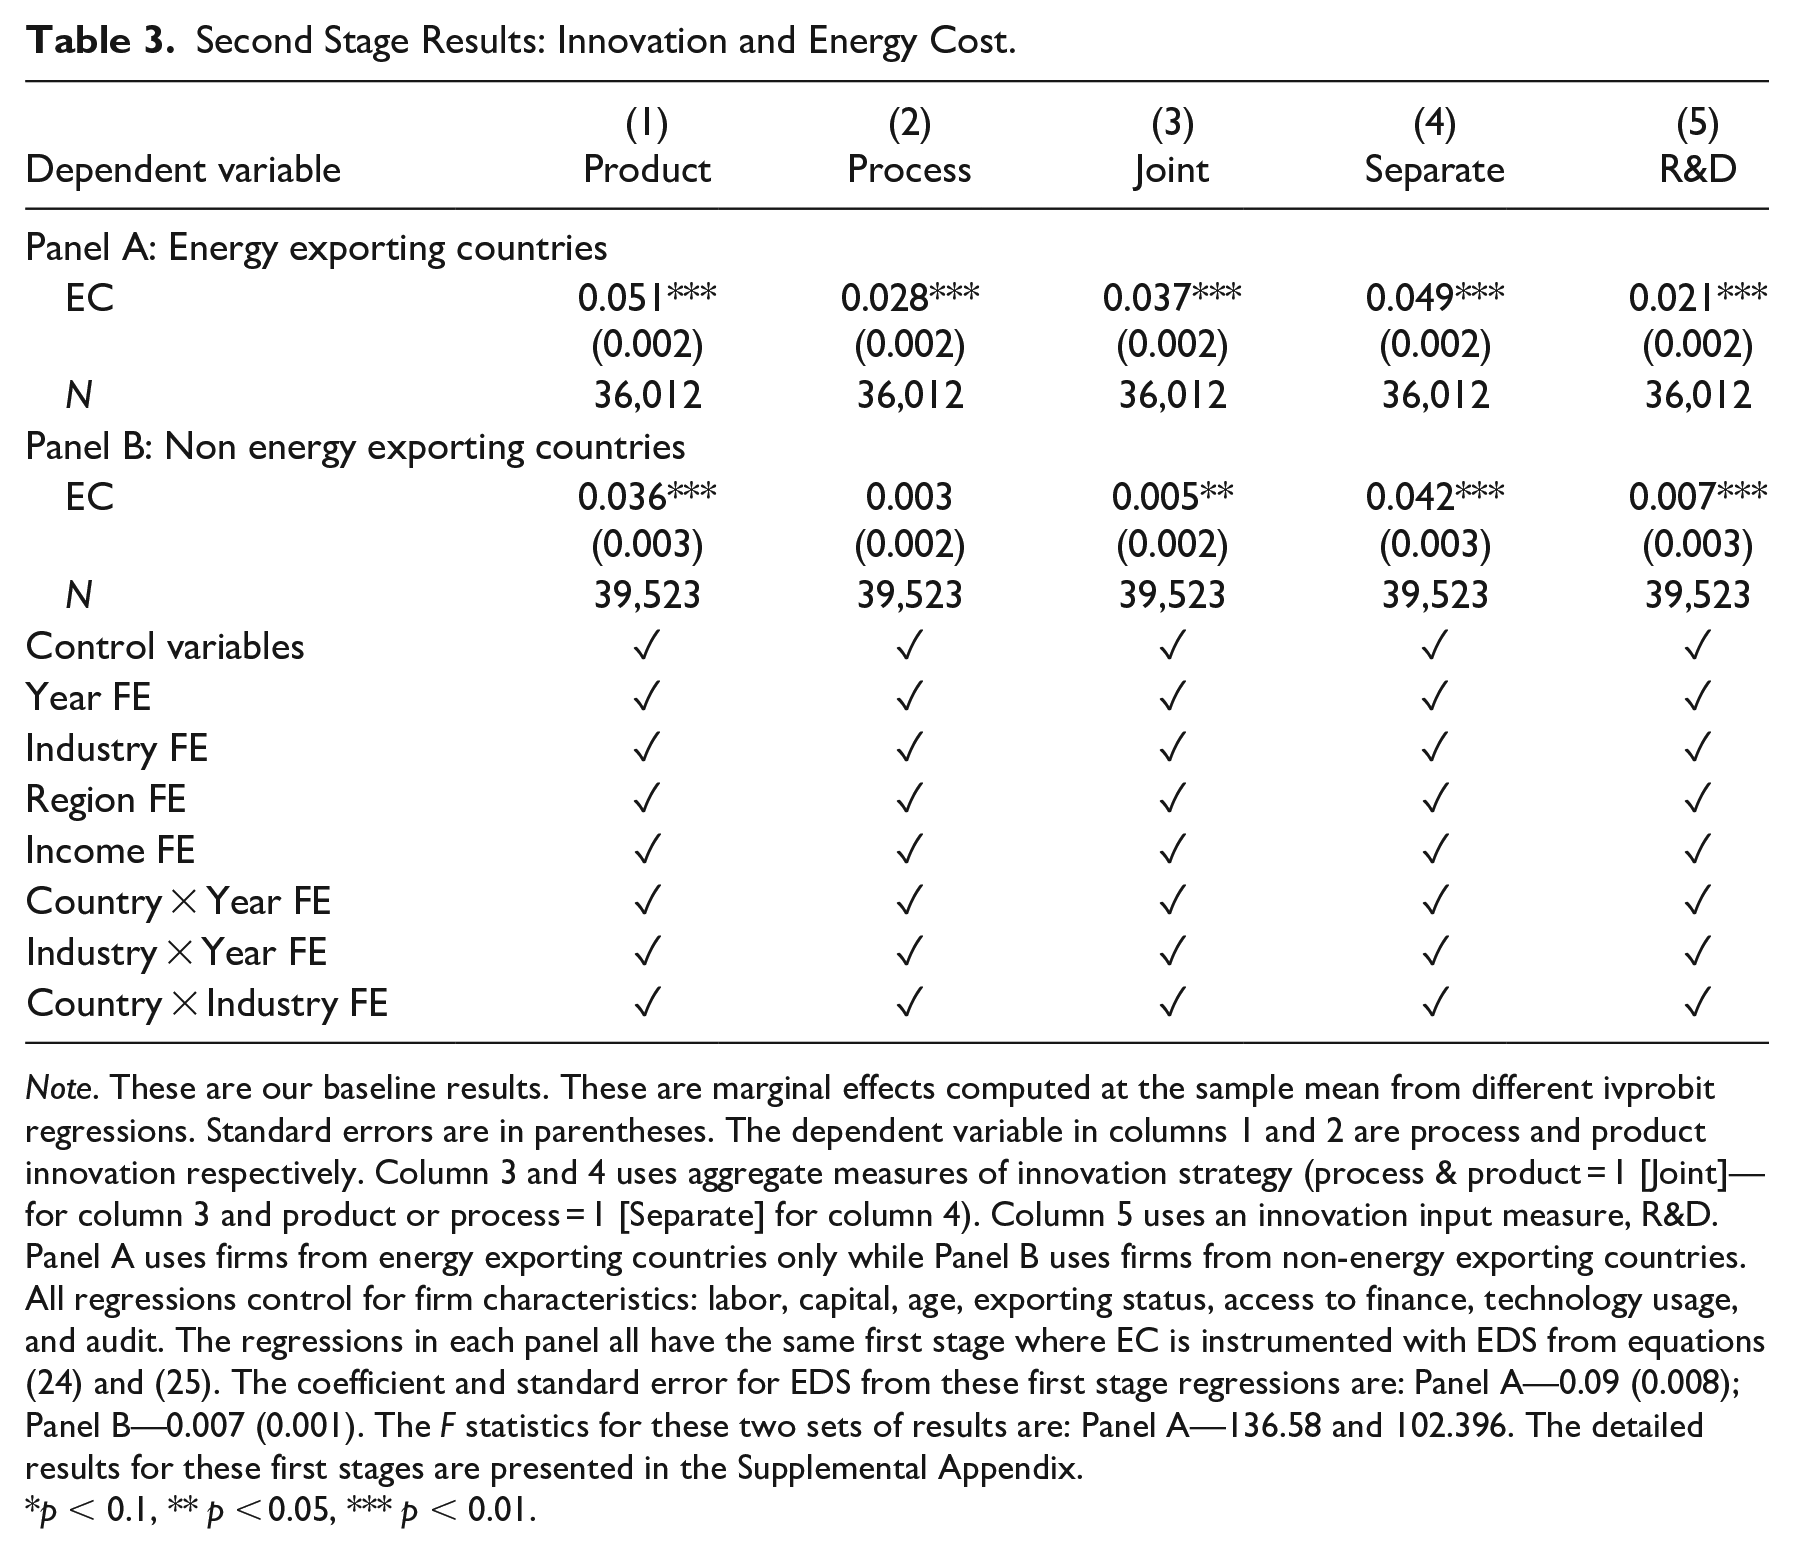
Note. These are our baseline results. These are marginal effects computed at the sample mean from different ivprobit regressions. Standard errors are in parentheses. The dependent variable in columns 1 and 2 are process and product innovation respectively. Column 3 and 4 uses aggregate measures of innovation strategy (process & product = 1 [Joint]—for column 3 and product or process = 1 [Separate] for column 4). Column 5 uses an innovation input measure, R&D. Panel A uses firms from energy exporting countries only while Panel B uses firms from non-energy exporting countries. All regressions control for firm characteristics: labor, capital, age, exporting status, access to finance, technology usage, and audit. The regressions in each panel all have the same first stage where EC is instrumented with EDS from equations (24) and (25). The coefficient and standard error for EDS from these first stage regressions are: Panel A—0.09 (0.008); Panel B—0.007 (0.001). The F statistics for these two sets of results are: Panel A—136.58 and 102.396. The detailed results for these first stages are presented in the Supplemental Appendix.
p < 0.1, ** p < 0.05, *** p < 0.01.
In Table 3, the numbers are marginal effects computed at the sample mean from different probit regressions. Standard errors are in parentheses. Again, we present two panels that differentiate the energy trade of the domestic economy. Panel A uses firms from energy exporting countries only while Panel B uses firms from non-energy exporting countries. The dependent variable in columns 1 and 2 are process and product innovation respectively. Column 3 and 4 uses aggregate measures of innovation strategy (joint for column 3 and separate for column 4). Column 5 uses an innovation input measure, R&D. All regressions control for firm characteristics: labor, capital, age, exporting status, access to finance, technology usage, and audit.
These results show that regardless of the measure of innovation,
To check for robustness, we adopt three distinct strategies. First, it is widely recognized that, as it regards innovation, the world is highly uneven, both at an international and on an intra-national level (Crowley and McCann 2018). There is also growing evidence that innovation varies across countries based on income. For instance, Morris (2018) points out that innovation in developing economies is likely to be different from innovation in developed countries—more incremental and less radical. Information on the type of innovation (radical or incremental) is not readily available in our dataset and so adopt a next best strategy to examine if there are heterogeneities as it relates to the impact of energy exports on developed and developing countries. Although we include income fixed effects in all our IV estimations that should deal with most of these issues, we cannot be sure that unobserved income effects, peculiar to some countries in this group do not evade these fixed effects.
As shown in the Supplemental Appendix, some of the countries in our dataset are high income countries according to the World Bank’s classification. Therefore, we examine the robustness of our results to this concern, we restrict the sample based on average economic income. We drop all firms from countries that the World Bank categorizes as high-income countries and re-estimate the baseline model. These results are presented in Table 4. Like above, Panel A contains estimates for firms in energy exporting countries and Panel B contains estimates for firms in non-exporting countries. All the regressions from this exercise show that
Second Stage Results: Innovation and Energy Cost for Developing Countries.
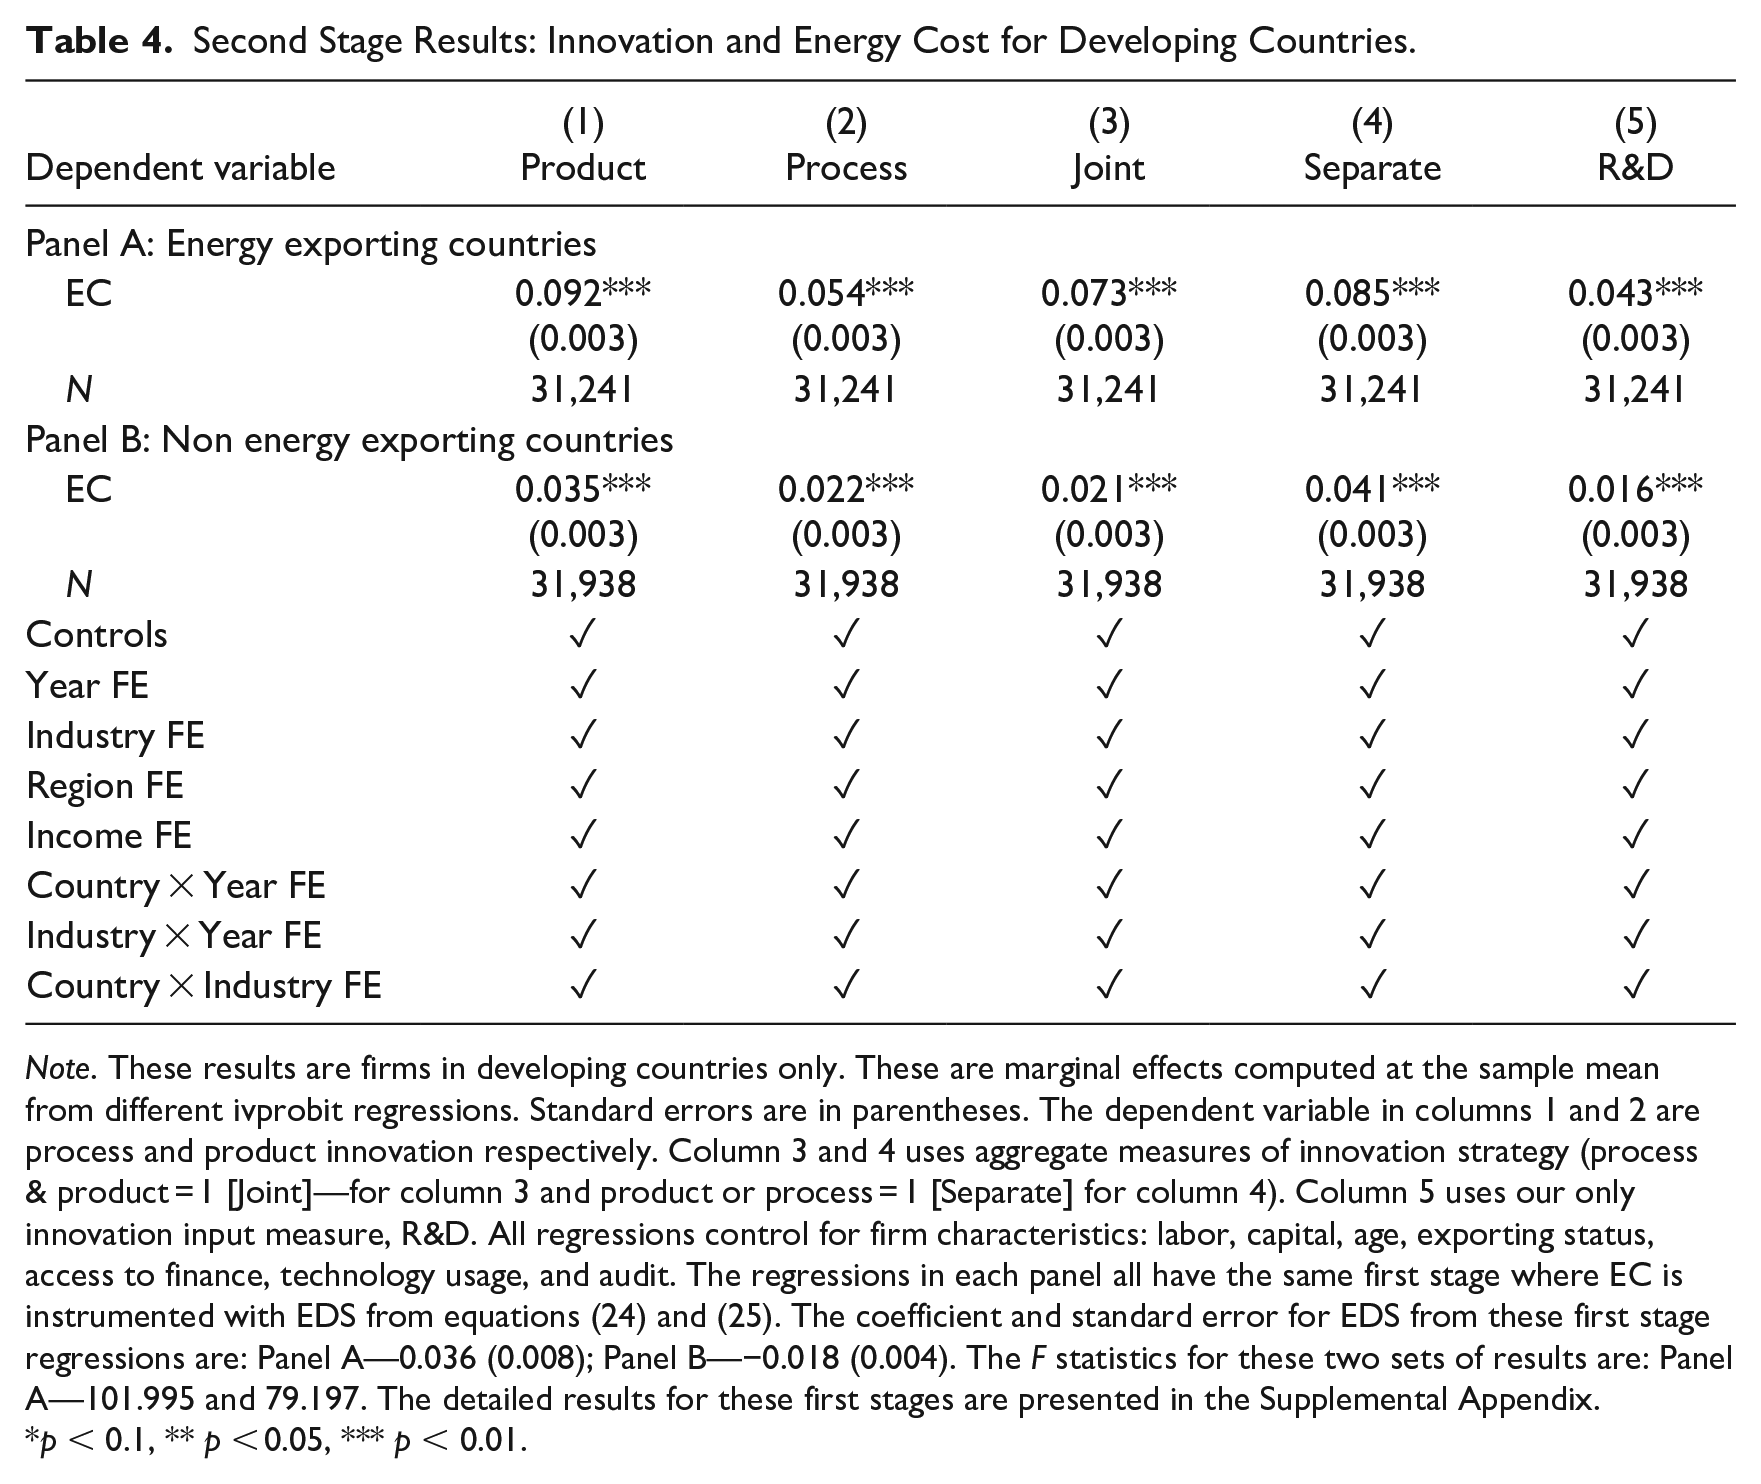
Note. These results are firms in developing countries only. These are marginal effects computed at the sample mean from different ivprobit regressions. Standard errors are in parentheses. The dependent variable in columns 1 and 2 are process and product innovation respectively. Column 3 and 4 uses aggregate measures of innovation strategy (process & product = 1 [Joint]—for column 3 and product or process = 1 [Separate] for column 4). Column 5 uses our only innovation input measure, R&D. All regressions control for firm characteristics: labor, capital, age, exporting status, access to finance, technology usage, and audit. The regressions in each panel all have the same first stage where EC is instrumented with EDS from equations (24) and (25). The coefficient and standard error for EDS from these first stage regressions are: Panel A—0.036 (0.008); Panel B—−0.018 (0.004). The F statistics for these two sets of results are: Panel A—101.995 and 79.197. The detailed results for these first stages are presented in the Supplemental Appendix.
p < 0.1, ** p < 0.05, *** p < 0.01.
Our second robustness check is to check if our results are overly influenced by the subset of firms in our sample that are in the services sector. It is widely reported that firms in the services sector tend to undertake product innovation at a much lower propensity compared to manufacturing firms and focus mainly on process innovation (Alvarez, Bravo-Ortega and Zahler 2015). As such, we remove the firms in the services sector, re-estimate our baseline model and present the results in Table 5. These results are broadly in line with our baseline results and suggest that increases in energy costs result in increased innovation likelihood.
Second Stage Results: Innovation and Energy Cost for Manufacturing Firms.
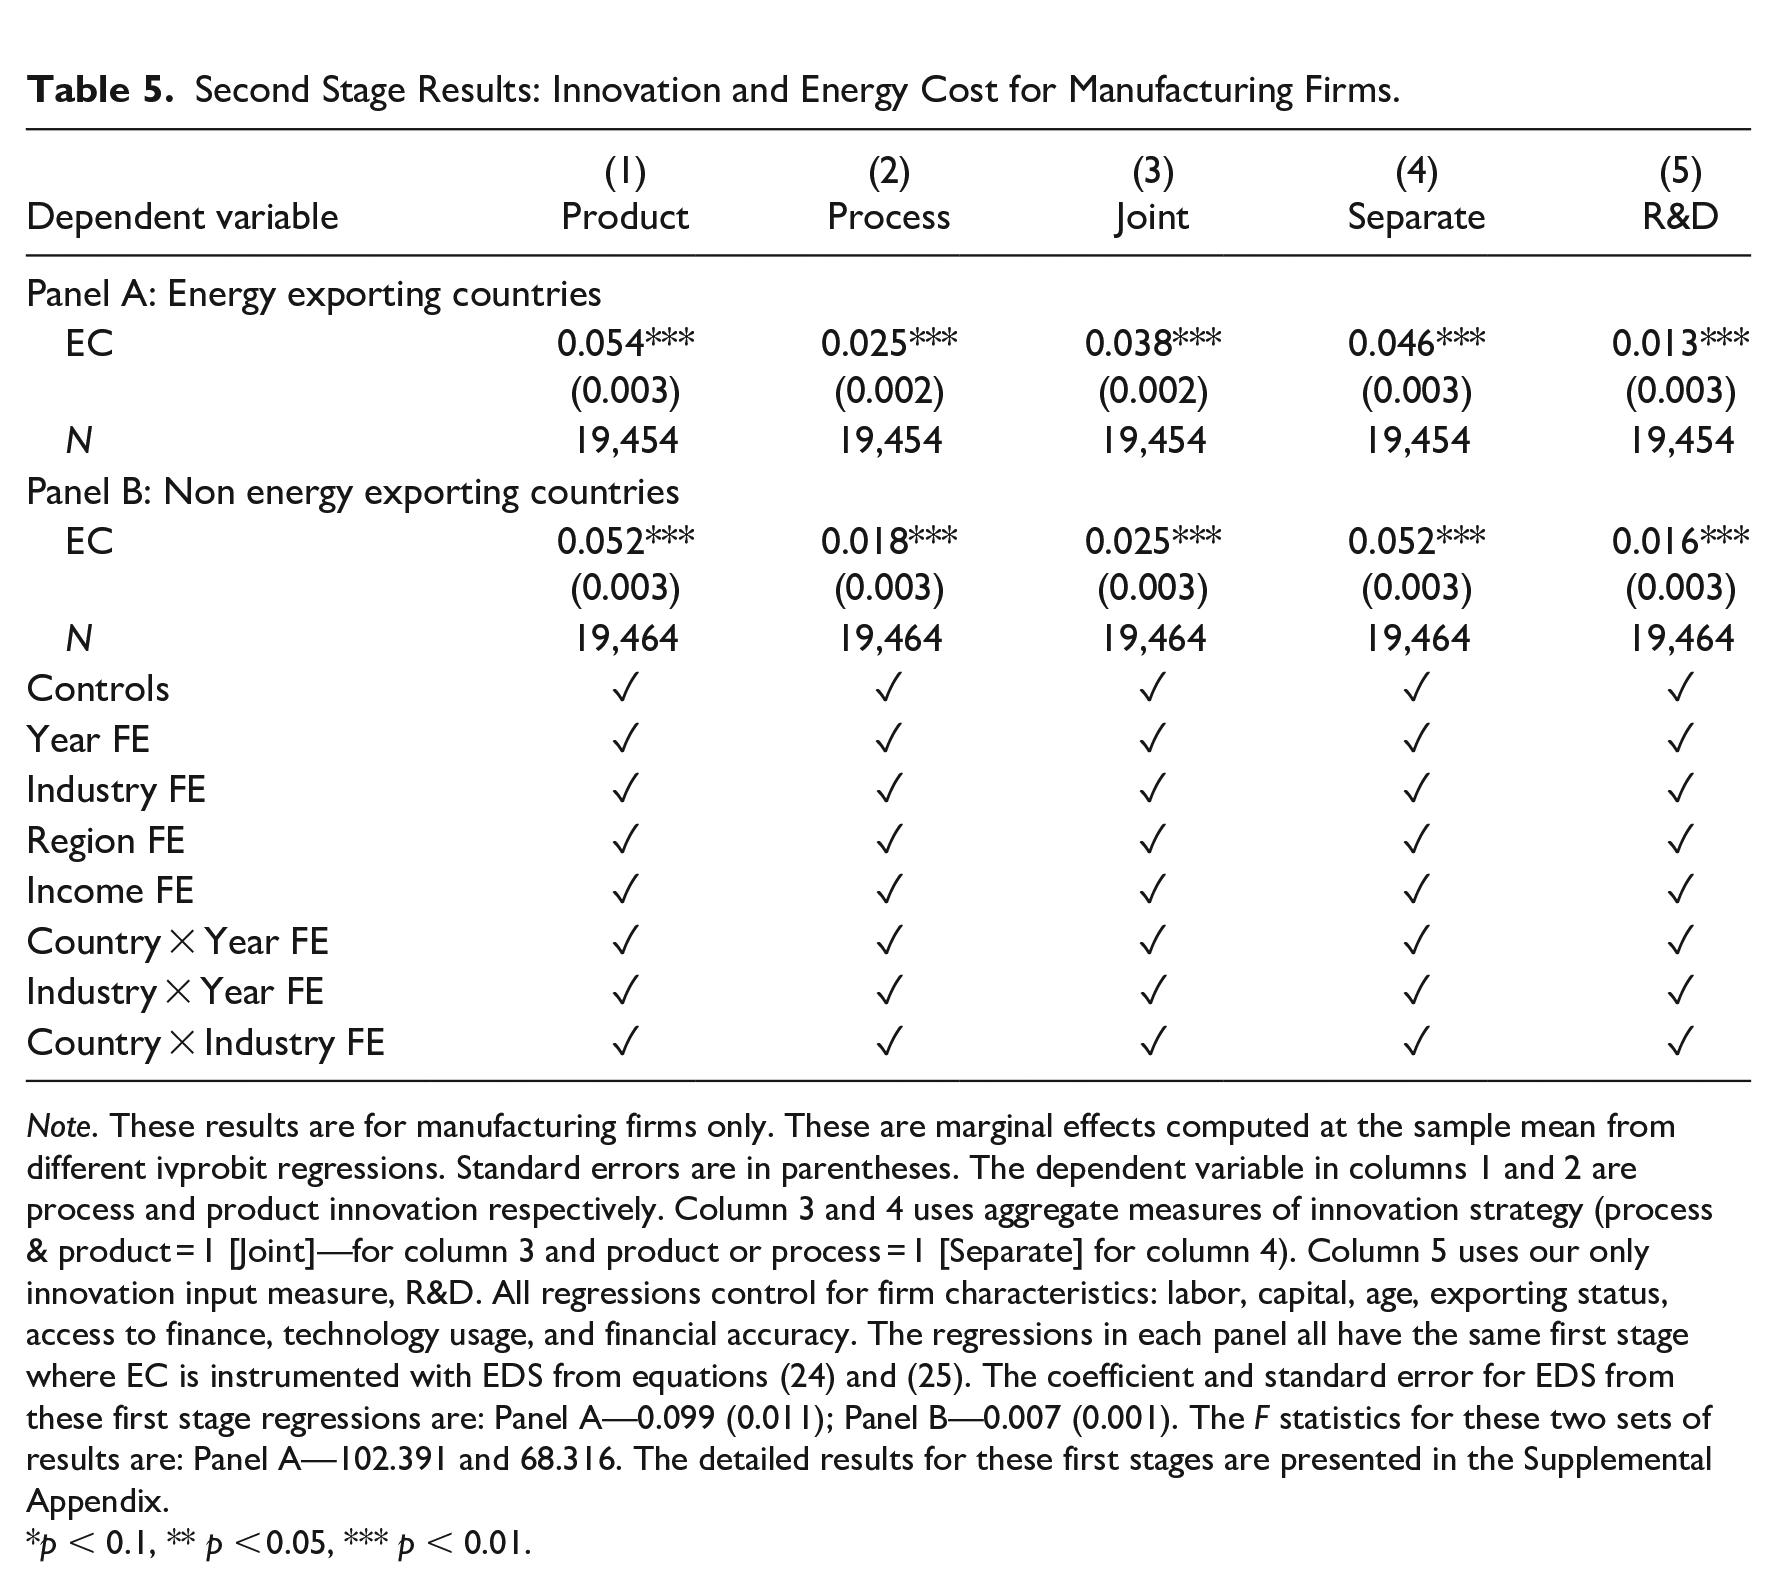
Note. These results are for manufacturing firms only. These are marginal effects computed at the sample mean from different ivprobit regressions. Standard errors are in parentheses. The dependent variable in columns 1 and 2 are process and product innovation respectively. Column 3 and 4 uses aggregate measures of innovation strategy (process & product = 1 [Joint]—for column 3 and product or process = 1 [Separate] for column 4). Column 5 uses our only innovation input measure, R&D. All regressions control for firm characteristics: labor, capital, age, exporting status, access to finance, technology usage, and financial accuracy. The regressions in each panel all have the same first stage where EC is instrumented with EDS from equations (24) and (25). The coefficient and standard error for EDS from these first stage regressions are: Panel A—0.099 (0.011); Panel B—0.007 (0.001). The F statistics for these two sets of results are: Panel A—102.391 and 68.316. The detailed results for these first stages are presented in the Supplemental Appendix.
p < 0.1, ** p < 0.05, *** p < 0.01.
A skeptic of our results so far may argue that our empirical approach could be more succinctly summarized into a single equation with an indicator variable used to signal if firm
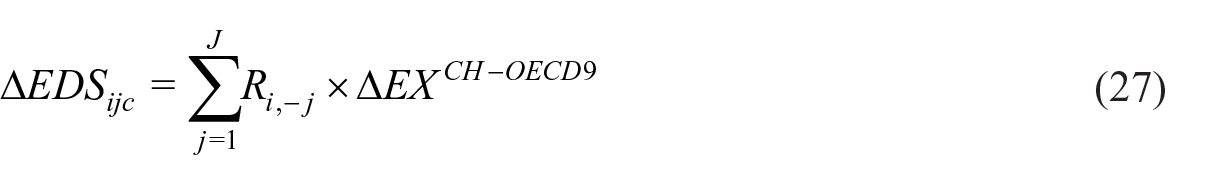
where
Second Stage Results: Innovation and Energy Cost with Alternative Instrument.
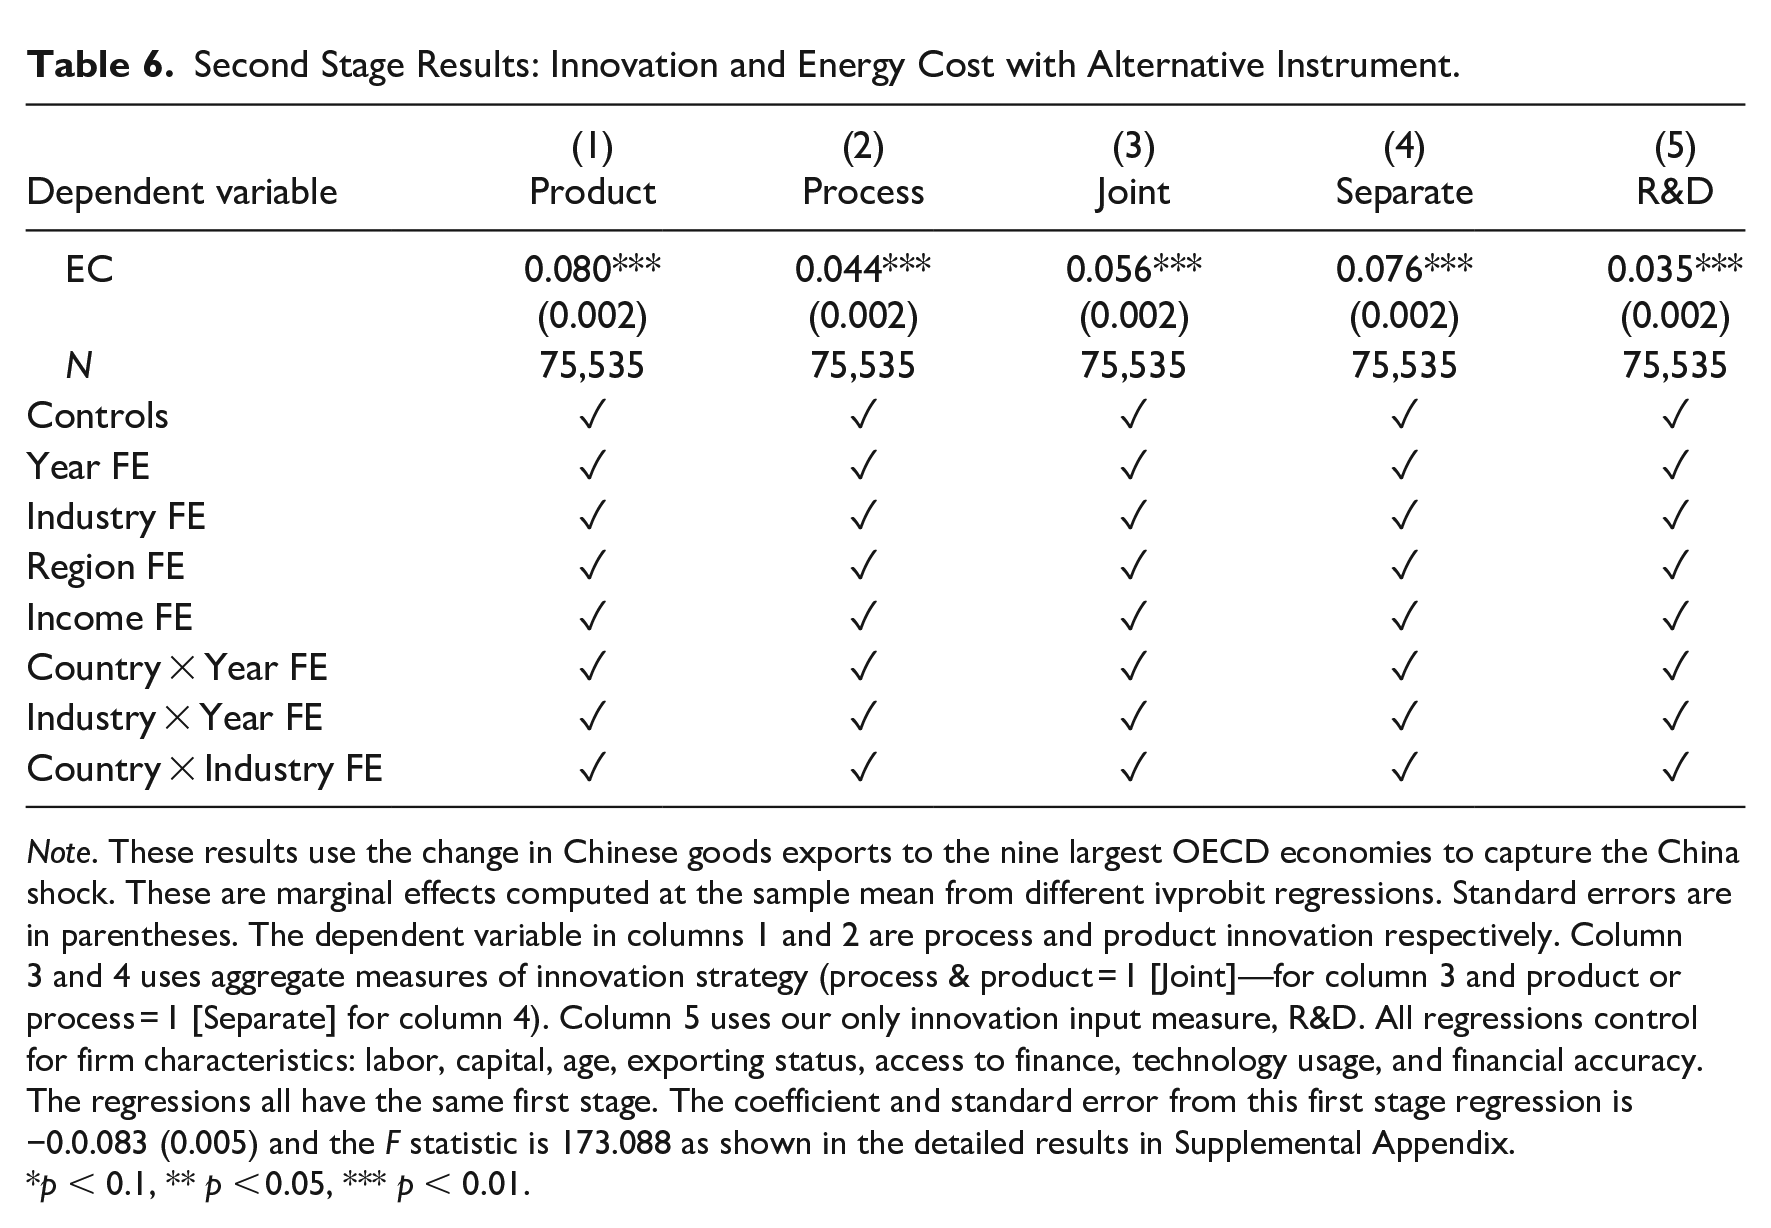
Note. These results use the change in Chinese goods exports to the nine largest OECD economies to capture the China shock. These are marginal effects computed at the sample mean from different ivprobit regressions. Standard errors are in parentheses. The dependent variable in columns 1 and 2 are process and product innovation respectively. Column 3 and 4 uses aggregate measures of innovation strategy (process & product = 1 [Joint]—for column 3 and product or process = 1 [Separate] for column 4). Column 5 uses our only innovation input measure, R&D. All regressions control for firm characteristics: labor, capital, age, exporting status, access to finance, technology usage, and financial accuracy. The regressions all have the same first stage. The coefficient and standard error from this first stage regression is −0.0.083 (0.005) and the F statistic is 173.088 as shown in the detailed results in Supplemental Appendix.
p < 0.1, ** p < 0.05, *** p < 0.01.
6. Discussion
Our results suggest that rising relative energy costs induces firms to innovate. This is in line with the predictions from the induced innovation hypothesis which suggests that changes in factor prices can influence firms’ incentives to invest in innovation (see Triguero, Moreno-Mondéjar and Davia [2014] and Newell [2010] as examples). Our findings underscore the need for governments to strike a balance between economic objectives and broader societal goals. Policies that promote innovation and factor price adjustments should be designed in a way that considers social and environmental impacts. For instance, governments can align innovation incentives with sustainability goals to encourage the development and adoption of eco-friendly innovation and incentivize such activities.
As such, there are two dimensions to our results that need to be considered for policy development. First, innovation is risky, firm specific, and a firm’s effectiveness in bringing it to fruition is most times inadequately monitored (Cirera and Muzi 2016). There is a time lag between a firm’s decision to invest in innovation, the associated innovation investment outlays, and the resulting innovation success. This period is fraught with risks for the firm, compounded by challenges related to access to finance (Morris 2018). Therefore, governments should consider implementing policies that incentivize private sector R&D spending, such as tax credits, grants, or public-private partnerships. Moreover, they can provide financial support and create a favorable innovation ecosystem to stimulate firms to invest in R&D activities, leading to the development of new technologies and the accumulation of knowledge. Furthermore, governments can play a crucial role in facilitating the transfer and diffusion of innovation across industries and sectors by implementing policies that promote technology spillover, knowledge exchange, and collaboration between academia, industry, and research institutions.
Second, it is worth noting that rapidly rising energy costs can pose challenges to firms, especially those that are energy-intensive or rely heavily on energy inputs. There is a welfare argument that governments should provide support to these firms to maintain economic stability, preserve jobs, and sustain competitiveness in domestic and international markets. This kind of support can help to mitigate the negative impacts of rising energy prices, allowing firms to adapt and remain viable but our results suggests that careful economic analyses of the impact of these support programs are warranted before governments engage in these stabilization policies. Governments should recognize that policies affecting factor prices, such as taxes, subsidies, or regulations, can have significant implications for the direction and pace of technological change. By carefully evaluating the intended impacts of support programs, governments can encourage the development and adoption of technologies that align with broader societal goals, such as environmental sustainability or productivity improvements.
In addition, although not directly examined in our analysis, to cope with rising relative energy costs, governments may support firms in developing domestic energy resources, diversifying energy supply, and promoting energy independence. This support can contribute to enhanced energy security, reduced price volatility, and a more reliable energy infrastructure.
7. Conclusion
We test the induced innovation hypothesis in this paper by developing a theoretical framework that shows that the relationship between innovation and the relative cost of energy is different in countries depending on whether they export energy or not. We test the propositions from this theoretical framework by focusing on countries that signed a memorandum of understanding with China as part of the BRI. We instrument a firms relative energy cost with a measure of competitive pressure posed by rising energy demand shock in other countries. To operationalize a demand shock that raises energy prices, in our empirical analyses we use an instrumental variables approach that exploits China’s unexpected and drastic rise in energy demand to fuel its goods exports since the early 1990s (the China shock).
Overall, we find that regardless of the measure of innovation (product innovation, process innovation, R&D), increasing energy costs induces firms to innovate. In terms of magnitude, we find that a 1 percent increase in the cost of energy relative to other firm costs increases the likelihood of innovation by between 2.1 and 5.1 percent in energy exporting countries. The impact in non-energy exporting countries is slightly smaller, ranging from 0.5 to 3.6 percent. This suggests that in countries that do not export energy, a 1 percent increase in the relative cost of energy results in at least a 0.5 percent increase in the likelihood that a firm innovates. These results are robust to various methodological variations and data restriction exercises.
Our analysis is conditioned on some data limitations that are worth mentioning. The dataset is an uneven cross section and so firm level heterogeneity may not be completely accounted for. Adopting a similar approach to the one employed in this paper using panel datasets would help to assess the relative generalizability of our findings. A panel dataset could also help with introducing a dynamic element to the assessment and allow for a more targeted approach to control for cyclical effects. We know from the existing literature that there is a lagged effect of investments in innovation on firm level outcomes and so these dynamics would not only allow for an explicit examination of issues related to persistence of innovation but also of the energy demand shocks we study in the paper. Also, there may be some difference in results when a continuous measure of innovation is used in the estimations versus when this measure is binary. For this approach to be meaningful, there is a need for better data on the proportion of firm output attributable to an innovative activity. These are all avenues for future research.
Supplemental Material
sj-docx-1-enj-10.1177_01956574241266969 – Supplemental material for Innovation and Spillover Effects of Energy Demand Shocks in Belt and Road Economies
Supplemental material, sj-docx-1-enj-10.1177_01956574241266969 for Innovation and Spillover Effects of Energy Demand Shocks in Belt and Road Economies by King Yoong Lim and Diego Morris in The Energy Journal
Supplemental Material
sj-pdf-2-enj-10.1177_01956574241266969 – Supplemental material for Innovation and Spillover Effects of Energy Demand Shocks in Belt and Road Economies
Supplemental material, sj-pdf-2-enj-10.1177_01956574241266969 for Innovation and Spillover Effects of Energy Demand Shocks in Belt and Road Economies by King Yoong Lim and Diego Morris in The Energy Journal
Footnotes
Acknowledgements
We thank the participants at the 41st Eurasia Business and Economics Society (EBES) Conference and the 28th Review of Socio-Economic Perspectives (RSEP) International Conference on Economics, Finance & Business. We are also extremely thankful to our respective departmental colleagues for their invaluable feedback and comments on an earlier draft of the paper. We are also grateful to the editor and three anonymous referees for their feedback and suggestions to improve the paper. The views expressed are our own.
Declaration of Conflicting Interests
The author(s) declared no potential conflicts of interest with respect to the research, authorship, and/or publication of this article.
Funding
The author(s) received no financial support for the research, authorship, and/or publication of this article.
Supplemental Material
Supplemental material for this article is available online.
1
2
The full list of countries that we include, the year they joined the BRI and the specific income grouping they belong according to the World Bank are included in Supplemental Appendix B. This initiative was started by President Xi Jinping to improve China’s connection with the rest of the world.
3
Economic income group fixed effects and geographic region fixed effects are based on the World Bank’s income and regional grouping of countries. This categorization of income and region is shown in the Supplemental Appendix.
References
Supplementary Material
Please find the following supplemental material available below.
For Open Access articles published under a Creative Commons License, all supplemental material carries the same license as the article it is associated with.
For non-Open Access articles published, all supplemental material carries a non-exclusive license, and permission requests for re-use of supplemental material or any part of supplemental material shall be sent directly to the copyright owner as specified in the copyright notice associated with the article.