
Abstract
Background:
Informal caregiving is seen as a low-cost substitute for care provided by health care professionals. However, caregiving is known to negatively impact caregivers’ health and, subsequently, their health care use and costs. This could potentially offset the caregivers’ contributions to the health care system.
Objective:
We examined the impact of caregiving on costs associated with caregivers’ use of publicly funded health care services in Ontario, Canada, in comparison with non-caregivers.
Methods:
We included Ontarians who participated in the Canadian Community Health Survey-Healthy Aging Supplement Survey of 2008/09 and linked responses to health care administrative databases. A difference-in-differences design was used to capture differences in caregivers’ and non-caregivers’ total health care costs 1 and 2 years before and after caregiving start date. Generalized Linear Models were used to model the total health care costs.
Results:
The sample size was 4275 with 1265 caregivers and 3010 non-caregivers. We found that while health care utilization increased over time, it increased by a lesser amount for caregivers than non-caregivers. Adjusted total health care costs for caregivers were 11.32% (SE = 0.05, ρ = 0.02) lower than non-caregivers 2 years into caregiving.
Conclusions:
Our study reveals a critical gap in policy, practice, and research driven by a lack of routine data collection and caregiver identification. It also highlights the need for additional longitudinal research focusing on caregivers’ objective health.
Approximately one quarter of the Canadian population identifies as informal caregivers—those aged 15 and older who provide care, without pay to family members, friends, and others living with health conditions or limitations—hereafter referred to as caregivers. 1 In Canada, caregivers contribute an estimated $24 billion annually to the care system, reflecting the value of the time they spend on caregiving, which would otherwise necessitate paid formal care. 2 There is a growing reliance on caregivers around the world, including Canada, due in part to an aging population as well as a shift from acute care to home and community care to decrease costs.3-5 This is, in part, because informal care is seen as a lower cost substitute to care provided by health care providers. As such, the prevailing assumption is that caregiving results in system-level savings.6,7
Caregiving Influences Health
Despite positive aspects of caregiving such as personal growth and a sense of closeness to the patient,8,9 caregiving is not without consequences. Research suggests that caregiving is a source of stress and leads to illness, 10 including but not limited to depression, anxiety, stress, cardiovascular disease, and sleep disturbance.11,12 Studies comparing the psychological and physical health of caregivers of frail older adults to non-caregivers found significant differences with regard to perceived depression, perceived stress, general subjective well-being, self-efficacy, and physical health in favor of non-caregivers.10,13 According to Andersen’s Behavioral Model and Access to Medical Care, 14 such health consequences could affect how individuals (eg, a caregiver) use health care services. There is, in fact, evidence of increased health care service use among caregivers such as self-reported medication use15-17; emergency department, physician, and outpatient visits; and hospitalizations.13,15
While such self-reported data overwhelmingly point to an increase in health care needs due to caregiving, empirical data on caregivers’ use and cost for health care services is rare. This could be attributed to the fact that, in most countries, there is no marker in administrative databases to routinely identify individuals in their role as caregivers. 18 The existing studies are often cross-sectional, comparing subgroups of caregivers, limited in scope, and with mixed results.19-21 We identified only one study that compared caregivers’ and non-caregivers’ health care utilization and expenditures using administrative databases; the study found that caregivers had significantly lower hospitalizations, emergency room visits, and drug expenditures in comparison with non-caregivers. 22 This suggests that our collective understanding of caregivers’ health needs and health care use is limited, potentially affecting the care systems’ ability to provide the right support at the right time for caregivers.
Purpose
To address this gap in the literature, the purpose of the present study was to investigate the patterns of health care utilization and costs by caregivers over time in comparison with non-caregivers. This current study adds to the literature by utilizing linked administrative databases (a focus on realized care utilization vs subjective utilization of care services by caregivers). Our study is the first Canadian study and among only a few longitudinal international studies examining the impact of caregiving on caregivers’ total health care costs in comparison with non-caregivers using rigorous quantitative methods and administrative databases.
Methods
Study Setting, Period, and Population
This study was undertaken in Ontario, which is the most populous 23 province in Canada. Since 2000, Statistics Canada has conducted the Canadian Community Health Survey (CCHS), an annual cross-sectional survey to collect information on Canadians’ health. The CCHS collects data from a representative sample of all persons aged 12 and over in 10 Canadian provinces and 3 territories. 24 The 2008 to 2009 CCHS included a supplement, the Healthy Aging Survey (HAS), focused on factors impacting healthy aging including caregiving among Canadians aged 45 and over. 24 Data were collected between December 1, 2008, and November 30, 2009. The study period covers caregivers’ utilization and associated costs from December 1, 2001, to November 30, 2016. We limited the study population to Ontarians who participated in the CCHS-HAS and provided consent for linking their survey results to administrative databases inclusive of all publicly paid health care services. Ethics approval was obtained from the Health Sciences Research Ethics Board of the University of Toronto.
Data Sources
The survey results were linked to health administrative databases using unique encoded identifiers at the Institute for Clinical Evaluative Sciences (ICES). ICES is an independent, non-profit research institute whose legal status under Ontario’s health information privacy law allows it to collect and analyze health care and demographic data, without consent, for health system evaluation and improvement. Different databases were used to track caregivers’ utilization and calculate the associated costs. This includes costs of acute care, physician and laboratory care, home care, prescription drugs for eligible individuals, and long-term care services. 25 A comprehensive list and description of ICES databases can be found in Table S1.
Measures
Outcome
The outcome measure was the total government health care costs associated with the use of publicly funded health care services in Ontario. It was defined as the sum of costs associated with utilization of care services in 5 categories: acute care (inpatient hospitalization, emergency department visits, rehabilitation, complex and continuing care, and admissions to designated mental health beds); home care and long-term care; physician care (physician payments for visits based on fee-for-service and capitation models in Ontario); prescription drugs for adults 65+ and those receiving disability payments; and others (laboratory and non-physician visits). Total government health care spending was estimated using a person-level costing methodology, which matches utilization from each source of care with appropriate costs calculated from provincial expenditure data. 26 The total cost does not include costs of day surgery and outpatient clinics (dialysis, and oncology clinic visits) due to data availability. All costs were adjusted for inflation to FY 2023.
Exposure
The study examined the impact of caregiving status (being a caregiver vs not) on the outcome 1 and 2 years before and after the caregiving start date. The exposure group consisted of Ontarians who self-identified as caregivers and provided care for at least 1 year before the CCHS data collection date. Those who provided care for more than 5 years were excluded as the caregiving start date could not be established. The comparison group consisted of CCHS respondents who did not self-identify as caregivers. The index date was defined as the start of the individual’s caregiving responsibilities; proxy exposure dates were calculated for non-caregivers (a frequency distribution was generated for non-caregivers by calculating the number of months between the caregivers’ index date and their survey interview date) as presented in Table S2.
Covariates
To account for potential confounders, the following covariates were included in the study: age (45-54, 55-64, 65-74, 75-84, ≥85), sex, neighborhood income quintile (poorest [Q1] to wealthiest [Q5]), and rurality index of Ontario (urban [0-9], suburban [10-39], rural [≥40]).27,28 A measure of co-morbidity (number of chronic conditions [1, 2, 3, 4, 5+]) 29 was also added. Enrollment in physician care models (fee-for-services, 28 team-based, no team) in Ontario, and Bice-Boxerman Continuity of Care Index (CoC) 30 were added as measures of access to formal services (a continuous variable from 0 to 1, with 1 indicating high continuity of care). 31 CoC is only a true measure of continuity for individuals with 2 or more physician visits during a given year; as such, a categorical variable, number of visits (1 if physician care visit <2), was added to the model. 31 All covariates were derived from the relevant administrative databases at the index date; the CoC, however, was calculated using data from a year prior to the index date.
Statistical Analysis
A difference-in-differences (DID) design was used to capture differences in caregivers’ and non-caregivers’ total health care costs 1 year (Year 1 analysis) and 2 years (Year 2 analysis) before and after the index date. The DID design first measures the difference in cost before and after the index date for caregivers and for non-caregivers and then contrasts the differences between the 2 groups. The parallel trend assumption was tested to ensure internal validity of the DID design (Figure S3). Given the known distribution of total health care expenditure (ie, skewed distribution and large volume of zeros), 32 generalized linear models (GLM) were chosen to model the total health care costs. A significance level of .05 was used for the analysis. A missing rate of 5% was assumed to result in unbiased estimations. 33 Two main sets of sensitivity analyses were conducted. The first set of analyses addressed potential selection bias from caregivers being younger and healthier than non-caregivers. As such, the total health care costs analyses were repeated excluding (a) costs 6 months prior to death for individuals who died during the study period, (b) individuals aged 75 years and older, and (c) those who were not eligible for the Ontario Health Insurance Plan (OHIP) during the study period. The second set of analyses focused on the different components of total health care costs to draw more information on underlying reasons for differences between caregivers and non-caregivers’ health care expenditure; a 2-part GLM was used if a significant proportion of zero-cost was observed in any of the categories (Table S4). All analyses were performed using SAS Enterprise Guide 7.15 (SAS Institute Inc, Cary, NC, USA).
Results
Sample characteristics are presented in Table 1. The sample size was 4275 with 1265 caregivers and 3010 non-caregivers. The average age was 62.6 (SD = 11.1) and 67.7 (SD = 13.1) for caregivers and non-caregivers, respectively. Nearly 58% of caregivers and 54% of non-caregivers were female. The majority of caregivers and non-caregivers lived in urban areas. In terms of number of chronic conditions, 7.4% of caregivers and 12.2% of non-caregivers had 5 or more conditions. On average, caregivers had lower unadjusted total costs in 1 and 2 years prior to the index date in comparison with non-caregivers (Table 2). Generally, caregivers appeared to be younger and healthier than non-caregivers at the index date. Missing data were only present for age (2.04%) and income quintile (0.19%).
Sample Characteristics.
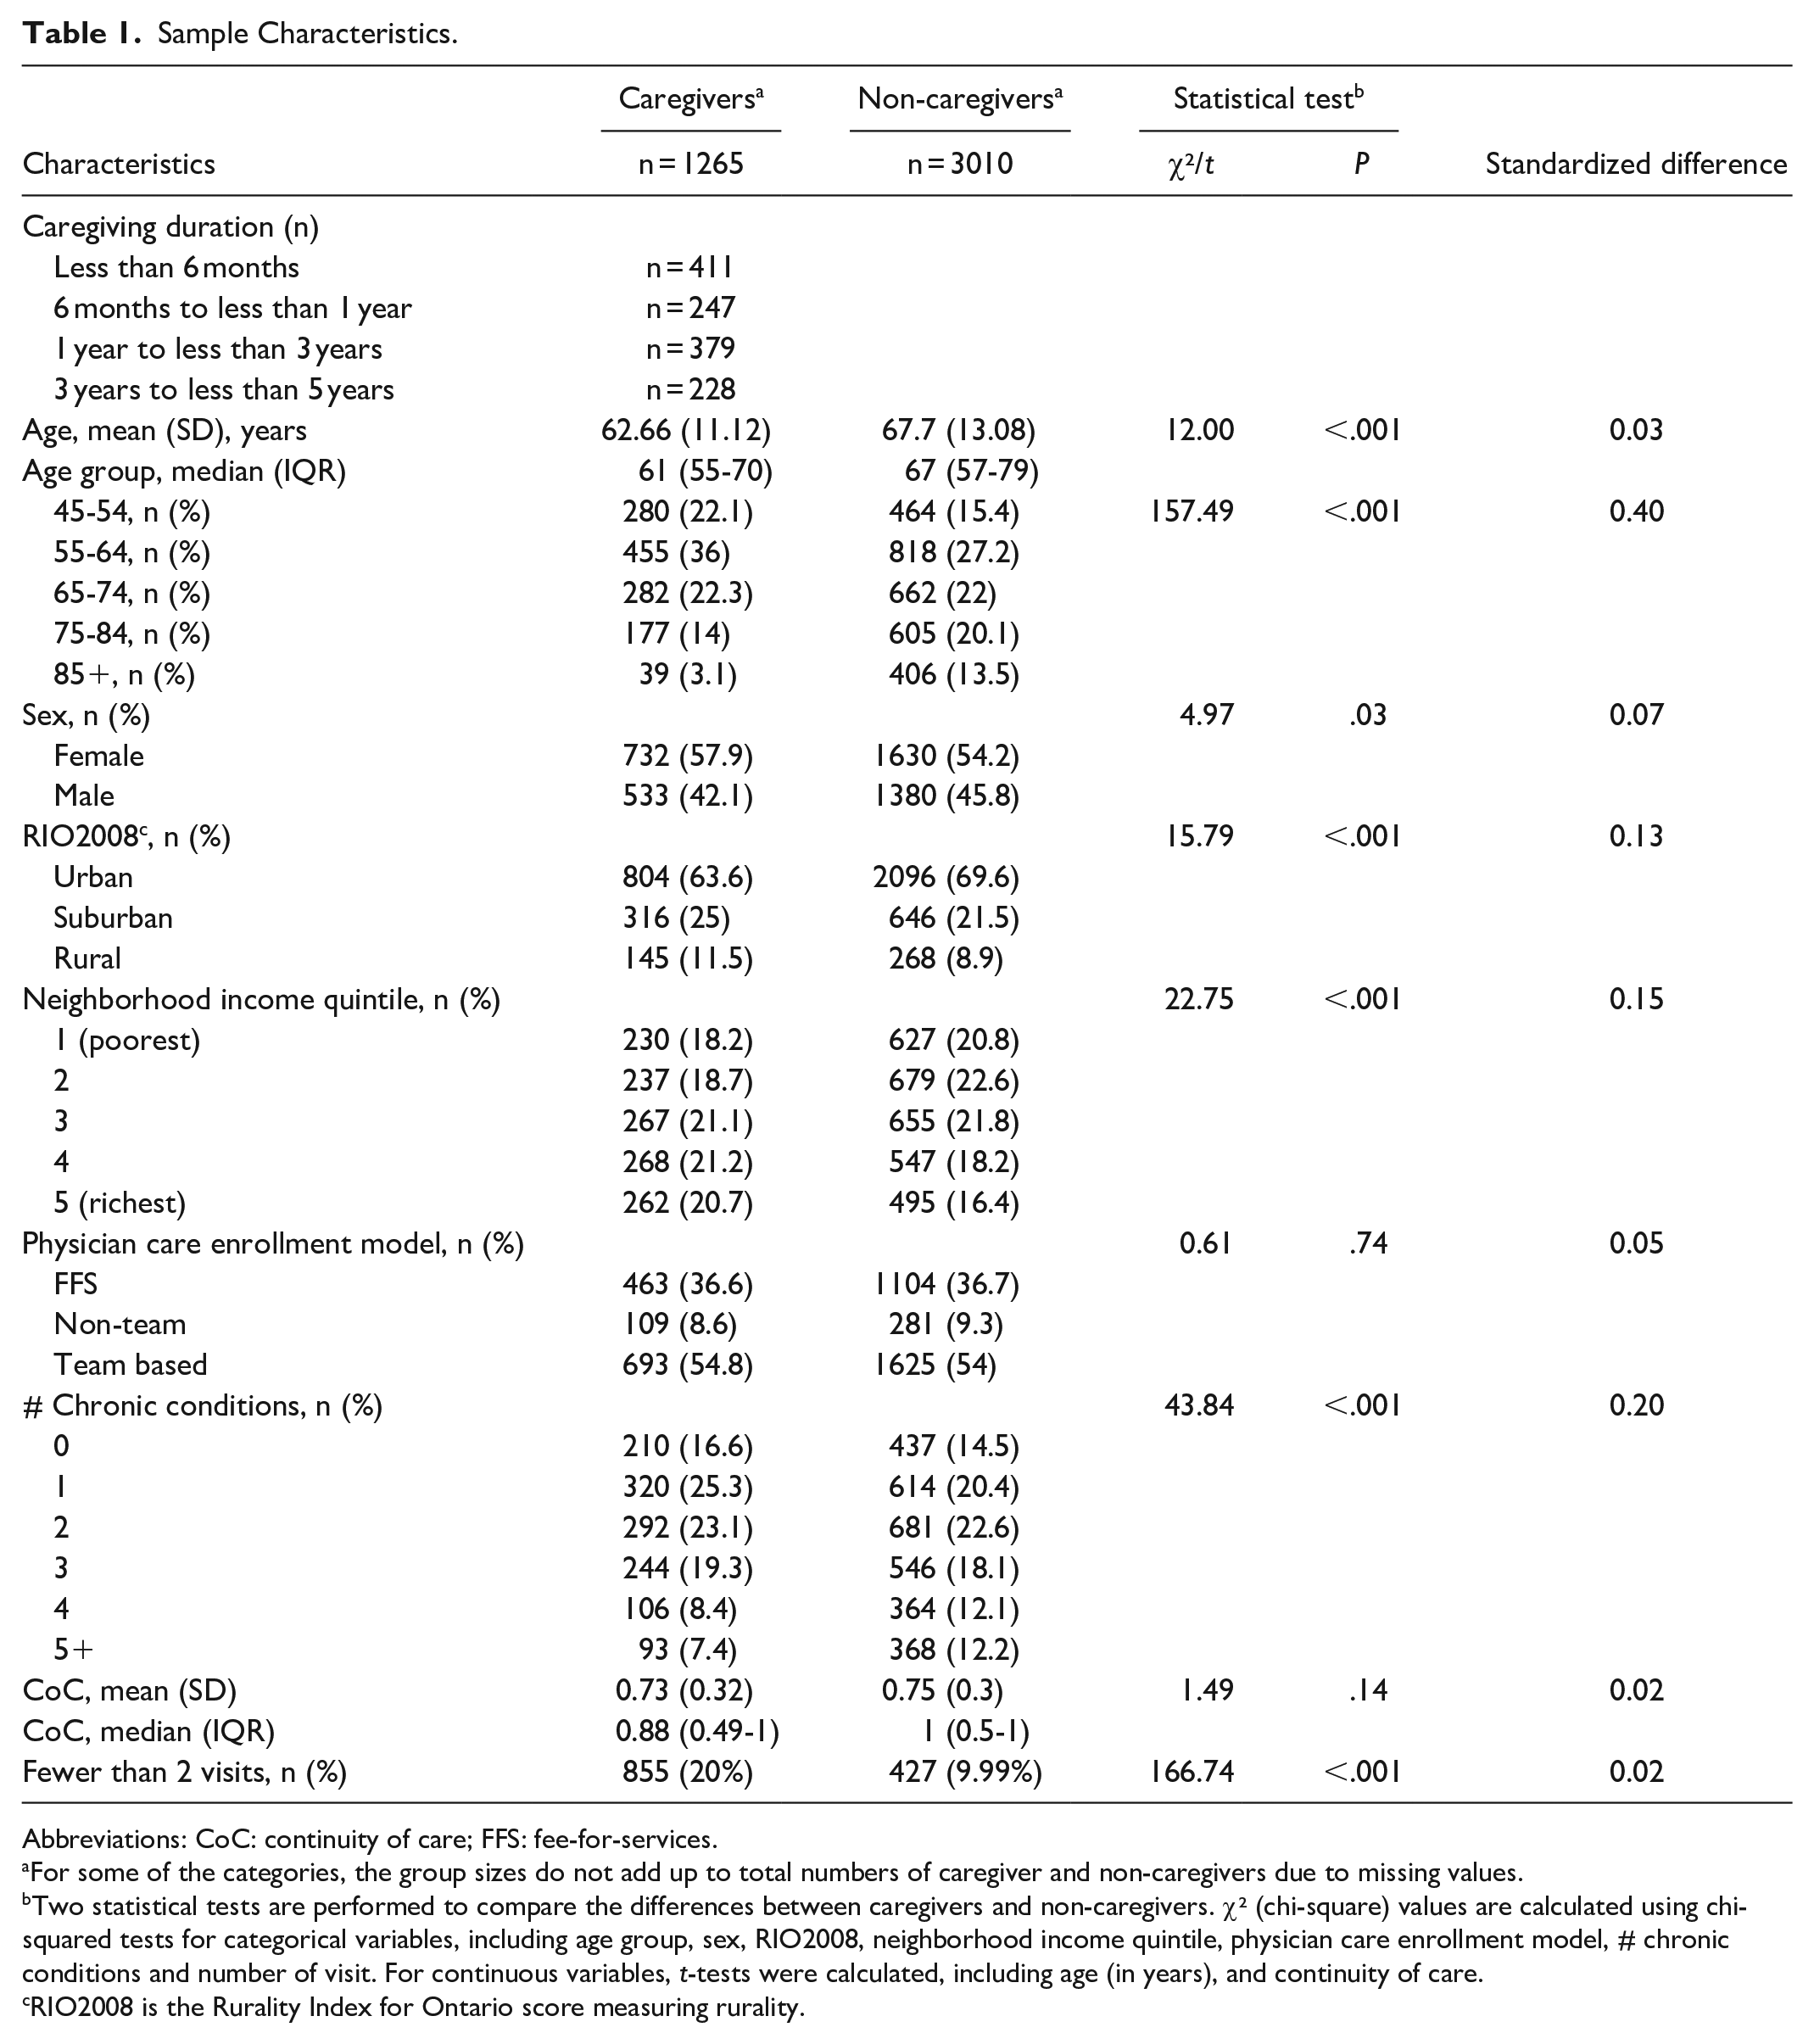
Abbreviations: CoC: continuity of care; FFS: fee-for-services.
For some of the categories, the group sizes do not add up to total numbers of caregiver and non-caregivers due to missing values.
Two statistical tests are performed to compare the differences between caregivers and non-caregivers. χ² (chi-square) values are calculated using chi-squared tests for categorical variables, including age group, sex, RIO2008, neighborhood income quintile, physician care enrollment model, # chronic conditions and number of visit. For continuous variables, t-tests were calculated, including age (in years), and continuity of care.
RIO2008 is the Rurality Index for Ontario score measuring rurality.
Unadjusted Total Costs, 1 and 2 Years Pre- and Post-index Date (N = 4275).
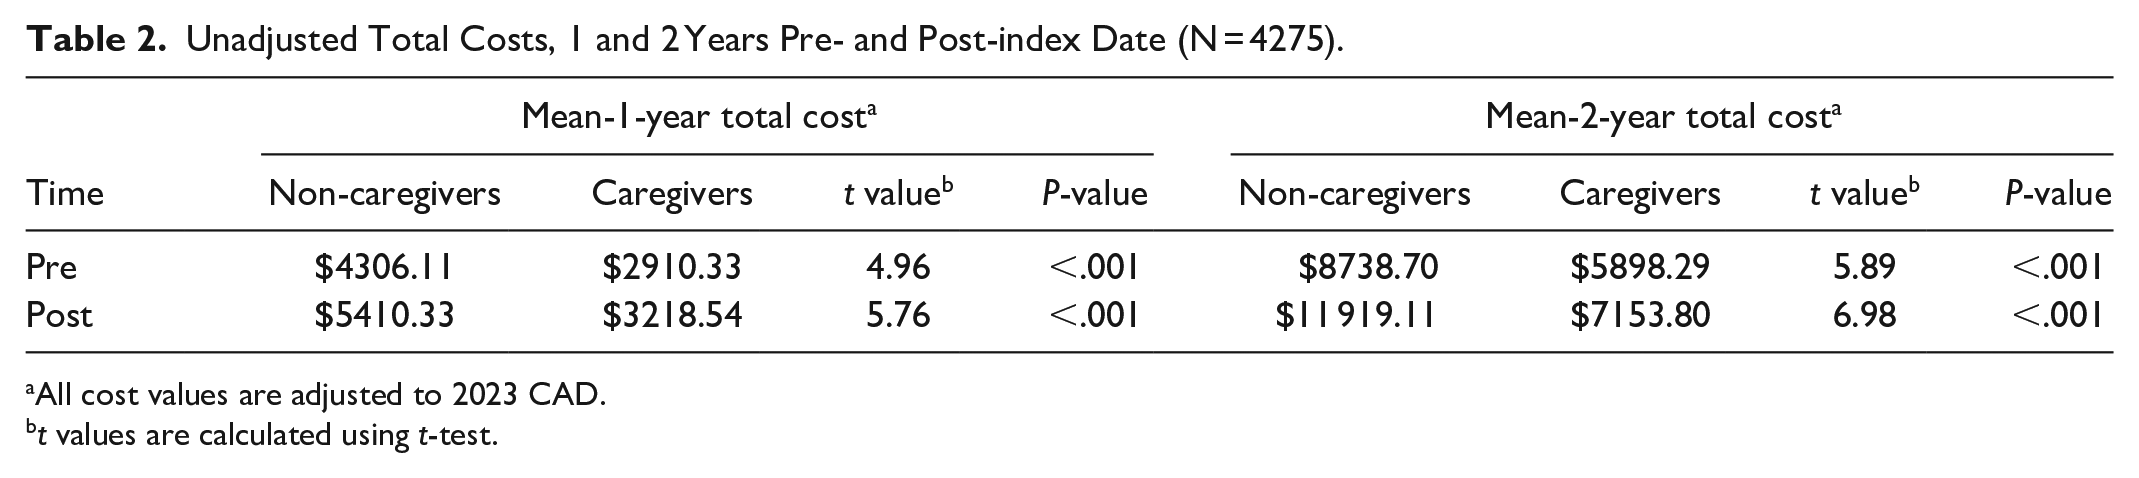
All cost values are adjusted to 2023 CAD.
t values are calculated using t-test.
Table 3 reports the GLM estimations of the impact of caregiving over time on caregivers’ total health care costs in comparison with non-caregivers. There are 3 main estimates (caregiving status, time, and caregiving over time as captured by the interaction between these 2 variables) that measured how caregivers’ use of health care services changed over time in comparison with non-caregivers. The negative sign for the caregiving coefficient (ie, caregiving status) indicates that overall, caregivers had lower health care costs than non-caregivers by 14.9% (1-year analysis) and 13.2% (2-year analysis). As indicated by the positive sign of the time coefficients in years 1 and 2 analyses, health care costs increased over time. The interaction between the time and caregiving coefficients, however, shows that while caregivers’ health care utilization increased over time, it increased by a lesser amount in comparison with non-caregivers. Adjusted total health care costs for caregivers were 2.1% (SE = 0.05, ρ = 0.6) and 11.32% (SE = 0.05, ρ = 0.02) lower than non-caregivers, 1 and 2 years into caregiving, respectively. While the difference in changes in adjusted total cost between caregivers and non-caregivers was not significant one year into caregiving, it became statically significant after 2 years of caregiving. Table 4 presents a calculation of the raw DID, showing that non-caregivers’ costs were higher by $709.01 after 1 year and $1942.90 after 2 years of caregiving.
GLM Estimation of the Impact of Caregiving on Caregivers’ Total Health Care Costs in Comparison with Non-Caregivers (N = 4275).
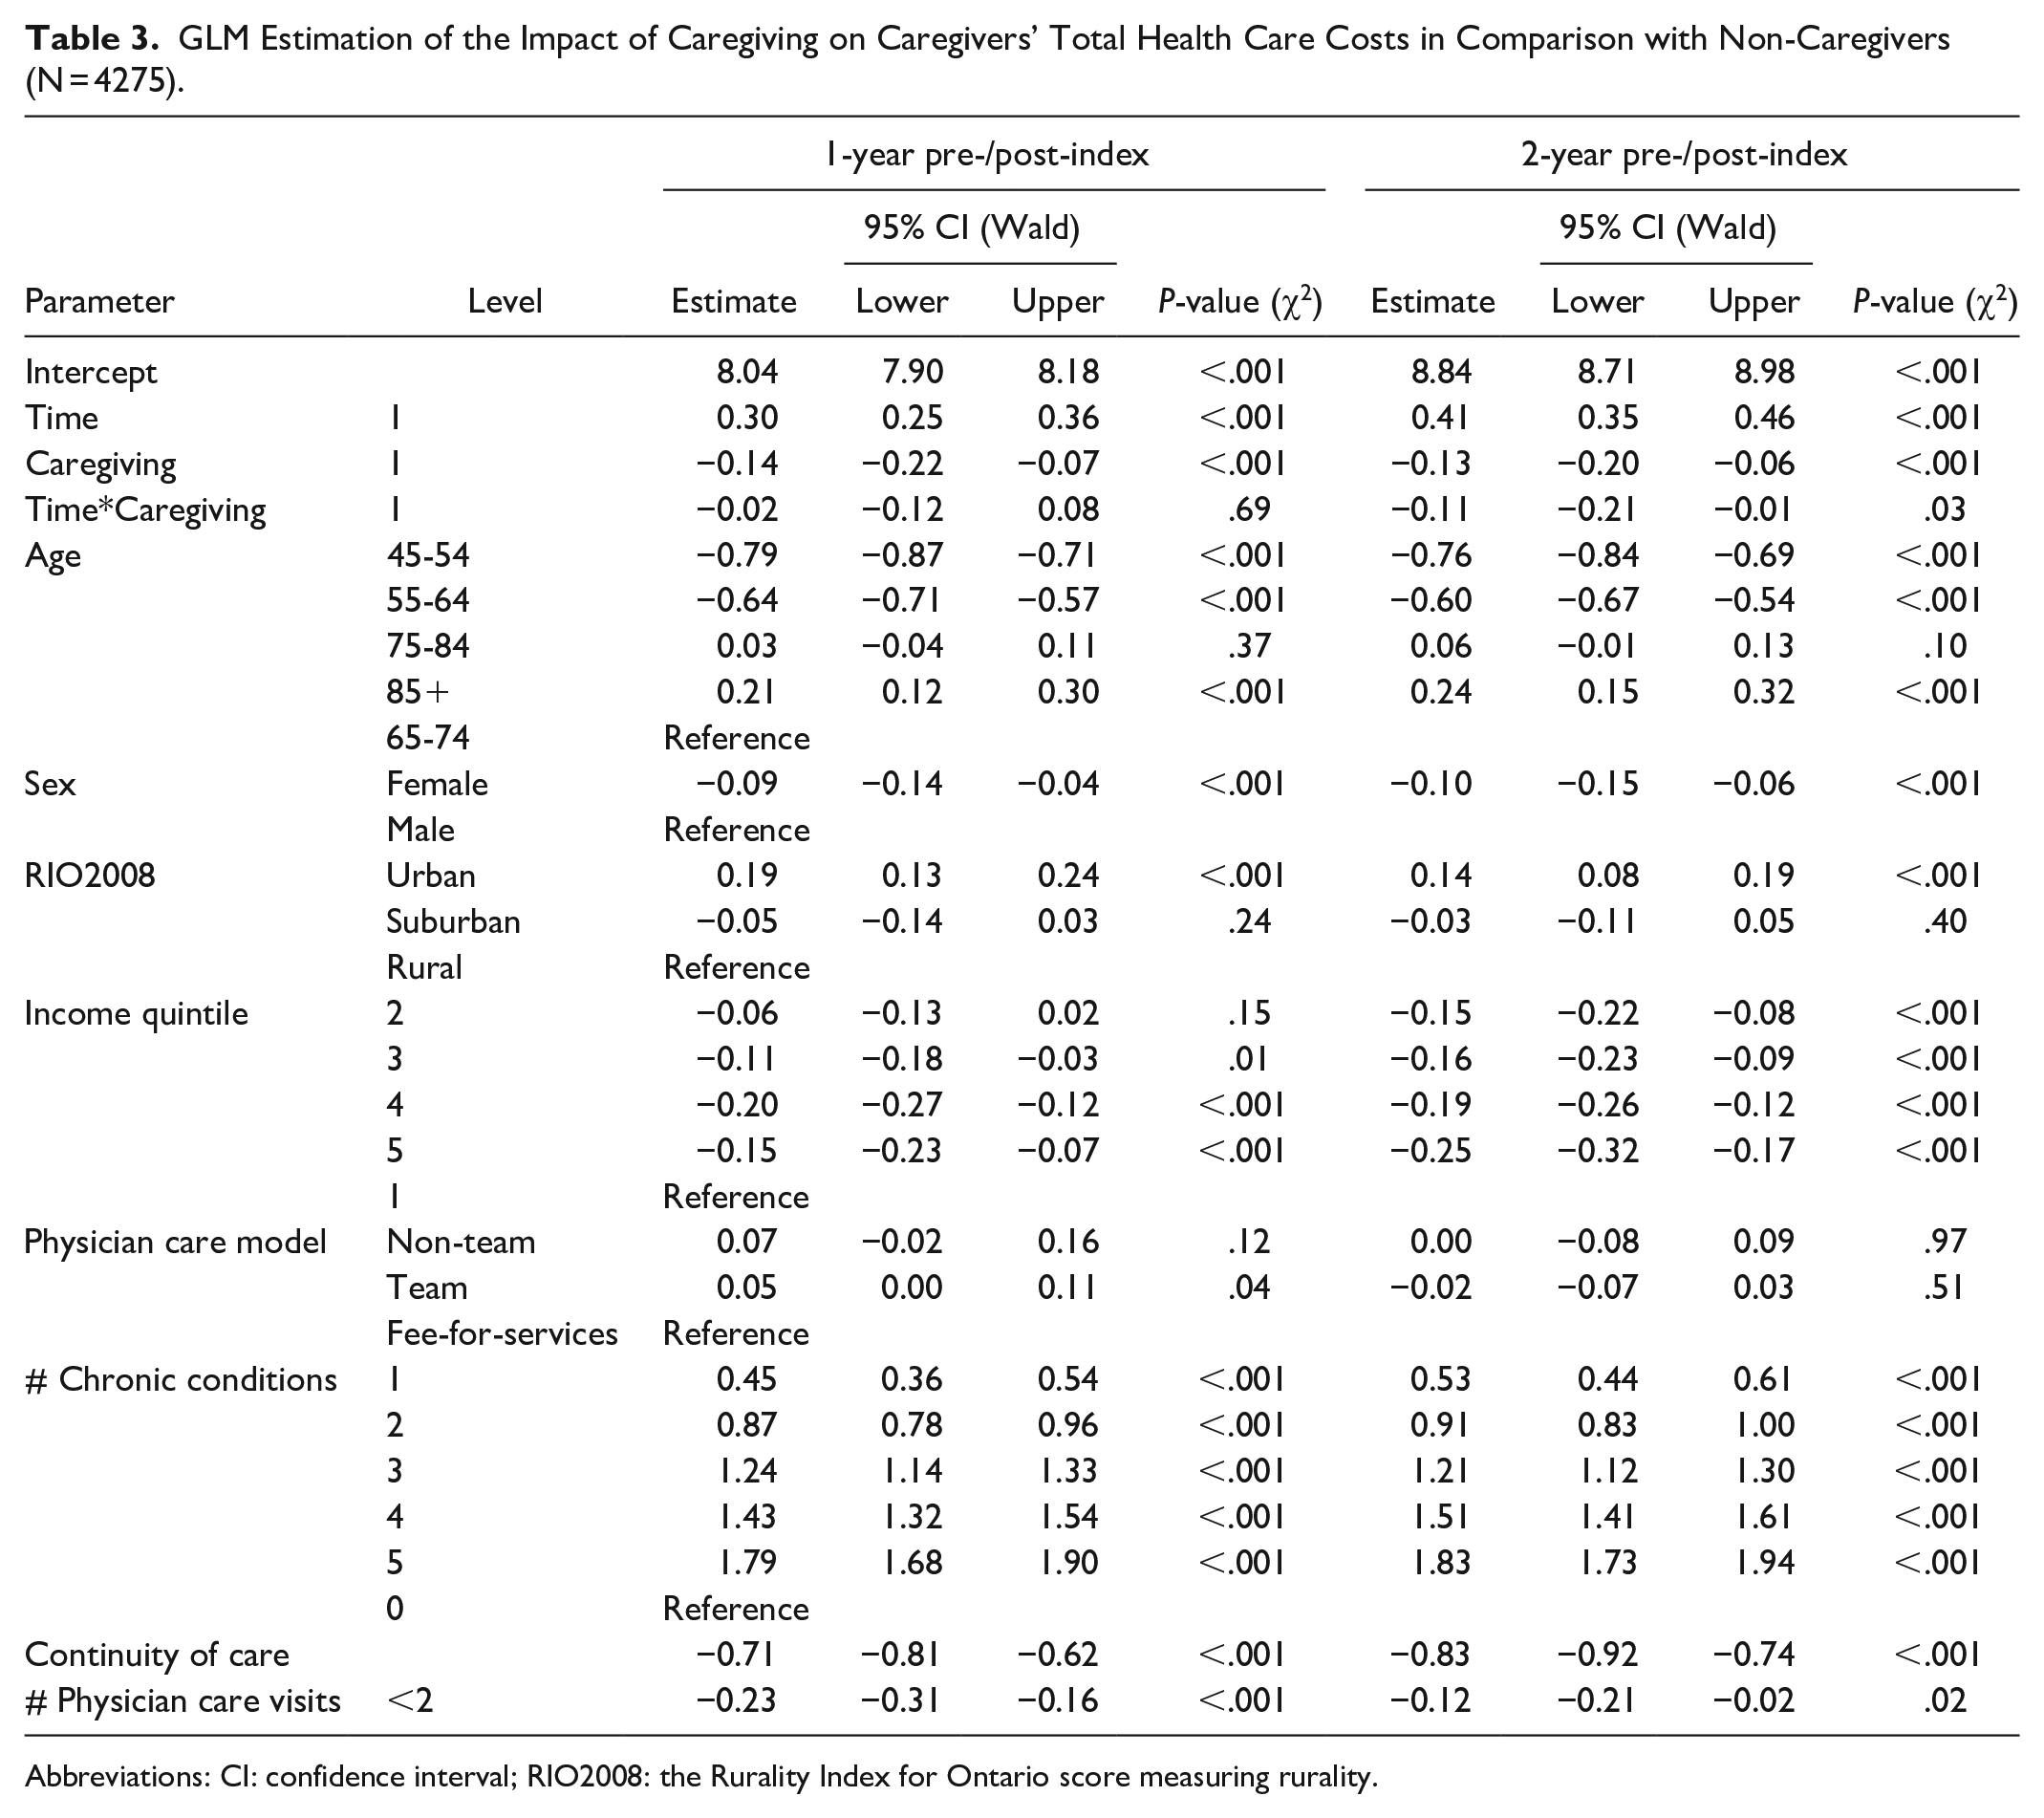
Abbreviations: CI: confidence interval; RIO2008: the Rurality Index for Ontario score measuring rurality.
Raw Difference in Difference.
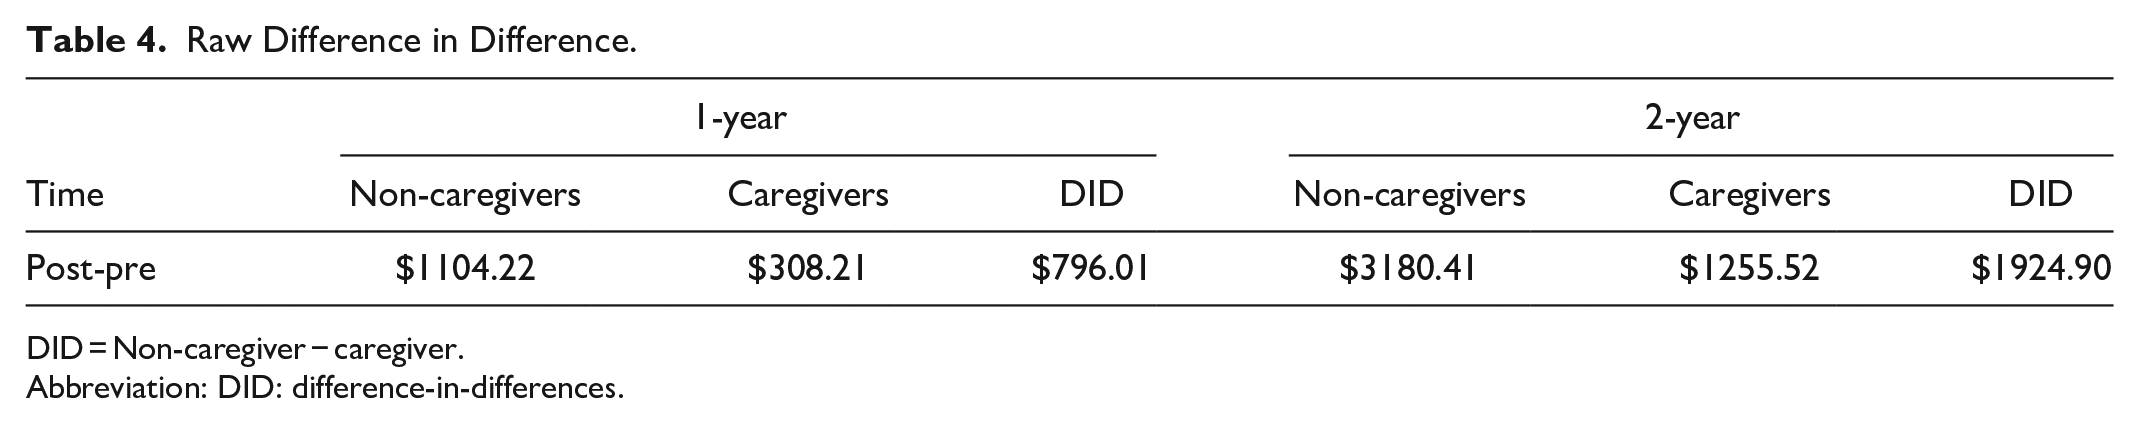
DID = Non-caregiver − caregiver.
Abbreviation: DID: difference-in-differences.
Results remained consistent after excluding individuals who were 75 years and older, and OHIP ineligible, as well as costs 6 months prior to death (Tables S5-S7). Our sensitivity analyses showed that the difference in care costs between caregivers and non-caregivers was driven by costs associated with use of acute care, and home and long-term care services, as well as prescription drugs (Tables S8-S12).
Discussion
We examined the impact of caregiving on costs associated with caregivers’ use of publicly funded health care services in Ontario in comparison with non-caregivers. Since the survey results were not weighted, our findings can only be generalized to populations with similar characteristics, rather than to Canada’s entire caregiver population. We found that while caregivers’ costs increased over time, the magnitude was lower than that of non-caregivers after 2 years of caregiving. Our findings are consistent with the only study we identified that used administrative databases to examine caregivers’ costs. 22 Using multivariate regression analyses, it was found that caregivers’ health care costs as captured by inpatient admission and emergency room visits and prescription drugs were significantly lower than non-caregivers. Our study adds to the literature by following individuals before and after their caregiving start dates to isolate the impact of caregiving on health care costs over a longer period. We also used a sophisticated analytical technique that is well suited for analysis of skewed health care cost data and to adjust for arrays of confounders.
At first glance, our findings might not be comparable with prevailing caregiving studies reporting higher perceived health needs among caregivers.13,15 Although we found that caregivers’ costs for health care services increased over time, this growth was slower than for non-caregivers. Upon reviewing the literature, we identified 4 distinct reasons for this discrepancy: (1) evolving patterns of self-care among caregivers over time, (2) the healthy caregiver hypothesis, (3) exclusion of privately funded care services, and (4) limited data availability, which prevents controlling for a broader range of confounders due to the absence of routine caregiver assessments.
One possible explanation pertains to a pattern of self-care and access among caregivers over time. There are 2 prevailing theories on how caregiver distress unfolds: the wear-and-tear hypothesis, predicting increasing care service costs, and the adaptation theory, predicting stationary care costs. 34 Our study was limited to the initial stages of caregiving. As such, the possibility exists that a longer follow-up period could reveal new information on caregivers’ utilization and costs. Moreover, literature demonstrates that caregivers often prioritize their loved ones’ needs above their own and report not being able to find time to care for themselves.35-37 There is evidence that they delay care-seeking behaviors until after their care recipient’s death.20,21 Additionally, system-level factors such as insufficient respite services and lack of compassion and understanding among health care professionals toward caregivers’ needs were found to delay caregivers’ access to care. 38 Also, given the impact of caregiving on individuals’ mental health, 22 known barriers to accessing mental health such as wait times for public services and cost associated with private care could cause further delays in caregivers’ care-seeking behavior. 39
The other key explanation is that the caregivers in our sample could have been healthier than non-caregivers, consistent with the “healthy caregiver” hypothesis. 40 The hypothesis suggests those with better health are more likely to take on caregiving responsibilities. Although we conducted several sensitivity analyses and controlled for the number of chronic conditions and age, due to lack of data availability we were not able to adjust for factors such as specific health conditions or self-reported health.
The exclusion of privately funded care services paid for by individuals might have also contributed to the discrepancies observed between self-reported and actual use of care services by caregivers. Additional out-of-pocket costs, whether incurred by caregivers or others, could influence the results. However, predicting the direction of this impact is challenging due to numerous factors, including age, frailty, and diagnosis. 41
Most importantly, our study has several notable limitations that affect both the internal and external validities of our findings, primarily due to the lack of comprehensive data on caregivers, their characteristics, and their evolving needs over time. First, the CCHS-HAS data used in this study were collected in 2008/2009, a somewhat-outdated data set. Despite the lack of substantial policy changes or support modifications for caregivers in Ontario since then, national advocacy efforts for formal recognition of caregivers and increased awareness of their needs may have influenced caregiving behaviors, potentially affecting the generalizability of our results.42-45 However, it remains a fact that the CCHS-HAS 2008/2009 is the only database in Canada that enables the identification of caregivers within administrative databases and allows for linkage to other data sources to track their health care utilization and costs over time.
Second, the formal identification of caregivers remains a challenge in Canada. Our study relied on self-reported caregiver status from the CCHS-HAS survey. As documented in the caregiving literature,46,47 some individuals who perform caregiving tasks may not identify themselves as caregivers, leading to a potential underrepresentation in our exposure group. Additionally, variability in individuals’ recall of when they began caregiving—particularly in cases involving the gradual progression of certain conditions—could introduce further inaccuracies in the data.
Third, the data structure prevented us from identifying individuals who transitioned from non-caregiver to caregiver status during the study period. Lastly, the unavailability of data on several critical confounders—such as the care recipient’s condition, the caregiver’s relationship to the recipient, household composition, and specific caregiving tasks and hours—restricted our ability to control for these important variables in our analysis.
These limitations underscore the significance of our work and its implications for policy, practice, and research by revealing a substantial gap in the support for caregivers. The data constraints in our study highlight the systemic neglect of caregivers within our health care system. When a health care system does not collect comprehensive and routine data on caregivers, and when it fails to formally identify informal caregivers, it risks perpetuating a cycle of inadequate support. Given the aging population and the rise in comorbidities, this systemic failure is likely to result in increased costs and poorer outcomes for the health care system.
The question of when and how to best support caregivers has long been debated. 48 There have been calls for the identification of caregivers in medical records and routine assessments of their needs.18,49 Assessing caregivers’ needs should be a prerequisite for designing, refining, and delivering interventions that provide adequate and timely support. 49 Caregiver assessment is a structured approach to collecting information about an individual that is providing care to loved ones in order to identify their needs and challenges they face. 50 Such assessments not only provide information on the type and timing of support needed but also identify caregivers at risk of burnout and help prevent the institutionalization of care recipients. 51 Continuous assessment of caregivers has also been linked to the effectiveness of health interventions. 18 Moreover, it is a critical step in providing quality care to care recipients and ensuring the success of health and policy interventions that heavily rely on caregivers for the delivery of care. 18 A successful example of routine caregiver assessment is the carer’s assessment in the UK, where caregivers are entitled to be assessed, and supports are provided based on their needs, willingness, and ability to provide care. This approach helps caregivers maintain their health, well-being, and life outside of their caregiving role. 52
From a research perspective, the absence of comprehensive data on caregivers means that any study on caregiving will inevitably face similar limitations to those encountered in our work. This gap not only restricts the current understanding of caregiving dynamics but also impedes researchers from gaining a thorough insight into these dynamics, especially over the long-term. Our findings suggest that further research is required to investigate why caregivers’ lower perception of health does not translate into more use of health care services or at what stage during the caregiving journey increased health care use and costs might be observed. 22 As such, greater attention must be paid to caregivers’ health, as caregiving duration and trajectory could play an important role in determining how and when support is provided. More research is also needed to examine the impact of caregiving over a longer period of time, possibly mapping costs to different stages of caregiving (beginning, adjustment period, new beginning). 53 Our findings also suggest the inclusion of caregivers’ health care costs in cost-effective analyses of health care interventions could lead to significant changes in how the costs and effects of a particular drug or intervention are calculated. However, exploring these potential avenues for new research requires access to high-quality and timely data.
Conclusion
In conclusion, our study underscores a critical gap in both policy and research by highlighting the systemic neglect of caregivers within our health care system. The lack of routine assessment and caregiver identification not only hampers effective support for informal caregivers but also stifles essential research needed to inform evidence-based interventions and policies. Addressing these gaps through the implementation of routine caregiver assessments is vital, not only to improve caregiver well-being and prevent burnout but also to enhance the overall effectiveness of health care interventions. Without such efforts, we risk perpetuating a cycle of inadequate support for caregivers, leading to increased costs and poorer outcomes in an aging society.
Supplemental Material
sj-docx-1-wjn-10.1177_01939459241310285 – Supplemental material for Informal Caregiving: Health System Cost Implications
Supplemental material, sj-docx-1-wjn-10.1177_01939459241310285 for Informal Caregiving: Health System Cost Implications by Sara Shearkhani, Yu Qing Bai, Kerry Kuluski, Geoffrey M. Anderson and Walter P. Wodchis in Western Journal of Nursing Research
Footnotes
Acknowledgements
Parts of this material are based on data and information compiled and provided by the Ontario Ministry of Health and Long Term Care, and the Canadian Institute for Health Information (CIHI). We thank IQVIA Solutions Canada Inc. for use of their Drug Information File. This document used data adapted from the Statistics Canada Postal CodeOM Conversion File, which is based on data licensed from Canada Post Corporation, and/or data adapted from the Ontario Ministry of Health Postal Code Conversion File, which contains data copied under license from ©Canada Post Corporation and Statistics Canada. The opinions, results, and conclusions reported in this paper are those of the authors and are independent from the funding sources. No endorsement by ICES, the MOH, or MLTC is intended or should be inferred. We would like to acknowledge Dr. Kelly Smith of the Department of Research and Innovation at Michael Garron Hospital for her support and understanding during the publication process. Her flexibility in allowing time to focus on this research has been invaluable in bringing this work to completion. We would also like to acknowledge Sharifa Kazi, a research assistant at Michael Garron Hospital, for her assistance with editing.
Data Availability Statement
The data set from this study is held securely in coded form at the Institute for Clinical Evaluative Sciences (ICES). While data sharing agreements prohibit ICES from making the data set publicly available, access may be granted to those who meet prespecified criteria for confidential access, available at ![]() .
.
Declaration of Conflicting Interests
The author(s) declared no potential conflicts of interest with respect to the research, authorship, and/or publication of this article.
Funding
The author(s) disclosed receipt of the following financial support for the research, authorship, and/or publication of this article: This research was supported by the Health System Performance Network which receives funding from the Ontario Ministry of Health and the Ontario SPOR Support Unit, as well that Canadian Frailty Network. This study was also supported by ICES, which is funded by an annual grant from the Ontario Ministry of Health (MOH) and the Ministry of Long-Term Care (MLTC).
Supplemental Material
Supplemental material for this article is available online.
References
Supplementary Material
Please find the following supplemental material available below.
For Open Access articles published under a Creative Commons License, all supplemental material carries the same license as the article it is associated with.
For non-Open Access articles published, all supplemental material carries a non-exclusive license, and permission requests for re-use of supplemental material or any part of supplemental material shall be sent directly to the copyright owner as specified in the copyright notice associated with the article.