
Abstract
Although blood triiodothyronine (T3), thyroxine (T4), and thyroid-stimulating hormone (TSH) levels are useful for detecting antithyroid compounds in rodent toxicity studies, there are challenges with high variability due to sampling conditions. Here, we compared histopathological and immunohistochemical findings with blood hormone levels in rats treated with promoters of thyroid hormone metabolism to explore useful markers for hypothyroidism. Six-week-old male and female Sprague-Dawley rats (5/group) were administered phenobarbital sodium salt (NaPB) or nicardipine hydrochloride (NCD) by gavage for 28 days. Decreased serum T4 and increased TSH levels were detected at 100 mg/kg NaPB and 150 mg/kg NCD, whereas follicular cell hypertrophy occurred at lower doses of ≥ 30 mg/kg NaPB and ≥ 50 mg/kg NCD. There was no obvious change in T3 or T4 immunostaining in the thyroid unlike thyroid peroxidase (TPO) inhibitors, and uridine diphosphate-glucuronosyltransferase 1A6-positive area in the liver increased at doses lower than those affecting the serum T4 levels and generally the same as those at which hepatocellular hypertrophy and follicular cell hypertrophy were observed, indicating its usefulness in detecting thyroid hormone metabolism promoters. These results indicate that histopathology is useful for sensitive detection of hormone metabolism promoters and can be distinguished from TPO inhibitors by immunohistochemistry.
Introduction
Thyroid hormones are essential for diverse biological processes, including differentiation, growth, and metabolic functions, in many tissues, 3 and disturbance of thyroid hormone homeostasis is closely associated with adverse health effe2cts. Thyroid function disruptors, particularly antithyroid compounds that cause decreases in circulating thyroid hormone levels by inhibiting thyroid hormone synthesis or enhancing the metabolic process of thyroid hormones, have been recognized as chemicals associated with tumorigenesis,6,22 and maternal hypothyroidism during pregnancy can alter brain structure and function in human and rat offspring.7,19 Many compounds, including environmental chemicals and pharmaceuticals, act as thyroid hormone disruptors,4,29 and appropriate evaluation of new and existing compounds for potential thyroid disruption should be conducted. In recent years, several methods using novel approaches to detect potential thyroid disruptors have been developed, 25 including in vitro methods based on decreased thyroid peroxidase (TPO) activity and increased thyroxine (T4) glucuronide formation using three-dimensional liver spheroids. 14 Although these approaches are expected to be useful for screening and hazard assessment of antithyroid compounds, it remains important to improve in vivo methods for risk management purposes.
For evaluation of antithyroid compounds, the OECD (Organisation for Economic Co-operation and Development) test guideline for 90-day repeated-dose oral toxicity studies in rodents (TG408) mandates measurement of triiodothyronine (T3), T4, and thyroid-stimulating hormone (TSH) levels in blood. 28 Measurement of these three hormones is also recommended by the OECD test guideline for 28-day studies (TG407). 27 In addition, the TG408 requires measurement of blood low-density lipoprotein cholesterol (LDL-C) and high-density lipoprotein cholesterol (HDL-C) levels, since hypothyroidism can induce disruption of lipid metabolism function, resulting increased cholesterol levels and decreased lipolysis. 31 Furthermore, since thyroid dysfunction may affect the other endocrine systems and reproductive organs, it is important to examine relevant hormone levels. Although these circulating hormones can be useful for detection of antithyroid compounds in rodent toxicity studies, assays for the evaluation of thyroid hormones are associated with several concerns, including high costs, and high variability depending on stress and blood sampling conditions. 8 Therefore, the development of methods to detect antithyroid compounds in short-term studies, not relying solely on blood hormone levels, would contribute to a more appropriate and efficient evaluation of chemicals.
Decreased blood T3 and T4 levels stimulate TSH production in the pituitary gland, followed by activation of thyroid function in response to elevated blood TSH to enhance hormone synthesis potential in the thyroid gland. 39 In rats exposed to antithyroid chemicals, histopathological changes, such as follicular cell hypertrophy and proliferative lesions in the thyroid gland, are frequently observed in response to elevated blood TSH levels as morphological changes associated with enhanced hormone synthesis. Our previous study demonstrated that detection of antithyroid compounds, including propylthiouracil, aminotriazole, and aminoglutethimide, is possible using histopathological and immunohistochemical analyses, independent of measurements of blood hormone levels. 2 In our recent study, 1 28-day repeated oral administration of propylthiouracil and methimazole, well-known TPO inhibitors, 38 resulted in increased follicular cell hypertrophy and decreased T3 and T4 immunostaining in the thyroid gland at doses lower than those significantly affecting serum T3, T4, and TSH levels, suggesting that these analyses may be more sensitive parameters than serum hormone levels for detecting TPO inhibitors. In addition, significant increases in TSH-positive areas in the pituitary gland, Ki67 expression, a well-known indicator of cell proliferation, in thyroid follicular cells, and thyroid weight were detected with a sensitivity comparable with that of changes in serum hormone levels, indicating that these parameters may also be useful complementary indicators. These approaches may provide a more effective in vivo method for detecting antithyroid compounds via TPO inhibition.
At the same time, the antithyroid effects of chemicals are caused not only by TPO inhibition but also by various other mechanisms, including inhibition of iodine uptake in follicular cells, inhibition of deiodinase, which converts T4 to the more active T3, inhibition of TSH production in the pituitary gland, and increased metabolism of thyroid hormones in the liver.24,25 To establish a more versatile and suitable method for detecting antithyroid chemicals based on histopathological and immunohistochemical analyses, the antithyroid effects caused by these other mechanisms should also be compared with blood hormone levels.
In the current study, we focused on chemicals that induce hepatic microsomal enzymes in rats and promote thyroid hormone metabolism. Inducers of hepatic microsomal enzymes increase expression of uridine diphosphate-glucuronosyltransferase (UGT), which catalyzes glucuronidation, one of the major metabolic pathways for T3 and T4, in hepatocytes. 34 Increased UGT levels promote biliary excretion of T3 and T4, resulting in decreased circulating levels of these hormones.10,35 Glucuronidation of T4 in the rat liver is considered to be mediated mainly by two UGT isozymes, UGT1A1 and UGT1A6, the phenol and bilirubin forms, respectively.36,37 In rat liver microsomes, UGT1A1 is a major UGT1 component and UGT1A6 is a minor component, whereas UGT1A6 expression was more strongly increased than UGT1A1 expression in phenobarbital-treated rat liver. 15 TPO inhibitors that directly inhibit thyroid hormone synthesis and promoters of thyroid hormone metabolism that indirectly reduce circulating thyroid hormone levels without inhibiting synthesis may result in different immunostaining for T3 and T4 in the thyroid gland. In addition to the immunohistochemistry for T3 and T4 analyzed in our recent study with TPO inhibitor, analysis of UGTs may be used for detection of thyroid hormone metabolism promoters. By identifying parameters that reflect the mechanism and show different results, they may be used as markers to distinguish between mechanisms.
In this study, multiple doses of phenobarbital sodium salt (NaPB) and nicardipine hydrochloride (NCD), which increase biliary excretion of thyroid hormone metabolites, 5 were administered by gavage to rats for 28 days. Histopathological and immunohistochemical analyses of T3, T4, TSH, Ki67, and UGTs in the thyroid, pituitary, and liver and measurement of serum LDL-C, HDL-C, and hormones related to adrenals and reproductive systems were performed to detect thyroid-disrupting effects in the 28-day repeated-dose oral toxicity test described in the OECD test guideline (TG407), 27 which is widely used to assess the safety of chemical compounds, and the results were compared with changes in serum thyroid-related hormone levels.
Materials and Methods
Test Chemicals and Experimental Animals
We used two antithyroid chemicals: NaPB (CAS no. 57-30-7, Tokyo Chemical Industry, Tokyo, Japan; lot no. GG01; 93.4% purity) and NCD (CAS no. 54527-84-3, Tokyo Chemical Industry; lot no. VFCLB; 98.7% purity). Five-week-old male and female Crl:CD Sprague-Dawley (SD) rats were obtained from Charles River Laboratories Japan (Yokohama, Japan) and used after 1 week of acclimatization. The animals were housed in plastic cages containing soft chip bedding with two or three animals per cage in a room with a barrier system under a controlled 12 hours light/dark cycle, ventilation (air exchange rate: 20 times/h), 23 ± 1°C temperature, and 50 ± 5% relative humidity. The cages and chip bedding were exchanged twice a week. All animals had free access to a basal diet (CRF-1, Oriental Yeast, Tokyo, Japan) and water.
Study Design
A 28-day repeated-dose toxicity study with oral administration of NaPB and NCD, respectively, was conducted. At the beginning of the experiment, the animals were randomly allocated to seven groups (five animals/sex/group; one vehicle control and three dose groups per each substance), based on their body weights measured just before starting chemical administration. NaPB and NCD dissolved or suspended in 0.5% (w/v) methylcellulose 400 solution (FUJIFILM Wako Pure Chemical Corporation, Osaka, Japan; lot no. DLJ7027) were administered to the rats by gavage at 10, 30, or 100 mg/kg body weight/day as phenobarbital and 15, 50, or 150 mg/kg body weight/day as nicardipine, respectively, for 28 days. These doses were selected based on those that induced changes in blood hormone levels reported in previous studies.18,23,26,33 Animals in the control group were administered vehicle. Body weights and food intake were measured once a week. Blood sampling for hematological, serum biochemical, and hormonal analyses was performed only at the terminal necropsy, as in the regular 28-day toxicity studies. All rats were fasted overnight after completion of treatment, and blood samples were collected from the abdominal aorta of all animals under deep anesthesia by inhalation of isoflurane; the rats were exsanguinated from the abdominal aorta immediately after blood sampling and subjected to necropsy. The experimental design was approved by the Animal Care and Utilization Committee of the National Institute of Health Sciences, Japan, and the animals were cared for in accordance with institutional guidelines.
Measurement of Serum Hormone Levels
Blood samples were collected in blood collection tubes (Becton, Dickinson and Company Japan, Tokyo, Japan) containing silica particles for coagulation at necropsy, followed by centrifugation, and serum was stored at −20°C until measurement. We measured serum concentrations of T3 and T4 by chemiluminescent immunoassay using Lumipulse Presto T3 and T4 (Fujirebio, Tokyo, Japan), and fluorescence intensity of each sample was analyzed using a fully automated chemiluminescent enzyme immunoassay system (Lumipulse L2400, Fujirebio) by SRL, Tokyo, Japan. TSH and prolactin (PRL) concentrations were determined by bead-based fluorescence immunoassay using the Milliplex MAP Rat Thyroid Hormone and Rat Pituitary Magnetic Bead Panel (EMD Millipore, Burlington, MA, USA), respectively, and the fluorescence intensity of each sample was analyzed using a flow cytometer (FACSVerse, Becton, Dickinson and Company Japan). Serum concentrations of adrenocorticotropic hormone (ACTH), follicle-stimulating hormone (FSH), and luteal hormone (LH) were determined by bead-based fluorescence immunoassay using the Rat Pituitary Magnetic Bead Panel and analyzed by Oriental Yeast. Serum estradiol, progesterone, and testosterone concentrations were measured by liquid chromatography tandem mass spectrometry by Oriental Yeast. The detection limits for each hormone were as follows: T3, 0.2 ng/ml; T4, 0.5 μg/dl; TSH, 62.5 pg/ml; PRL, 16 pg/ml; ACTH, 3.2 pg/ml; FSH, 32 pg/ml; LH, 3.2 pg/ml; estradiol, 5 pg/ml; progesterone, 10 pg/ml; and testosterone, 5 pg/ml.
Hematology and Serum Biochemistry
The ProCyte Dx automatic hematology analyzer (IDEXX Laboratories, Westbrook, ME, USA) was used to analyze the following hematological parameters: hemoglobin concentration (HGB), hematocrit (HCT), mean corpuscular volume (MCV), mean corpuscular hemoglobin (MCH), mean corpuscular hemoglobin concentration (MCHC), and red blood cell (RBC), reticulocyte (RET), platelet (PLT), white blood cell (WBC), and differential leukocyte (including neutrophils [Neut], lymphocytes [Lymph], monocytes [Mono], eosinophils [Eosino], and basophils [Baso]) counts. Serum biochemical analyses of the following parameters were performed by Oriental Yeast: total protein (TP), albumin/globulin ratio (A/G), albumin (ALB), total bilirubin (T-BIL), glucose (GLU), triglycerides (TG), total cholesterol (T-CHO), LDL-C, HDL-C, blood urea nitrogen (BUN), creatinine (CRE), sodium (Na), chloride (Cl), potassium (K), calcium (Ca), inorganic phosphorus (IP), aspartate aminotransferase (AST), alanine aminotransferase (ALT), alkaline phosphatase (ALP), and γ-glutamyl transpeptidase (γ-GT).
Organ Weight and Histopathology
The adrenal glands, brain, thymus, spleen, heart, lungs, liver, kidneys, testes, epididymis, and ovaries were weighed at necropsy, and the thyroid and pituitary glands, prostate, and seminal vesicles were weighed after fixation. The thyroid, pituitary, and adrenal glands and the liver (left lateral, left medial, and right medial lobes) from all animals, and the brain, thymus, spleen, heart, lungs, kidneys, testes, epididymis, prostate, seminal vesicle, ovaries, and uterus from animals in the control and highest dose groups were subjected to histopathological evaluation. Tissues were fixed in 10% neutral-buffered formalin, embedded in paraffin after 1 week, and sectioned at a 4 μm thickness. Separately, testes were fixed in modified Davidson’s fixative solution for 24 hours. For histopathological analysis, thyroid glands were longitudinally sectioned to obtain the largest cut surface, and the pituitary gland was transected caudally to obtain the largest cut surface of the pars distalis. The sections were then stained with hematoxylin and eosin and evaluated by light microscopy. The grading criteria for the histopathological examinations were as follows: −(within normal limits), ± (minimal), + (mild), ++ (moderate), and +++ (severe).
Immunohistochemistry
Sections of the thyroid glands, pituitary gland, and liver were deparaffinized and hydrated. For antigen retrieval, the thyroid gland sections were autoclaved in 10 mM citrate buffer (pH = 6.0) at 121°C for 10 minutes for T4, T3, and Ki67, while the pituitary gland sections were heated in 10 mM citrate buffer (pH = 6.0) at 95°C for 15 minutes for TSH. All sections were immersed in 3% H2O2/methanol solution for 10 minutes at room temperature for inactivation of endogenous peroxidase activity. After blocking nonspecific reactions using 10% normal goat serum, the sections were incubated overnight at 4°C with primary antibodies against T4 (diluted 1:2000; mouse monoclonal antibody; clone XM212; Novus Biologicals, Centennial, CO, USA), T3 (1:1000; mouse monoclonal antibody; clone E5; MyBioSource, San Diego, CA, USA), TSH (1:2500; rabbit polyclonal antibody; Bioss Antibodies, Boston, MA, USA), Ki67 (1:1000; rabbit polyclonal antibody; Abcam, Cambridge, UK), UGT1A6 (1:200; rabbit monoclonal antibody; clone EPR11068; Abcam), and UGT1A1 (1:500; rabbit polyclonal antibody; Abcam). Visualization of antibody binding was performed using the Histofine Simple Stain Rat MAX PO Kit (Nichirei Corporation, Tokyo, Japan) and 3,3’-diaminobenzidine. All sections were counterstained with hematoxylin.
For measurement of the TSH-positive area, digital photos were taken using the BZ-X710 microscope (Keyence, Osaka, Japan), and quantitative analysis was performed using the BZ-X analyzer (Keyence). For measurement of the Ki67-positive cells and UGT1A6- and UGT1A1-positive areas, digital photos were taken using the Aperio AT2 (Leica Microsystems, Wetzlar, Germany), and quantitative analysis was performed using the HALO platform (Indica Labs, Albuquerque, NM, USA). TSH-positive areas in the pars distalis in each pituitary section and UGT1A6- and UGT1A1-positive areas in the liver sections were expressed as a ratio of the total area. Ki67-positive cells in each unilateral thyroid section were expressed as a ratio of the total number of follicular cells. In the analysis of UGT1A6, we also analyzed liver samples obtained from rats treated with TPO inhibitors in our recent study for comparison. 1
Statistical Analysis
Quantitative values are expressed as means ± standard deviation. Data for the following quantitative values: body weight, serum T3, T4, and TSH levels, hematology, serum biochemistry, organ weight, and immunohistochemistry for TSH, Ki67, UGT1A6, and UGT1A1 were analyzed between the control and three dose groups of each substance using Dunnett’s test for multiple comparison methods. Serum hormone levels, except for T3, T4, and TSH, were analyzed using the F-test for homogeneity of variance, after which Student’s t-tests and Aspin-Welch’s t-tests were used to evaluate homogeneous and heterogeneous data, respectively. For incidences of histopathological findings, Fisher’s exact probability test was applied. Differences with P values less than .05 were considered statistically significant.
Results
Clinical Parameters
All animals survived until the scheduled necropsy. In the 100 mg/kg NaPB group, all males and females exhibited staggering gait during the treatment period. This finding was observed 30 minutes to 2 hours after administration, but the gait had recovered by the next morning. No clinical signs were observed in the 10 and 30 mg/kg NaPB and any of the NCD groups throughout the experiment. There was no significant difference in body weight gain or daily food consumption between each treatment group and the control group throughout the experiment (data not shown).
Serum Hormone Levels
Serum hormone levels are shown in Tables 1 and 2. A significant decrease in the T4 level was observed in males in the 100 mg/kg NaPB and 150 mg/kg NCD groups. A significant increase in the TSH level was detected in both sexes in the 150 mg/kg NCD group. In the NaPB groups, there were no statistically significant differences in serum TSH levels, although there was an increasing trend in the 100 mg/kg group of males (Table 1). We also examined whether hormones related to organs other than the thyroid gland were affected under our experimental conditions. There was no significant difference in the serum concentration of ACTH, PRL, FSH, LH, estradiol, progesterone, or testosterone between the control group and the NaPB or NCD highest dose group (Table 2).
Serum thyroid hormone levels in male and female SD rats treated with NaPB or NCD for 28 days.

Each value represents the mean ± SD.
Abbreviations: NaPB, phenobarbital sodium salt; NCD, nicardipine hydrochloride.
Significantly different from the control group at P < .05.
Serum hormone levels in male and female SD rats treated with NaPB or NCD for 28 days.

Each value represents the mean ± SD.
Abbreviations: NaPB, phenobarbital sodium salt; NCD, nicardipine hydrochloride.
Hematology and Serum Biochemistry
The hematology data are shown in Table 3. In the NaPB groups, we observed a significant decrease in Eosino (number and percentage) in females at 100 mg/kg. In the NCD groups, we detected a decrease in MCHC in females at ≥50 mg/kg, and increases in HCT and RET in both sexes and in RBC, HGB, and RET (percentage) in males at 150 mg/kg.
Hematology data for male and female SD rats treated with NaPB or NCD for 28 days.

Each value represents the mean ± SD.
Abbreviations: NaPB, phenobarbital sodium salt; NCD, nicardipine hydrochloride.
, **Significantly different from the control group at P < .05 and P < .01, respectively.
The serum biochemistry data are shown in Table 4. In the NaPB groups, we found significantly increased levels of HDL-C in both sexes, T-CHO in males, and TP, ALB, and TG in females and decreased levels of GLU and TG in males and CRE and Na in females at 100 mg/kg. The NCD groups showed a significantly decreased level of T-BIL in both sexes at ≥ 15 mg/kg; increased levels of T-CHO and LDL-C in females and decreased levels of TG in males and A/G in females at ≥ 50 mg/kg; and increased levels of BUN in both sexes, TP, CRE, and Ca in males, and HDL-C and ALT in females at 150 mg/kg. Despite a significantly increased LDL-C level in males and decreased CRE level in females at 10 mg/kg NaPB, increased levels of Ca in females at 50 mg/kg NCD and of Na in males at 15 and 50 mg/kg NCD, and a decreased A/G in males at 15 mg/kg NCD, the lack of a dose relationship suggested that these changes were incidental rather than adverse effects.
Serum biochemistry data for male and female SD rats treated with NaPB or NCD for 28 days.

Each value represents the mean ± SD.
Abbreviations: NaPB, phenobarbital sodium salt; NCD, nicardipine hydrochloride.
**Significantly different from the control group at P < .05 and P < .01, respectively.
Organ Weights
The organ weights are shown in Table 5. The absolute and relative weights of the thyroid gland were significantly increased in both sexes treated with 100 mg/kg NaPB and in females treated with 150 mg/kg NCD. Regarding the liver, there were significant increases in absolute and relative weights in both sexes treated with 100 mg/kg NaPB, relative weights in males treated with 30 mg/kg NaPB, and absolute and relative weights in both sexes treated with 50 and 150 mg/kg NCD.
Organ weights in male and female SD rats treated with NaPB or NCD for 28 days.

Each value represents the mean ± SD.
Abbreviations: NaPB, phenobarbital sodium salt; NCD, nicardipine hydrochloride.
, **Significantly different from the control group at P < .05 and P < .01, respectively.
In the NaPB groups, there were significant increases in the absolute and relative weights of the adrenal glands and in the relative weight of the kidney in females at 100 mg/kg. In the NCD groups, there were significant increases in the relative weight of the heart at ≥ 50 mg/kg and absolute weight of the heart at 150 mg/kg in females. Despite significant increases in the absolute and relative weights of the spleen in males at 30 mg/kg NaPB, relative weight of the thymus in males at 10 mg/kg NaPB, and relative weight of the spleen in females at 50 mg/kg NCD, the lack of a dose relationship suggested that these changes were incidental rather than adverse effects.
Histopathological Findings
The histopathological findings are summarized in Table 6. In the thyroid gland, hypertrophy/hyperplasia of follicular cells and colloid depletion were noted in both the NaPB and NCD groups (Figure 1). Among these findings in the thyroid gland, hypertrophy of follicular cells was detected from the lowest doses, with significantly increased frequencies at ≥ 30 mg/kg NaPB and ≥ 50 mg/kg NCD in both sexes compared with the controls. There were significantly increased incidences of colloid depletion in males in the 100 mg/kg NaPB group and follicular cell hyperplasia in males in the 100 mg/kg NaPB and 150 mg/kg NCD groups. In the pituitary gland, vacuolation and hypertrophy in the pars distalis were found in two males in the 100 mg/kg NaPB and 150 mg/kg NCD groups. In the liver, centrilobular hepatocellular hypertrophy was significantly increased in frequency by NaPB at ≥ 10 mg/kg in males and ≥ 30 mg/kg in females and by NCD at ≥ 50 mg/kg in males and 150 mg/kg in females, compared with the controls (Figure 2). The NCD groups exhibited periportal vacuolation in hepatocytes in both sexes, with a significantly increased frequency at ≥ 15 mg/kg in females. No significant treatment-related changes were found in the other organs examined in the NaPB and NCD groups.
Histopathological findings in male and female SD rats treated with NaPB or NCD for 28 days.

±, minimal; +, mild; ++, moderate; +++, severe.
Abbreviations: NaPB, phenobarbital sodium salt; NCD, nicardipine hydrochloride.
, **Significantly different from the control group at P < .05 and P < .01, respectively.
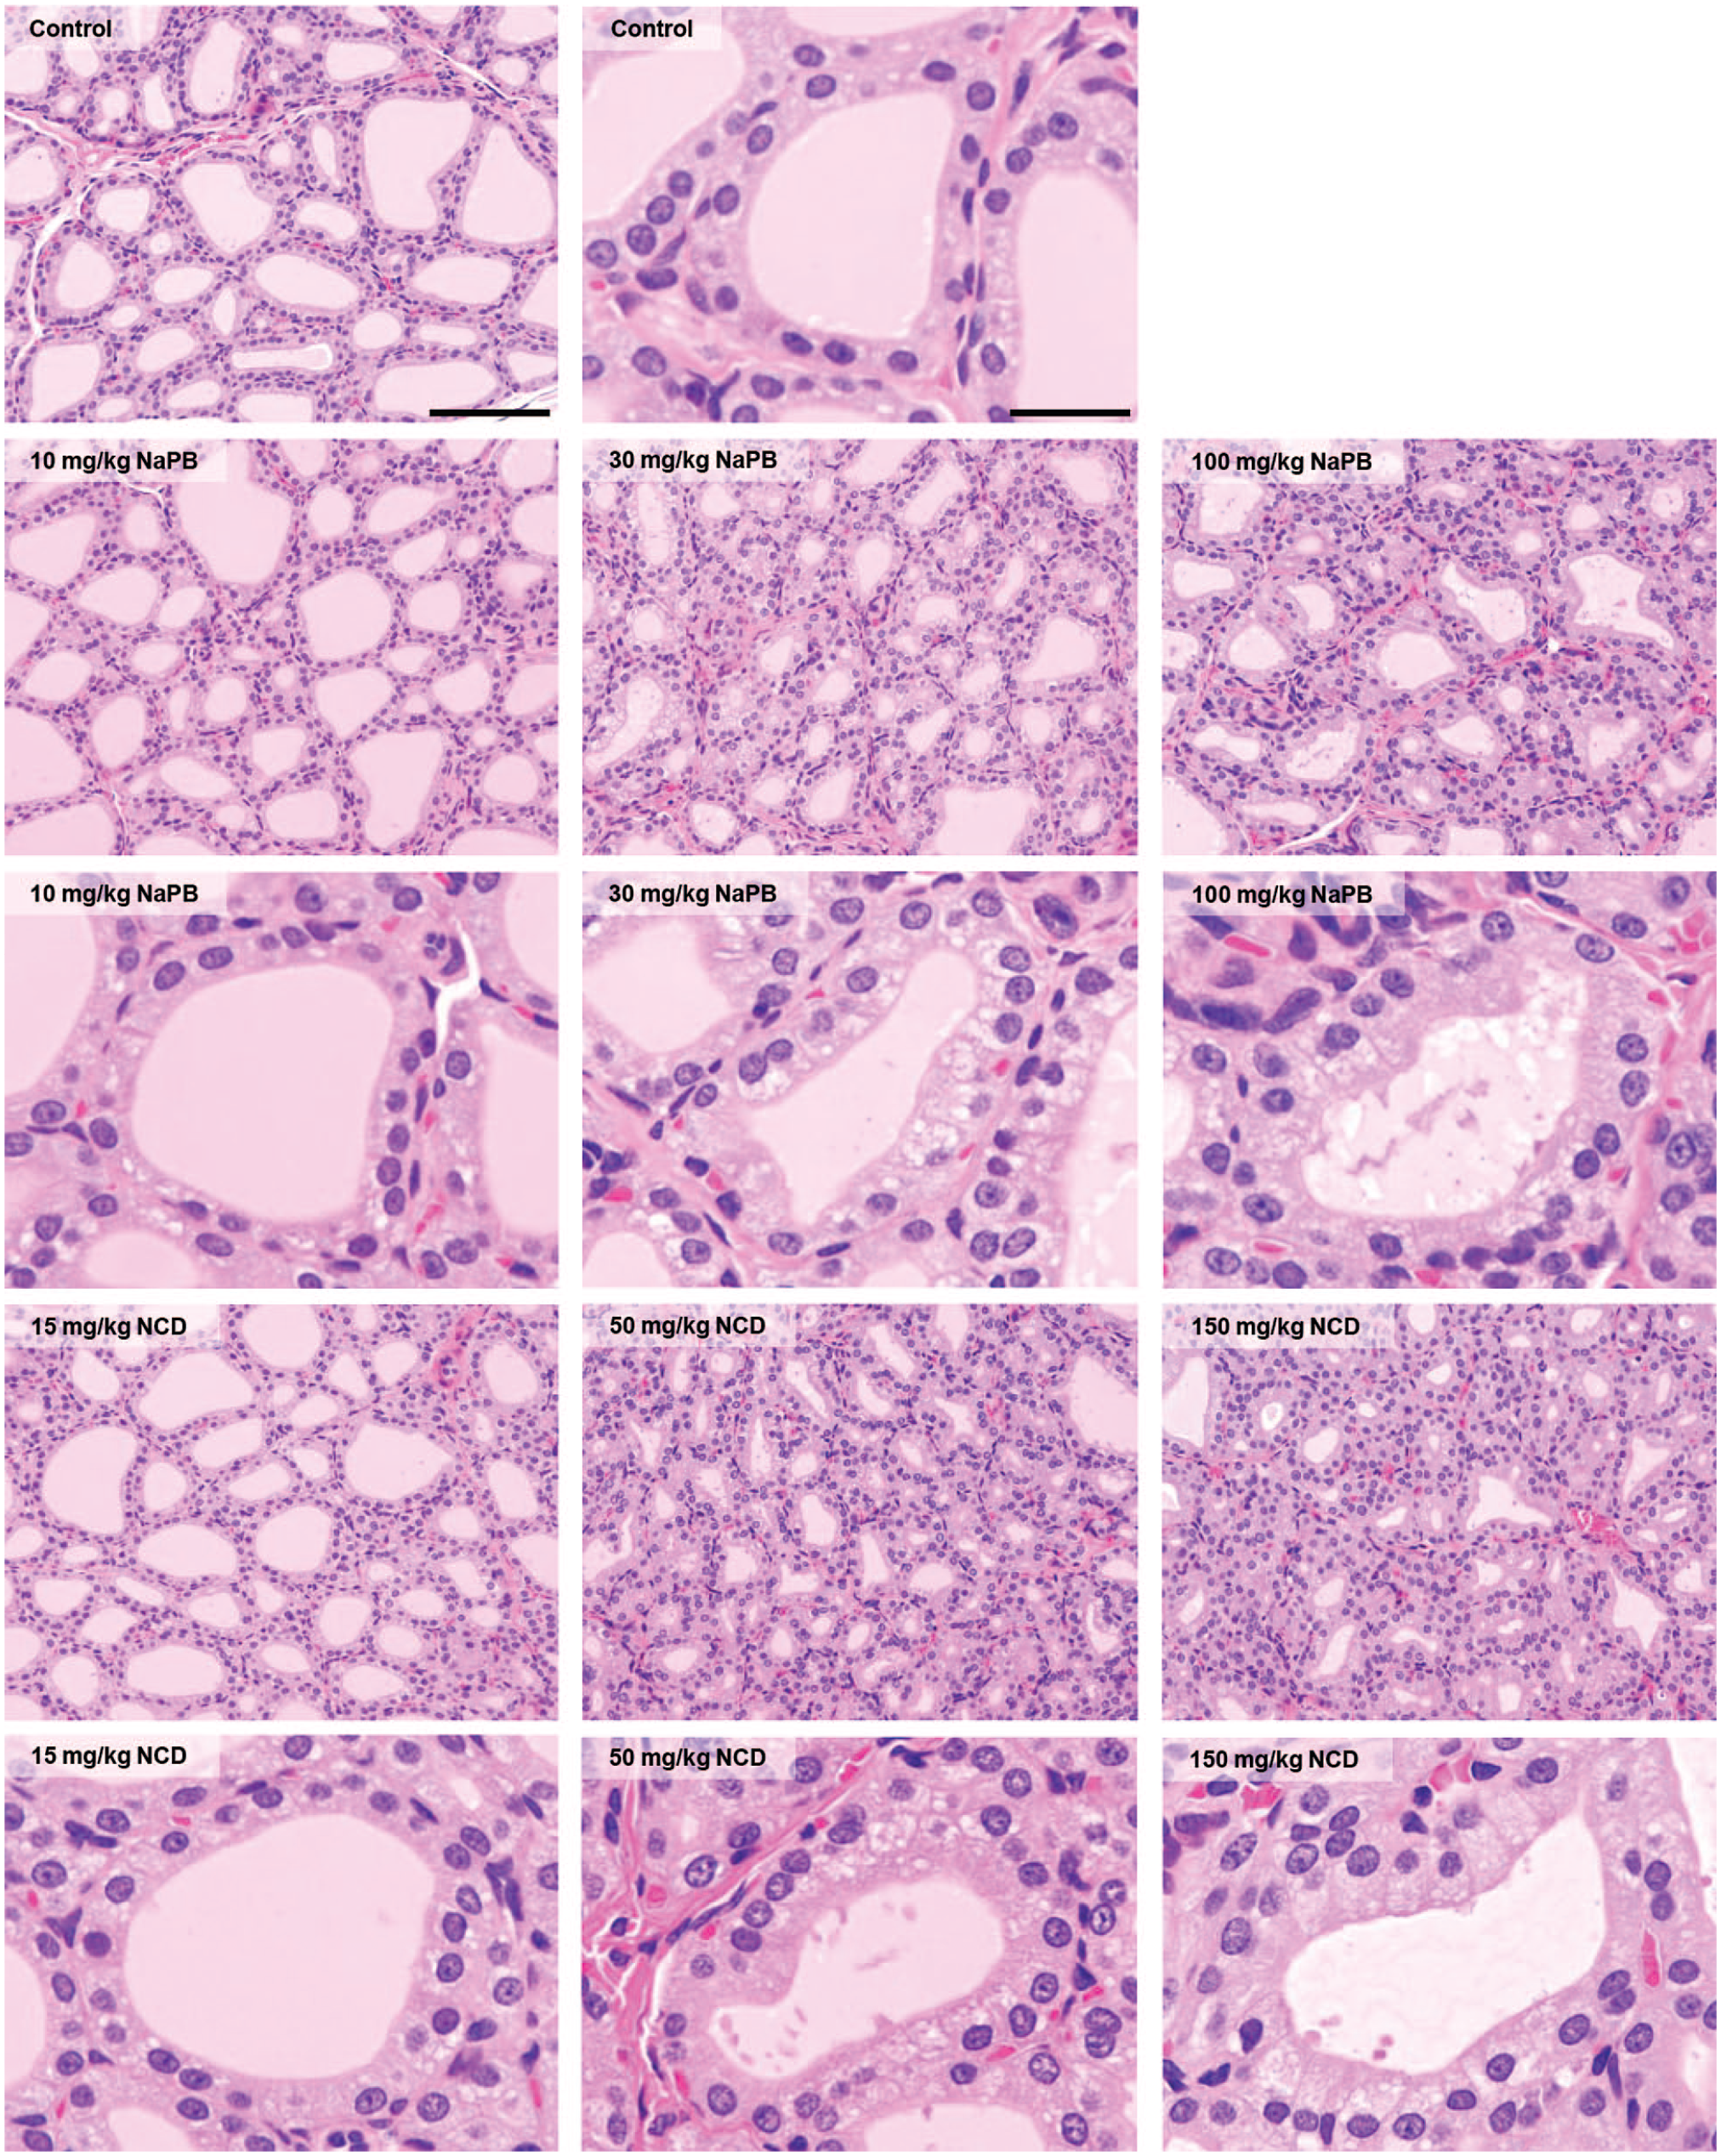
Representative histopathological findings in the thyroid glands of male Sprague-Dawley rats treated with 10, 30, or 100 mg/kg phenobarbital sodium salt (NaPB) or 15, 50, or 150 mg/kg nicardipine hydrochloride (NCD) for 28 days. Bars = 100 and 25 μm for low- and high-magnification views, respectively. The frequency of follicular cell hypertrophy was significantly increased in the ≥ 30 mg/kg NaPB and ≥ 50 mg/kg NCD groups compared with the control group.
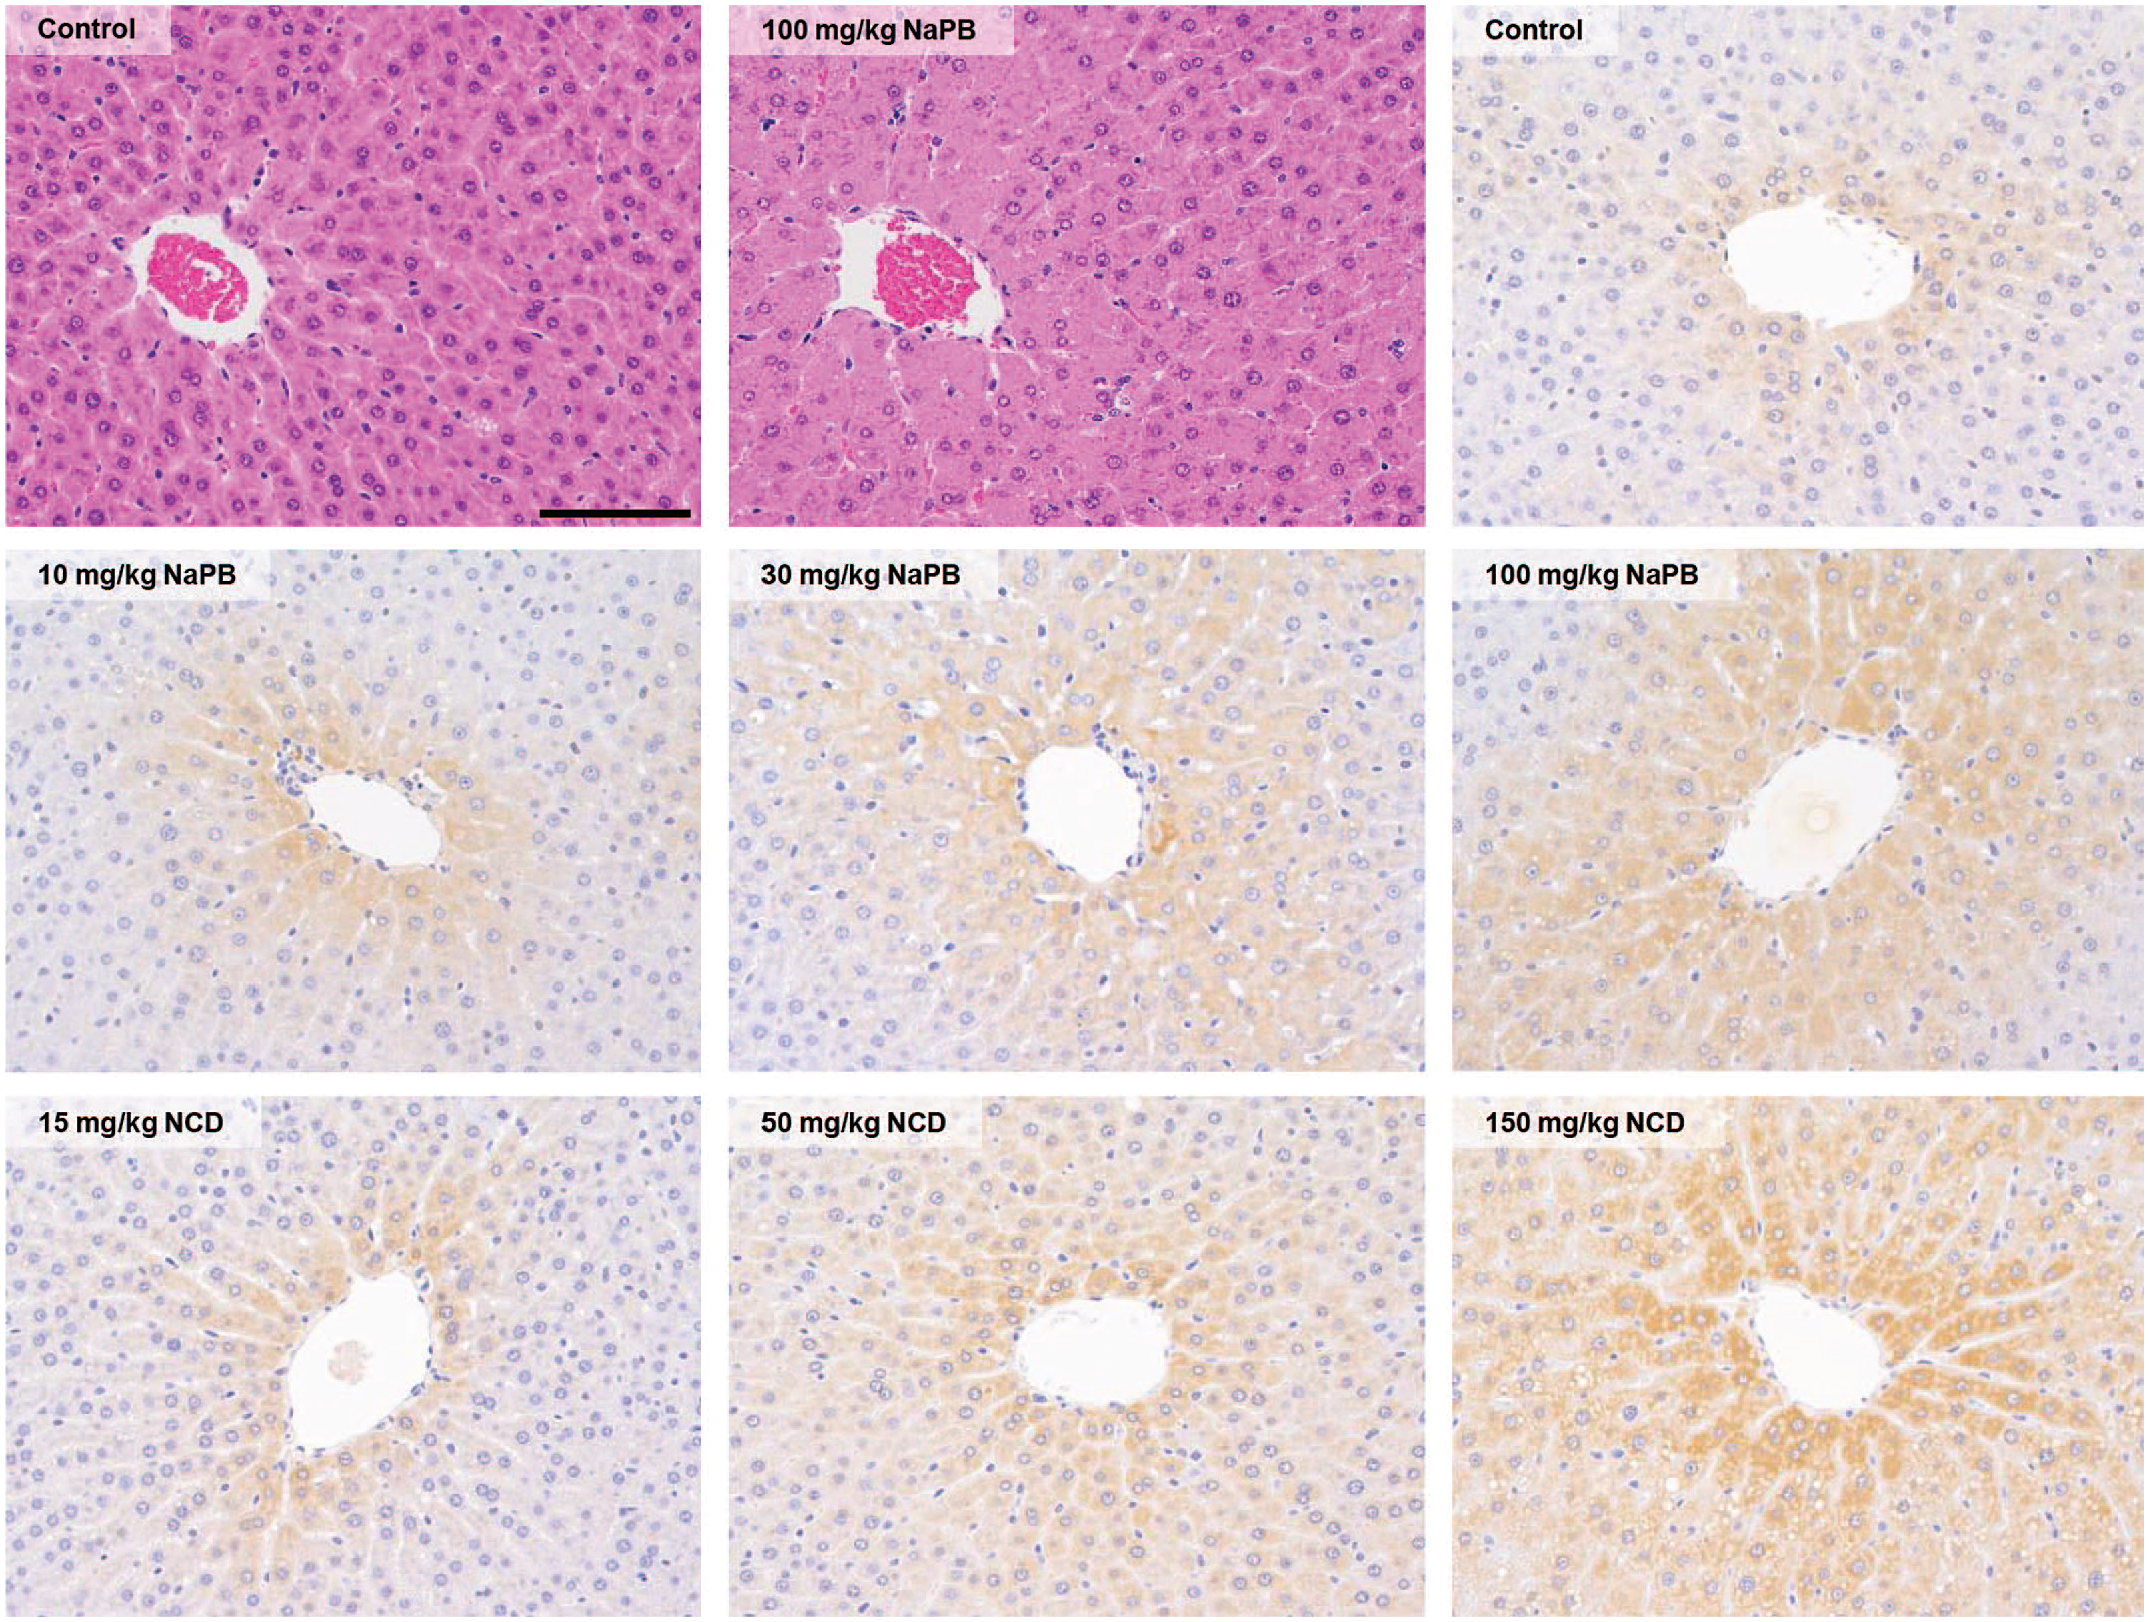
Representative histopathological and immunohistochemical findings for uridine diphosphate-glucuronosyltransferase (UGT) 1A6 in the liver of male Sprague-Dawley (SD) rats treated with 10, 30, or 100 mg/kg phenobarbital sodium salt (NaPB) or 15, 50, or 150 mg/kg nicardipine hydrochloride (NCD) for 28 days. Bar = 100 μm. The frequency of centrilobular hepatocellular hypertrophy in the liver was significantly increased in the ≥ 10 mg/kg NaPB and ≥ 50 mg/kg NCD groups compared with the controls.
Immunohistochemical Analyses of T3, T4, TSH, Ki67, and UGTs
In the control group, T4 was localized in the colloid, cytoplasm, and luminal surface with microvilli, the primary site of iodination by TPO, 30 of follicular epithelial cells in the thyroid gland (Figure 3A). T3 was also localized in the colloid, cytoplasm and luminal surface of follicular cells but was predominant at the luminal surface and lower in the cytoplasm compared with T4 (Figure 3B). In the NaPB and NCD groups, no obvious decrease in T3 or T4 immunostaining similar to that caused by TPO inhibitors was observed, even at doses resulting in significantly lower serum T4 levels compared with the control group.
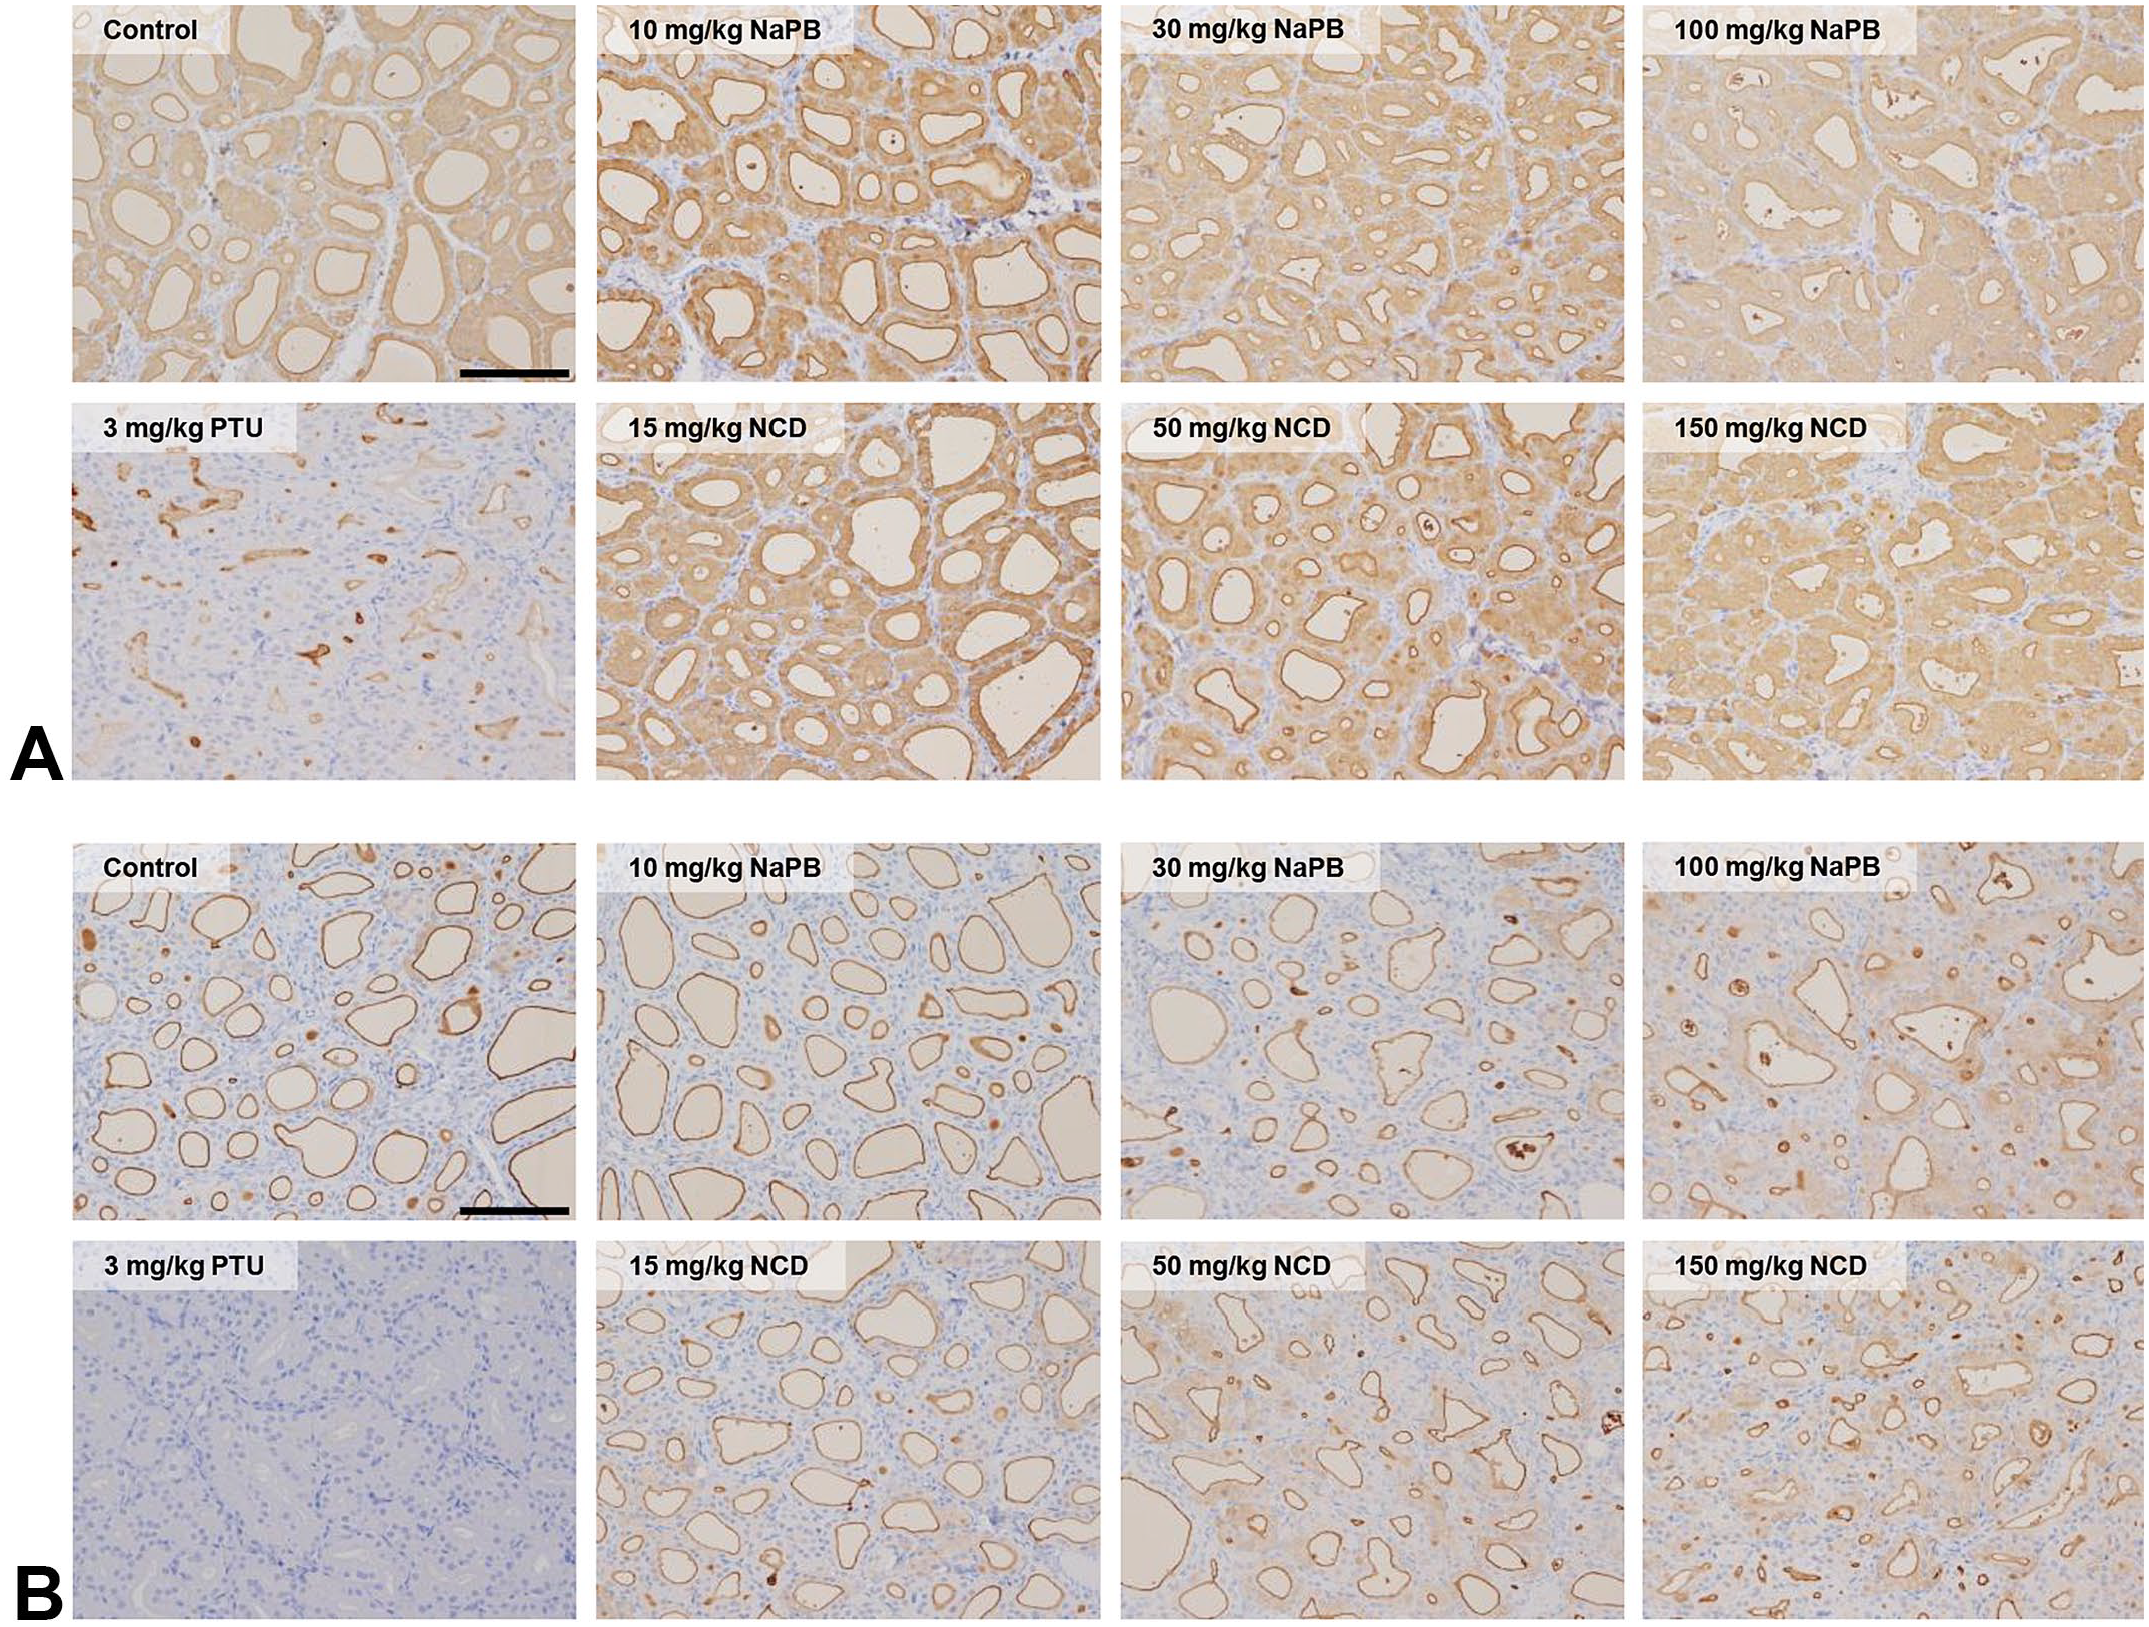
Representative immunohistochemical findings for (A) thyroxine (T4) and (B) triiodothyronine (T3) in the thyroid glands of male Sprague-Dawley (SD) rats treated with 10, 30, or 100 mg/kg phenobarbital sodium salt (NaPB) or 15, 50, or 150 mg/kg nicardipine hydrochloride (NCD) for 28 days. No obvious decrease in T4 or T3 staining was observed in the thyroid gland. For comparison with the current study results, the thyroid gland of a male SD rat treated with 1 mg/kg propylthiouracil (PTU), an inhibitor of thyroid peroxidase, for 28 days is shown in the lower left. Bars = 100 μm.
The ratio of the TSH-positive area in the pars distalis of the pituitary gland was significantly increased in both sexes treated with 150 mg/kg NCD compared with the control group (Figure 4A and B). A significant increase in the ratio of Ki67-positive follicular cells in the thyroid gland was detected in males treated with 100 mg/kg NaPB and ≥ 50 mg/kg NCD (Figure 4C and D).
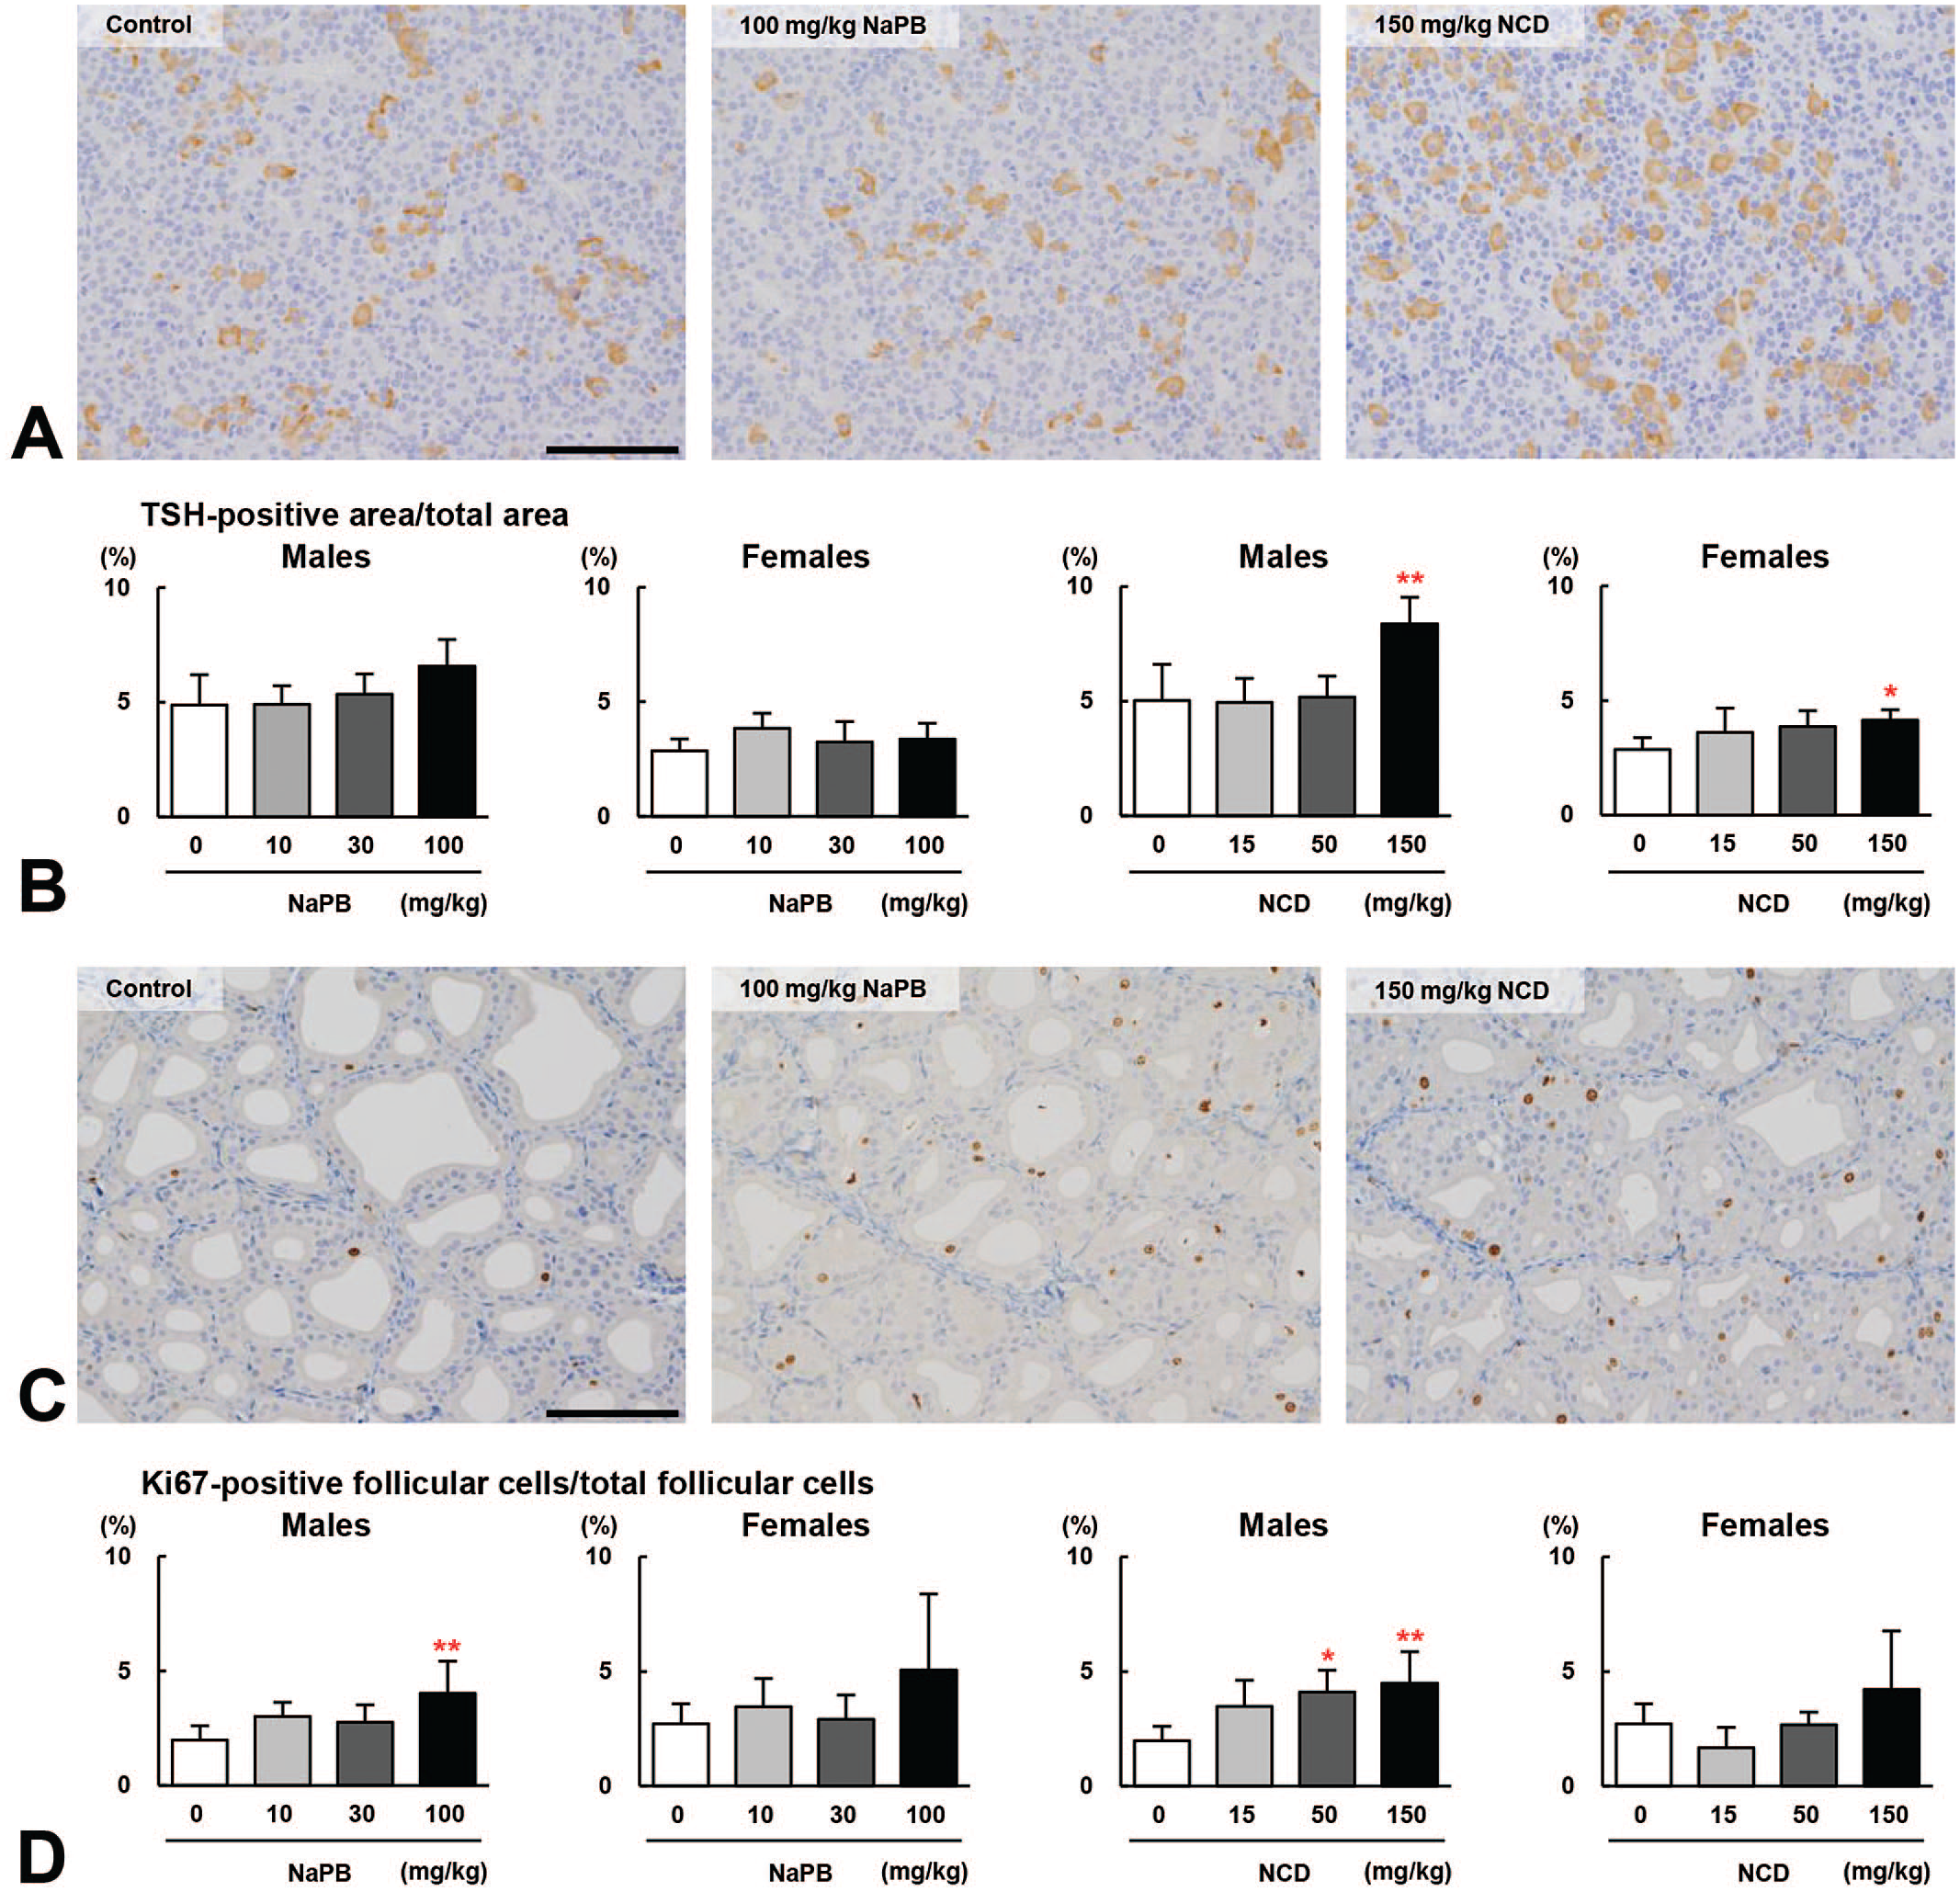
(A) Representative immunohistochemical findings for thyroid-stimulating hormone (TSH) in the pars distalis of the pituitary gland of male Sprague-Dawley (SD) rats treated with 100 mg/kg phenobarbital sodium salt (NaPB) or 150 mg/kg nicardipine hydrochloride (NCD) for 28 days. Bar = 100 μm. (B) The ratio of the TSH-positive area relative to the total area in the pars distalis of the pituitary gland. The TSH-positive area ratio was significantly increased in both sexes in the 150 mg/kg NCD group compared with the control group. (C) Representative immunohistochemical findings for Ki67 in the thyroid gland of male SD rats treated with 100 mg/kg NaPB or 150 mg/kg NCD for 28 days. Bar = 100 μm. (D) The ratio of Ki67-positive cells relative to the total follicular cells in the thyroid gland. The ratio of Ki67-positive follicular cells was significantly increased in males in the 100 mg/kg NaPB and ≥ 50 mg/kg NCD groups compared with the control group. Values are means ± standard deviations. * and ** significantly different from the control group at P < .05 and P < .01, respectively (Dunnett’s test).
Immunohistochemistry for UGTs in the liver revealed centrilobular expression of UGT1A6 and 1A1, and the former showed expanded expression areas with hepatocellular hypertrophy due to NaPB and NCD administration (Figure 2). There was a significant increase in the UGT1A6-positive area ratio in both sexes treated with ≥ 30 mg/kg NaPB, males treated with 150 mg/kg NCD, and females treated with ≥ 50 mg/kg NCD (Figure 5A). UGT1A1 expression was lower than UGT1A6 expression, and a significant increase in the UGT1A1-positive area ratio was found only in females treated with 100 mg/kg NaPB or 150 mg/kg NCD (Figure 5B).
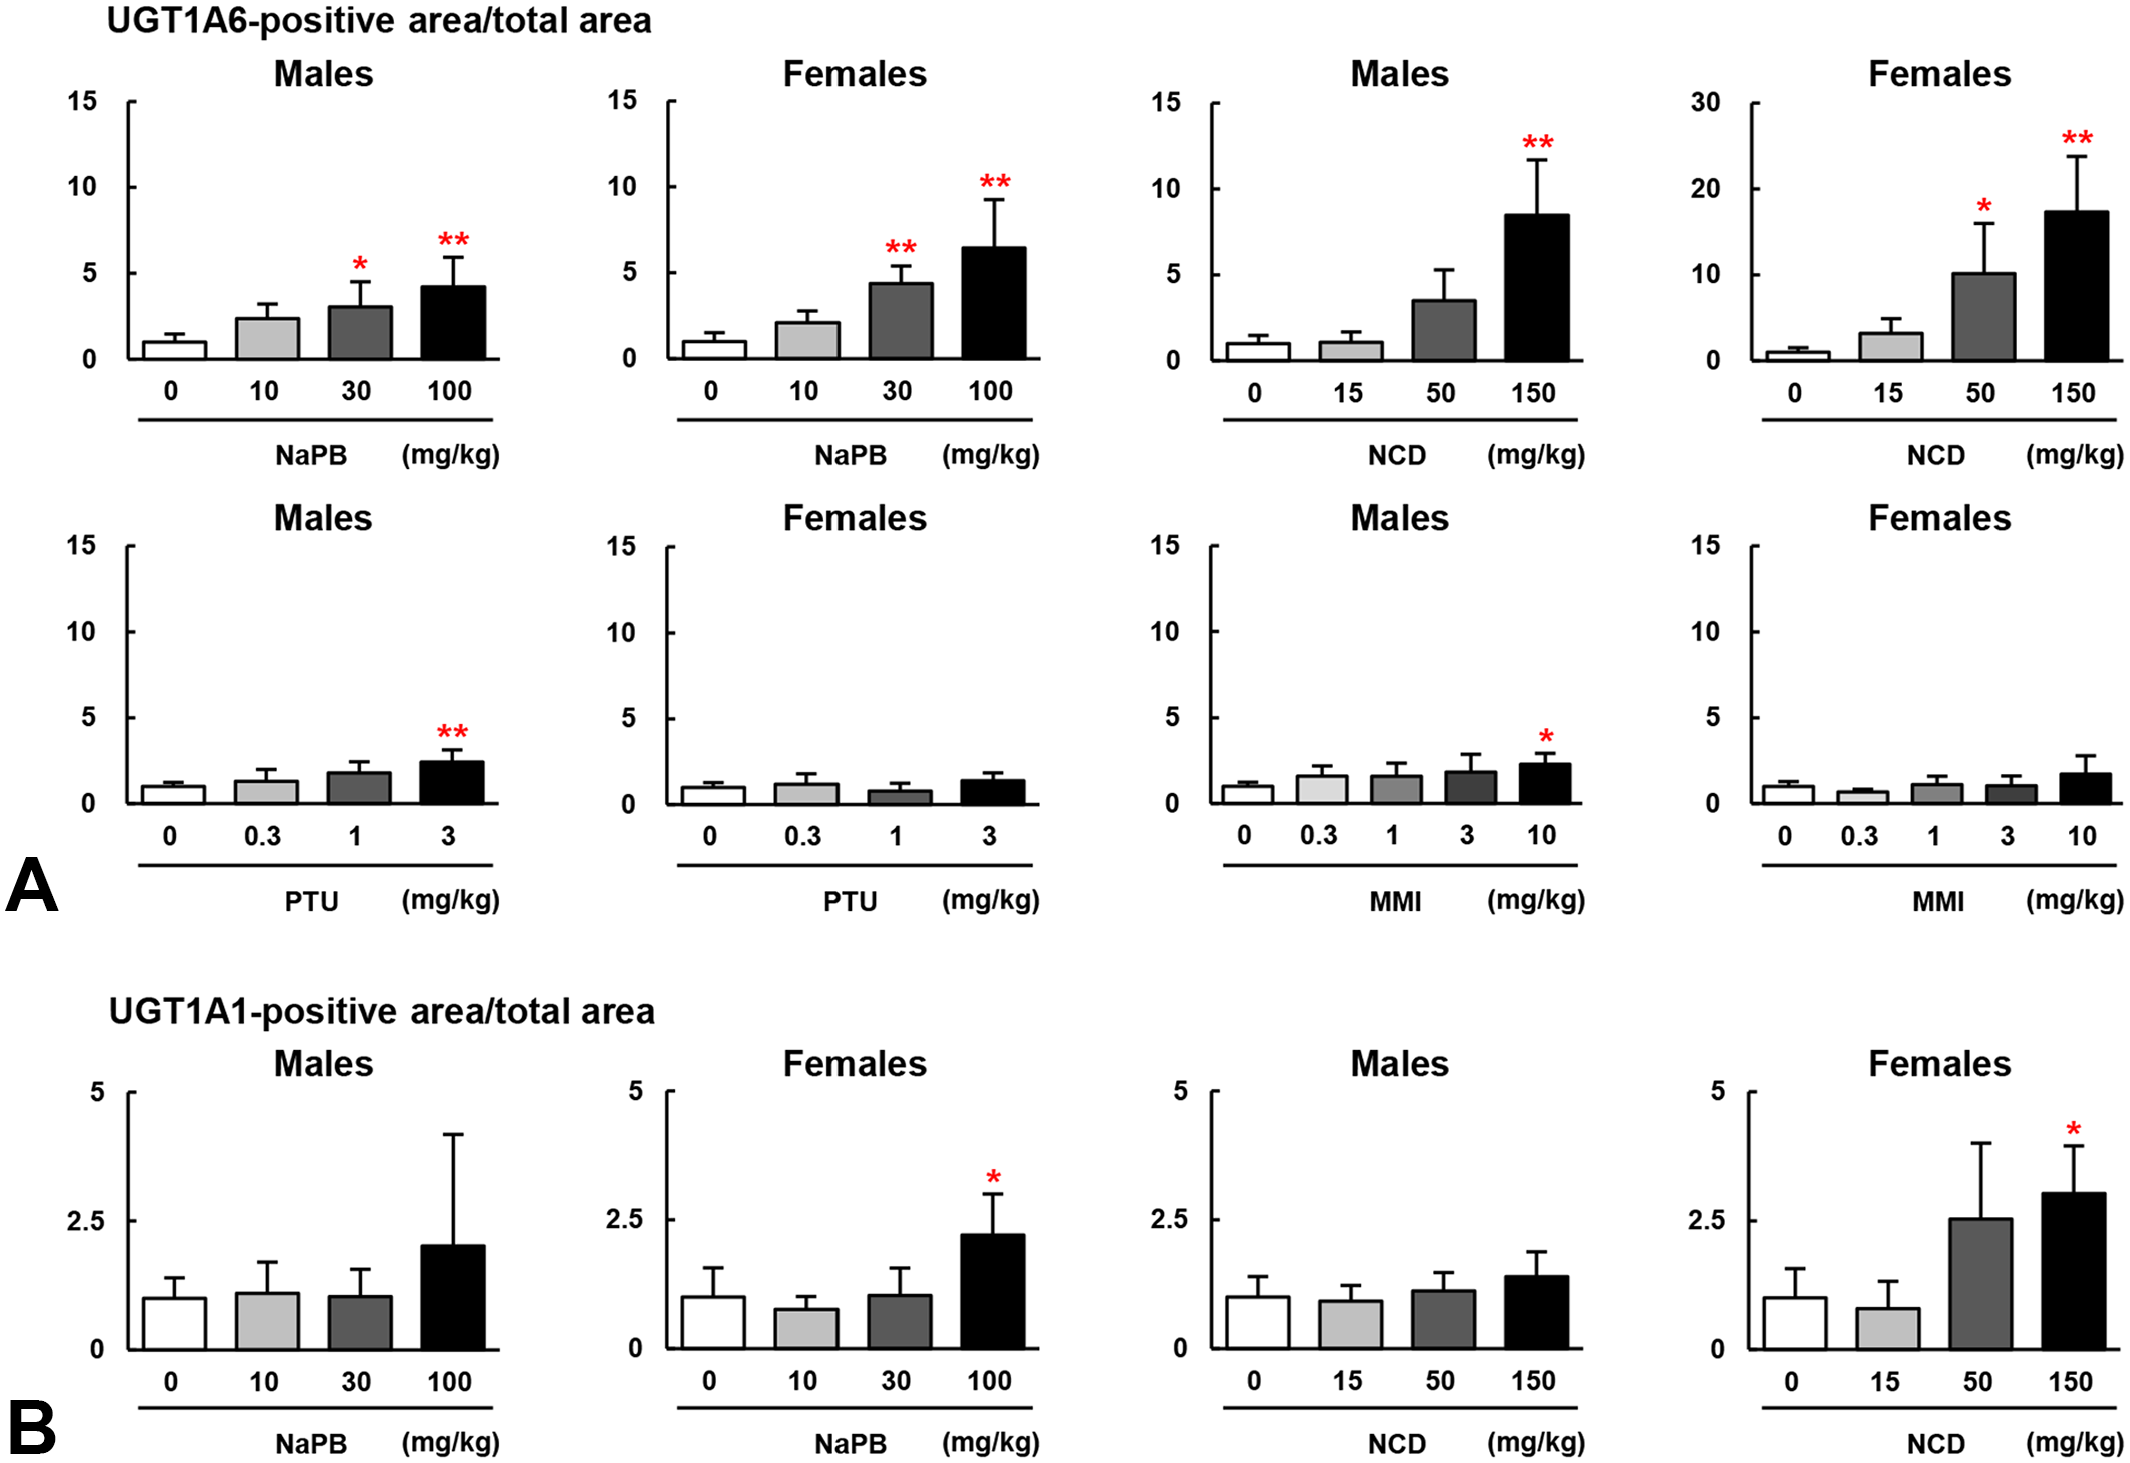
(A) The ratio of the UGT1A6-positive area relative to the total area of the liver was expressed as the mean fold change from the control group. The UGT1A6-positive area was significantly increased in both sexes in the ≥ 30 mg/kg NaPB group, in males in the 150 mg/kg NCD group, in females in the ≥ 50 mg/kg NCD group, in males in the 3 mg/kg propylthiouracil (PTU) group, and in males in the 10 mg/kg methimazole (MMI) group compared with the corresponding control groups, according to Dunnett’s test. (B) The ratio of the UGT1A1-positive area relative to the total area of the liver was expressed as the mean fold change from the control group. The ratio of the UGT1A1-positive area was significantly increased in females in the 100 mg/kg NaPB and 150 mg/kg NCD groups compared with the control group.
Discussion
In the current study, NaPB and NCD were repeatedly administered to rats by gavage for 28 days once daily. As results, in the measurement of serum hormones, decreases in serum T4 levels and increases in TSH levels were detected. In the histopathological analysis, hypertrophy/hyperplasia of follicular cells and colloid depletion with morphological irregularity in the thyroid gland and centrilobular hepatocellular hypertrophy in the liver were observed, with dose-dependent increases in their frequency and degree. These serum hormone changes and histopathological findings were in accordance with the well-known mechanisms of antithyroid effects by thyroid hormone metabolism promoter. 39 We performed various immunohistochemical analyses to explore more effective methods of detecting and predicting mechanisms of antithyroid effects. As results, there was no obvious change in T3 or T4 immunostaining in the thyroid gland, whereas UGT1A6-positive area in the liver increased at doses lower than those affecting serum hormone levels. Significant increases in the TSH-positive area ratio in the pituitary gland and Ki67-positive follicular cells in the thyroid gland were detected at the same doses as those increasing serum TSH levels.
The most important result in the histopathological analysis was that hypertrophy of thyroid follicular cells was detectable at doses lower than those significantly affecting serum hormone levels in rats treated with NaPB and NCD, as well as TPO inhibitors. 1 Under indirect antithyroid effects caused by enhanced thyroid hormone metabolism, increased excretion of thyroid hormones is compensated by enhanced hormone synthesis along with thyroid hypertrophy in response to elevated TSH levels, 12 and blood T3 and T4 can be maintained at levels comparable with control levels.11,23 In the current study, although the changes in serum thyroid hormone levels were less severe than the direct and potent effects induced by the TPO inhibitors, histopathological findings, such as follicular cell hypertrophy were observed from low doses onwards, suggesting sustained compensatory responses to blood hormonal fluctuations induced by metabolic acceleration. Therefore, histopathological analysis may be able to detect the antithyroid effects more sensitively than measurements of serum hormone levels in standard 28-day repeated-dose toxicity studies, regardless of the difference in these two antithyroid mechanisms.
TSH-producing cells in the pituitary gland undergo hypertrophy with colloid-like substance accumulation in hypothyroid conditions. 21 Hypertrophy and vacuolation in the anterior cells of the pituitary gland were observed in a few rats in the high-dose groups, whereas a significant increase in the TSH-positive area ratio was detected at the same doses that significantly increased the serum TSH level, suggesting that TSH immunostaining may be more sensitive for predicting changes in the serum TSH level than histopathological analysis of the pituitary gland. TSH promotes follicular cell proliferation and increases thyroid weight,13,16 and in the current study, Ki67-positive follicular cells and thyroid weight were significantly increased in the high-dose groups, along with significant changes in serum thyroid hormone levels. The increased Ki67-positive cells in the middle-dose group without serum thyroid hormone changes suggested that compensatory follicular cell proliferation to promote thyroid hormone synthesis could be detected, even when serum T3, T4, and TSH levels were maintained at levels comparable with control levels. Significant increases in the pituitary TSH-positive area, Ki67-positive follicular cells, and thyroid weights were also detected at a sensitivity comparable with detection of changes in serum hormone levels in rats treated with TPO inhibitors, 1 this indicates that these parameters, beyond differences in mechanism, are useful as complementary indicators for detecting antithyroid chemicals.
The immunohistochemical analyses in rats treated with TPO inhibitors revealed that T3 and T4 immunostaining in the thyroid gland decreased starting at doses lower than those that significantly decreased serum T3 and T4 levels, 1 consistent with the mechanism of TPO inhibition directly preventing hormone production in the thyroid gland. In contrast, no obvious decrease in T3 or T4 immunostaining was observed in the NaPB and NCD groups, even at the doses that significantly decreased serum T4 level. In males in the NaPB and NCD groups, T3 immunostaining in the cytoplasm of hypertrophic follicular cells showed a dose-dependent, rather increasing trend, reflecting a compensatory promotion of T3 synthesis. These results were considered reasonable based on the fact that promoters of thyroid hormone metabolism exhibit indirect antithyroid effects via increased hormone elimination in the liver. Thus, immunohistochemistry for T3 and T4 may be useful for differentiating between TPO inhibitors and thyroid hormone metabolism promoters.
Induction of hepatic microsomal enzyme expression in the rat liver causes centrilobular hepatocellular hypertrophy. In the current study, this finding was found at doses lower than those affecting the serum T4 level and generally at the same doses at which follicular cell hypertrophy in the thyroid gland was observed. In the immunohistochemical analysis of UGTs, a dose-dependent increase in UGT1A6 expression was observed along with hepatocellular hypertrophy and follicular cell hypertrophy in the thyroid gland, and the UGT1A6-positive area ratio was significantly increased at lower or equal doses as those significantly affecting serum hormone levels. In contrast, changes in the UGT1A1-positive area were weaker than those in the UGT1A6-positive area. In rats treated with TPO inhibitors, the hepatocellular hypertrophy frequency and UGT1A6 expression were lower compared with the NaPB and NCD treatment groups, and a significant increase in the UGT1A6-positive area ratio was observed only in males treated with 3 mg/kg propylthiouracil and 10 mg/kg methimazole (Figure 5A). The effect was apparently weaker than that induced by thyroid hormone metabolism promoters, suggesting that histopathological analysis and UGT1A6 immunostaining in the liver may be useful for differentiating between these two mechanisms.
In safety assessments conducted in vitro and/or in rodents, it is critical to consider whether chemicals with suggested antithyroid activities exhibit similar effects in humans. TPO inhibitors have been clinically demonstrated to decrease circulating thyroid hormone levels not only in rodents but also in humans.9,38 Meanwhile, indirect antithyroid effects via induction of metabolic enzymes in the liver and increased biliary excretion of thyroid hormones, which are often observed in rodents, are poorly extrapolated to humans. This is due to the higher sensitivity of rodents to hepatic enzyme induction and the shorter half-life of circulating thyroid hormones compared with humans. 6 Therefore, identifying the mechanism involved in the detection of antithyroid chemicals, particularly whether the chemicals promote hormone metabolism in the liver, is crucial for risk management in humans. The evaluation method we propose here, that is, immunohistochemical analyses of thyroid T3 and T4 and hepatic UGT1A6, can distinguish TPO inhibitors from hormone-metabolizing substances relatively easily and is expected to provide useful information for extrapolation to humans.
In the current study, NaPB elevated the levels of HDL-C in both sexes and T-CHO in males, consistent with a previous report that phenobarbital enhances cholesterol production in the rat liver. 17 Although NCD increased serum T-CHO, LDL-C, and HDL-C levels in females, no significant changes were observed in males. This is consistent with the histopathological analysis, which showed that periportal hepatocellular vacuolation, indicative of lipid accumulation in the cytoplasm, was more prominent in females than males. Thus, these serum lipid parameters, which showed only minor changes after TPO inhibitor administration, along with slight reductions in T3 and T4 levels, 1 were increased by treatment with hormone metabolism promoters in relation to their mechanisms. However, the role of these serum lipid parameters as markers of antithyroid and hepatic hypermetabolic effects was considered limited because histopathological and immunohistochemical analyses of the thyroid gland and liver were more sensitive.
Although hypothyroidism causes dysfunction of the adrenal gland, testis, and ovary,20,32 there were no significant changes in serum hormone levels, organ weights, or histopathological findings other than the thyroid-related ones in the current study. These results suggest that decreases in serum thyroid hormone levels induced by thyroid hormone metabolism promoters may not affect adrenal or gonadal function, at least in the short term.
In conclusion, as with TPO inhibitors, promoters of thyroid hormone metabolism induced follicular cell hypertrophy in the thyroid gland at doses lower than those significantly affecting serum thyroid hormone levels, suggesting that histopathological analysis can be more sensitive than blood hormone levels for detecting antithyroid chemicals. Immunohistochemical analysis of TSH in the pituitary gland and Ki67 in the thyroid gland, as well as thyroid weight, can also be useful complementary indicators of antithyroid effects. Histopathological and immunohistochemical findings, such as hepatocellular hypertrophy and increased UGT1A6 expression, suggest accelerated thyroid hormone metabolism in the liver, and T3 and T4 immunostaining in the thyroid gland can be used to differentiate thyroid hormone metabolism promoters from TPO inhibitors. Although the changes induced by administration of thyroid hormone metabolism promoters to rats and their mechanisms are well-known, the present study clearly demonstrated that it is possible to detect antithyroid effects and differentiate between these two mechanisms by comparing the sensitivity of histopathological and immunohistochemical analyses with the measurement serum hormone levels. Focusing on these parameters may provide a more simplified and efficient in vivo evaluation method to detect antithyroid chemicals and predict their mechanisms in standard 28-day repeated-dose toxicity studies.
Footnotes
Acknowledgements
The authors thank Ayako Saikawa and Yoshimi Komatsu for their expert technical assistance with processing high-quality histological materials.
Declaration of Conflicting Interests
The author(s) declared no potential conflicts of interest with respect to the research, authorship, and/or publication of this article.
Funding
The author(s) disclosed receipt of the following financial support for the research, authorship, and/or publication of this article: This work was supported by Grants-in-Aid for the Risk of Chemical Substances from the Ministry of Health, Labour and Welfare, Japan (grant nos. 21KD1003 and 24KD2003).