
Abstract
Recent advances in bioanalytical and imaging technologies have revolutionized our ability to assess complex biological and pathological changes within tissue samples. Spatial omics, a rapidly evolving technology, enables the simultaneous detection of multiple biomolecules in tissue sections, allowing for high-dimensional molecular profiling within tissue microanatomical contexts. This offers a powerful opportunity for precise, multidimensional exploration of complex disease pathophysiology. The Pathology 2.0 working group within the European Society of Toxicologic Pathology (ESTP) includes a subgroup dedicated to spatial omics technologies. Their primary goal is to raise awareness about these emerging technologies and their potential applications in discovery and toxicologic pathology. This review provides an overview of commonly used, commercially available platforms for transcriptomic, proteomic, and multiomic analysis, discussing technical aspects and illustrative examples of their applications. To harness the power of spatial omics for translational drug discovery and human safety risk assessment, we emphasize the important role of pathologists at every stage of the workflow—from hypothesis generation to sample preparation, data analysis, and interpretation. Spatial omics technologies offer novel opportunities in target discovery, lead selection, preclinical assessment, and clinical development in compound development.
Keywords
This “Points to Consider” article is a product of a European Society of Toxicologic Pathology (ESTP) Pathology 2.0 Working Group. It has been reviewed and approved by the Committee of Regulatory and Scientific Standards (CRSS) and Executive Committee of the ESTP and endorsed by the Executive Committees of the British Society of Toxicological Pathology (BSTP) and Society of Toxicologic Pathology (STP), but it does not represent a formal best practice recommendation of the Societies; rather, it is intended to provide key “points to consider” for the toxicologic pathology community. The opinions expressed in this document are those of the authors and do not reflect views or policies of the employing institutions. Readers of Toxicologic Pathology are encouraged to send their thoughts on these articles or ideas for new topics to the editor.
Introduction
Spatial omics is a cutting-edge approach to profile the expression of mRNAs of large numbers of genes (spatial transcriptomics, ST) or highly multiplexed protein panels (spatial proteomics), or combinations of both (proteogenomics), on one tissue slide. Spatial omics technologies add a novel dimension to classical pathology, enabling the association of RNA and/or protein expression patterns with histomorphological features. Spatially resolved transcriptomics was even selected as method of the year by Nature Methods in 2021, 64 promoting the integration of spatial omics technologies in research including discovery pathology. However, until now spatial omics approaches in toxicology assessments have been rarely published. Since 2020, the commercial availability of spatial omics platforms with different resolutions and readouts is rapidly increasing. This is of special interest to pharmaceutical and biotechnology companies as it may facilitate standardization, outsourcing, and integration of spatial omics readouts in the discovery and safety pathology workflows. For transcriptome profiling, vendors provide technologies with an unbiased, species agnostic whole transcriptome readout (eg, 10x Genomics Visium Spatial Gene Expression for Fresh Frozen 6 ; Curio Bioscience’s Seeker 31 and Trekker 32 ; BGI Genomics STOmics 17 ) or species-specific, probe-based approaches (eg, Nanostring GeoMx 70 and CosMx Spatial Molecular Imager (SMI), 69 Vizgen’s MERSCOPE, 102 Resolve Biosciences Molecular Cartography, 82 Rebus Esper, 81 RNAscope HiPex v2 Assays, 8 10x Genomics Xenium,1,7 Spatial Gene Expression for FFPE, and CytAssist Spatial Gene Expression 5 ).
Commercialized spatial proteomics technologies are all antibody-based but vary a lot, especially in the way antibody binding is detected. We distinguish fluorochrome- (Miltenyi Biotec MACSima, 67 Akoya PhenoCycler 10 /CODEX,43,18 Leica Cell DIVE, 58 RareCyte Orion, 80 Canopy Biosciences CellScape, 22 and Lunaphore COMET 63 ), mass cytometry imaging- (eg, Standard BioTools Hyperion XTi 91 and Ionpath MIBIscope 49 ) and oligonucleotide-based (Nanostring GeoMx) detection systems. Furthermore, merged transcriptomics and proteomics technologies (eg, Lunaphore COMET, Miltenyi Biotec MACSima, Nanostring GeoMx and CosMx SMI), as well as combinations of different platforms and integrative data readouts are increasingly being applied.
In this review, the European Society of Toxicologic Pathology (ESTP) Pathology 2.0 Spatial Omics Subgroup, supported by spatial omics experts from academia, compiled and evaluated marketed ST, proteomics and proteogenomics platforms, discussing their potential applications in toxicologic and discovery pathology. Pathologists play a pivotal role in spatial omics experiments and must have a basic understanding of spatial omics technologies and data analysis methods, including their limitations, to effectively support these studies. Fundamental methodological aspects for toxicologic and discovery pathologists were outlined first, followed by an exploration of method combinations. This foundation is essential for understanding the role of pathologists in collaborating with other scientific experts in spatial omics workflows. In addition, the review assesses the possibilities and limitations of applying these techniques in the nonclinical safety assessment of novel therapeutic drug candidates. Given that spatial omics is a rapidly evolving field, this review provides a snapshot and makes no claims to completeness.
ST Technologies
ST technologies are primarily categorized as (1) Next-Generation Sequencing (NGS)-based approaches, encoding positional information onto transcripts using barcodes; and (2) imaging-based approaches, comprising in situ sequencing (ISS)- or in situ hybridization (ISH)-based methods (Figure 1). These two classes of technology deliver measurements of gene expression in situ.28,96 Key features of commercial ST platforms are summarized in Table 1.
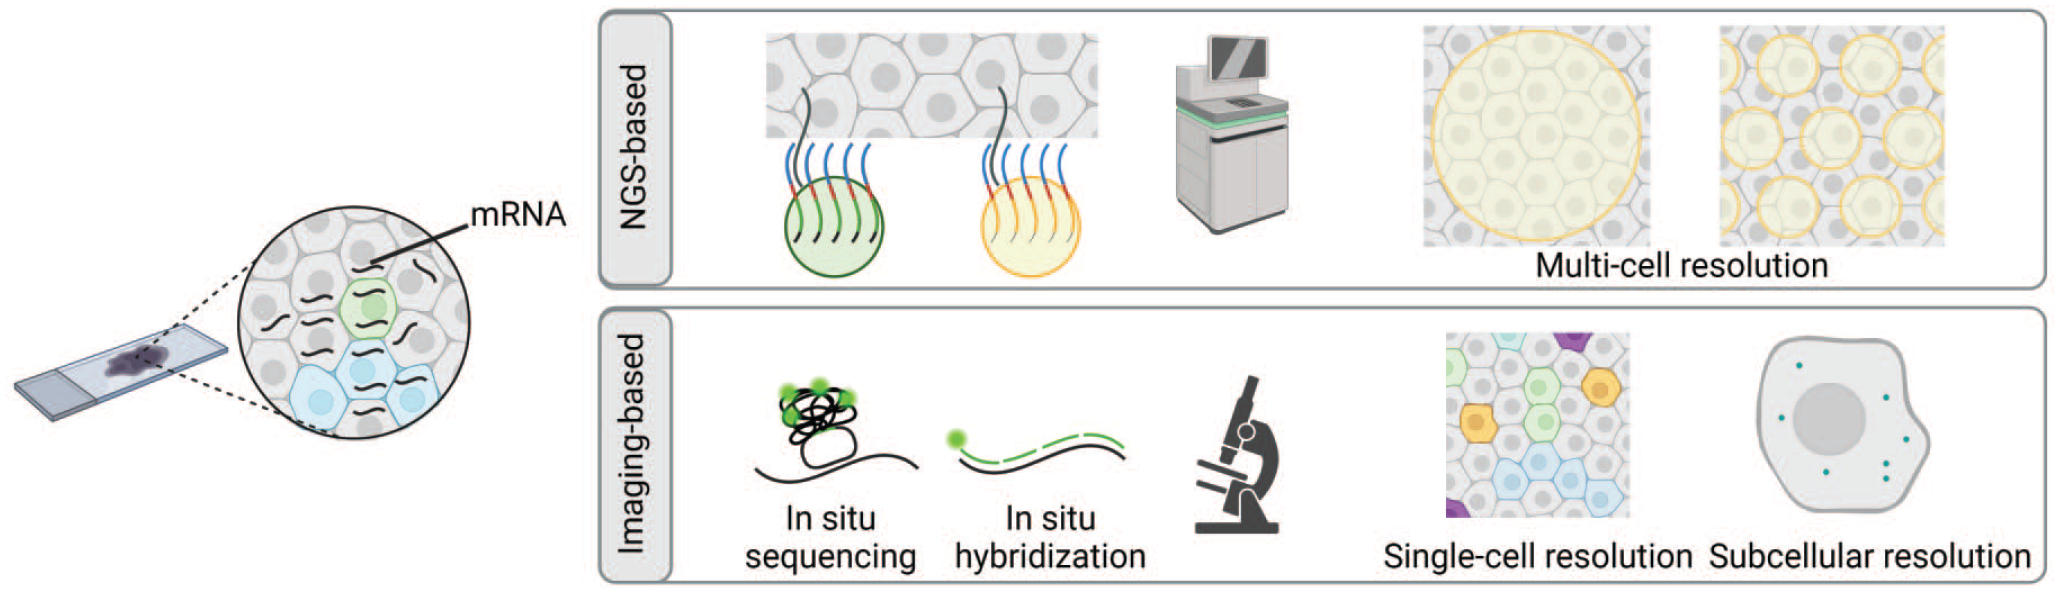
The principles of Next-Generation Sequencing (NGS)- and imaging-based spatial transcriptomics. The NGS-based approach (upper panel) detects mRNA or its corresponding probes by an array of spatially barcoded probes arranged as spots, beads, or DNA nanoballs. The readout is conducted via NGS. The array size and density determine the resolution. Imaging-based spatial transcriptomics (lower panel) targets a defined set of genes by in situ sequencing or highly multiplexed in situ hybridization. In situ sequencing uses padlock probes for mRNA or cDNA detection, while in situ hybridization employs fluorescently labeled oligonucleotides to capture the mRNA. Imaging-based methods offer high resolution at the single-cell or subcellular level. Figure created with BioRender.com.
Overview of spatial transcriptomics methods.
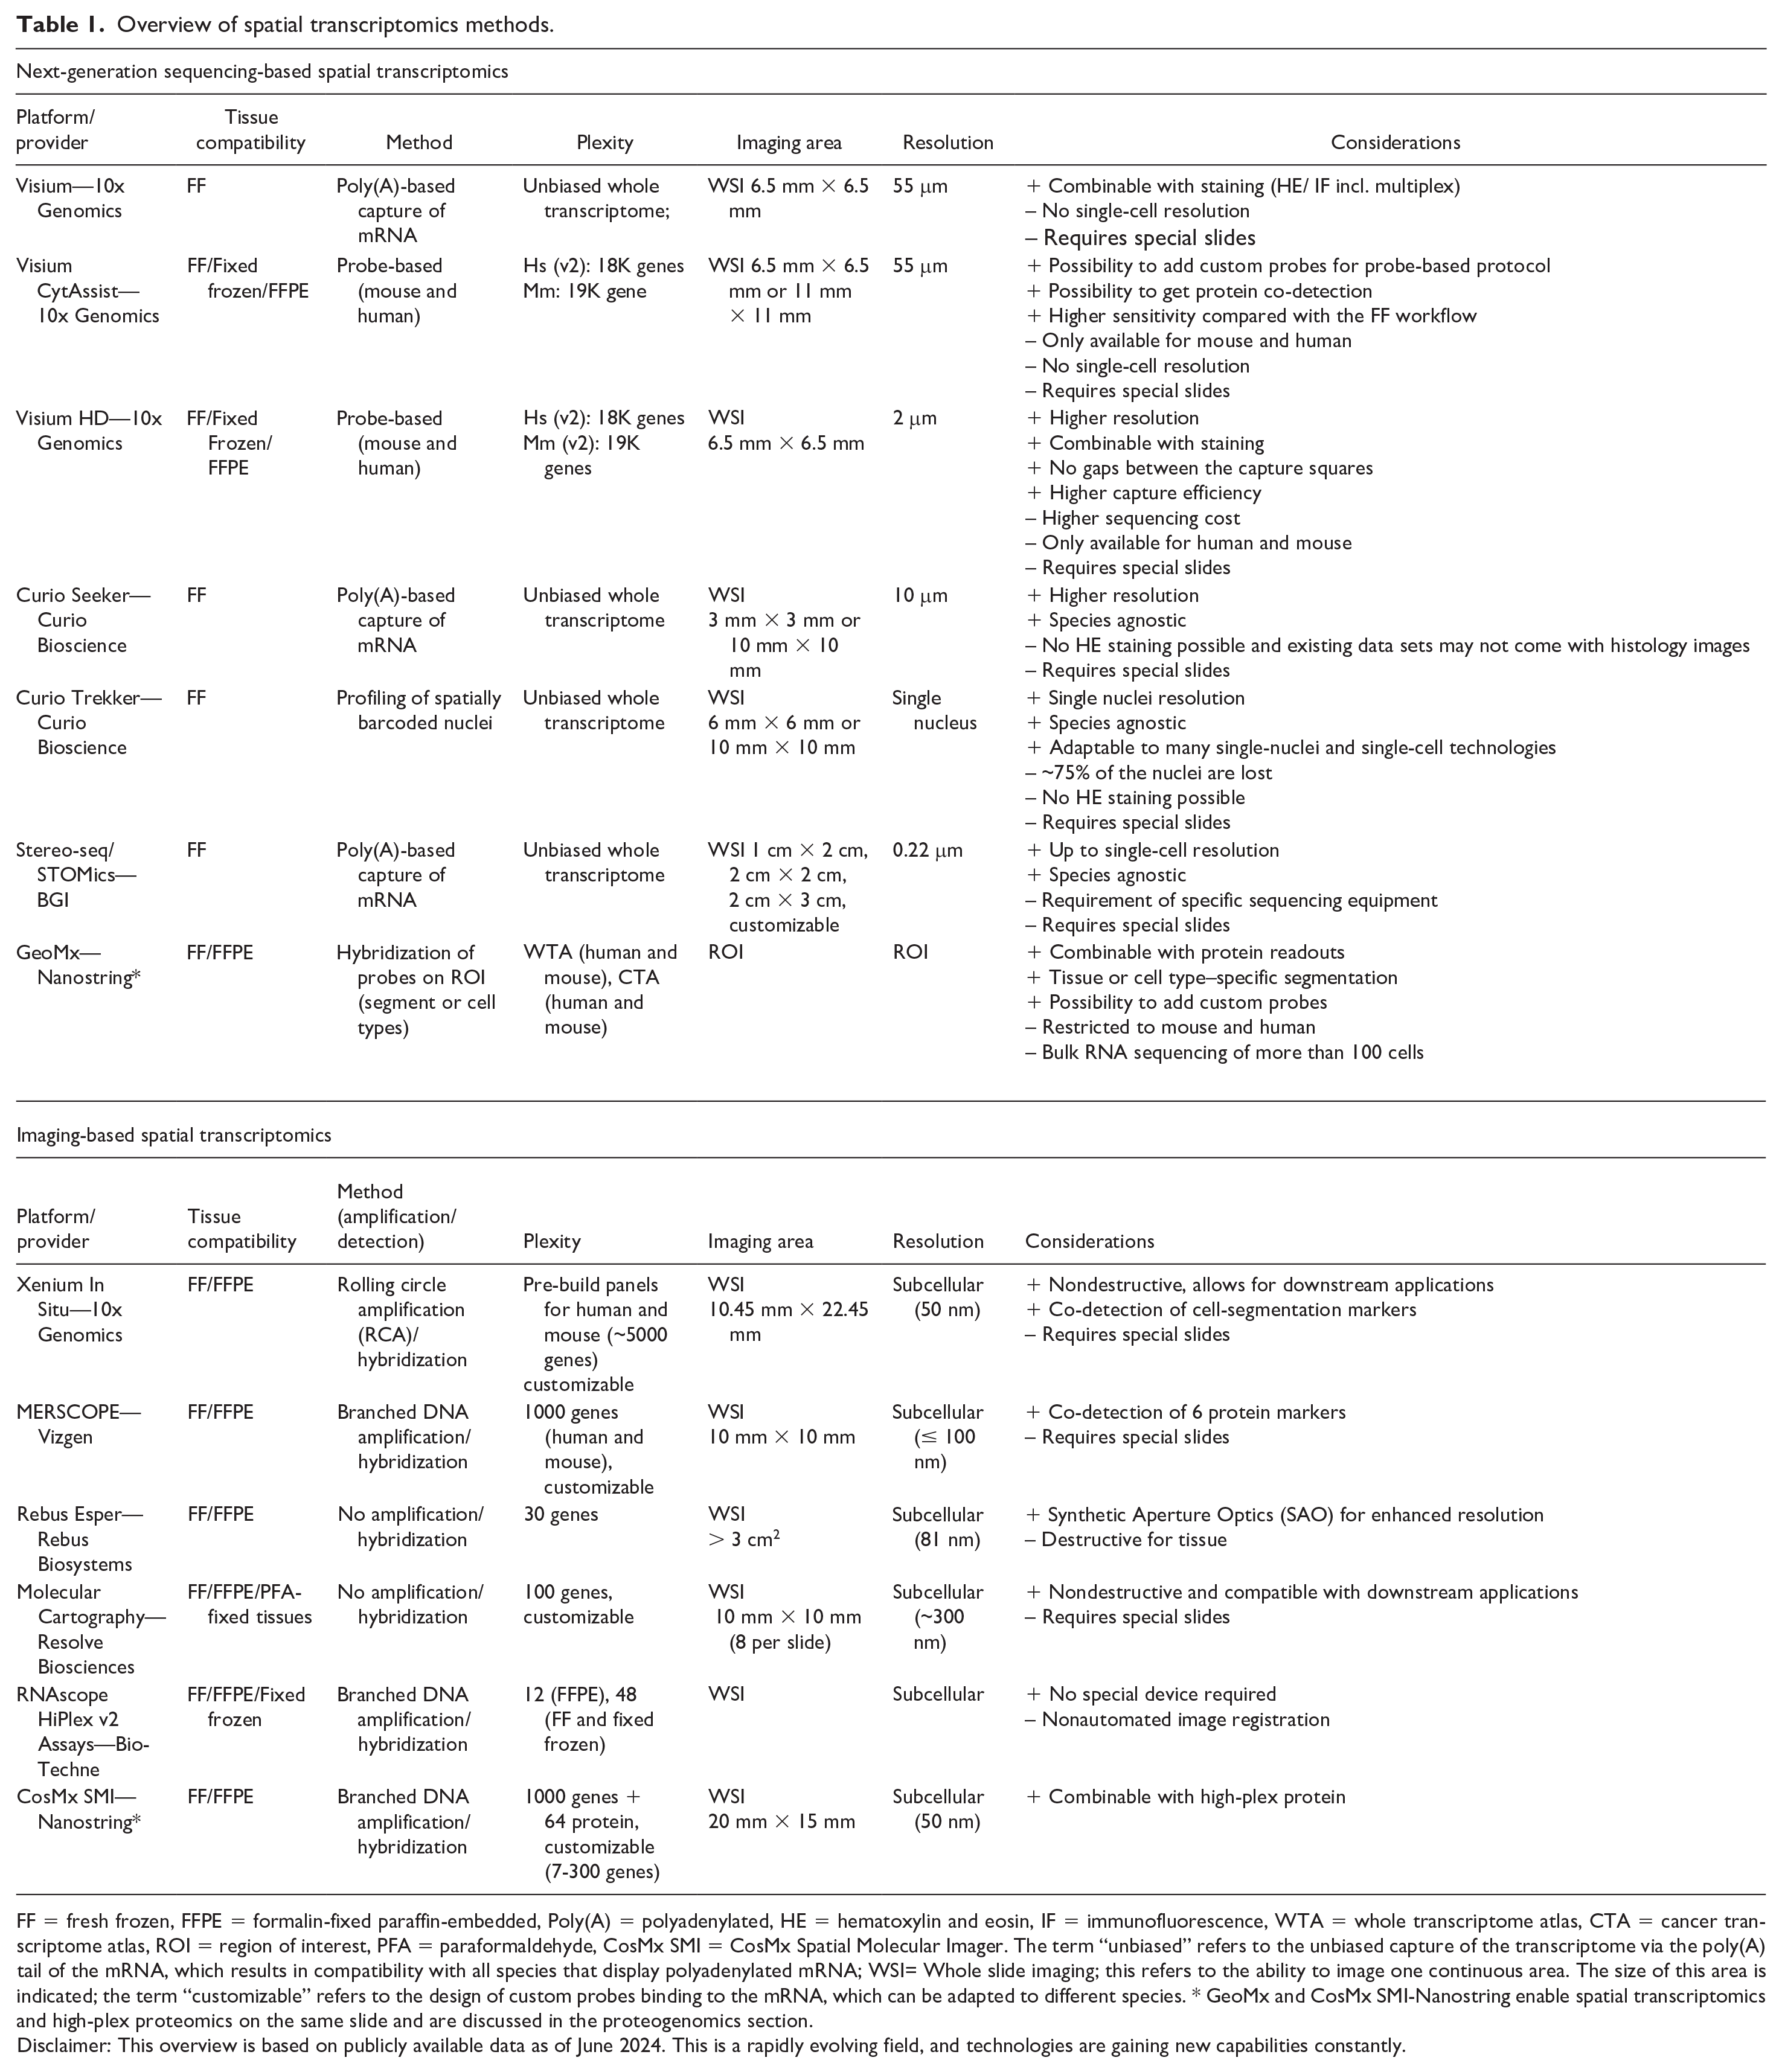
FF = fresh frozen, FFPE = formalin-fixed paraffin-embedded, Poly(A) = polyadenylated, HE = hematoxylin and eosin, IF = immunofluorescence, WTA = whole transcriptome atlas, CTA = cancer transcriptome atlas, ROI = region of interest, PFA = paraformaldehyde, CosMx SMI = CosMx Spatial Molecular Imager. The term “unbiased” refers to the unbiased capture of the transcriptome via the poly(A) tail of the mRNA, which results in compatibility with all species that display polyadenylated mRNA; WSI= Whole slide imaging; this refers to the ability to image one continuous area. The size of this area is indicated; the term “customizable” refers to the design of custom probes binding to the mRNA, which can be adapted to different species. * GeoMx and CosMx SMI-Nanostring enable spatial transcriptomics and high-plex proteomics on the same slide and are discussed in the proteogenomics section.
Disclaimer: This overview is based on publicly available data as of June 2024. This is a rapidly evolving field, and technologies are gaining new capabilities constantly.
Next-Generation Sequencing-Based ST
Commercialized NGS-based ST platforms include the Visium technology offered by 10x Genomics, 6 Slide-seq marketed by Curio Bioscience, 83 Stereo-seq developed by BGI Genomics, 25 and the Nanostring GeoMx, 66 which is described in the spatial proteogenomics section. In most NGS-based methods, RNA transcripts are captured and reverse transcribed in situ using positionally barcoded oligonucleotides to generate RNA-seq libraries. The barcode of each read is used to map the spatial position, while other parts of the sequencing read are mapped to the genome to identify the transcript of origin. This collectively generates a spatially defined gene-expression matrix that, for 10x Genomics technologies and Stereo-Seq, can be overlaid on to a hematoxylin and eosin (HE) image of the analyzed tissue (Figure 2A).
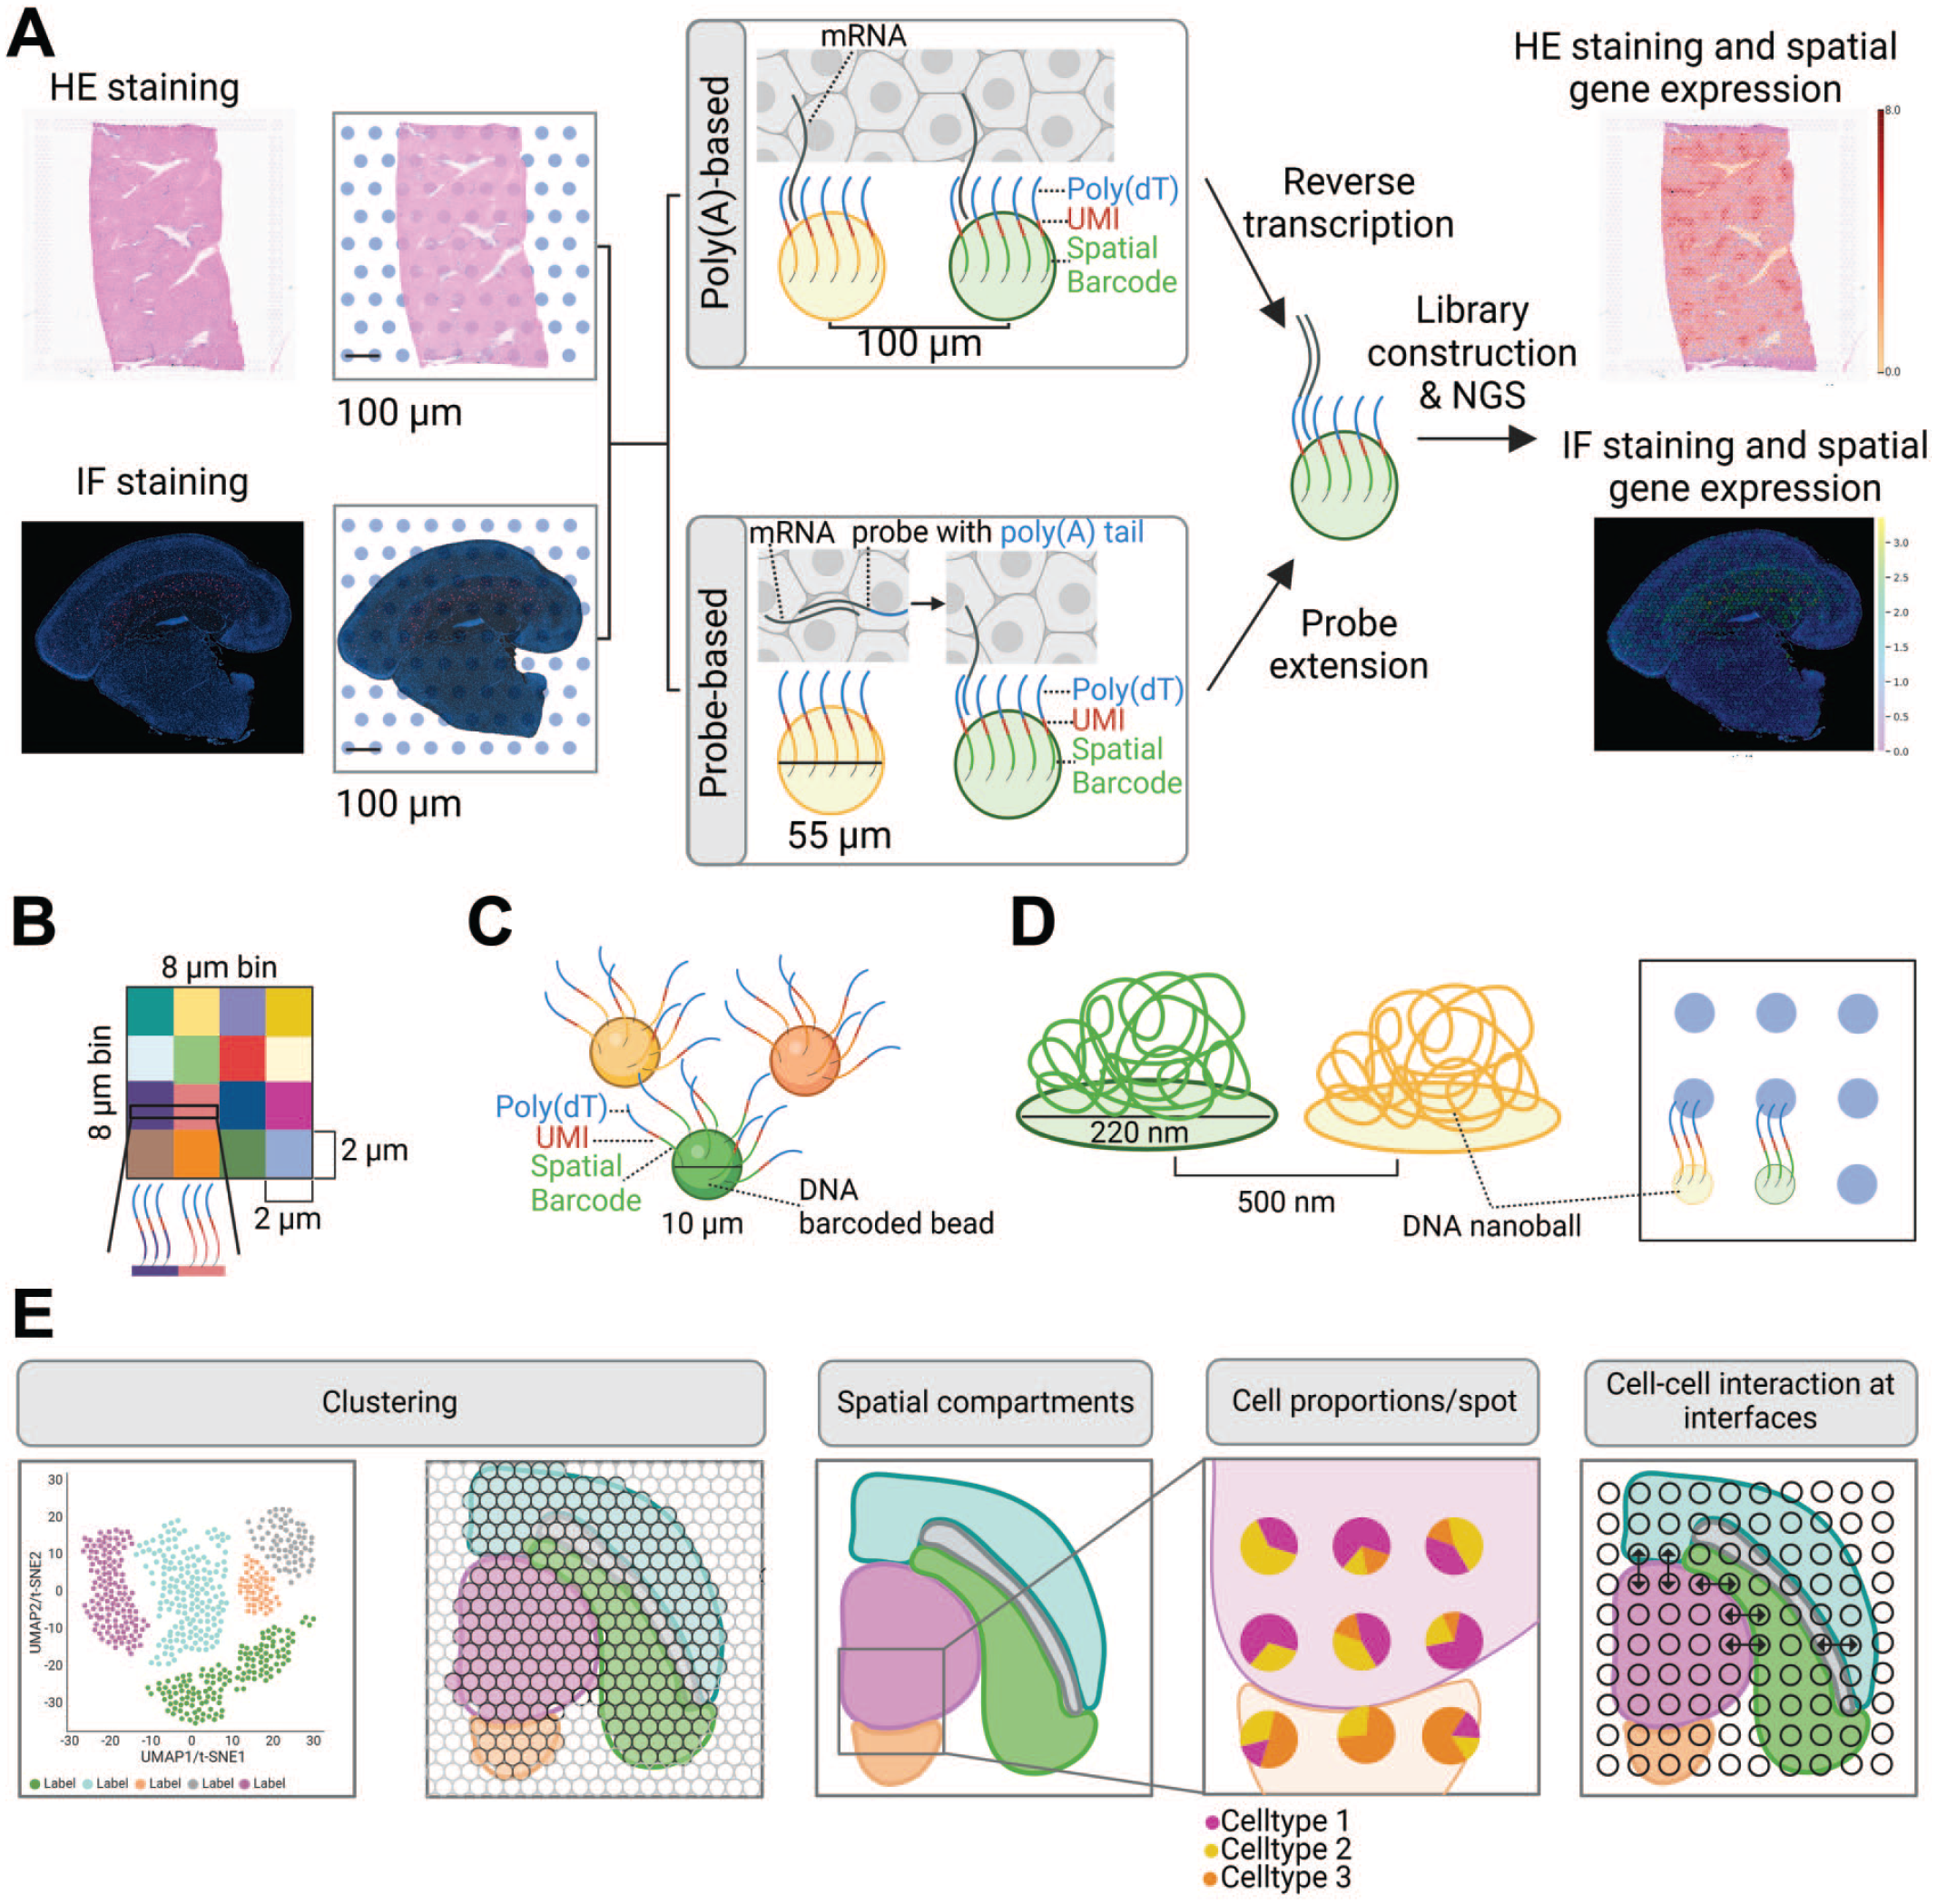
Basic principles of Next-Generation Sequencing (NGS)-based spatial transcriptomics platforms and data analysis. (A) For the 10x Genomics Visium platform, tissue sections are placed on an array of capture probes, arranged in 55 µm diameter spots with a 100 µm center-to-center distance. The tissue sections are then stained using hematoxylin and eosin (HE) or immunofluorescence (IF), imaged and permeabilized. mRNA detection is achieved either directly via the polyadenylated (poly(A)) tail or through RNA binding probes with a poly(A) tail. The poly(A) tail of the mRNA or the probes bind to the array’s poly-thymidylated (poly(dT)) oligonucleotides that contain a spatial barcode for precise mRNA mapping within the tissue. The mRNA is subsequently reverse transcribed, or the probes are extended in situ. The final step involves library construction for NGS, enabling visualization of spatial gene expression in the stained tissue section. The capture probes include a special sequence of nucleotides called a Unique Molecular Identifier (UMI). This UMI helps identify and remove duplicate sequences, ensuring accurate quantification of mRNA molecules after cDNA amplification (B) Visium HD utilizes an oligonucleotide covered capture area organized in adjacent 2 µm × 2 µm arrays. 10x Genomics recommends binning 16 of these squares (8 µm bin) for initial analysis. (C) For Slide-seq similar capture oligonucleotides are conjugated to beads with a diameter of 10 µm. (D) In Stereo-seq the capture oligonucleotides are conjugated to DNA Nanoballs (DNB), produced via rolling circle amplification. These DNBs have a diameter of 220 nm and a center-to-center distance of 500 nm. (E) Basics of NGS-based spatial transcriptomic (ST) data analysis. Including initial data preprocessing, where reads are spatially assigned, followed by quality control filtering and normalization and finally visualized using Uniform Manifold Approximation and Projection (UMAP) or t-distributed stochastic neighbor embedding (t-SNE) plots. The clusters are then mapped to the tissue image. Spatial compartments are determined based on gene expression data, tissue localization, or both. As the arrays may cover multiple cells, deconvolution can be performed to estimate the cell type proportions per spot. This is achieved by integrating single-cell RNA sequencing data. Computational methods enable the assessment of cell-cell communication events at the interfaces of the spatial compartments. Note that schematics are not to scale. All example images were provided by Roche Pharmaceutical Research and Early Development (pRED). Figure created with BioRender.com.
Among the NGS-based methods, the 10x Genomics Visium platform is currently the most commonly used technology. 89 The Visium workflow (Figure 2A) enables gene expression profiling at thousands of individual spatially barcoded spots distributed over the tissue and provides protocols for the processing of fresh frozen (FF), formalin-fixed paraffin-embedded (FFPE) or fixed frozen tissue sections. The mRNA is either detected by their polyadenylated (poly(A)) tail (poly(A)-based protocol) or via probes that bind to the mRNA and contain a poly(A)-tail (probe-based protocol). The poly(A)-based method is species-agnostic, enabling the capture of mRNA transcripts through the conserved poly(A) tail structure characteristic of eukaryotic mature mRNA. This protocol is restricted to FF tissue. The Visium slides for the poly(A)-based workflow contain 4 capture areas of 6.5 × 6.5 mm (Figure 2A). The species-specific probe-based protocol is suitable for FF, FFPE and fixed frozen tissue and detects more genes per spot as compared with the poly(A)-based protocol.28,36 In addition, the probe-based protocol features an abundance adjusted probe design, increasing the assay’s dynamic range. However, it is limited to the 18k genes covered by the probes and is currently restricted to mouse and human samples. 4 According to the vendor, the human or mouse probe sets have not been tested with samples from other species such as nonhuman primates or rat, respectively and there are no published reports elucidating specificity and sensitivity of cross-species reactivity. The probe-based protocols provide the option to add custom probes for example to detect humanized genes in chimeric mouse models or viral sequences. For the probe-based protocol, each slide contains 2 capture areas measuring 6.5 mm × 6.5 mm or 11 mm × 11 mm. The Visium technology is available in 2 resolutions. The standard assay consists of 55 µm diameter spots with a center-to-center distance of 100 µm, providing an average resolution of 1 to 10 cells per spot 6 or even up to 40 cells per spot in highly cellular tissues (Figure 2A). The high definition (HD) format was launched more recently and contains oligonucleotides arranged in 2 µm × 2 µm squares with no space in between the squares of the 6.5 mm × 6.5 mm capture area (Figure 2B). Notably, the higher density of RNA capture compared with standard Visium assays leads to a substantial increase in sequencing costs. 10x Genomics also provides a benchtop instrument, called Visium CytAssist, that enables: (1) prescreening of tissue sections with standard histological examination to select high-quality and the most relevant sections, (2) the use of precut tissues that are achived on glass slides from tissue banks, (3) compatibility with the Visium HD protocol, (4) possibility to use charged glass slides, thus preventing tissue detachment, (5) simultaneous proteome profiling of up to 35 human protein markers (see proteogenomics section). Visium CytAssist is only compatible with the probe-based protocols. The combination of ST with immunofluorescence (IF) can support the detection of rare cell types such as dendritic cells in the tumor stroma or allows delineation of cellular processes that are mostly regulated at protein level, eg, during the activation of immune cells.
Early 2023 Curio Bioscience launched the Curio Seeker kit, as the first commercially available high-resolution sequencing-based ST solution. 31 The technology is an improved version of the previously published Slide-seqV2. 92 The Curio Seeker uses 10 μm diameter DNA-barcoded beads deposited on a flat surface, providing a resolution of approximately 1-2 cells per bead (Figure 2C). The beads have an undefined structure and form so-called DNA array “pucks” on the surface. Currently the kit is available either with 3 mm × 3 mm or 10 mm × 10 mm tiles. It is important to note that the higher density of capture oligos per area results in a significant increase in the sequencing costs. Curio Seeker is only compatible with FF material and does not allow for any kind of staining (HE or IF) on the sections used in the ST experiment. Instead, it is recommended to use consecutive sections to account for tissue morphology.
Early 2024, the Curio Trekker became available, which is based on the Slide-tag technology. 84 Compared with the Curio Seeker, Curio Trekker enables isolation of single nuclei, thus providing a single-cell readout. The nuclei are tagged with spatial barcodes, which allow the mapping of their spatial localization within the tissue. Curio Trekker shares similar limitations with Seeker, including its restriction to FF tissue and the requirement that stained tissue images can only be obtained from consecutive tissue sections. 32
Stereo-seq/STOmics has been developed by BGI. FF tissue sections are placed on chips, which contain randomly barcoded DNA nanoballs (DNB) ligated with poly-thymidylated (poly(dT)) oligonucleotides to allow for in situ capturing of poly(A) tails of mRNA. The resulting array consists of 220 nm diameter DNBs with a center-to-center distance of 500 nm providing a subcellular resolution (Figure 2D).17,25,94 The DNB arrays are available in multiple sizes varying from 1 cm × 2 cm and 2 cm × 2 cm to 2 cm × 3 cm that are even customizable. Stereo-seq also allows IF and HE staining. 94 The high-resolution transcriptomics readout combined with same section staining (eg, IF nuclei staining), enables one to generate gene counts per cell matrix via cell segmentation. It is important to note that Stereo-seq is restricted to the sequencers from BGI, whereas all the other methods are compatible with the widely used Illumina sequencing technology.
Basics of Next-Generation Sequencing-based ST data analysis
The basic analysis methods for NGS-based ST data are largely adapted from single-cell RNA sequencing (scRNA-seq) with modifications that enable integration of spatial and histomorphological data.39,60 Major steps in the data processing after sequencing comprise (1) data quality control, (2) alignment and mapping to the reference genome, (3) post alignment processing to sort and index the aligned reads and to remove duplicates, and (4) quantification of genes per spatial location and downstream analysis. The downstream analysis usually involves initially grouping the spots using gene expression-based clustering after normalization. The assumption is that spots with similar expression patterns define distinct anatomical regions of interest. Notably, additional layers of information, such as the spatial coordinates of the spots or their morphological features extracted from HE images, can be incorporated into the clustering process. 27 The spots/regions and clusters can subsequently be visualized in a low dimensional space (2 or 3-dimensions) with dimensionality reduction algorithms such as Uniform Manifold Approximation and Projection (UMAP) or t-distributed stochastic neighbor embedding (t-SNE). 60 Each cluster can be annotated with biologically meaningful labels such as endothelial cells or fibroblast clusters, based on gene expression signatures and their spatial mapping to the HE or other stained slides. These labels can refer to the composition of the cluster (eg, endothelial cells or fibroblasts) or the anatomical regions they define (eg, tumor or stroma). Individual clusters can further be defined based on their specific transcriptomic signatures, such as the expression of specific genes, pathway or transcription factor activities, differential gene expression (DGE) compared with other clusters, and cluster-specific histomorphological features and tissue distribution. Another important method for the assessment of ST data is deconvolution. Nearly all sequencing-based technologies register expression measurements from tissue locations that encompass a few to several dozen individual cells, potentially representing distinct cell types. Deconvolution is used to determine the cell type proportions within each tissue location by using reference expression profiles specific to each cell type. These reference profiles are typically derived from scRNA- or single nuclei RNA sequencing data obtained from the same sample or tissue/organ type. Various methods for clustering and deconvolution have been described and systematically benchmarked in several publications.27,59,85,97 Pathologists can guide data analysis teams in selecting an appropriate approach for a specific tissue and data set. They help determine the expected number of clusters, assess cluster mapping on the tissue, support cluster annotation, and evaluate the quality of deconvolution. Pathologists’ annotations serve as the gold standard for these assessments. Certain vendors offer data analysis workflows customized for specific platforms. In addition, there is an increasing number of commercial analysis software solutions available that enable basic data assessment with little to no coding skills required. Moreover, publicly available toolkits such as Seurat and Squidpy offer detailed tutorials, allowing users to complete the primary workflow steps within a unified environment.45,75 Summarized, the analysis of ST data is broadly comparable to scRNA-seq analysis whilst providing opportunities to investigate tissue cell composition, cellular neighborhoods as well as molecular interactions associated with cell-cell signaling (Figure 2E). 96
Imaging-Based ST
The broad concept of imaging-based ST (iST) implies the detection of RNA molecules with specifically tagged fluorescent probes by complementary hybridization. These probes are then imaged using fluorescence microscopy. iST platforms primarily differ in their detection and signal amplification modalities, which encompass the methods used for labeling RNA molecules and the multiplexing strategies employed to detect multiple RNA transcripts across sequential imaging rounds. 96
In situ sequencing-based ST
The 10x Genomics Xenium represents a commercially available in situ sequencing (ISS) platform.1,7 ISS is a technology enabling the analysis of hundreds of genes with subcellular resolution. In ISS platforms, the mRNA is sequenced within the tissue section and sequence products are subsequently detected with high-resolution imaging techniques. 54 Most ISS technologies represent targeted approaches that are based on a panel of more than 100 specifically designed probes. The probe panel can be adapted based on the species and the experimental question to be addressed. To generate the signal, standard microscopy slides are pretreated to generate cDNA in situ, and the custom designed padlock probe library is added. Padlock probes that specifically interact with the targeted transcripts are amplified using the rolling circle amplification (RCA) reaction. This specific amplification generates signals with a high signal-to-noise ratio, allowing detection even at low magnification and exposure time. 106 For 10x Genomics Xenium multiple padlock probes are designed for each target in the gene panel. The probes directly hybridize with the mRNA, where assay specificity is ensured via the highly specific ligation enzyme. The resulting circular DNA serves as a substrate for the RCA. The signals are detected via fluorescently labeled bridge probe libraries that bind the RCA product in sequential rounds of hybridization, imaging, and removal (Figure 3A, top panel). An optical signature specific to each gene is generated, enabling identification of the target gene. Finally, a spatial map of the transcripts is built across the entire tissue section. The Xenium technology (Figure 3B) enables the assessment of FF and FFPE tissue, and prevalidated organ specific panels are currently available for human and mouse tissue, targeting ~350 genes customizable with 100 add-on target genes. Furthermore, 5000 gene pan-tissue panels are available for more extensive exploratory studies. The Xenium workflow requires tissue sections on special slides and is not compatible with precut samples. Due to the nondestructive nature of the Xenium workflow, HE staining, immunofluorescence, and even whole transcriptome probe-based Visium CytAssist protocol can be performed on the same section post-processing, allowing the spatial registration of protein, histology, and RNA data into a single image.1,7,50
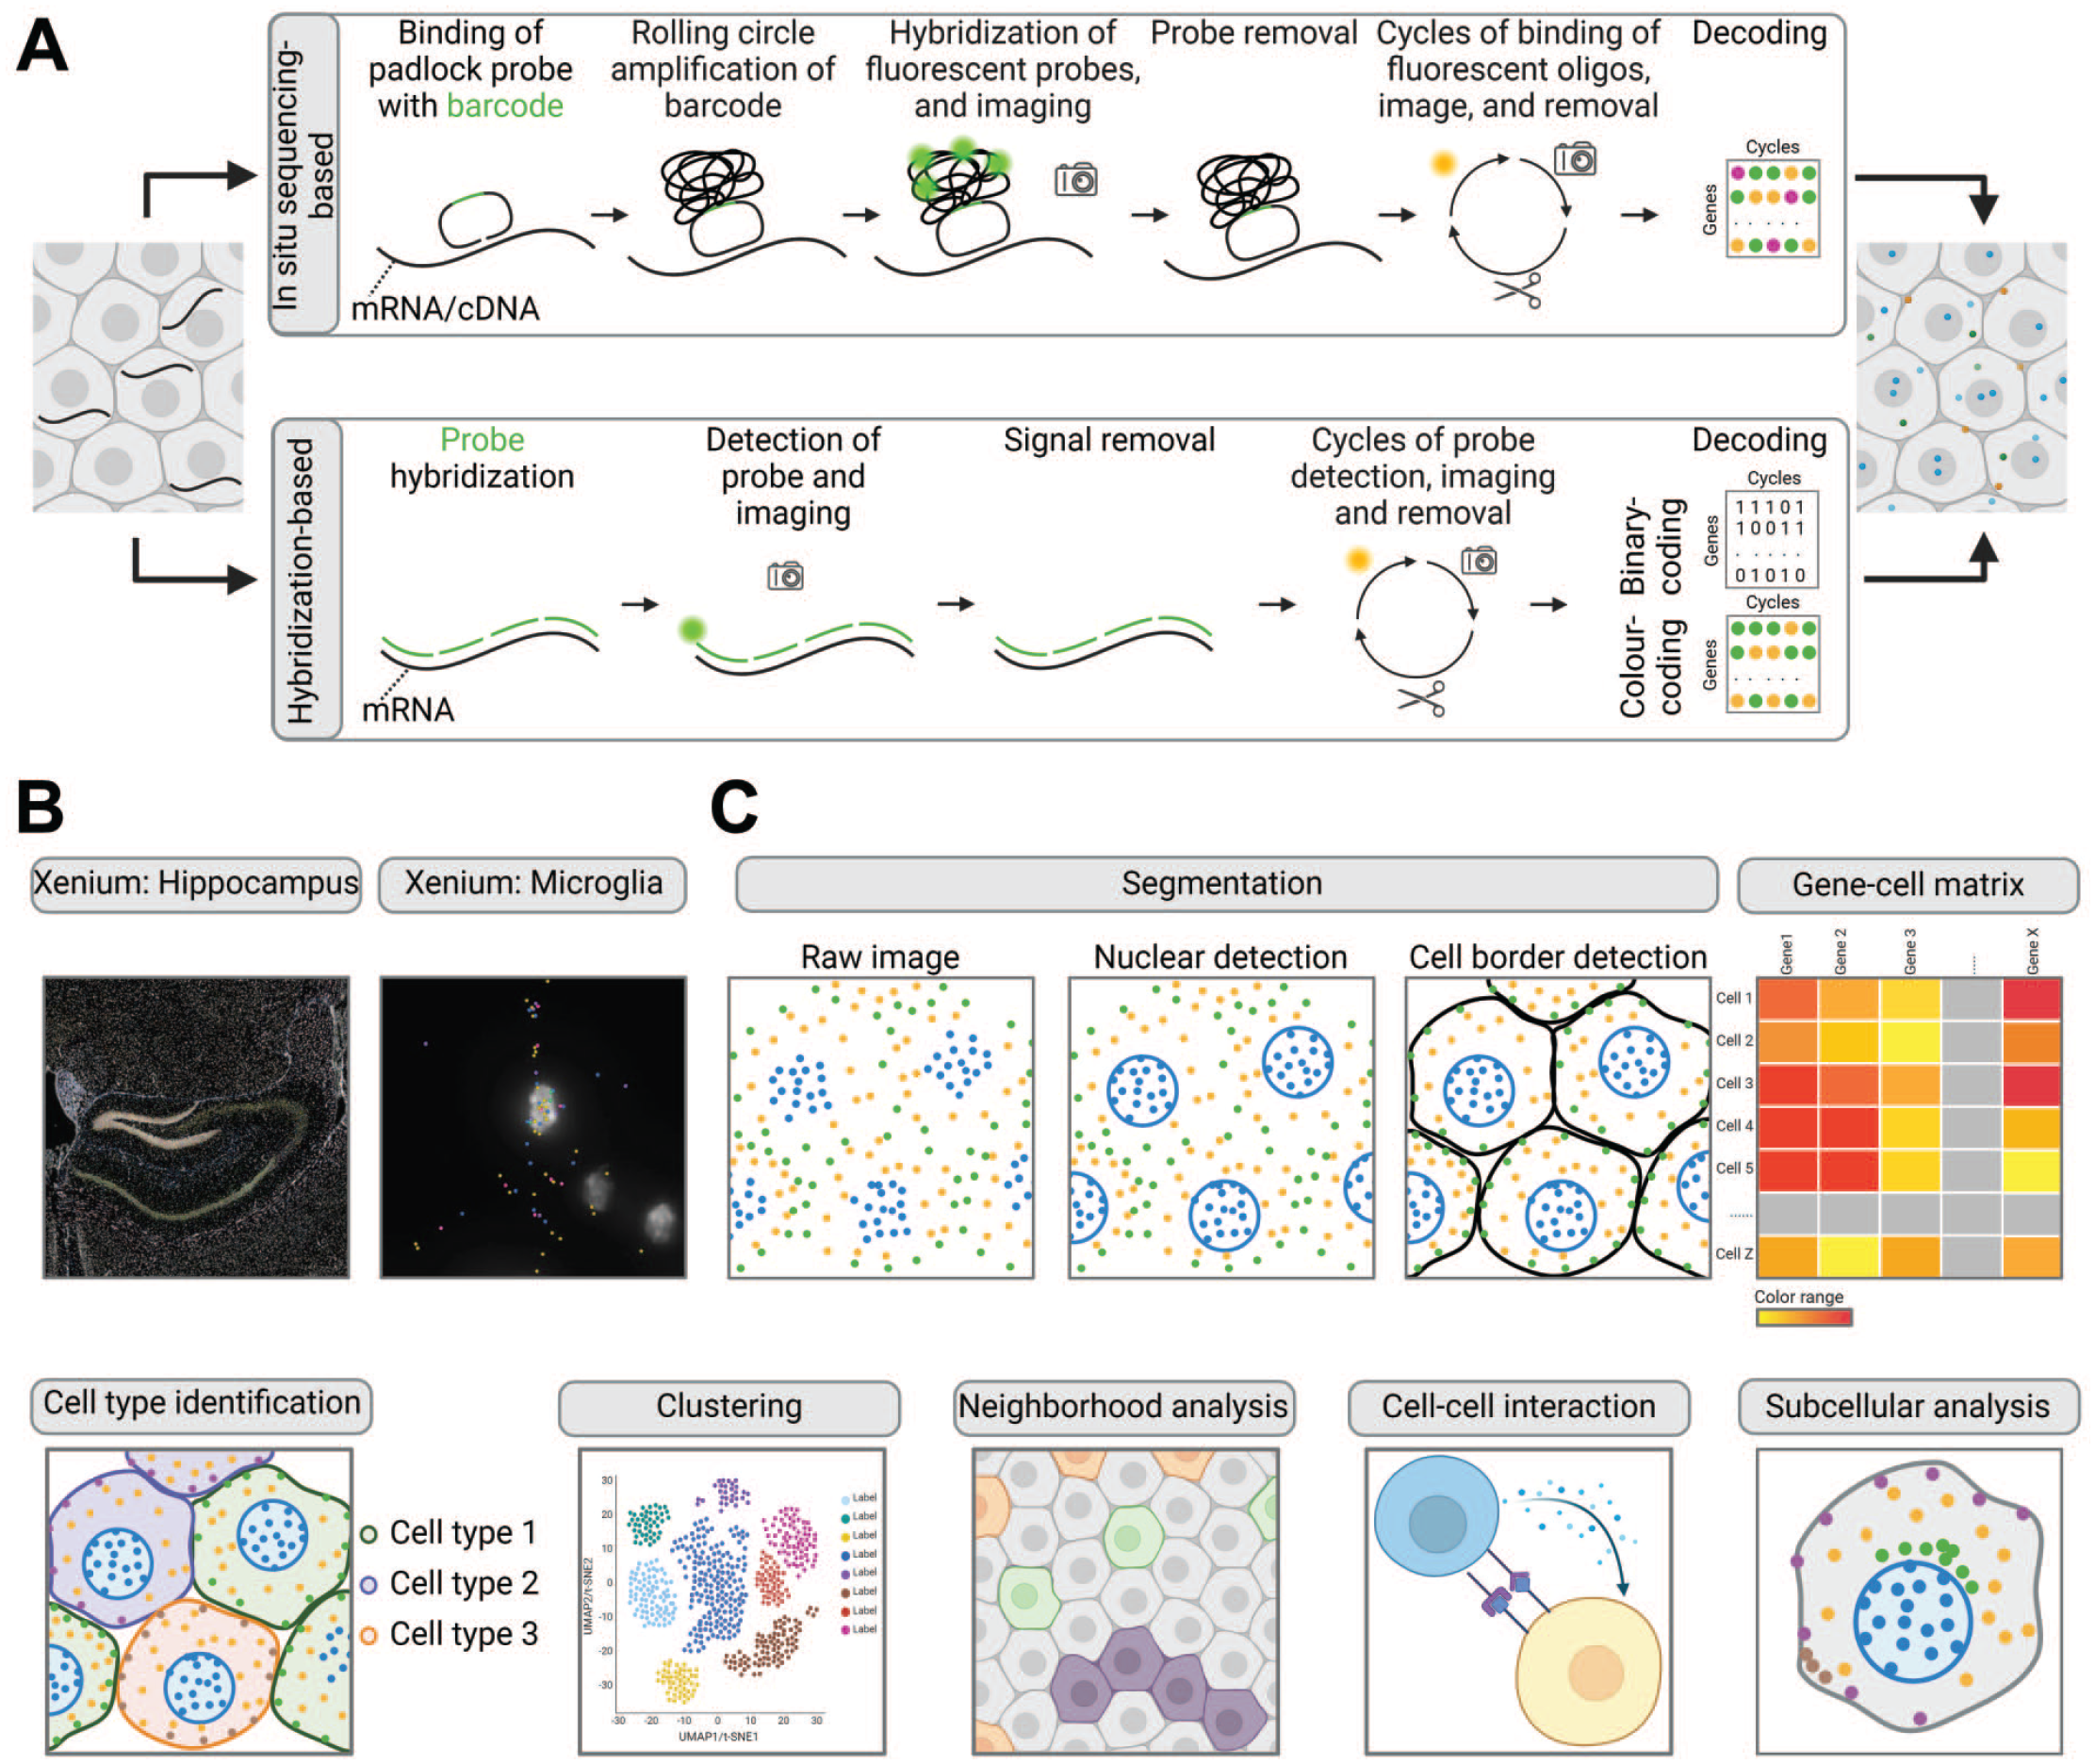
Fundamentals of imaging-based spatial transcriptomics. (A) Imaging-based spatial transcriptomics (iST) detects molecules either through in situ sequencing (top panel) or hybridization (bottom panel). In situ sequencing is used by the Xenium method from 10x Genomics. Targets are bound by a library of padlock probes containing a probe-specific barcode, which is amplified via rolling circle amplification (RCA). Fluorescently labeled oligonucleotides hybridize to the RCA-amplified barcode for detection. This is followed by imaging and removal of fluorescent probes as an iterative process for n-number of cycles. The final image is generated by aligning images from multiple rounds of imaging, with RNA targets identified by their specific optical signature. Hybridization-based methods capture mRNA targets with a set of probes. These probes are either directly detected with fluorophores, as in Molecular Cartography, or detected via fluorescently labeled oligonucleotides, as in MERFISH. After imaging, the label is removed, and this process is repeated for n-number of cycles. The final image decodes the transcripts using either the binary code from MERFISH, based on the presence (1) or absence (0) of a signal, or color-coding from Molecular Cartography, based on two fluorescent dyes. (B) iST signal pattern exemplified by Xenium. The iST signal is composed of colored dots, delineating organ compartments such as the mouse hippocampus. The higher magnification reveals the expression of Arhgap25 (turquoise), Cd53 (blue), Cd68 (purple), Siglech (yellow), Spi1 (pink) in microglia. Images taken from publicly available data set. 3 (C) The basics of iST data analysis. After decoding image segmentation delineates the nuclei. Cell borders are subsequently defined either through nuclear expansion or detection of the stained cell membrane. Following segmentation, a gene-cell matrix is generated, enabling cell identification. Similar to Next-Generation Sequencing (NGS)-based ST, cells are clustered for further analysis. The spatial relationships between cells can be examined through neighborhood analysis, allowing for the study of local cellular environments and specific cell-cell interactions. Some platforms provide options for subcellular analysis of targets. Figure created with BioRender.com.
Fluorescent in situ hybridization-based ST
Commercialized platforms that have been used in several publications include multiplexed error robust fluorescent in situ hybridization (MERFISH) as for MERSCOPE from Vizgen, Resolve Biosciences’ Molecular Cartography, the Rebus Esper, RNAscope HiPex v2 Assays, and the Nanostring CosMx SMI which is described in the spatial proteogenomics section. Fluorescent in situ hybridization (FISH) methods rely on fluorescence to identify specific RNA molecules with high-resolution optical imaging. In FISH-based ST, RNA molecules hybridize with probes, which are detected with fluorescent dyes and subsequently imaged to identify and localize RNA molecules. 103 Similar to ISS, a particular RNA transcript is detected by a sequence of colors or signal presence/absence in successive rounds of imaging. Based on the signals per cell, a cell-by-count matrix spatially indexed by the centroid position of each cell is generated. 57 The commercialized platforms differ in their approaches for signal generation: Molecular Cartography uses several tens of probes per gene, that are visualized through a proprietary colorizing and de-colorizing chemistry during several imaging rounds, generating an individual color pattern per gene. 82 MERFISH uses sequential hybridization and a sequence of sites for binary-encoded secondary probes: for each round of hybridization, the signal is recorded as fluorophore-labeled or unlabeled (Figure 3A, bottom panel). 26 The Rebus Esper is based on Enhanced ELectric (EEL) FISH and implies an electrophoretic transfer of the RNA onto a glass surface to enable the signal localization in one z-axis enabling background reduction.20,81 The described platforms are available for FF and FFPE material and enable the simultaneous assessment of 30 (Rebus Esper) to several hundred transcripts in a custom designed, species-agnostic manner or even 1000 plex gene panel for MERSCOPE. While Molecular Cartography is nondestructive and allows downstream applications such as immunohistochemistry, with the Rebus Esper technology the tissue is digested. For MERFISH, a method for three-dimensional (3D) single-cell transcriptome imaging of 200 µm thick tissue specimens was published. 38 It should be considered that MERSCOPE and Molecular Cartography technologies are based on slides provided by the respective companies, limiting the use of these platforms for already cut samples such as those obtained from a human biobank. The RNAscope HiPlex v2 assay commercialized by ACD/Bio-Techne is an advanced ISH tool to detect up to 12 targets in FFPE samples and up to 48 targets in fresh and fixed frozen sample types. In general, the probe designs are similar to those used in RNAscope assays. Probes for 12 targets are hybridized at once to the pretreated slide sections. The signals in the probes are amplified, and the first 4 probes are detected using fluorophore conjugated label probes. The samples are imaged using fluorescent microscopy to capture the first 4 targets. Then, fluorophores are cleaved, and labeled probe hybridization plus imaging can be repeated 3-4 times to detect the next set of targets. Images can be registered and aligned with autofluorescence subtraction methods to detect multiple targets at subcellular resolution. 8 HiPlex assays have been used to validate ST technologies and understand subcellular distribution of targets in various cell types. It should be taken into account that the length of a target transcript is approximately 300-500 base pairs for all platforms according to the vendor’s information. Consequently, these technologies cannot detect targets smaller than 50 base pairs, such as therapeutic oligonucleotides like antisense oligonucleotides or siRNAs.
Basics of ISS and FISH-based ST data analysis
The analysis of ISS- and FISH-based ST shares similarities with NGS-based as well as spatial proteomics data assessment. For all platforms described above, signals are detected and decoded to identify the transcripts. For downstream analysis, different tools and packages are provided by the platform associated software or custom computational approaches are applied. 35 The major steps in ISS and FISH-based ST data assessment comprise (1) image preprocessing, (2) spot detection, (3) decoding of RNA probes, (4) spatial mapping and cell segmentation, and (5) downstream analysis based on gene expression and cell types. 108 Image preprocessing comprises noise and background reduction to reduce background and autofluorescence and to enhance signal quality as well as image registration to align the images and channels from different cycles. Spot detection and decoding of RNA probes identify and localize the fluorescent spots in each image and assign each detected spot to a specific RNA probe based on the fluorescent signal in each channel. For spatial mapping, each detected RNA molecule is mapped back to its spatial coordinates within the tissue section and the data can be aligned with cell segmentation data. These signals can be assigned to individual cells using cell segmentation methods, which identify and delineate cells within ST data. Segmentation-free methods, on the other hand, analyze data on a per-pixel or regions of interest (ROIs) basis without explicitly defining cell boundaries. 11
For segmentation-based approaches, cell boundaries are defined around nuclei (Figure 3C), detected via DAPI staining and extended using methods like Watershed. Tools like QuPath 15 and ImageJ 86 support this approach, while platforms like Xenium Explorer 1 , HALO 48 , and Visiopharm 101 utilize neural networks. Alternatively, transcriptional composition can optimize cell boundary placement. 78 MERSCOPE and Xenium offer cell boundary staining mixes for precise definition in multiple tissues, which can be integrated with other features. Custom computational segmentation approaches comprise CellProfiler, 93 SPARCLE, 79 PIPEFISH 29 and others. Post-segmentation, a gene-cell matrix is generated, assigning transcripts to cells based on spatial coordinates. Cells can then be annotated to different types using specific markers considered during panel design. Segmentation-free methods focus on identifying patterns directly from the spatially resolved data. 78 Common downstream analysis steps for both approaches include normalization, dimensionality reduction, clustering, differential expression analysis, and spatial pattern identification. Segmentation methods enable precise single-cell level analyses, including cell type identification, cell-cell interaction studies, cell type proportions variation and subcellular localization of transcripts (Figure 3C). However, they can be complex and error-prone. Segmentation-free methods analyze broader spatial patterns at a coarser resolution, offering robustness and simplicity but sacrificing some precision.76,78 The aforementioned toolkits, Squidpy and Seurat, support the main workflow steps for both approaches.45,75 Ultimately, the choice between these methods depends on the research question and the quality of the ST data.
Imaging-Based Spatial Proteomics Platforms
Spatial proteomics is a group of techniques for the detection of proteins within tissue. The commercialized technologies for spatial proteomics described below use primary antibodies to target the proteins of interest within the tissues in a high-plex assay. Platforms are classified in 2 subcategories based on the strategies to visualize and image these primary antibodies: (1) with fluorescent dyes using fluorescence imaging or; (2) using metal-tagged antibodies that are imaged with a mass spectrometer. 11 Key features of the discussed spatial proteomics platforms are summarized in Table 2.
Overview of imaging-based spatial proteomics methods.

FF = fresh frozen, FFPE = formalin-fixed paraffin-embedded, TOF MS = time-of-flight mass spectrometer, ABs = antibodies, HDR = high dynamic range, ROI = region of interest, WSI= whole slide imaging; this refers to the ability to image one continuous area, and the size of this area is indicated; custom antibodies may be used for many systems listed here, but this may require conjugation to the fluorescent labels used in the method.
Disclaimer: This overview is based on publicly available data as of June 2024. This is a rapidly evolving field, and technologies are gaining new capabilities constantly.
Fluorescent-Imaging-Based Spatial Proteomics
The spectral overlap of the fluorescent dyes represents a caveat for the simultaneous visualization of multiple targets in traditional immunofluorescence (IF). This challenge has been overcome by using iterative cycles of fluorophore delivery, imaging, and stripping. Commonly used commercialized technologies comprise the Akoya Bioscience PhenoCycler, that is based on the CODEX technology, the Miltenyi Biotec MACSima, COMET developed by Lunaphore, the CellScape from Canopy Biosciences, the Orion from RareCyte, and the Leica Cell DIVE. All technologies integrate staining and imaging devices, are based on the principle of iterative imaging cycles, are validated for FF-OCT and FFPE tissue, entail the possibility to build up custom designed panels, and enable imaging of 40 to hundreds of markers. The platforms differ for example on how the fluorescent label is tagged to the primary antibody. For the Akoya PhenoCycler, oligonucleotide tagged primary antibodies are applied simultaneously and are detected with fluorescently labeled complementary oligonucleotides (Figure 4A).10,18 The Miltenyi Biotec MACSima, 67 Leica Cell DIVE 58 and the CellScape 22 apply 3, 4 or 5 fluorochrome conjugated antibodies per cycle that are imaged and erased by chemical cleavage of the fluorophore or photobleaching (Figure 4B). For the PhenoCycler and MACSima, the integration of customer specific antibodies in existing panels or the setup of novel panels, such as those for rats and nonhuman primates, is achieved using conjugation kits for labeling antibodies. The Cell DIVE offers prevalidated dye-conjugated antibodies but also provides options for customization. The COMET platform is built on commercially available, primary antibodies that are detected with fluorescently labeled secondary antibodies in iterative rounds of staining and imaging (Figure 4C). 63 In contrast to other IF-based spatial proteomics methods, the Orion from RareCyte performs the staining and scanning of ~15 markers in a single cycle using ArgoFluor labeled primary antibodies (Figure 4D). 80 Of particular note, panels for applications in toxicology species such as rats, dogs, and nonhuman primates are not readily available, and panel setup requires significant time commitment and resources.
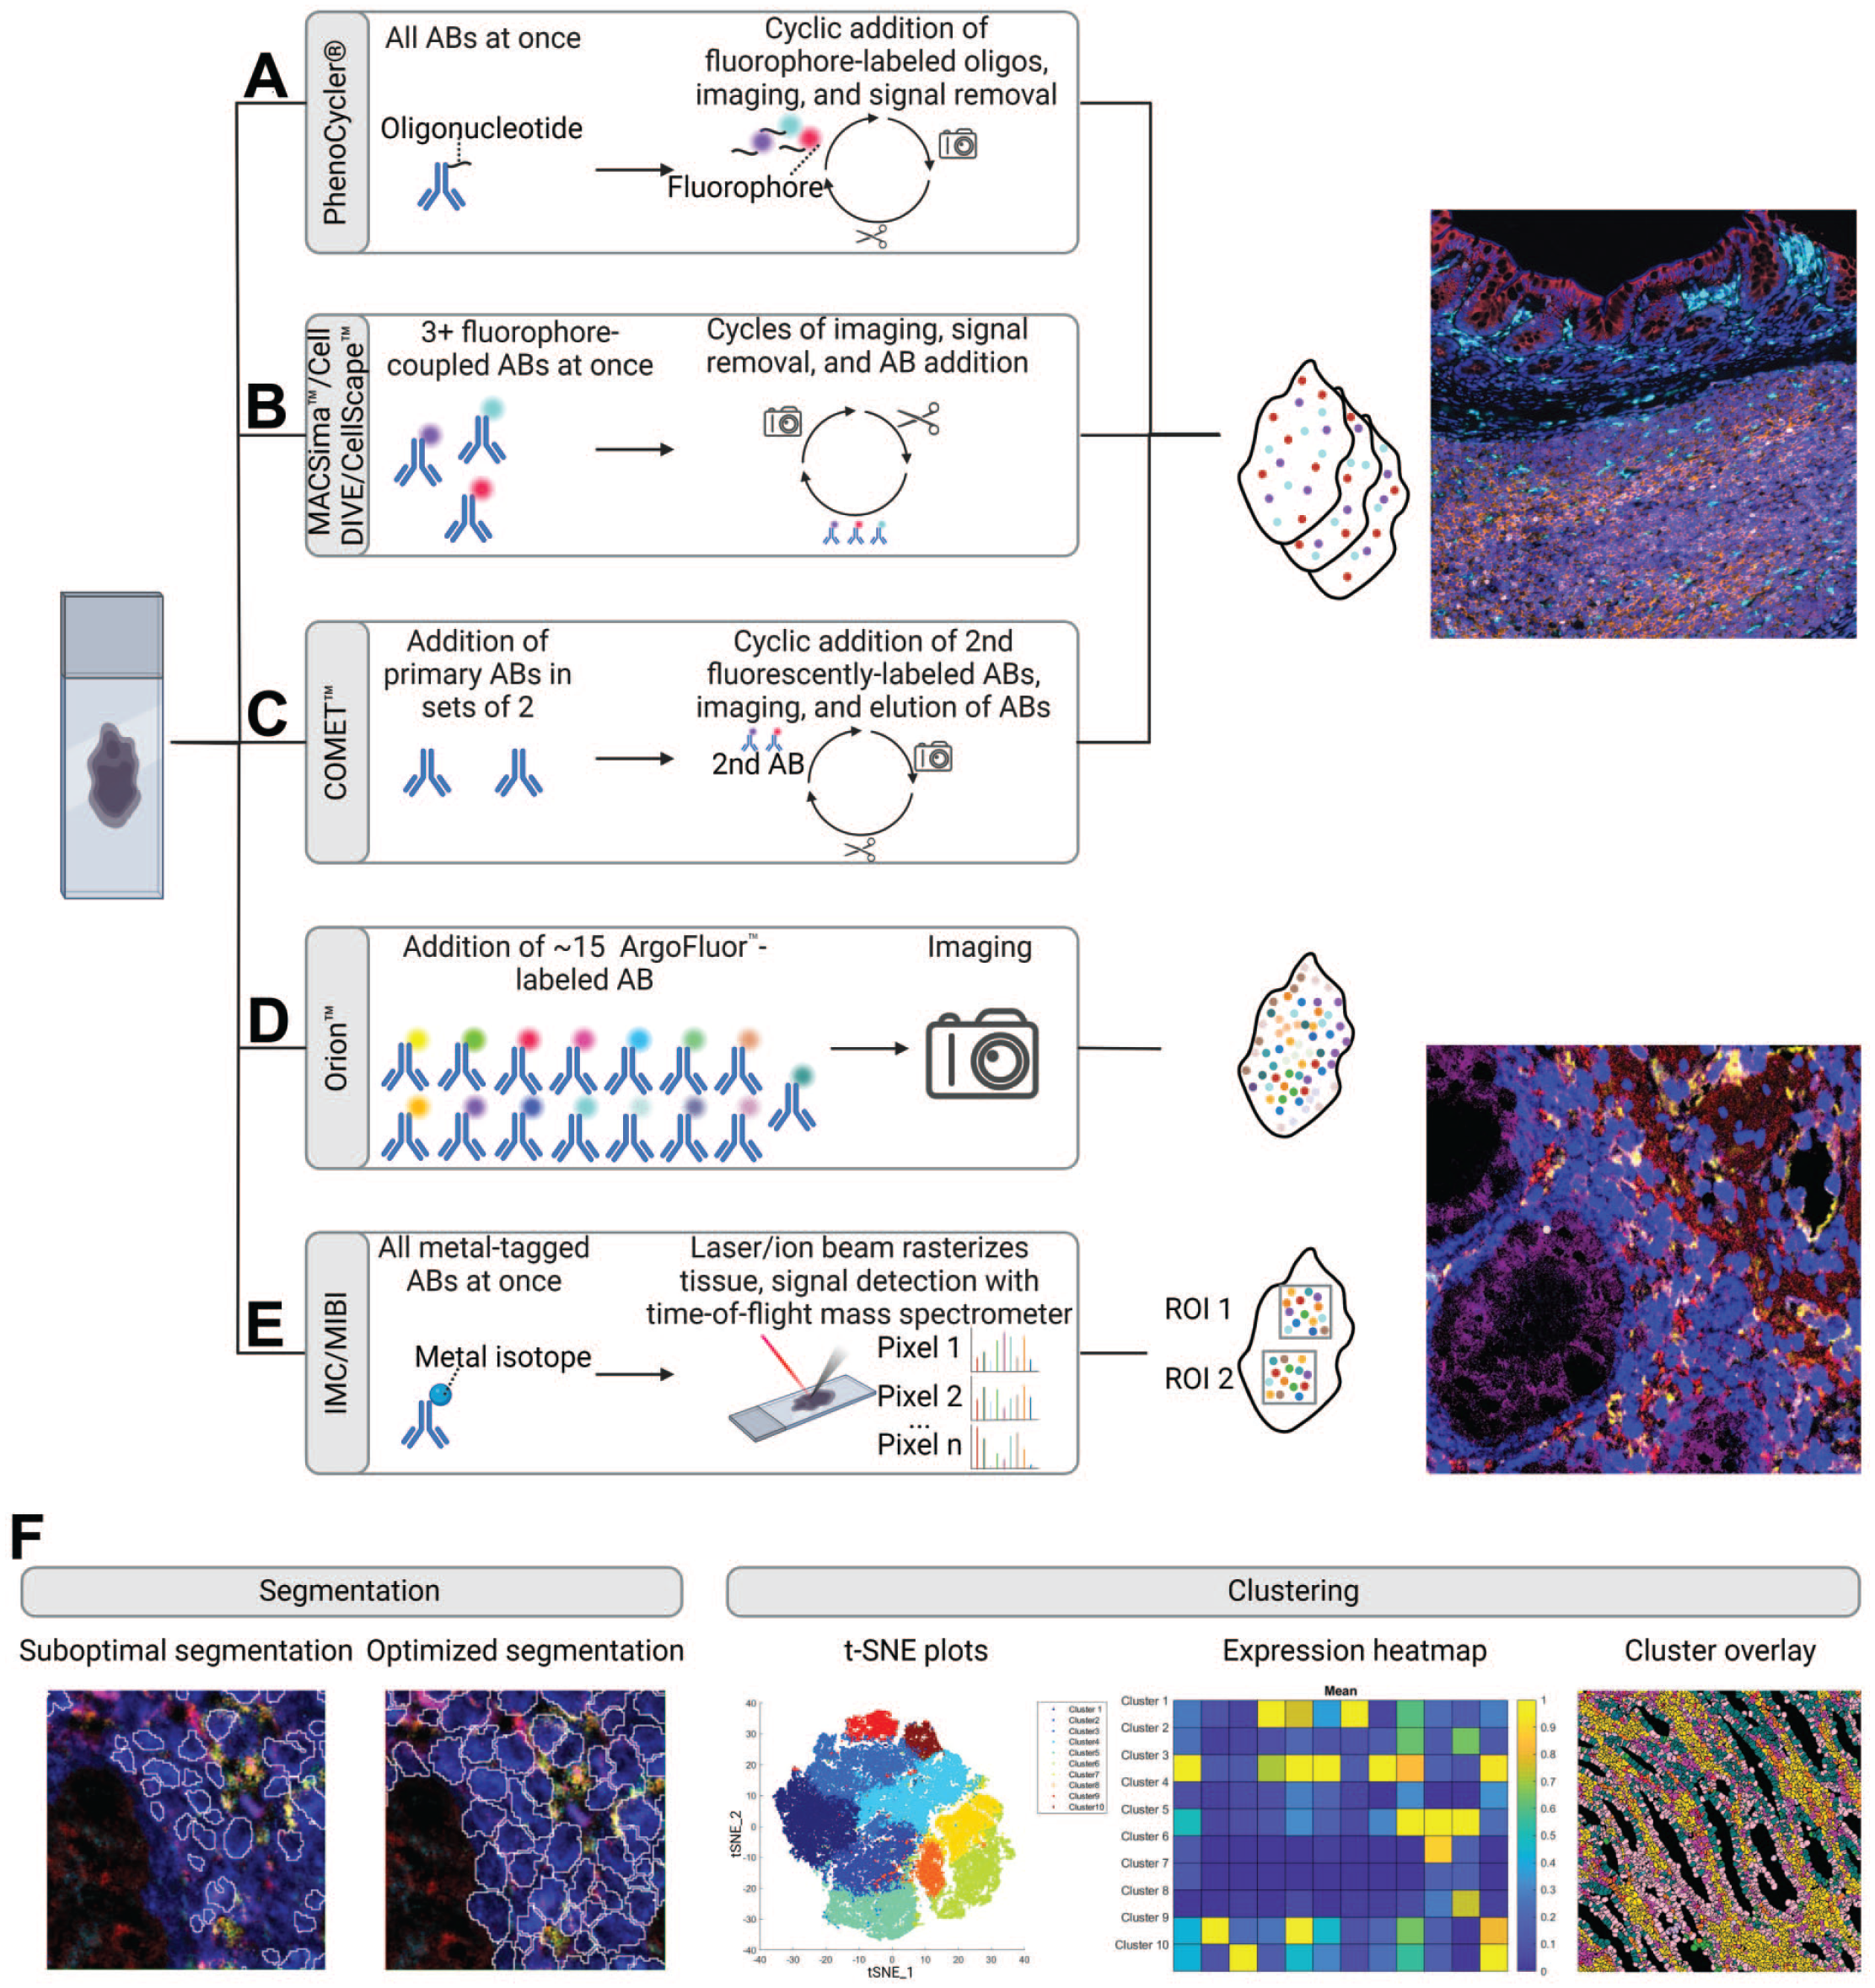
Fundamentals of high-plex spatial proteomics. (A) The Akoya PhenoCycler method entails adding all oligonucleotide-conjugated antibodies (ABs) to the tissue simultaneously. For signal detection, three fluorophore-labeled oligonucleotides are added and imaged. The signal is subsequently removed, and the process is repeated. (B) The MACSima from Miltenyi Biotec, the Cell DIVE from Leica, and the CellScape from Canopy Biosciences techniques involve the simultaneous addition and imaging of three (MACSima), four (Cell DIVE), or five (CellScape) fluorophore-coupled antibodies. The signal is then removed, and the process is repeated. (C) For COMET from Lunaphore, two primary antibodies are added followed by detection with fluorophore-labeled secondary antibodies. After image acquisition, the antibodies are eluted. This process is repeated. For all methods A-C, the images from each cycle need to be aligned. An Akoya PhenoCycler example image of the cynomolgus monkey intestine delineates the signal pattern of high-plex fluorescent-imaging-based spatial proteomics. (D) The Orion from RareCyte adds all ArgoFluor labeled antibodies at once which are then imaged subsequently. (E) The mass cytometry-imaging methods Imaging Mass Cytometry (IMC) and MIBI involve applying metal-tagged antibodies to the tissue. The tissue is then rasterized pixel by pixel using either an ion beam (MIBI) or a laser (IMC), and the ions liberated from the metals are detected with a time-of-flight mass spectrometer. The individual pixels are then stitched together to form an image. In the case of MIBI, this approach allows imaging of only specific regions of interest (ROI), whereas for IMC, whole slide imaging is possible. An Ionpath MIBIscope example image of the human large intestine delineates the signal pattern of mass cytometry-imaging-based spatial proteomics. (F) Single-cell detection requires segmentation. Suboptimal segmentation (left panel), which fails to detect all cells and incorrectly identifies nuclei in columnar intestinal epithelial cells requires adaptation (right panel). Segmented cells are subsequently clustered based on the expression patterns and visualized in plots such as t-distributed stochastic neighbor embedding (t-SNE). Marker expression for the clusters is visualized in heatmaps. The clusters are mapped to the tissue. All example images were provided by Roche Pharmaceutical Research and Early Development (pRED). Figure generated with BioRender.com.
Mass Cytometry-Imaging-Based Spatial Proteomics
Mass cytometry-imaging (MCI)-based spatial proteomics detects specific proteins by antibodies conjugated to stable metal tags. There are two approaches for MCI— Imaging Mass Cytometry (IMC), marketed as the Hyperion XTi system by Standard BioTools (formerly Fluidigm)42,91 and Multiplexed Ion Beam Imaging (MIBI), commercialized as MIBIscope by Ionpath13,49 (Figure 4E). In both methods, the tissue slides are labeled with up to 46 different antibodies conjugated to stable isotopes, mostly from the lanthanide series. In IMC, the tissue is then ablated using a laser with a 1-μm spot size, which rasterizes over a selected ROI. The small tissue fragments are aerosolized, atomized, and ionized, and then fed into a time-of-flight mass spectrometer for analysis of isotope abundance. In MIBI, an oxygen duoplasmatron primary ion beam rasterizes over the tissue, ablating a thin layer of the tissue surface, which then liberates antibody-bound metal isotopes as ions. Similar to IMC, these secondary ions are then fed into a time-of-flight mass spectrometer for the estimation of isotope abundance. In both methods, the isotope abundance of each “spot” is mapped back to the original coordinates, producing a high dimensional image qualitatively similar to a fluorescence microscopy image. 14 Both systems are compatible with FF and FFPE tissue. The Hyperion XTi system can work with samples on Superfrost slides, whereas the MIBIscope requires specially formulated high-purity gold-coated slides.49,91 Compared with fluorophore-based methods, MCI-based spatial proteomics overcomes the autofluorescence as an inherent property of lung, gut, brain, liver, and skin tissue. MCI platforms further enable to directly study the distribution of metal-based drugs in the tissue. 24
Basics of Spatial Proteomics Data Analysis
The analysis of imaging-based high-plex proteomics data shares many similarities with iST data assessment. Converting the high-dimensional raw data into single-cell maps of tissue architecture and functional states involves four main steps: (1) image preprocessing, (2) cell segmentation, (3) cell phenotyping, and (4) spatial analysis using one or more algorithms. 56 The image preprocessing includes generating the highly multiplexed image used for downstream analysis. Iterative imaging produces multiple images referred to as “tiles,” which need to be converted into a multidimensional “hyperstack” comprising all fluorescent channels and imaging cycles. Preprocessing computational tools, often embedded in the imaging software or provided separately by hardware suppliers (eg, Akoya’s Phenochart, inForm, and phenoptr9,52), correct for “spatial drifts” during cyclic imaging, illumination variations, and autofluorescent background. Alternatively, other software capable of handling large image files, such as QPTIFFs, can be used (eg, Visiopharm 101 , Enable Medicine 37 , OracleBio 74 , Indica Labs 48 , PathAI 77 , or open-source software like QuPath 15 ).
Background subtraction and spectral unmixing is usually performed by the imaging software itself as part of the post-processing routine using the incorporated “blanks.” However, visual inspection of the results is highly recommended. At any stage, data can be extracted for analysis outside of these platform’s related software to allow for a more customized approach using toolkits like Squidpy. 75
For cell segmentation, the boundaries of single cells are computationally identified using a set of membrane markers and binary masks for individual cells are generated (Figure 4F). To define the cell borders, the use of multiple antibody markers is recommended, defining the cell shapes of the different tissue inherent cell types. For example, to segment cells in the intestine, a combination of EPCAM (epithelial cells), vimentin (mesenchymal cells, endothelial cells), and CD45 (immune cells) might be considered. Generally, densely packed cells, in tissues like lymph nodes, spleen, or the cerebellar granular cell layer represent a challenge for cell segmentation. Different providers also offer cell segmentation kits for human and mouse (eg, for the Hyperion XTi system) or recommend markers for cell segmentation. In general, cell segmentation based on machine learning and deep learning algorithms like CellSighter, 12 ASTIR, 41 MAPS 88 and AnnoSpat, 68 represent robust tools for precise cell type prediction and improved generalization across tissue types compared with Watershed-based algorithms. 56 After cell segmentation, protein marker expression is typically quantified as the total marker intensity on each cell normalized by cell size. “Signal” or “spatial spillover” defined as the blending of signals between neighboring cells (eg, the co-expression of CD3 and CD20) complicates the accurate quantification of single-cell protein expression in multiplexed imaging data and should be considered for cell type identification. The cell phenotyping strategy should already be considered during antibody panel design. Unsupervised clustering followed by manual annotation has been widely used for assignment of cell types.43,56,87 After the initial clustering, similar clusters are merged, and mixed clusters are further separated to finalize the cluster annotation. Cluster specific expression patterns are visualized in heatmaps, and clusters are subsequently mapped to the tissue (Figure 4F). In the context of discovery or toxicologic pathology, the spatial analysis aims to decipher how cells and tissues are spatially organized and how this organization changes in disease conditions or after treatment. One example is the analysis of pairwise cell-cell interactions to infer attraction or repulsion between two cell populations. This approach might for example be used to delineate treatment effects in mouse models in discovery oncology such as immune cell interaction after treatment with bi-specific antibodies. In addition, cell neighborhood, niche, or community analysis can be performed, which aims to assess higher-order (rather than paired) interactions between one or more cell phenotypes, which might represent an interesting approach to assess immuno- or bone marrow toxicity.
Spatial Proteogenomics
This section refers to platforms that enable the assessment of high-plex RNA and protein readouts on the same instrument on consecutive or the same slide. Commercialized technologies for this approach include the Nanostring GeoMx and the Nanostring CosMx SMI 46 as well as the combination of protein expression with the probe-based ST workflow from 10x Genomics. The protein co-detection solution from 10x Genomics uses the probe-based Visium CytAssist method and oligonucleotide-conjugated antibodies with a specific capture sequence. These sequences are used to hybridize with the spatially barcoded oligonucleotides on the co-detection Visium slides. The available predesigned antibody panel is a 35-plex human immune panel, with the option to customize it by adding additional antibodies. 2 In addition, several platforms such as the MACSima (preprint) 71 and the COMET from Lunaphore with the COMET Mulitomics solution, 62 and the Hyperion XTi system 90 offer protein and RNA co-detection. For the CellScape, a protocol has been published by Jarosch et al. 51
Nanostring GeoMx digital spatial profiling (DSP) is a method to interrogate protein expression profiles up to 570-plex, or whole transcriptomes, in preselected ROIs for mouse and human tissue,34,47,65,66,99 which is limiting the use of this technology for toxicology readouts (Figure 5A). These ROIs, with a maximum dimension of 660 μm × 785 μm diameter, can be selected based on morphology or on the expression of fluorescently labeled protein or RNA markers. Whilst this offers an excellent way to interrogate cell types of interest, the “one-fits-all” approach for antigen retrieval may be detrimental for some of the antigens and should be considered when choosing the morphology markers of interest. In addition, the fact that morphology marker antibodies are directly labeled with a fluorophore may lead to decreased sensitivity or increased background staining, although antibody amplification methods can be applied after rigorous optimization.
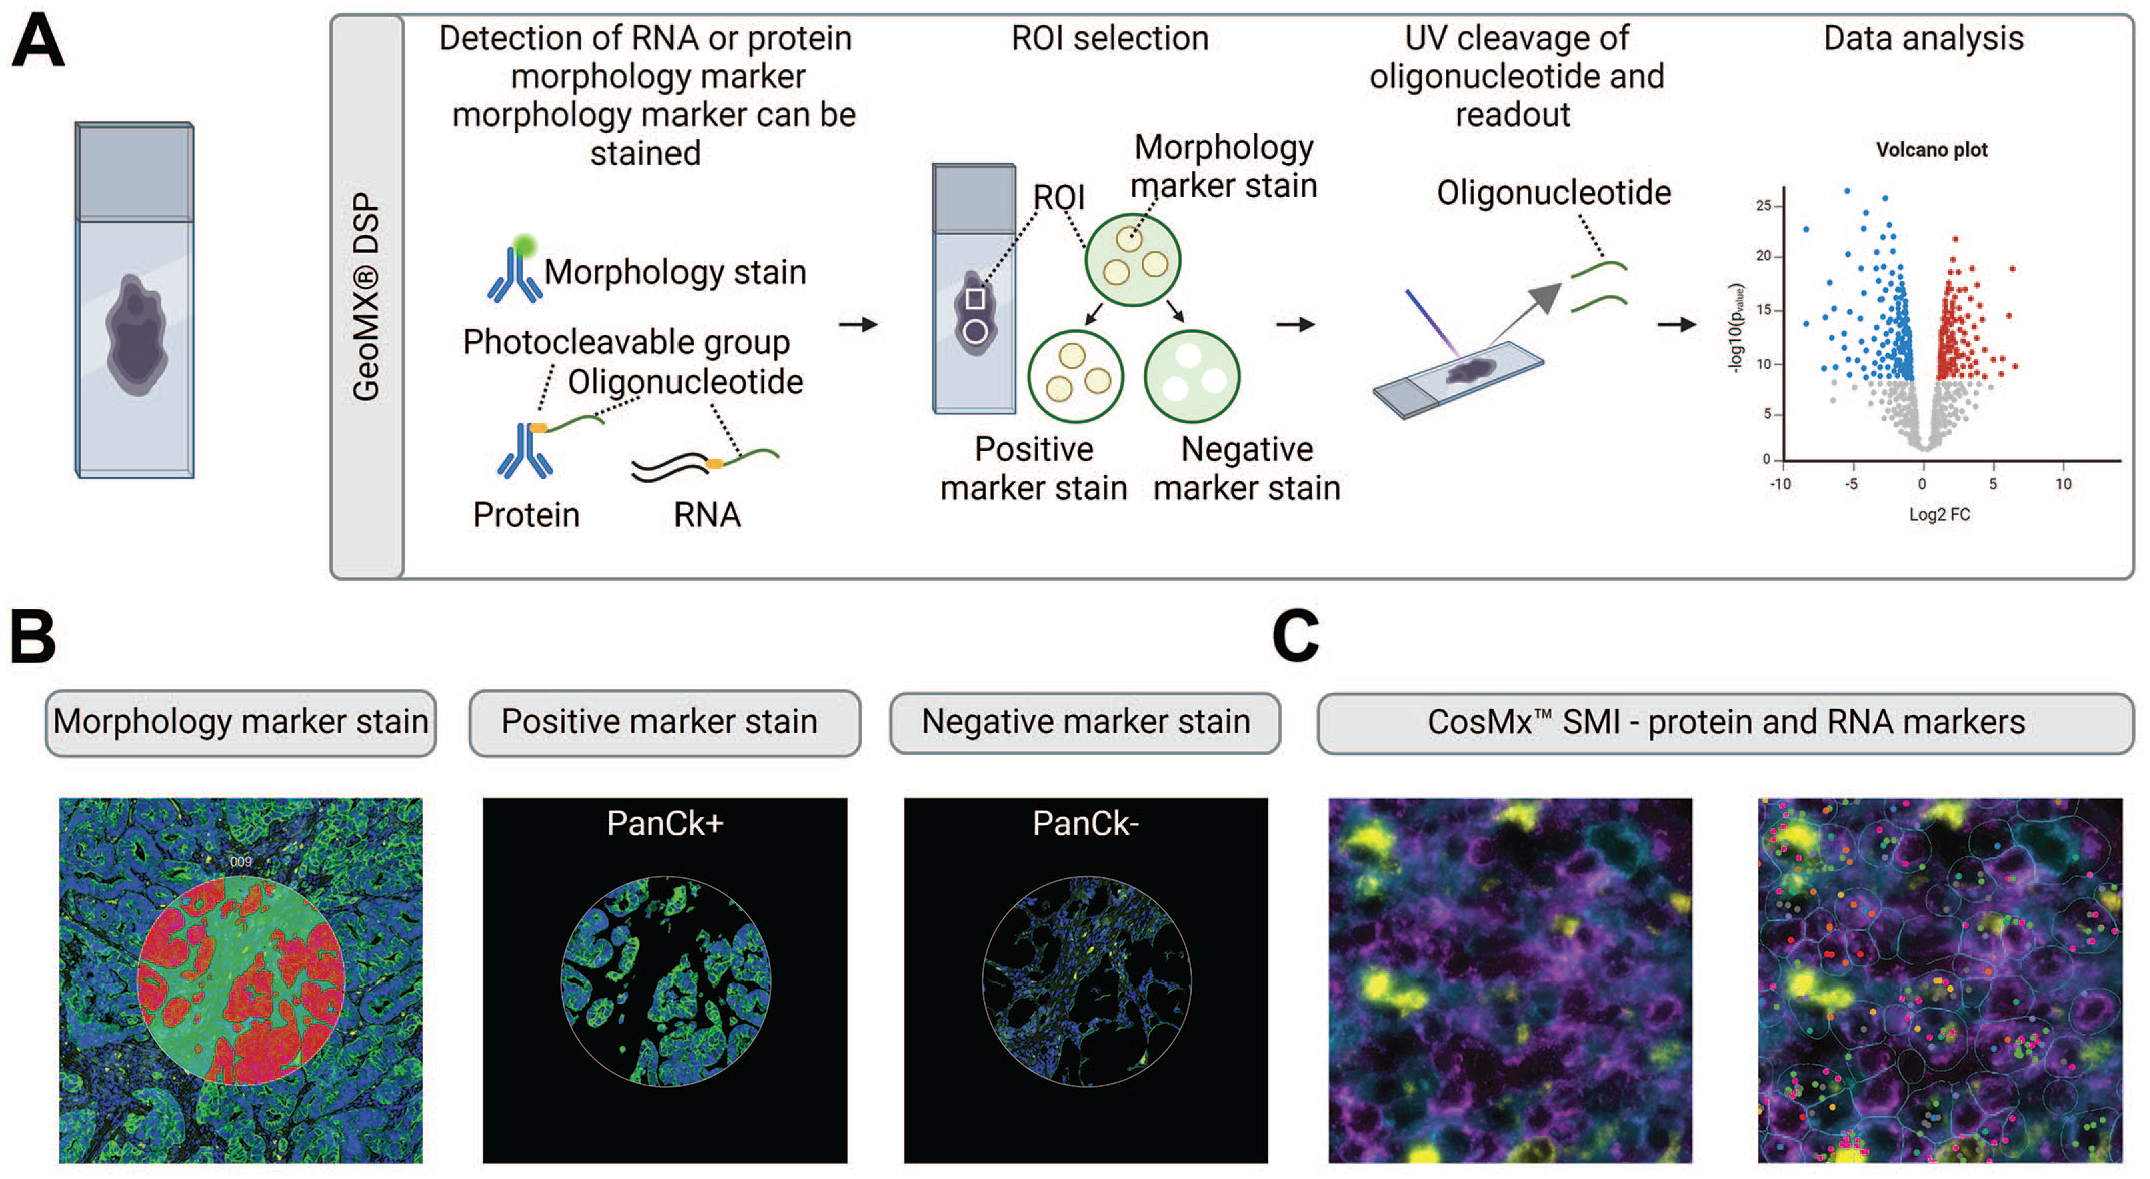
Spatial proteogenomics. (A) The NanoString GeoMx Digital Spatial Profiler (DSP) entails adding of barcoded antibodies or RNA probes for protein and RNA detection, respectively. The tissue can be stained with selected fluorescently labeled antibodies simultaneously for a morphology stain to guide region of interest (ROI) selection. The marker stains can be used to define areas of illumination (AOI) within an ROI. The oligonucleotides contain a photo cleavable group. To collect the probes, ultraviolet (UV) light is shed over the selected AOIs and ROIs enabling release of oligonucleotides either based on marker stain (AOI) or shape (ROI). The collected oligonucleotides are quantified and used for spatially resolved data analysis. (B) Exemplary image of an ROI that is divided into 2 different AOIs based on pan-cytokeratin (PanCk) positive and negative staining. Images were provided by Roche Pharmaceutical Research and Early Development (pRED). (C) The NanoString CosMx Spatial Molecular Imager (SMI) enables detection of mRNA via in situ hybridization and simultaneous readout of proteins. The protein markers are used for segmentation. An exemplary image of the protein stain with DAPI (gray), CD45 (purple), CD68 (yellow), and CD298/B2M (blue) is shown (left panel). The right panel shows the overlay with mRNA markers and outlined segmentation in blue. Images were provided by Jiang Lab, Beth Israel Deaconess Medical Center, Harvard Medical School. Figure created with BioRender.
Based on the fluorescent patterning of the morphology markers, the segmentation of a ROI can be performed to interrogate specific cell populations of interest (Figure 5B). Hence, no single-cell information is gathered, but data can rather be interpreted as mini-bulk analysis of small cell populations. It should be considered that at least 20 to 300 cells per ROI are needed for reliable quantification of proteins and transcripts, respectively. Samples are co-incubated with antibodies or probes tagged with a unique photocleavable oligonucleotide, which are cleaved off by an ultraviolet (UV) light source, leaving the tissue section untouched and suitable for subsequent analyses. Released tags are then quantified using the nCounter from Nanostring or NGS, for protein or RNA expression, respectively. 66 Interestingly, protein and whole transcriptome analysis can be performed on a single slide, avoiding cross-referencing between serial sections. 19 A wide range of predefined panels for mouse and human targets on both FF and FFPE samples are available, focusing mostly on immune profiling, apoptosis, and neurological disorders, with a limited possibility for adding customized probes. The Nanostring GeoMx DSP output has been shown to be very robust, spared from large technical variations, and with a dynamic range exceeding traditional IHC methods. Robustness is especially high for high-abundance protein and RNA targets, whilst caution is warranted for low-abundance targets.
Similar to Resolve Bioscience, Nanostring now offers another highly resolved multiplexed single-molecule fluorescent in situ hybridization (smFISH) technique, through the CosMx SMI technology. This platform is compatible with both FFPE and FF tissue samples and enables visualization and quantification of up to 1000 murine or 6000 human RNAs and 68 validated protein analytes on a subcellular level (Figure 5C). CosMx SMI claims to be highly sensitive with a high dynamic range, and thus able to detect low copy number gene transcripts. Just as the GeoMx DSP platform, scientists can design their CosMx SMI experiment based on predefined panels for mouse and human, with the possibility to add customized panels for any species of choice.46,69 Downstream computing and data analysis is cloud-based, employing the AtoMx Spatial Informatics Platform (SIP). 21
Basics of Spatial Proteogenomics Data Analysis
For Nanostring GeoMx, data analysis can be performed in the GeoMx DSP analysis suite, included in the software package. In addition, there is a growing community of data scientists utilizing and developing packages using R or Python programming for individualized processing and data analysis.61,75 GeoMx DSP assay involves capturing of oligonucleotide tags released from target specific antibodies (protein) or in situ hybridization probes (RNA) from selected ROIs with UV illumination. Based on signals from immunofluorescence staining or manual annotation (eg, PanCk+ vs. PanCk-) ROI’s can be segmented into areas of illumination (AOIs). The captured target-specific oligonucleotide tags will be further barcoded for spatial mapping (ROIs or AOIs) and sequenced for quantification. The sequencing output in the format of FASTQ files contain sequencing reads of target-specific oligonucleotide tags with ROIs/AOIs specific barcodes. FASTQ files can be converted into a raw target count data table using GeoMx’s NGS pipeline. It is recommended to implement quality control steps to filter out probes with low detection rate and segments (ROIs or AOIs) with exceptionally low signal across target panels and normalization of raw counts to account for technical variability. Following quality assessment and normalization, different downstream analysis can be performed depending on the purpose of the study, including (1) visualization and clustering of ROIs or AOIs segments based on their target expression patterns using UMAP, t-SNE, or other dimensionality reduction methods, (2) differential expression analysis between samples or segments (ROIs or AOIs) with visualization via heatmaps or volcano plots, and (3) deconvolution of expression data to estimate cellular composition of each segments using reference single-cell/nuclei transcriptome data.33,34
For Nanostring’s CosMx SMI the cloud-based analysis platform AtoMx SIP, provides building blocks to build pipelines for straightforward preprocessing and QC, segmentation, clustering, annotation, and visualization. Basic analysis includes, but is not limited to, QC on RNA and protein to filter out cells with low signal, unreliable negative probes, count distribution and cell size, fields of view with low signal, targets with expression below background, and segmentation masks with poor membrane staining. It also includes normalization of raw counts based on total counts or Pearson’s normalization for RNA, and normalization to raw mean fluorescent intensity for protein. Customized pipelines, incorporating various QC and normalization steps, can be assembled according to the specific requirements of the experimental setup. After initial processing, the data set can be subjected to PCA or UMAP visualization to investigate variation, to supervised or unsupervised clustering for cell typing, to protein marker identification, and to cell type and transcript annotation. Furthermore, neighborhood analysis, ligand-receptor analysis, cell type colocalization analysis, spatial expression analysis or pathway analysis can be performed upon many others using AtoMx SIP. AtoMx SIP is suitable for users without coding experience. However, flat file extraction is possible to perform customized data analysis outside of the cloud-based platform. In recent years, various refined analysis pipelines for segmentation were published including Baysor, 78 BIDCell, 40 and Proseg (preprint). 53
For all spatial platforms enabling RNA and protein analysis on the same slide, integration of RNA and protein data is achieved by aligning the spatial coordinates of nuclei and expression levels. This allows for direct comparison of RNA and protein expression within the same cells or tissue regions that can be mapped back to the tissue highlighting areas of co-expression or divergence. Finally, as for all other spatial omics technologies, close collaboration between pathologists, scientists, and computational scientists is absolutely crucial to guarantee reliable and sound data.
Combinations of Different Spatial Technologies
Besides analyzing a tissue sample on one specific platform, an increasing number of publications use combinations of different technologies to achieve integrative readouts or to cross validate results. We highlight selected publications in this section and briefly comment on potential applications for toxicologic and discovery pathology.
Guilliams et al 44 used a spatial proteogenomics approach to assess evolutionarily conserved hepatic macrophage niches and provided a proteogenomic atlas of the healthy and obese human and murine liver. In this study, single-nuclei sequencing, combined single-cell cellular indexing of transcriptomes, and epitopes by sequencing (CITEseq), NGS- and imaging-based ST (10x Genomics Visium, Resolve Bioscience Molecular Cartography), and spatial proteomics (Miltenyi Biotec MACSima) were applied. Moreover, the study compared human, nonhuman primate, pig, hamster, chicken, and zebrafish data sets and revealed conserved core gene expression signatures across species. 44 This publication nicely exemplifies how a combination of different spatial and nonspatial technologies can be used to generate reference data sets for target assessment across preclinical species.
Ben-Chetrit et al 16 reports Spatial Protein and Transcriptome Sequencing (SPOTS) combining Visium’s fresh frozen transcriptome profiling with >30 protein markers using mouse spleen and mouse mammary tissue. The combination of the Visium fresh frozen workflow with multiplexed proteomics is especially interesting for rat or nonhuman primate tissue, eg, to combine deep immune cell or microglia phenotyping with whole transcriptome-readouts for mechanistic safety assessments.
Causer et al 23 investigated treatment failure of immune checkpoint inhibitors in human head and neck carcinomas. The study integrated 10x Genomics Visium ST and Akoya PhenoCycler high-plex proteomics for an in-depth profiling of immune cells and to delineate alternative druggable targets. This approach can be extrapolated to characterize cutaneous toxicities of immune checkpoint inhibitors and to predict the likelihood of their occurrence in individual patients.
Janesick et al 50 used human breast cancer samples to cross validate and integrate single-cell sequencing from FFPE material, NGS-and iST-based ST (10x Visium CytAssist and Xenium), immunofluorescence and HE staining. In line with this, Oliveira et al 72 recently published a preprint using Visium HD, single-cell sequencing from FFPE material, Xenium and Visium CytAssist from consecutive colorectal cancer sections. These publications further display how iST-data can be used to interpolate the cell composition of Visium spots and might provide an interesting readout supporting, eg, the development of cancer immunotherapies.
Bonnett et al 19 performed Nanostring GeoMx DSP on a single FFPE section, to simultaneously detect and quantify RNA transcripts and protein abundance in a defined cell population within individual mouse and human tissues. This report underlines the value to understand proteomic and transcriptomic relationships within a spatially defined cell population. It further illustrates the benefit of such a workflow to support the development of compounds for phosphorylation-related diseases such as Alzheimer’s disease or to assess biological activities including the MAPK and PI3K pathways. 19
Strittmatter et al 95 applied a multimodal imaging approach to study the intratumor distribution of Gemcitabine in a mouse model of pancreatic cancer and to assess factors influencing drug delivery, drug metabolism, and functional biomarkers associated with drug action. In this study, the imaging mass cytometry (IMC, Hyperion) using 25 antibodies was performed on the same slide as positive ion mode Desorption electrospray ionization mass spectrometry imaging (DESI-MSI) analysis. 95 General principles of DESI-MS have excellently been reviewed elsewhere.55,100 The combined setup was delineated as a powerful tool to study factors that are influencing drug delivery, drug metabolisms, as well as drug local distribution in the tumor microenvironment and the functional biomarkers associated with drug action.
Overall, these studies highlight that combinations of different omics approaches provide more information in assessing cellular heterogeneity and to characterize functional cell states and tissue compartments with spatial resolution. For discovery and toxicologic pathology, the combination of ST and proteomics might enable mapping the distribution of therapeutic antibodies and to delineate the associated efficacy or safety relevant molecular patterns and biomarkers on the RNA or protein level. Likewise, the combination of mass spectrometry and proteomics or transcriptomics can be applied to assess small molecule biodistribution and associated signatures. Whilst the setup and evaluation of single, commercialized spatial omics approaches implies a challenge, the combination of different technologies requires even more optimization. Hence, combinations of different spatial technologies might be considered for precious samples, where data integration is key to achieve comprehensive readouts.
General Considerations for the Application of Spatial Omics in Drug Discovery and Toxicology Workflows
Spatial omics readouts imply complex experiments associated with high financial costs ($1000-$7000 per tissue sample) and substantial time requirements, especially for platform establishment and data analysis. In this regard, spatial omics technologies represent rather a toolkit to be applied in selected studies on a subset of slides rather than a routine method. Hence, the research benefit should be weighed by a multidisciplinary team against the cost and time investments. Still, the number of samples should be sufficient for statistical downstream analysis. It should further be critically revised, if the spatial readout is key for the experiment or if the research question can be addressed via platforms lacking spatial resolution (eg, single-cell/ nucleus RNA sequencing). For the experimental planning, it should be considered that many probe-based spatial omics platforms such as 10x Genomics Visium CytAssist Spatial Gene Expression, Visium HD and Nanostring GeoMx are restricted to mouse and human tissues. Likewise for antibody-based proteomics platforms, validated panels are mostly available for humans and mice, whereas the establishment of rat or nonhuman primate specific setups requires significant time and cost investments and experimental optimization. For the whole genome wide analysis of rat and nonhuman primate tissue, the poly(A)-based protocols such as 10x Genomics Visium currently represents an adequate platform, as it is not based on probes. Moreover, probe-based, high plex ISH platforms such as MERFISH or Molecular Cartography are species-agnostic and can be used to analyze custom made specific gene panels in single-cell resolution in all toxicology study-relevant animal species. It should be further considered that multiple platforms require the mounting of the tissue on specialized slides provided by the vendors, limiting its applications for precut slides as obtained from CROs or from a human tissue bank. Furthermore, the resolution of the spatial platform represents a critical factor in spatial omics experimental design. For example, Nanostring GeoMx provides bulk data of multiple cells. The 10x Visium array using 55 μm resolution comprises bulk RNA sequencing data of approximately 1-10 cells 2 , or even up to 40 neighboring cells covering one spot and the proportions of cell types per spot can only be assessed approximately using deconvolution requiring single-cell/nuclei sequencing reference data sets. In contrast Visium HD provides an approximately 8 μm resolution, which still can be covered by up to 3 cells, also requiring deconvolution to obtain approximate single-cell data. Moreover, the assay implies higher costs and more complex analysis, and it should be critically revised, if the higher resolution is needed to answer the defined question.
In contrast, all iST, high-plex proteomics platforms as well as CosMx SMI proteogenomics provide single-cell resolution and, depending on the imaging device, even to a subcellular level. Moreover, the expression levels of genes or proteins of interest should be considered. In this regard, especially lowly expressed genes represent a challenge whereas highly expressed genes can be detected more reliably (preprint). 30 Hence it is recommended to leverage published data sets to assess if the platform is appropriate to detect lowly expressed transcripts or proteins of interest. Furthermore, it should be discussed if the readout on the transcript level is sufficient to address key experimental questions or if a process of interest is rather regulated on the protein level such as immune cell activation or protein-phosphorylation. For probe or antibody-based readouts, a cell type phenotyping strategy based on specific markers should be considered. The community is currently working on comparing different spatial omics platforms as in this recently published preprint from the Martelotto lab comparing Xenium and CosMx SMI (preprint). 30 Another preprint compared Xenium, CosMx SMI, and MERFISH. 104 Both preprints found higher sensitivity for Xenium compared with CosMx SMI and MERFISH.30,104 NGS-based ST methods have been compared by You et al. 107 However, in these comparisons, it has to be considered that sample preparation and pretreatment has to be optimized for each technology. In addition, it is important to carefully consider the panel specifications. Panels designed for specific cancers (eg, colorectal) may not perform as well on other tissues (eg, breast cancer). Key considerations for the planning of spatial omics experiments are provided in Figure 6. The abovementioned considerations underline the relevance to work in multidisciplinary teams involving pathologists for the successful setup of spatial omics experiments.
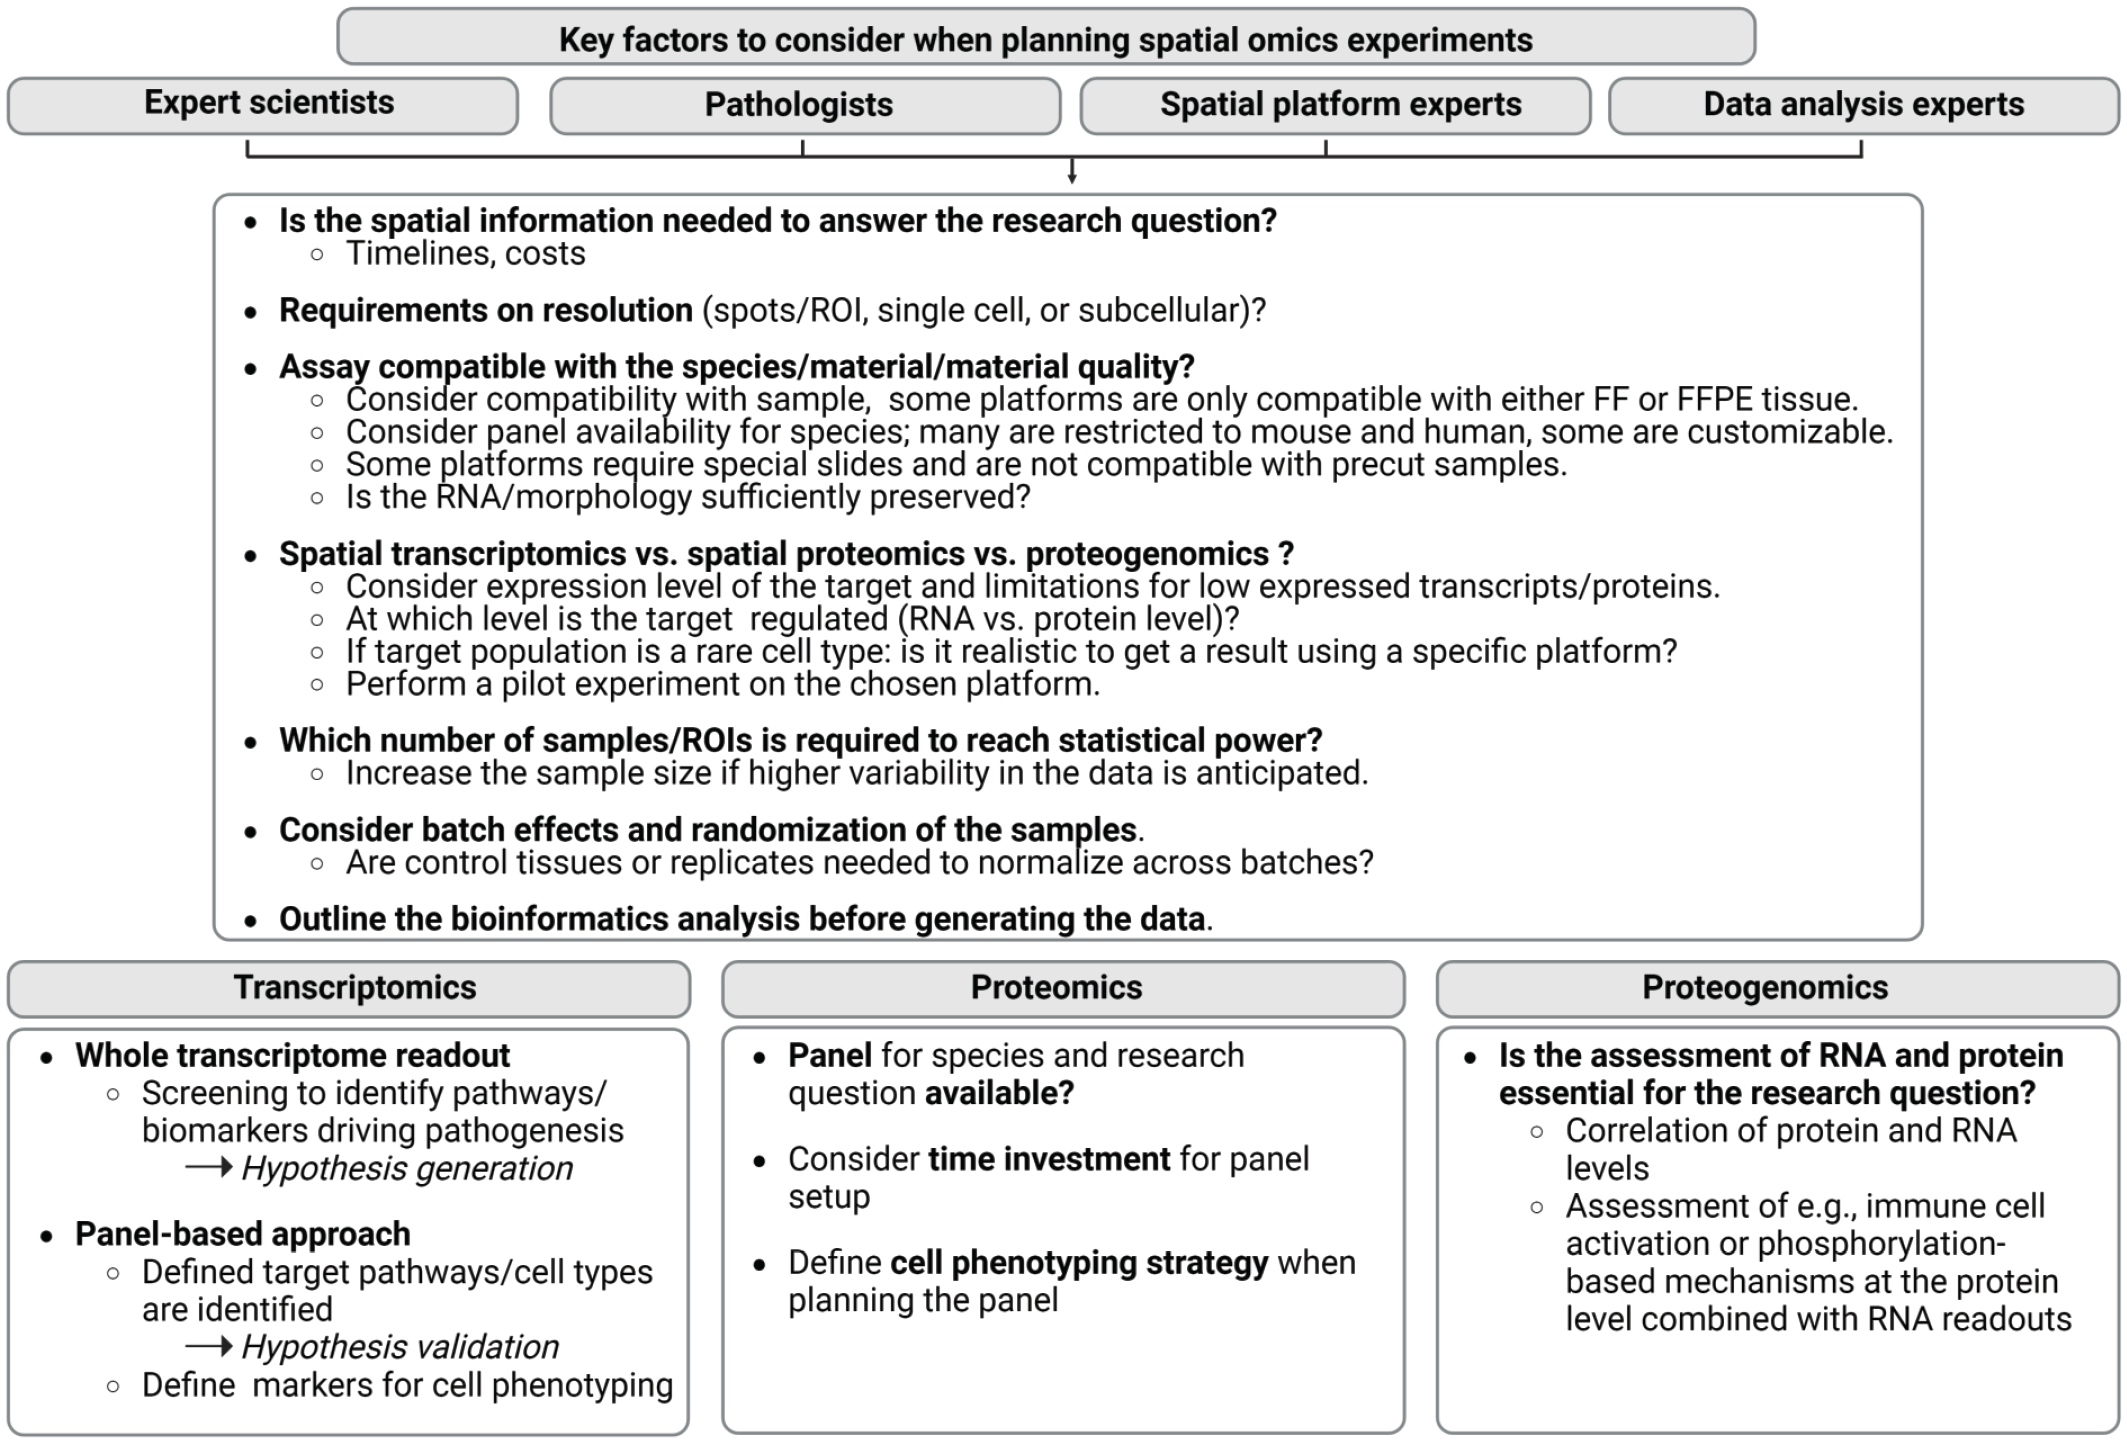
The planning of spatial omics experiments. To ensure successful spatial omics experiments and appropriate platform selection, the listed considerations serve as guidelines for multidisciplinary teams. ROI = region of interest, FF = fresh frozen, FFPE = formalin-fixed paraffin-embedded. Figure created with BioRend.com.
The Pathologist in Spatial Omics Experimental Design and Data Evaluation
Pathologists should be engaged and aligned through all key steps of spatial omics experiments (Figure 7A). During the project planning phase, the pathologist’s involvement is key to define the research question and to decide if the spatial information is relevant in this context. Moreover, the pathologist’s expertise in tissue preservation parameters—such as ischemia time, FFPE or FF status, storage duration in formalin, and the number of freeze-thaw cycles—is invaluable for selecting the appropriate platform and ensuring high-quality sections. In addition, depending on the chosen method, processes like dewaxing and antigen retrieval may not be automated and could require optimization, where the pathologist’s input is crucial. An integrated team of trained histologists and pathologists can easily ensure optimal morphology and transcript preservation as determined by the RNA integrity number (RIN) for FF and evaluation of the percentage of fragments of >200 bp nucleotides in FFPE material by DV200. In addition, ISH represents a useful tool to assess the homogenous fixation and RNA quality of the sample. For platforms requiring the selection of ROIs within the tissue section, pathologists are key to select areas representing defined lesions or anatomical compartments. For platforms that segment tissues based on structural markers, as IF in ROIs such as Nanostring GeoMx, the pathologist should assess the quality of segmentation. For antibody-based platforms, optimized single marker brightfield immunostaining should be evaluated by pathologists, to ensure that antibodies with high specificity are integrated into the high-plex panel. For spatial omics platforms based on antibody or probe panels, the pathologist’s assessment of the antibody or probe specificity in the high-plex panel is considered a valuable quality control step before initializing the data evaluation (Figure 7B). By performing these critical quality control and selection steps, the pathologist helps to identify, prevent and/or mitigate preanalytical variables and contribute to high-quality data sets.
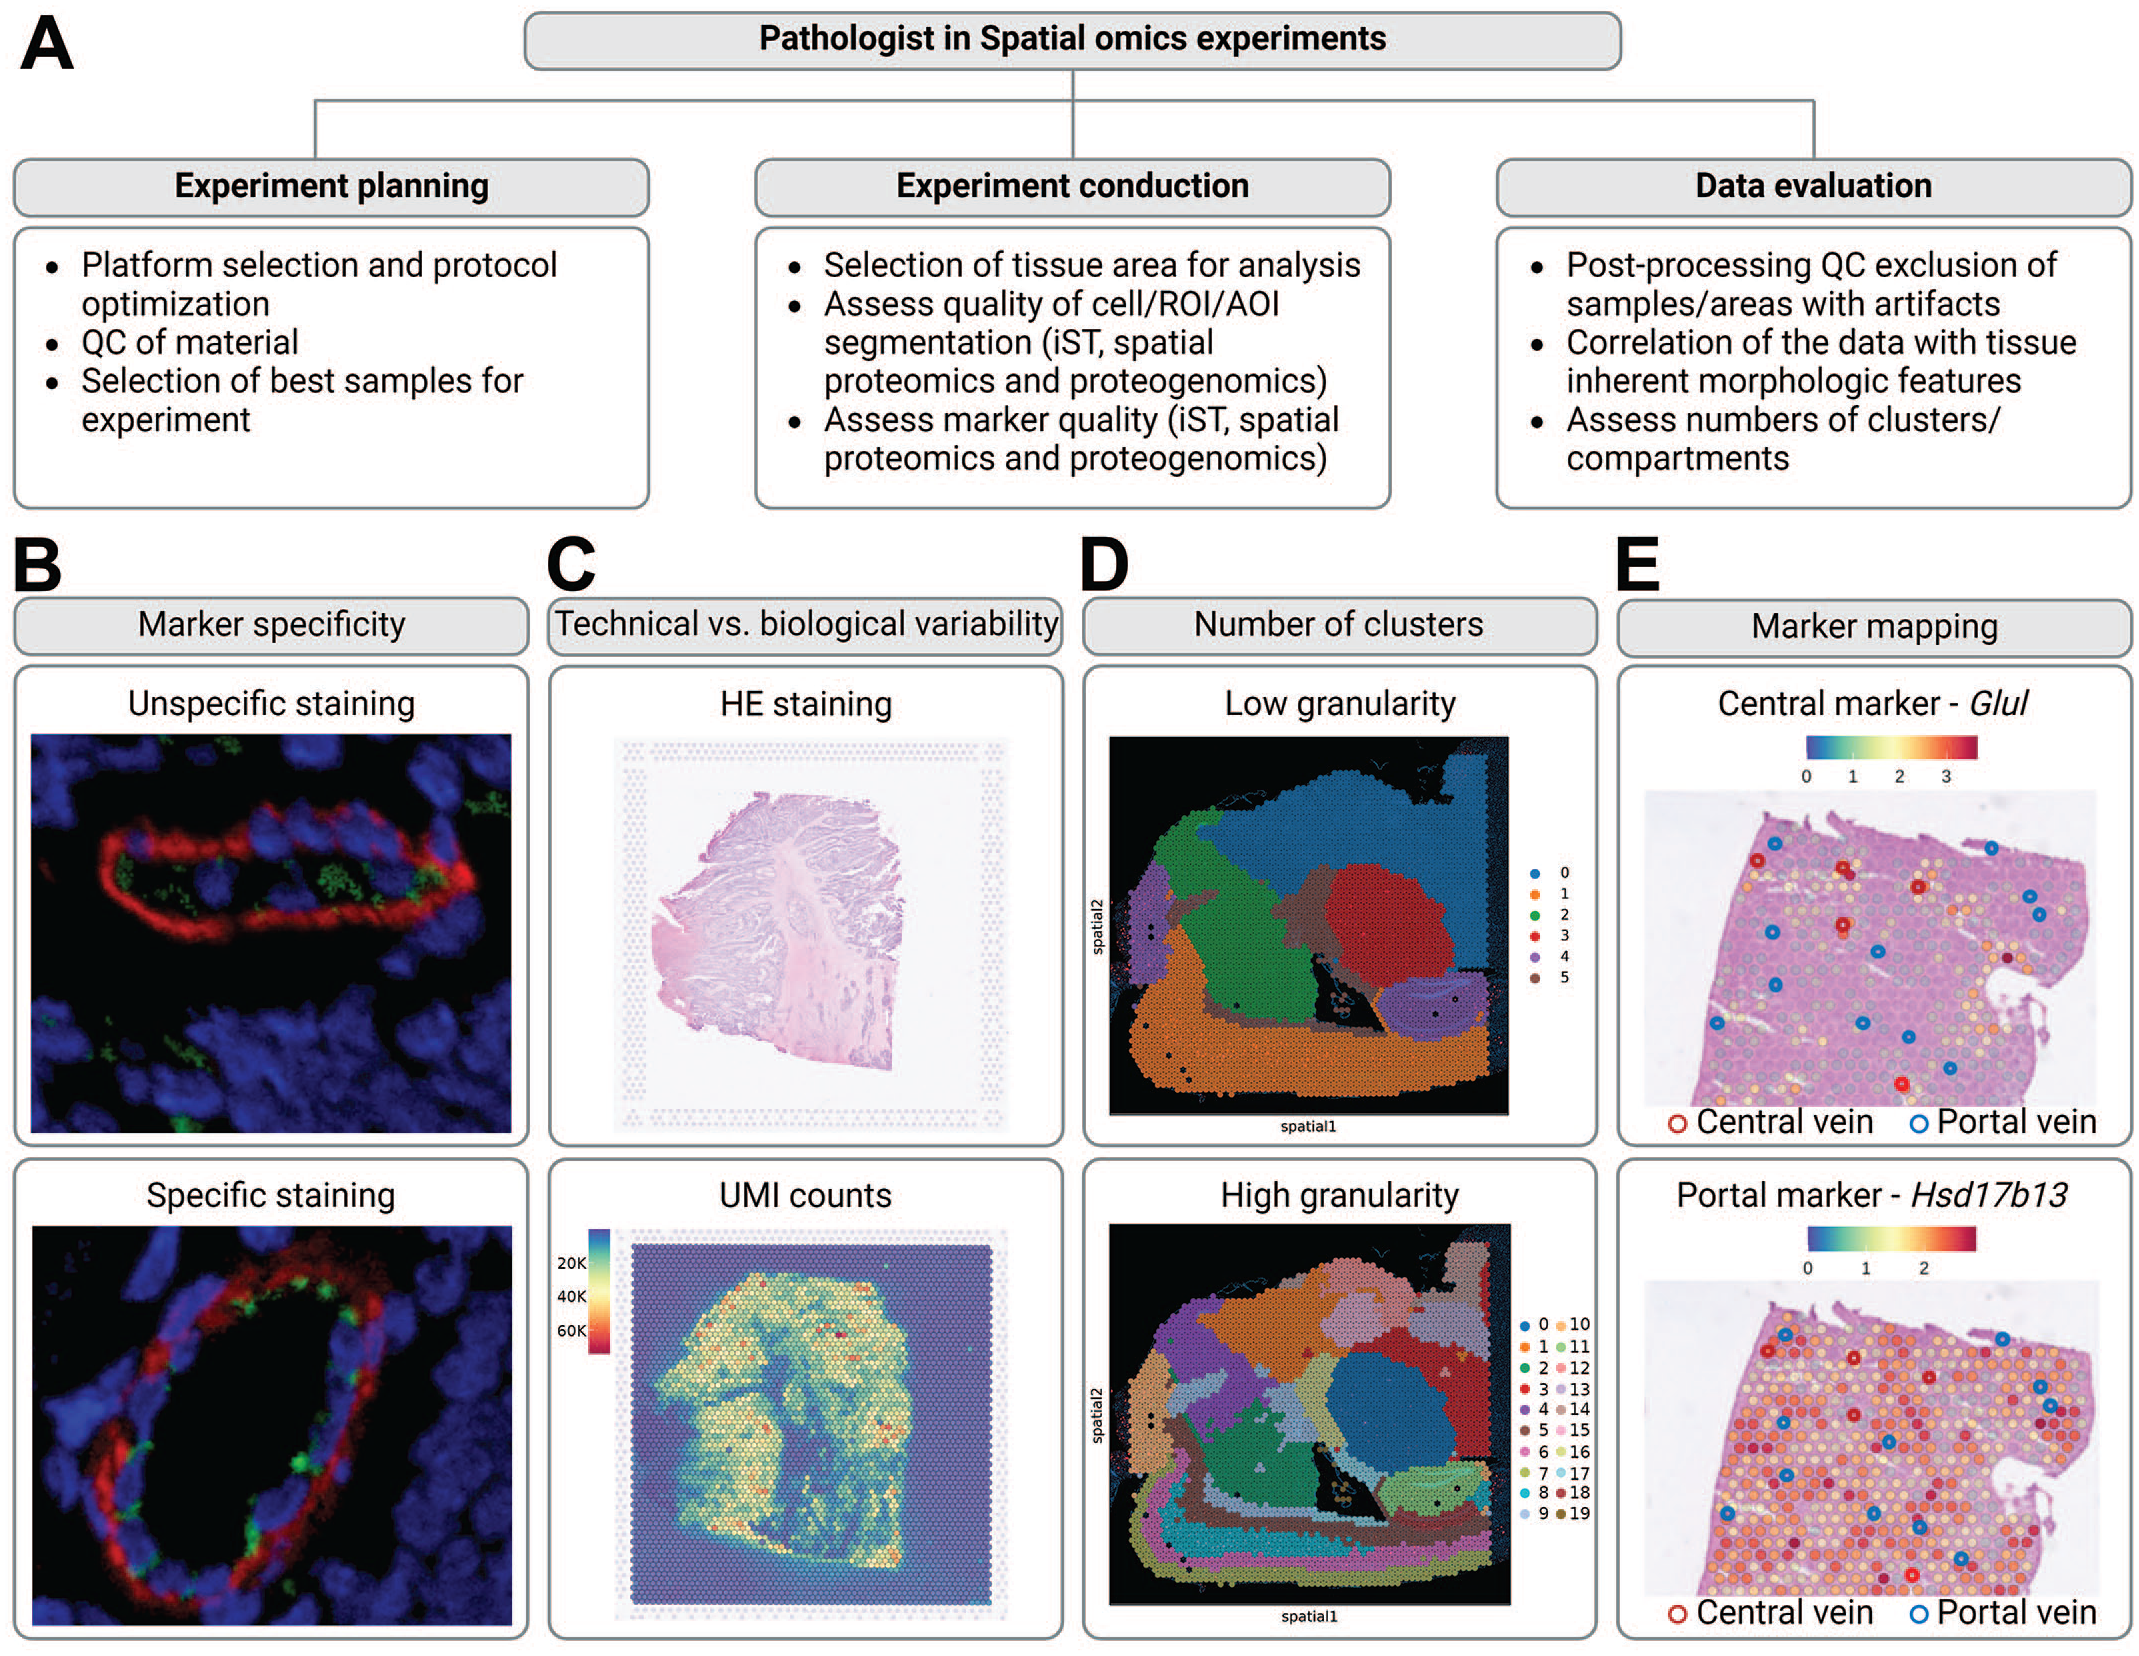
The pathologist in spatial omics experiments. (A) The Pathologist plays a crucial role in spatial omics experiments, contributing to the planning, execution, and data evaluation. QC = quality control, ROI = region of interest, AOI = area of illumination, iST = imaging-based spatial transcriptomics. (B) Pathologists provide key expertise to assess antibody specificity in high-plex proteomics panels. Shown are examples from Ionpath with smooth muscle actin (red) and CD31 (green). CD31 revealed unspecific staining in individual samples. (C) In Spatial Transcriptomics (ST), the pathologist helps distinguish technical variability from biological variability. This is exemplified by the lower transcript/unique molecular identifier (UMI) count in the tumor stroma of a colorectal cancer sample processed with the probe-based Visium ST workflow. The corresponding hematoxylin and eosin (HE) staining is shown. (D) The pathologist assists in determining the appropriate number of clusters/compartments for downstream data analysis: clustering with low granularity is sufficient to analyze the cortex, whereas higher granularity is required to assess defined cortical layers. The required granularity may vary depending on the research question. (E) Pathologist annotations can validate the mapping of markers to specific tissue regions, such as zonation markers in the liver. All example images were provided by Roche Pharmaceutical Research and Early Development (pRED). Figure created with BioRender.com.
After data generation, the pathologist can contribute significantly to data quality assessments. Based on the training, the pathologist supports data analysis teams to identify regions of low tissue quality (eg, folds) or areas of necrosis and to exclude these regions from downstream analysis processes. Moreover, the pathologist is key to assess variables in the data: for example, in ST data lower numbers of transcripts are expected in areas with high amounts of adipose or collagenous tissue (Figure 7C) and higher numbers of mitochondrial genes are expected in hepatocytes. This assessment helps to discriminate between biological and technical variables in data sets and supports data evaluation and troubleshooting.
In the data analysis process, the pathologist is vital in supporting cluster annotation, to define the number of clusters, cell segmentation, and to validate clustering quality by assessing the mapping of the clusters to the tissue (Figure 7D). For ST, the pathologist’s tissue annotation is considered the gold standard 98 to validate the mapping of markers to certain tissue regions (Figure 7E) or to assess the performance of deconvolution algorithms. For all spatial omics experiments, pathologists should assess the data, support their interpretation in the context of tissue morphology and disease pathophysiology, and contribute to novel hypothesis generation. In this regard, a toxicologic or discovery pathologist’s assessment is key for the generation and interpretation of spatial omics data to assess compound-associated effects.
The Opportunity: Implementation of Spatial Omics in Drug Discovery and Toxicology
Numerous studies have demonstrated the impact of spatial omics technologies to complement standard histology readouts and to gain unique insights into the molecular pathology and its associated morphological features. Moreover, spatial approaches provide unique insights into tissue responses to drugs or medical devices as shown for losartan, an angiotensin II receptor antagonist in the rat kidney 73 or assessment of the brain electrode interface in the rat motor cortex (preprint). 105 For drug discovery and toxicology, spatial technologies entail numerous potential applications enabling an in-depth characterization of immunopathology, cell communication events, and to delineate lesion- or tissue-associated transcriptomic or proteomic signatures. Instead of addressing a few specific markers, spatial omics technologies enable a more integrated view on pathology-driving events and will contribute to deciphering the mechanistic understanding of human diseases and to identify novel drug targets. The human data sets further provide a valuable reference resource to phenotype and rank genetically engineered mice based on their similarity to the human disease and even in vitro platforms. This might further support the characterization of these models for safety readouts. Moreover, spatial omics platforms entail novel possibilities to address modality overarching safety questions, such as to investigate mechanisms of hepatotoxicity of adeno-associated virus-based gene therapy. The characterization of cell communication events and cell neighborhoods will further enable the pathologists to understand cause-and-effect relationships driving toxicity, eg, to delineate if the neuronal death is cause or effect of the microglial activation or to interrogate samples based on a new hypothesis. For these assessments, especially tissues in dose groups with subtle or even absent morphologic changes are of particular relevance as they reflect the initial events rather than the end stage signatures associated with cell death. The characterization of initial toxicology-associated events further implies the possibility to identify safety biomarkers or to exclude patients from trials based on the presence of patterns indicating a higher risk for compound-associated toxicology as, eg, to identify patients that will develop skin toxicity associated with immune checkpoint inhibitor treatment. Similarly, the generation of whole genome wide ST organ atlases of toxicology relevant animal species and humans creates an invaluable resource to assess target expression in preclinical species, to address species, sex and age-related differences and hence support the selection of the relevant preclinical species for safety assessments. Currently, spatial omics technologies are not broadly implemented for toxicology readouts. This is likely due to the complexity of the technologies, including the data evaluation, the high costs per assessment, the limitation of platforms for the application on FFPE nonhuman primate, dog, rat, or minipig tissue, as well as limited outsourcing options. However, vendors of spatial technologies increasingly recognize the need to provide solutions for nonhuman primates or rats in addition to mouse and human FFPE tissues. In addition, the development and refinement of data analysis solutions requiring no or minimal coding skills and the adaptation of broadly used image analysis platforms for the evaluation of high-plex proteomics or in situ data will facilitate, standardize, and accelerate data analysis. Whereas the initial efforts of vendors providing spatial technologies were mainly focused on market establishment and upgrading of markers measurable at the same time, the increase of throughput and the decrease of costs per slide will represent future market objectives. This trend might further support the implementation of spatial omics platforms for drug discovery and toxicologic pathology and support the development of advanced therapeutics in the near future.
Conclusion
In conclusion, spatial omics technologies hold significant promise for revolutionizing pathology. To fully harness this potential, careful platform selection and experimental planning are essential, necessitating a multidisciplinary team with pathologists playing a pivotal role. Pathologists must have a basic understanding of spatial omics technologies and data analysis methods, including their limitations, to effectively support these experiments. Although ST readouts may not become routine, they are valuable for addressing mechanistic questions and supporting safety, efficacy, and discovery studies. However, challenges such as high costs, lack of standardized data analysis, and incompatibility with Good Laboratory Practice (GLP) workflows remain. The true impact of spatial omics in drug development will become clearer in the coming years.
Footnotes
Acknowledgements
We would like to express our gratitude to the reviewers from ESTP, STP, and BSTP for their valuable feedback and endorsement of this manuscript. We also acknowledge Amy Narewsky for coordinating the ESTP, STP, and BSTP reviews, as well as Annette Romeike, Beatrice Gauthier, Raffaella Capobianco, and the ESTP Scientific and Regulatory Standards Committee.
Author Contributions
Supervision (KH, BJ); Conceptualization (KH and ESTP Pathology 2.0 Spatial Omics Subgroup); Writing—original draft (KH, BA, all authors); Figures (BA, KH, BP, JS, PC, JAG, MR, NG, MB); Discussion and Reviewing (all authors).
Declaration of Conflicting Interests
The author(s) declared the following potential conflicts of interest with respect to the research, authorship, and/or publication of this article: KH, BA, JMR, BP, AV, NK, JAG, MR, NG, LK, IV, MB and BJ are employed by Roche Pharma Research and Early Development. MV, HW, SAY are employed by Johnson & Johnson. DSB is employed by Sanofi Global Discovery Pathology. CS, BK and SYL are employed by Novartis Biomedical Research. SJ is a co-founder of Elucidate Bio Inc, and serves on its Board of Directors and Scientific Advisory Board, and acknowledges research support from F. Hoffmann-La Roche, Ltd. RK is employed by AnaPath Services GmbH. EV is employed by Idorsia Pharmaceuticals Ltd. SY is employed by Boehringer Ingelheim Pharma GmbH & Co. KG. The authors declared no potential conflicts of interest with respect to the research, authorship, and/or publication of this article.
Funding
The author(s) received no financial support for the research, authorship, and/or publication of this article.