
Abstract
Assessment of hypertensive tubulopathy for more than fifty animal models of hypertension in experimental pathology employs criteria that do not correspond to lesional descriptors for tubular lesions in clinical pathology. We provide a critical appraisal of experimental hypertension with the same approach used to estimate hypertensive renal tubulopathy in humans. Four models with different pathogenesis of hypertension were analyzed—chronic angiotensin (Ang) II–infused and renin-overexpressing (TTRhRen) mice, spontaneously hypertensive (SHR), and Goldblatt two-kidney one-clip (2K1C) rats. Mouse models, SHR, and the nonclipped kidney in 2K1C rats had no regular signs of hypertensive tubulopathy. Histopathology in animals was mild and limited to variations in the volume density of tubular lumen and epithelium, interstitial space, and interstitial collagen. Affected kidneys in animals demonstrated lesion values that are significantly different compared with healthy controls but correspond to mild damage if compared with hypertensive humans. The most substantial human-like hypertensive tubulopathy was detected in the clipped kidney of 2K1C rats. For the first time, our study demonstrated the regular presence of chronic progressive nephropathy (CPN) in relatively young mice and rats with induced hypertension. Because CPN may confound the assessment of rodent models of hypertension, proliferative markers should be used to verify nonhypertensive tubulopathy.
Keywords
Introduction
Hypertension is a major public health challenge around the world. The incidence of end-stage kidney disease related to hypertensive nephrosclerosis has significantly increased in Europe and the United States in the past 20 years and now constitutes 15% and 28% of all new cases, respectively.1,2 As we discussed in the previous study, 3 the limited number of renal biopsies from hypertensive patients makes animal research extremely important in understanding this polygenic multifactorial disease.2,4,5 Therefore, more than 50 animal models have been created to study the pathogenesis of hypertension,6,7,8 and each of the studied models recapitulates a specific pathway in the development of hypertension.
The necessity for comprehensive analysis of hypertensive tubulopathy is based on a better correlation between renal function and chronic changes in the tubulointerstitial compartment than with glomerular and vascular pathology, irrespective of the underlying renal disease. 9 Several clinical studies have confirmed that histomorphometric changes in the tubulointerstitial compartment correlate best with parameters to predict the development of progressive renal insufficiency.5,10 Renal histopathology analysis of each animal model is of crucial importance, but there are at least three significant discrepancies between assessment approaches in humans and animal studies.
First, in human pathology, the severity of tubulopathy is determined by the evaluation of three independent lesional variables—tubular atrophy, interstitial fibrosis, and interstitial infiltration—according to standardized definitions and classifications (Supplementary Tables 1 and 2). Many animal studies do not follow this approach. The assessment is not standardized and could be descriptive, 11 scored only for protein casts, 12 interstitial fibrosis, 13 interstitial infiltration, 14 or tubular atrophy, 15 interstitial fibrosis and tubular atrophy,16,17 and very rare, as in humans, for each independent variable. 18 The different criteria cause disagreement and incomparable data in histopathology analysis. Similar to disparity in the glomerulopathy assessment, 3 there is a strong tendency to combine all pathological variables into one “integrated” score (Supplementary Table 3).19,20,21 Second, in human pathology, for inflammatory infiltrates, it is mandatory to identify cell types and determine their localization relative to the cortex or medulla, glomeruli, or proximal and distal tubules. These pathologic variables allow delineation of the whole spectrum of tubulointerstitial diseases.9,22 In most animal studies, cell infiltrates are measured by the area occupied avoiding consideration of cell types and localization,14,23 although this could be readily distinguished by routine staining. 9 If cells are identified with specific phenotype markers, those positive cells are analyzed per area, without specifying the localization in glomerular, tubular, or vascular compartments.24,11 This approach dominates in studies devoted to inflammatory mechanisms of hypertension. 25 The same concern exists regarding proliferation analysis. Estimation of mitotic activity “per field”26,27,28 has ambiguous results since proliferative cells could be epithelial from different tubules, various interstitial or blood-derived infiltrating cells. 29
Third, tubulopathy in hypertensive animals is assumed a priori due to hypertension.21,30,31,32 Meanwhile, in toxicologic pathology studies there is a widely accepted fact that mice and especially rats are prone to a nonspecific spontaneous renal disease defined as chronic progressive nephropathy (CPN). This is one of the most common spontaneous lesions and the single most important renal disease in rats and mice. Strain, sex, age, diet, and exposure to a wide variety of organic, inorganic, and nutrient compounds may modulate its occurrence and severity.33,34,35 Most animal models of hypertension result from chemical influence (Ang II, deoxycorticosterone acetate, salt, aldosterone, nitro-
All these discrepancies limit data comparison among animal and human studies, and the analysis quality for pathogenesis, treatment modalities, and improvement of models. The aim of this study was to perform a detailed comparative analysis of tubulopathy in different animal models of hypertension based on the criteria widely accepted in clinical pathology.
Materials and Methods
For the current study, kidneys from previously performed and published experiments were used for histopathologic analysis. Four models with different pathogenesis of hypertension were analyzed—chronic Ang II–infused mice, 37 TTRhRen mice,38,39 spontaneously hypertensive (SHR), 40 and 2K1C rats. 41 All animal studies were approved by the University of Ottawa Animal Care Committee (Ottawa, ON, Canada) and conducted according to the guidelines of the Canadian Council on Animal Care. All animals were age-matched males. A detailed description of each model can be found in the Supplemental Material (Appendix 1).
Histology and Immunofluorescence
Kidneys were fixed in 10% neutral-buffered zinc-formalin and embedded in paraffin. Midhilar 4-µm serial coronal sections of each kidney (4 per animal) were stained with hematoxylin and eosin, periodic acid-Schiff (PAS), and Masson trichrome. To precisely locate proliferative cells, immunofluorescent labeling was visualized on consecutive to routine stained sections. Immunofluorescence staining was carried out by a standard protocol. Antigen retrieval was performed by heating slides in TRIS/EDTA buffer (pH 9.0) in a microwave for 20 minutes. After blocking with 10% nonimmune donkey serum in phosphate-buffered saline for 30 minutes, the sections were incubated overnight at 4°C with primary antibodies. The proliferative activity of tubular epithelial and interstitial cells was estimated with monoclonal rabbit anti-Ki-67 antibody (1:200; Abcam, Toronto, ON, Canada). To detect fibrosis, mouse monoclonal anti–α-smooth muscle actin (α-SMA) antibody (1:500; Santa Cruz Biotechnology, Dallas, TX, USA) was used. Primary antibodies were visualized simultaneously with the mixture of fluorescent secondary antibodies A488 and Cy 3 (Jackson ImmunoResearch, West Grove, PA, USA). Microscopic investigations were performed in a blinded manner on coded sections. Images were acquired with a microscope Zeiss Imager A1 (Carl Zeiss, Oberkochen, Germany) equipped with Olympus camera DP73 (Olympus Canada, Richmond Hill, ON, Canada), and whole slide scans were obtained with EVOS FLAuto2 scanner (Thermo Fisher Scientific, Carlsbad, CA, USA). Images were processed and analyzed by ImageJ software (National Institute of Health, Bethesda, MD, USA) and Aperio ImageScope v.12.3.3 software (Leica Biosystems, Wetzlar, Germany).
Tubular Histopathology and Morphometry Analysis
Instead of broadly defined assessments of tubulopathy commonly used in animal studies (Supplementary Table 3), we applied the pathologic variables used to assess human tubulopathy (Supplementary Tables 1 and 2). 42 The general histopathology assessment was based on finding atrophic tubules, interstitial fibrosis, and interstitial infiltration, the key features used to identify hypertensive tubulopathy in humans, 9 whereas the proliferative activity in the tubular epithelium is low 43 (Figure 1). The images representing human hypertensive tubulopathy were taken from human renal biopsies used in our published study. 44
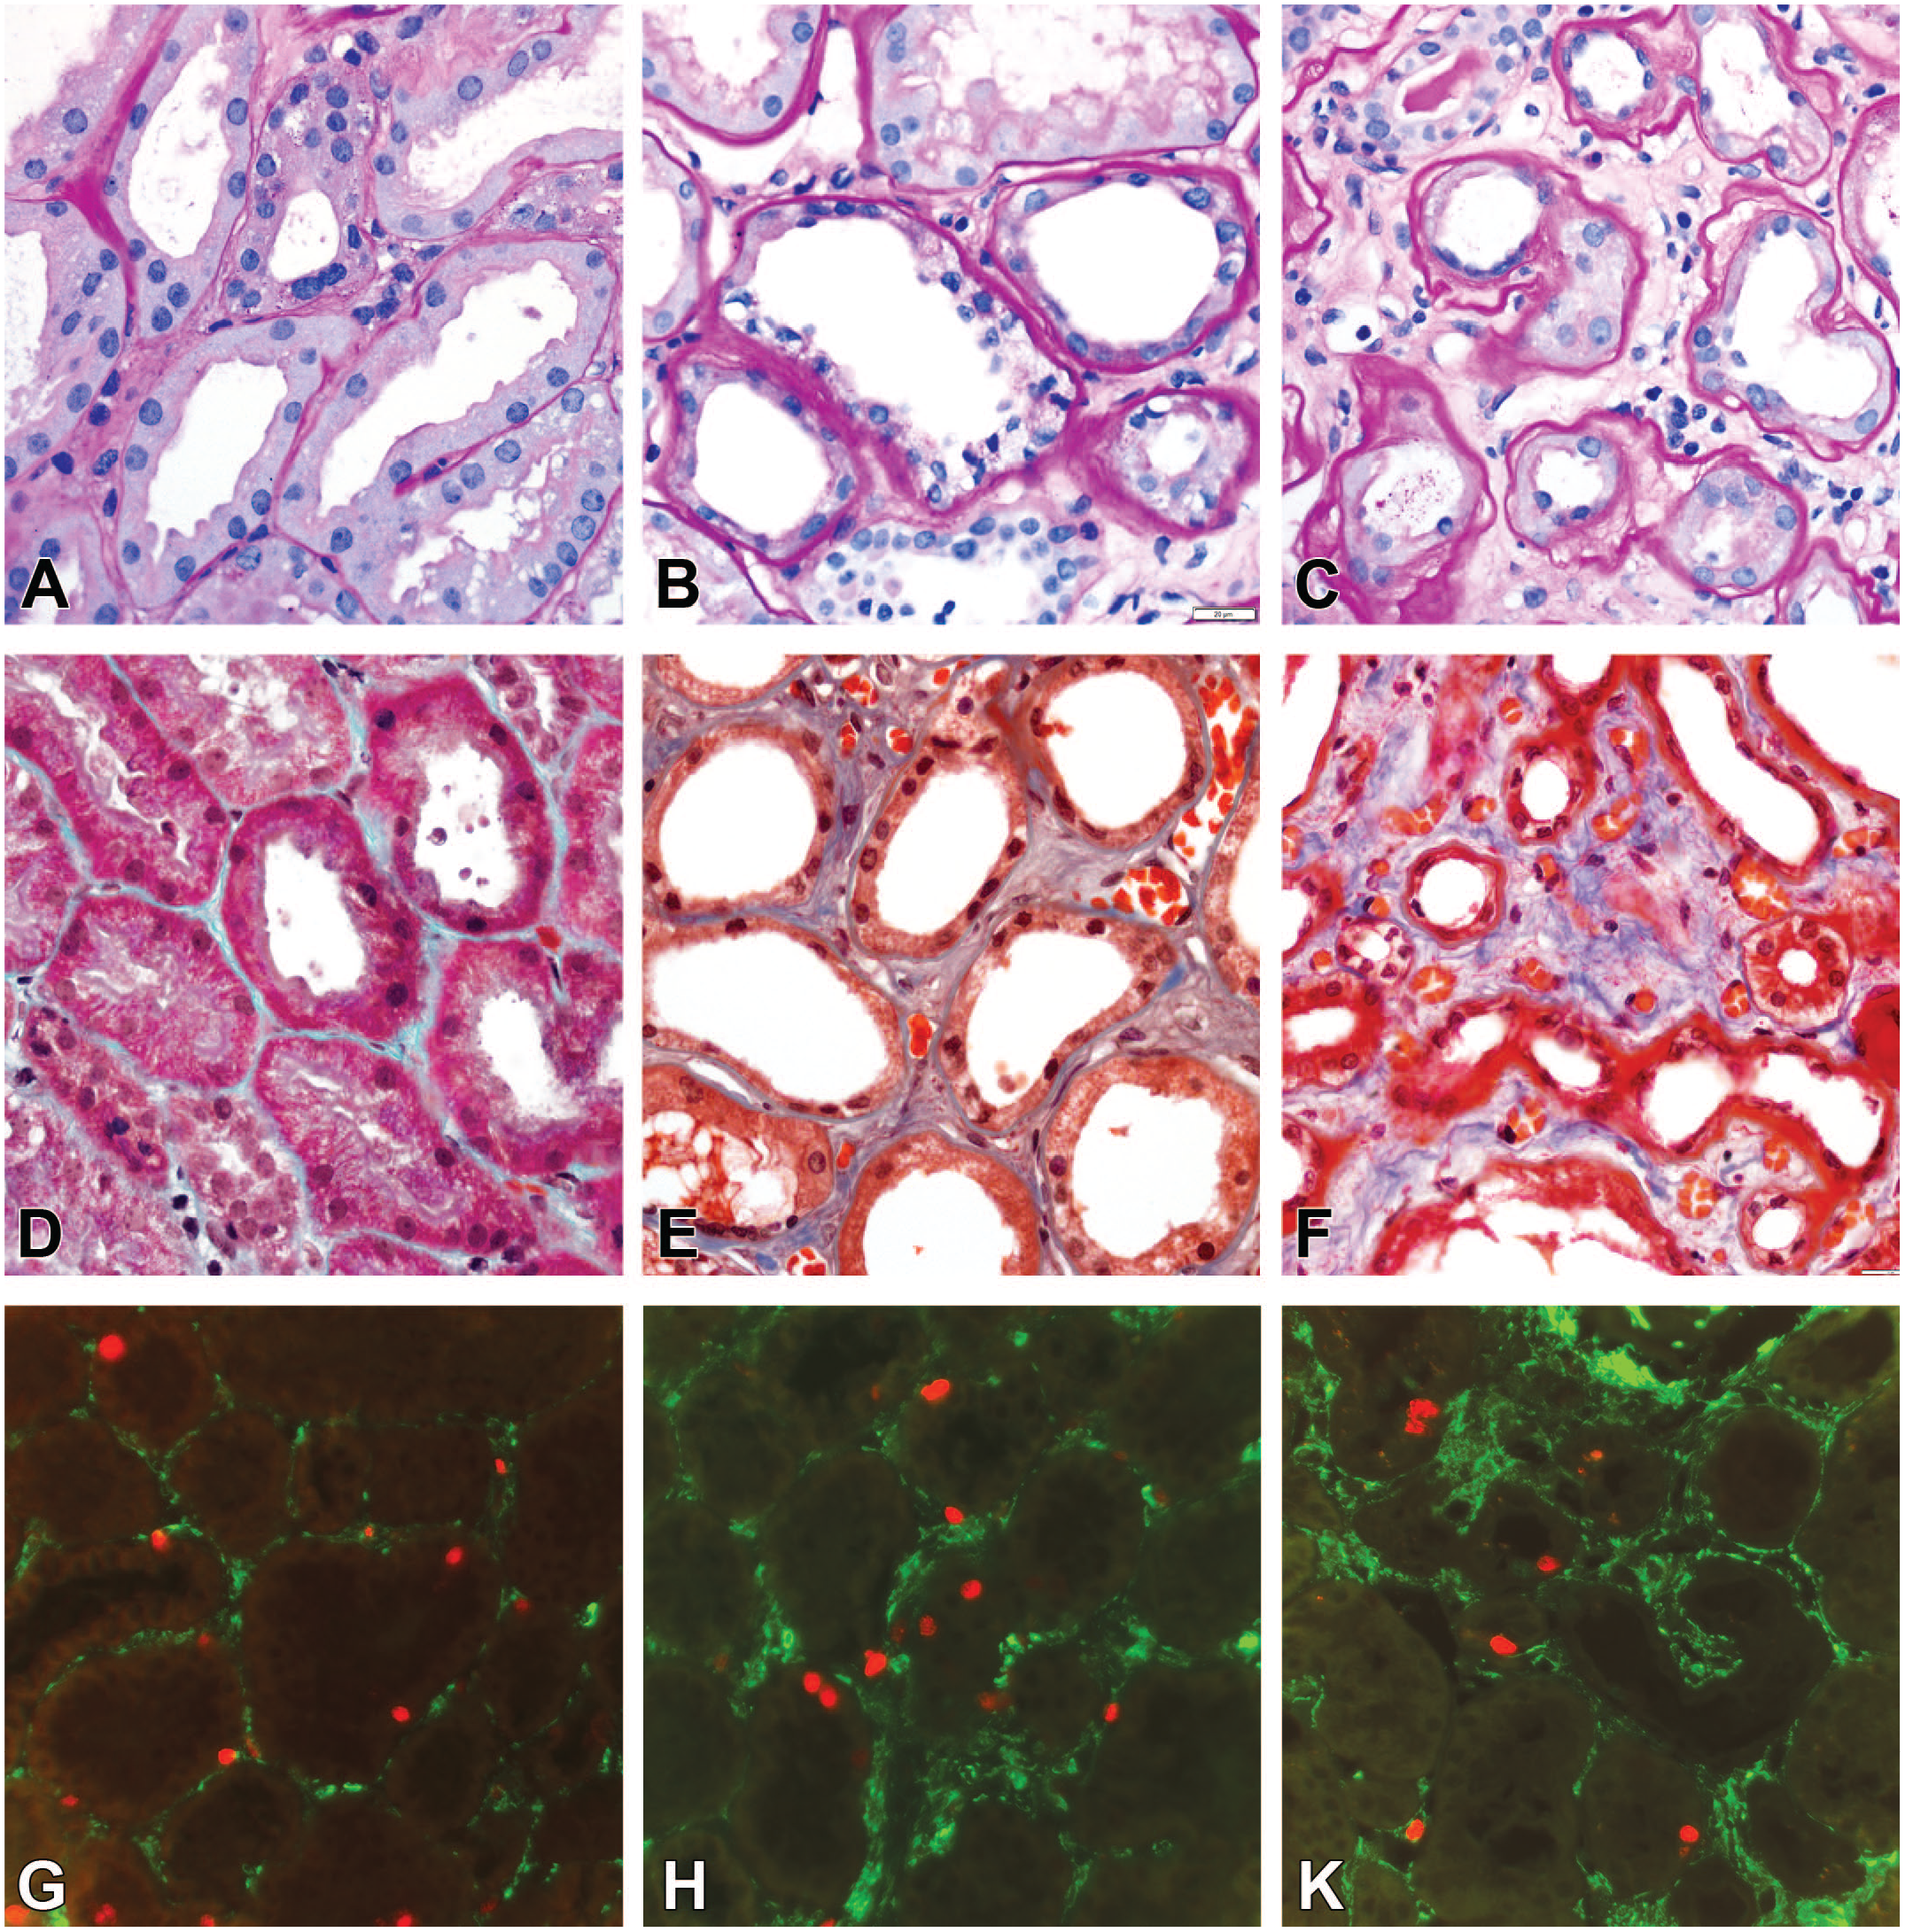
Representative images of hypertensive tubulopathy in humans. (A) and (D) Normal tubular epithelium, basement membranes, and the interstitium. (B) and (E) The classic pattern of tubular atrophy: thickening and wrinkling of the basement membranes; tubular lumens appear distended due to flattened tubular epithelium; fibrotic tissue and mononuclear cells are slightly increased in the interstitium. (C) and (F) Flattened tubular cells and diminished lumens in progressive lesions. The atrophy of tubules is accompanied by expansion of the fibrotic tissue and nonspecific scattered mononuclear cell infiltrates. (G), (H), and (K) Immunofluorescence of Ki-67 (red) in the tissue sections consecutive to (A-C.) Low proliferative activity in tubular cells. The majority of α-smooth muscle actin–positive cells (green) were negative for Ki-67. (A-C) Periodic acid-Schiff; (D-F) trichrome staining.
In human studies, lesional variables are semi-quantified with distribution and/or severity descriptors because it is more practical for scoring small needle biopsies. Because whole kidneys are available in animals, each lesional variable was quantified with image analysis used in our previous studies.37,45,46 The morphometry protocol quantified the following lesional descriptors: tubular atrophy, interstitial fibrosis, interstitial cellularity, and proliferative activity of the tubular epithelium and interstitial cells. First, to compare animal to human data, tubular atrophy was semi-quantified according to a commonly used score: score 0, no lesions; score 1, less than 25% of the tubules in the cortical area involved; score 2, 25% to 50% of the tubules involved; score 3, more than 50% of the tubules involved. 42 Data were collected from 20 cortical nonconfluent fields for each kidney section (600-800 measurements per group), with original objectives 10X for rats and 20X for mice, on PAS-stained sections. Second, to measure tubular atrophy more precisely,10,47 the volume density (volume fraction) of the walls and lumens of the proximal tubules and the interstitium were obtained by the point-counting method and the following standard stereological formula: Vv = p/P, where Vv is the volume density, p is the sum of the number of points hitting the structure, and P is the total number of points in a 100-point test grid. The volume density is expressed as the mean interstitial volume density (IVD), the lumen volume density (LVD), and the tubular wall volume density (TWVD). The counting was done on PAS-stained sections in the areas confined to proximal and distal convoluted tubules while the collecting tubules and ducts, glomeruli, arteries, and veins were omitted. Interstitial fibrosis was defined as Masson’s trichrome staining positive areas and quantified using threshold adjustment and segmentation as the area percentage in the cortex. 47 Interstitial infiltration was quantified on hematoxylin and eosin–stained sections by counting the number of interstitial cells in tubular regions only, avoiding glomeruli and vessels. 22 Number of Ki-67-positive cells, that is, LPA, was counted within the cortex separately for the tubular epithelium and interstitial space. 36 Data were collected from 10 cortical nonconfluent fields for each kidney section (300-400 measurements per group), at the original magnification 40X. Experimental data were compared with reference values in humans obtained in clinical studies (Supplementary Table 4).
Statistical Analysis
Differences between the two groups were recognized by unpaired t test with Welch’s correction. For more than two experimental groups, one-way analysis of variance was applied, followed by post hoc comparisons (t test). Distribution was assessed by Kolmogorov-Smirnov, D’Agostino & Pearson, and Shapiro-Wilk tests, while outliers were identified by the combined robust regression and outlier removal method. Prism GraphPad software version 8.4.0 (GraphPad Software, San Diego, CA, USA) was used for statistical analyses. Data are presented as means ± SEM, P < .05 was regarded as significant.
Results
There were no differences between control and hypertensive animals in body and kidney weights. As previously reported, all models developed stable hypertension and mild impairment in renal function. 3
Hypertensive Tubulopathy in the Mouse Models
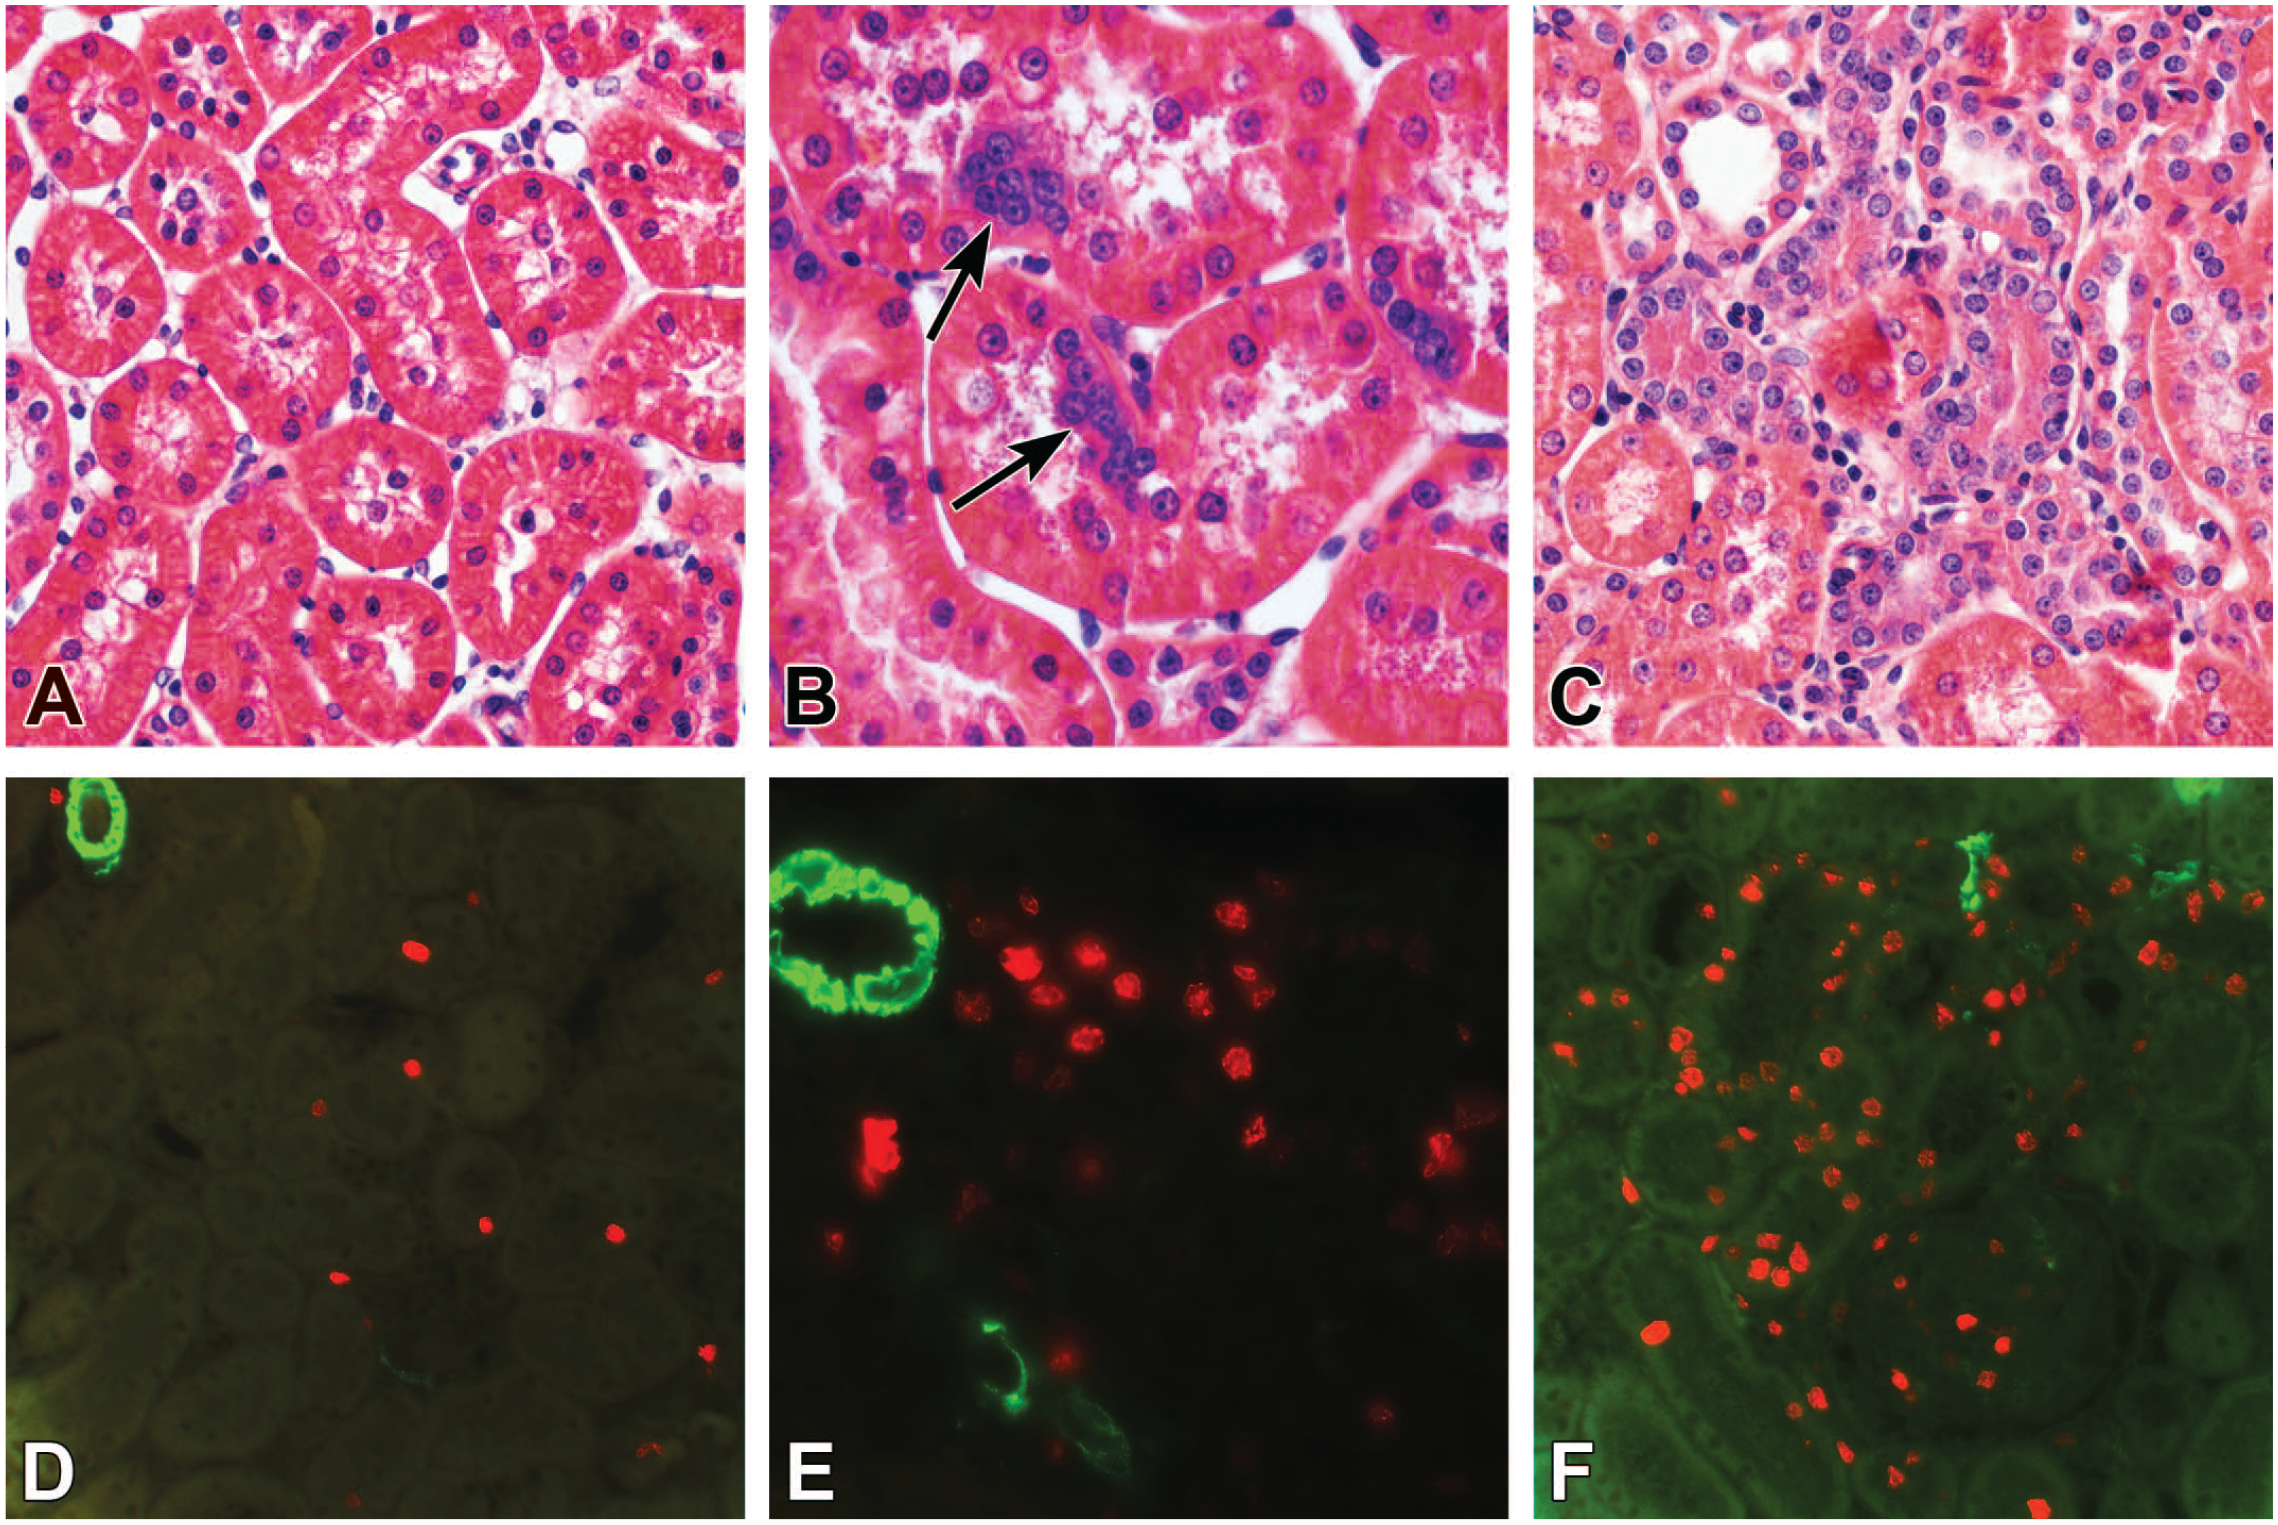
Prolonged hypertension in Ang II–infused mice had minimal effects on the tubular compartment, with no evidence of tubular atrophy, interstitial fibrosis, or interstitial infiltration (Supplementary Figure 1(B) and (E)). The tubular atrophy score was not changed compared to control, and the point counting method did not reveal differences in tubular structure (Figure 2(A) and (B)). An increase in interstitial collagen (~6-fold) was detected in Ang II–infused mice by morphometry in trichrome-stained slides and appeared as a homogeneous diffuse fibrillary thickening in the intertubular space (Figure 2(C) and Supplementary Figure 1(B) and (E)). The 6-fold increase was statistically significant and could be considered very high if compared with healthy control values, which were close to zero. However, the enhancement was small compared with the 40-fold increase observed in humans (Figure 2(C)). The number of interstitial cells was stable (Figure 2(D)). Some Ang II–infused mice exhibited spots of eosinophilic droplet accumulation in the form of abundant PAS-positive granules in the proximal and collecting tubules (Figure 3(A)). Proliferating tubular epithelial cells were randomly scattered within the renal cortex (Figure 4(A) and (B)). Ang II infusion caused a 3-fold increase in the number of Ki-67-positive cells in both the tubular epithelium and the interstitium, compared with control mice. All data sets demonstrated a normal distribution (Figure 5(A) and (B)).
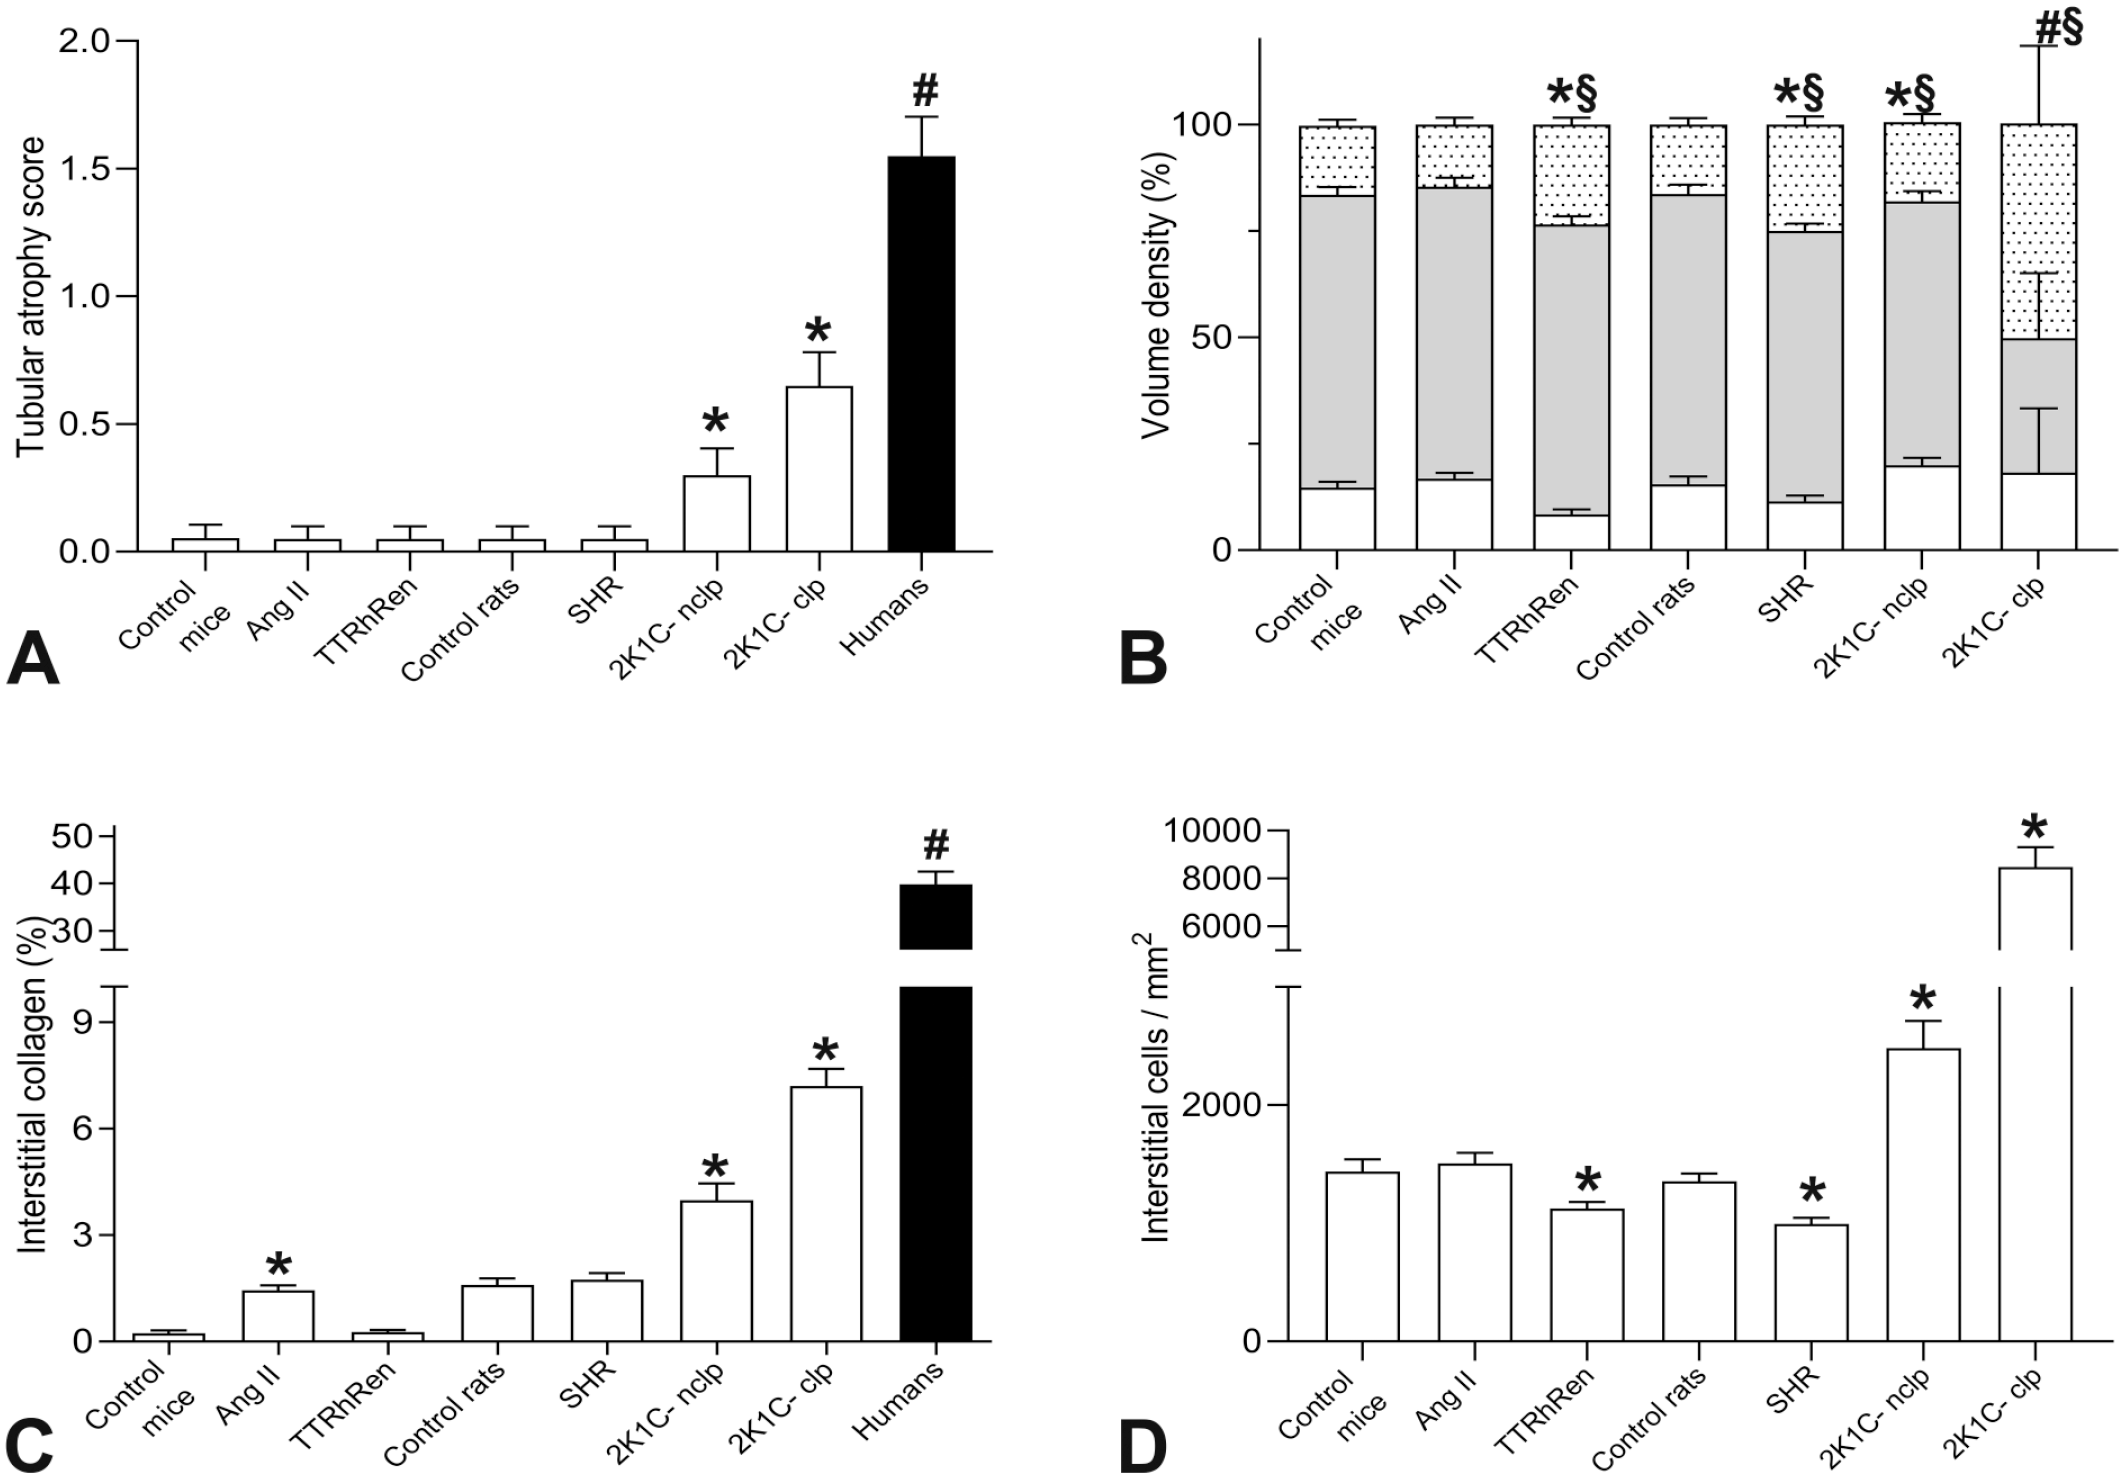
Tubulopathy in hypertensive models was significantly lower compared with humans. (A) The severity of tubular atrophy was semi-quantified by the scoring method. Among groups, only the clipped and nonclipped kidney manifested the severity comparable to humans *P < .001 versus control; #P < .0001 versus 2K1C-clp. (B) The volume density of the tubular components is estimated by the point counting technique. The whole bar represents the cortical volume as the sum of the interstitial (dotted part), tubular wall (gray part), and tubular lumen (white part) volume. P < .01 versus control for tubular lumen (⋇), tubular wall (#), and interstitium (§) volume, respectively. (C) Interstitial fibrosis as the percentage of collagen-positive area in trichrome-stained sections. *P < .01 versus control mouse or rat kidneys. Human data are reference values (Supplementary Table 4). (D) The number of interstitial cells is mildly reduced in TTRhRen and SHR models but significantly increased in 2K1C rats. *P < .005 versus control mouse or rat kidneys. Data are mean ± SEM. Ang II, angiotensin II–infused; TTRhRen, renin-overexpressing mice; SHR, spontaneously hypertensive rats; 2K1C-nclp and 2K1C-clp, nonclipped and clipped kidneys, respectively.
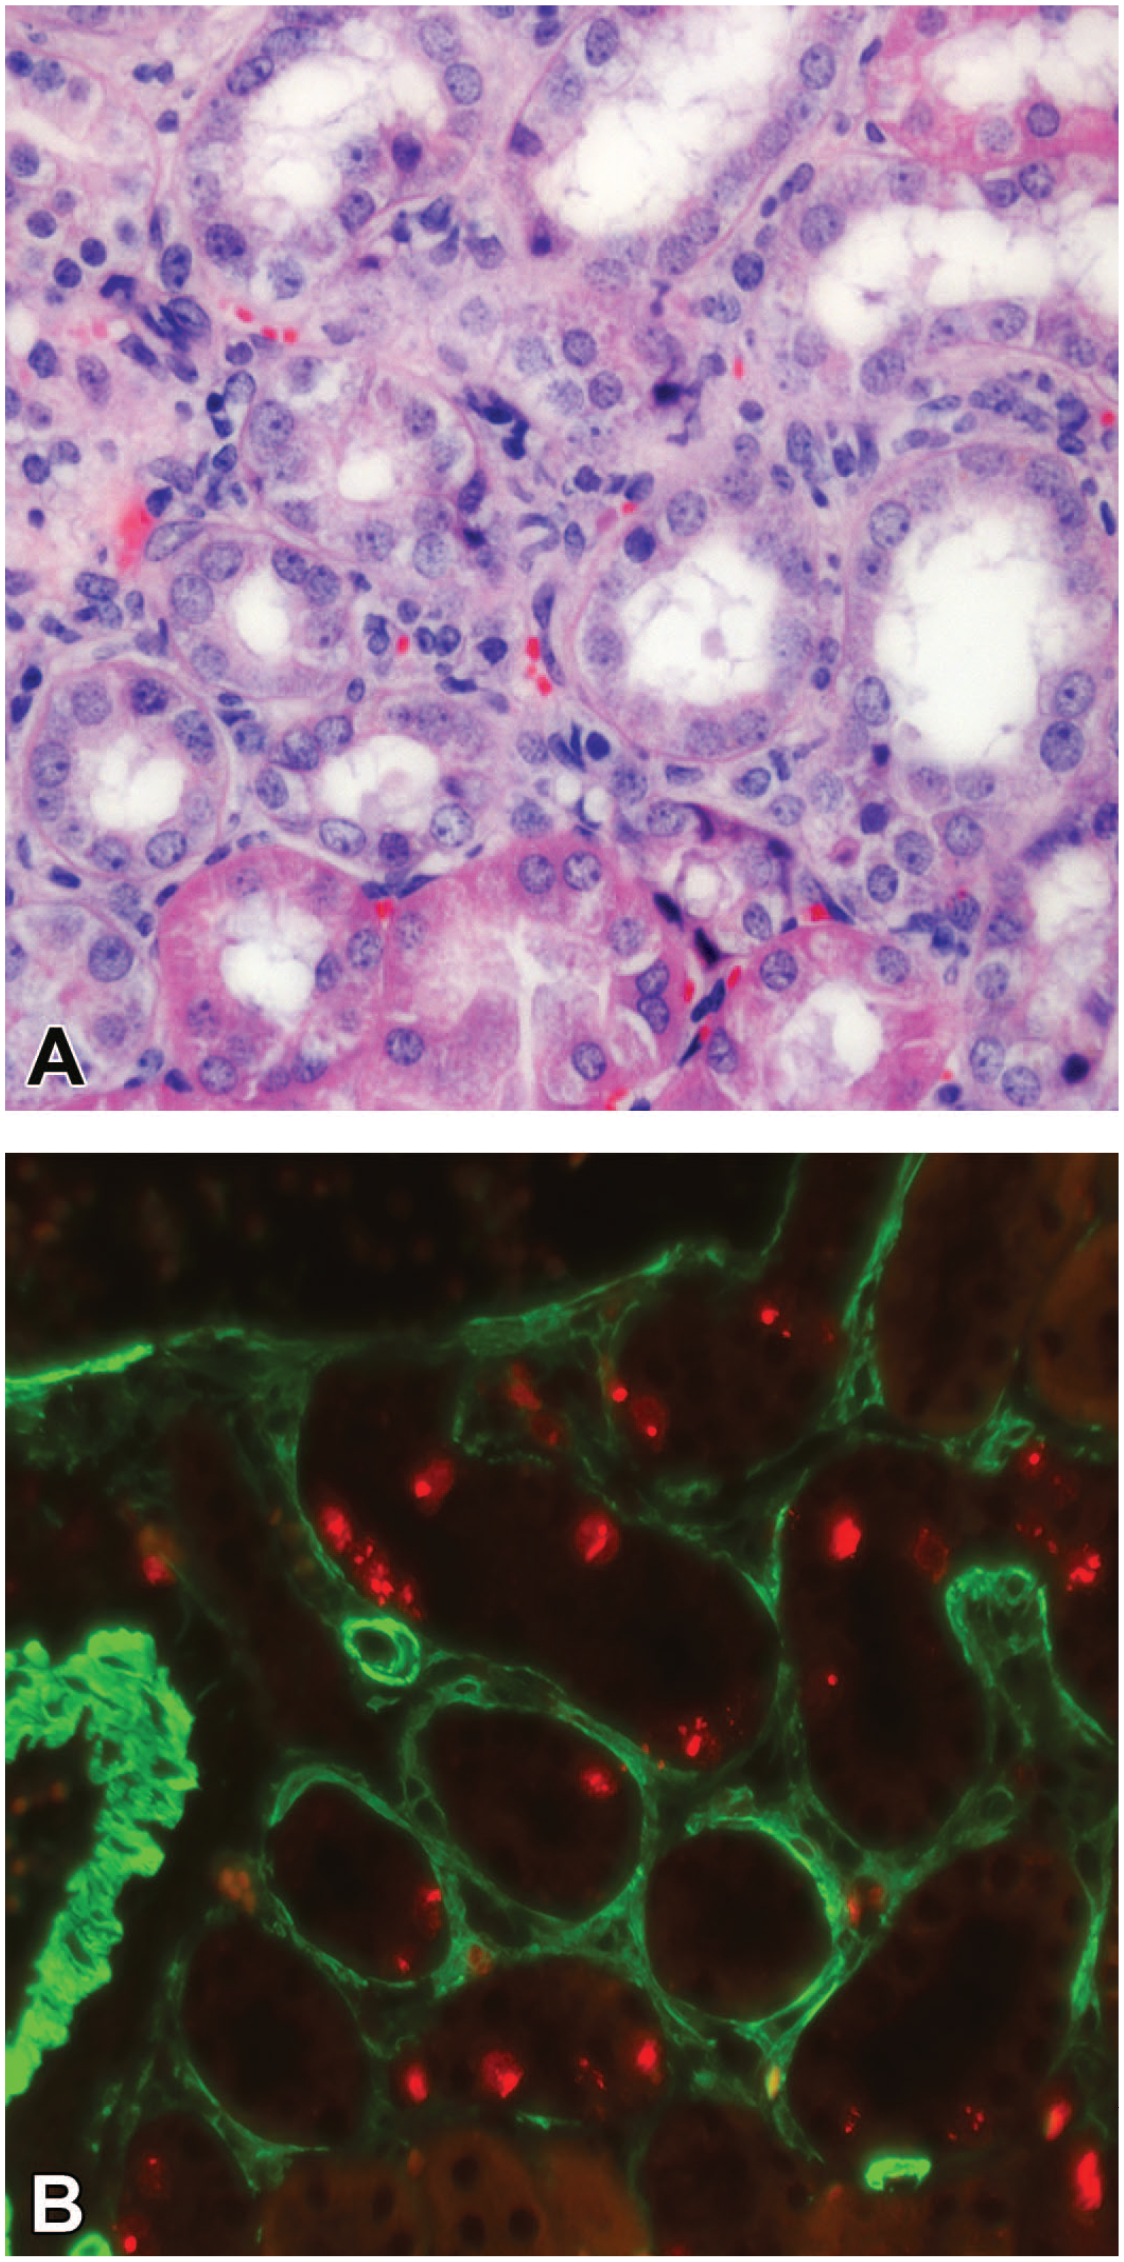
Histopathological lesions in angiotensin (Ang) II–infused mice. (A) Spots of eosinophilic granules were found occasionally in Ang II–infused mice as the cytoplasmic accumulation of PAS-positive droplets in the proximal and distal tubular epithelium. (B) The focus of chronic progressive nephropathy in Ang II–infused mice. Atrophic and dilated tubules with flat epithelium (asterisks) neighbor to multinuclear shrunken tubules (arrows) with tortuous thickened basement membranes. Interstitial space is distended by loose fibrotic tissue containing monocytes, macrophages, and lymphocytes. (D) Immunofluorescence of Ki-67 (red) in a tissue section consecutive to (B). The epithelium contains numerous proliferating tubular epithelial cells (arrows), while the interstitium has few proliferative cells. α-smooth muscle actin (green) demarks a renal artery (asterisk) and activity of myofibroblasts in the interstitium. (C) The boxed area in (B). In a shrunken proximal tubule, the tubular cells demonstrate prophase, anaphase, and telophase simultaneously (arrows). (A) and (C) Periodic acid-Schiff staining. PAS, periodic acid-Schiff.
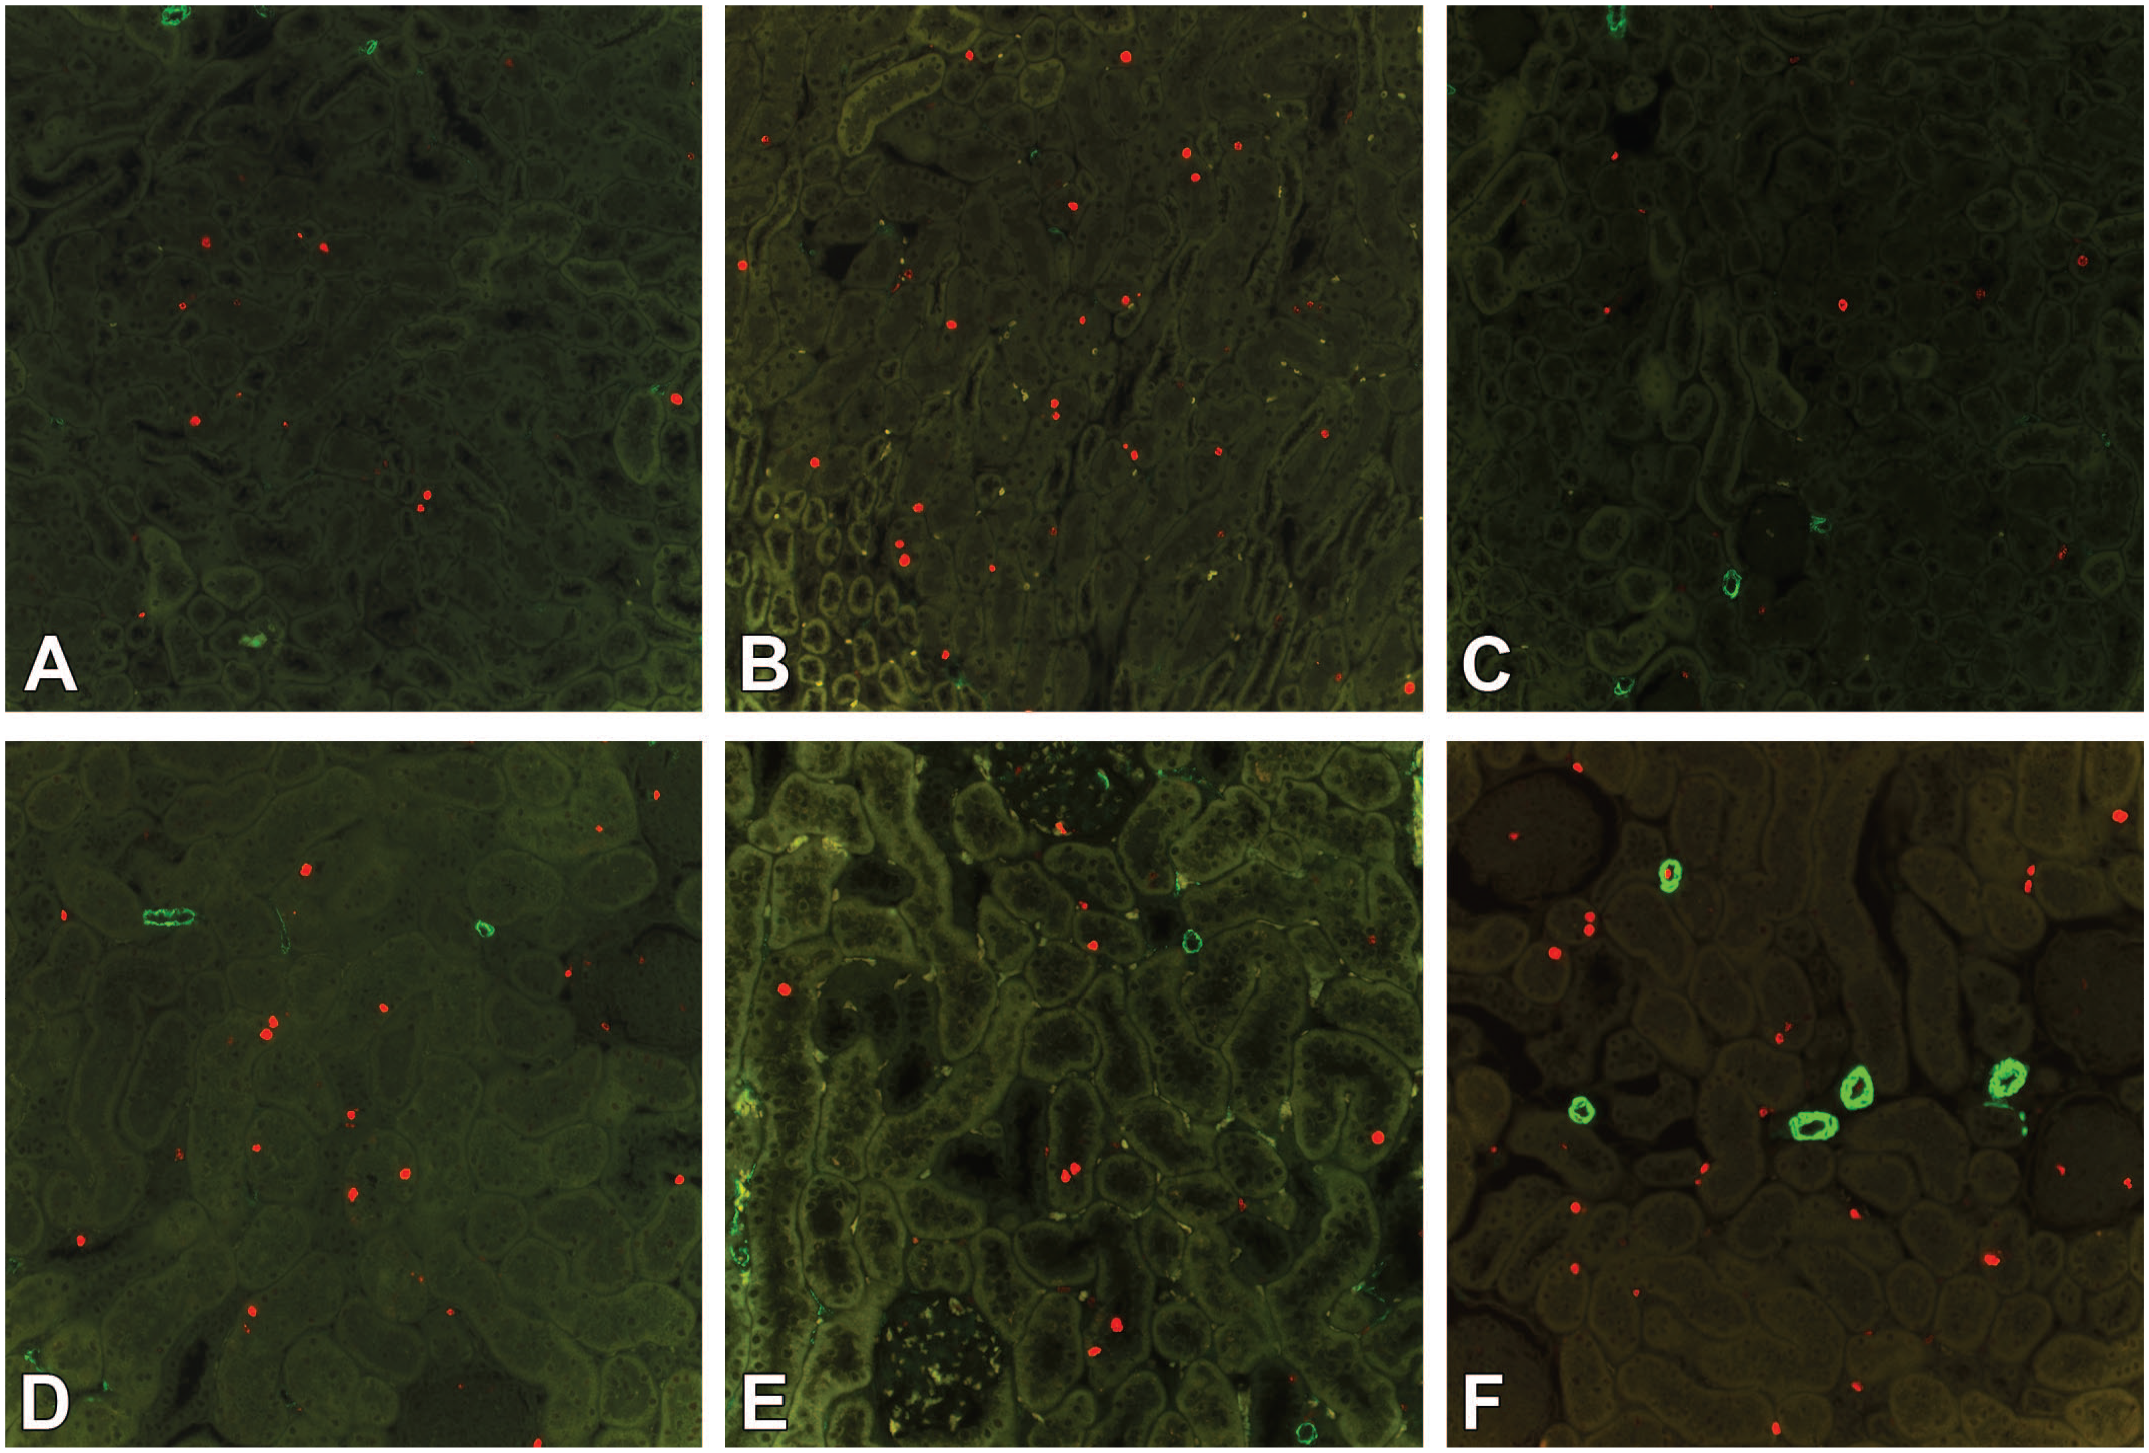
Anti-Ki-67 immunostaining of the cortical area. (A) Control mice have a low level of proliferative activity. (B) Angiotensin II–infused mice. Proliferating cells within the renal cortex increased randomly and evenly in the tubules and interstitium. (C) Renin-overexpressing mice with few positively stained nuclei. (D) Control rats. (E) Spontaneously hypertensive rats. (F) Areas in the nonclipped kidney, free from chronic progressive nephropathy, contain an increased number of proliferative cells in the tubules and interstitium. Ki-67 (red), α-smooth muscle actin (green).
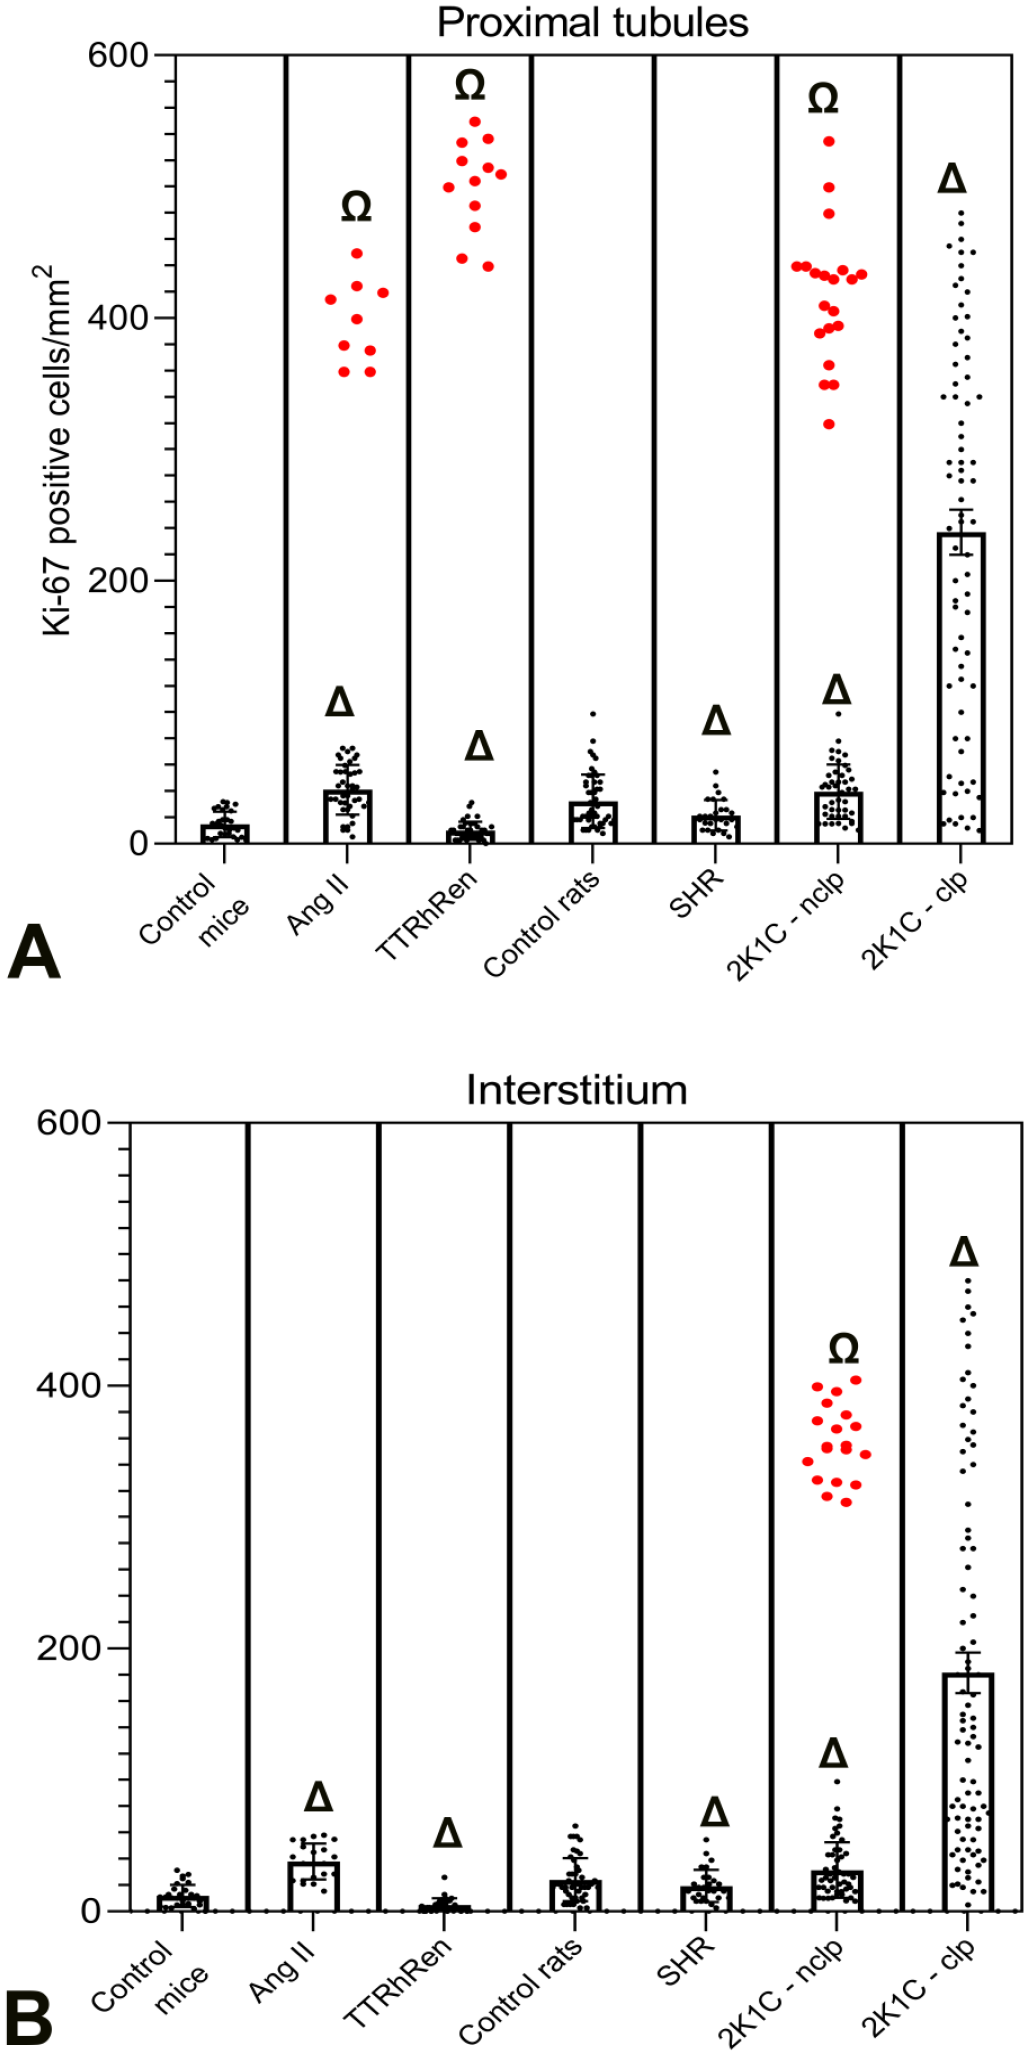
Local proliferative activity (LPA) data for each model. (A) Number of Ki-67-positive cells in the tubular epithelium. (B) Number of Ki-67-positive cells in the interstitium. The data sets for angiotensin (Ang) II–infused mice, renin-overexpressing mice (TTRhRen), and nonclipped kidneys (2K1C-nclp) contained outliers from the normal distribution (red dots) with higher values for LPA. P < .001 versus control for mean values (Δ), or for outliers from a set of values (Ω), respectively. SHR, spontaneously hypertensive rats, 2K1C-clp, clipped kidneys.
Nevertheless, few foci of frank CPN lesions were found, although they occupied only ~0.01% of the cortex. The lesions contained atrophic tubules with epithelial hyperplasia surrounded by thickened wrinkled basement membranes and loose fibrotic tissue with mononuclear cell infiltrates (Figure 3(B)). Importantly, the proximal tubules contained clusters of proliferating epithelial cells (Figure 3(C) and (D)). Their LPA data stood out of a normal distribution and were identified as outliers, with values ~9-fold higher than the mean value in the rest of the cortex, and ~24-fold greater than in control, as a characteristic feature of CPN 36 (Figure 5(A)).
In TTRhRen mice, conventional microscopy did not identify tubular atrophy, interstitial fibrosis, and interstitial infiltration. The tubular atrophy score was not different from control animals (Figure 2(A) and Supplementary Figure 1(C) and (F)). Nevertheless, morphometry revealed substantial structural tubular changes in TTRhRen mice. The mean IVD was greatly increased (+45%), while LVD was significantly reduced (−43%), with no change in TWVD (Figure 2(B)), that is, proximal tubules had narrower lumens but the same thickness of the epithelial layer, whereas interstitial space was expanded. Interestingly, the significant expansion of the interstitial space did not affect the amount of interstitial collagen but was associated with a mild reduction (−22%) in the number of interstitial cells (Figure 2(C) and (D) and Supplementary Figure 1(C) and (F)). LPA was significantly diminished in tubular epithelium (−31%), and even more in the interstitium (−42%) of TTRhRen mice than control (Figures 4(C) and 5(A) and (B)). Areas of CPN lesions occupied more area than in Ang II–infused mice and were found in ~3.7% of the scanned cortex area in the form of epithelial basophilia, nuclear crowding, basement membrane thickening, and mononuclear infiltration (Figure 6(A)). In contrast to the random distribution of Ki-67-positive cells within the renal cortex (Figure 4(C)), those foci contained tubular segments with LPA ~47-fold higher than the mean value in the rest of the cortex, and ~34-fold greater than in control mice. Their values were identified as outliers from a normal distribution (Figures 5(A) and 6(B)). A more precise analysis demonstrated that local zones of enhanced LPA were found even in tubular epithelial cells that appeared completely normal with routine staining (Figure 7(A) and (B)). Importantly, interstitial monocytes did not invade the tubular basement membranes and tubular epithelium—that is, histopathological signs of tubulitis were absent (Figure 8(A) and (B)).
Areas of chronic progressive nephropathy (CPN) in renin-overexpressing mice. (A) Progressing tubular alterations and interstitial monocyte infiltration. (B) CPN was verified with immunofluorescence in consecutive sections demonstrating enhanced Ki-67 (red) in tubular cells. Fibrotic interstitium contains only a few proliferating cells and abundant α-smooth muscle actin–positive myofibroblasts (green). (A) Periodic acid-Schiff staining.
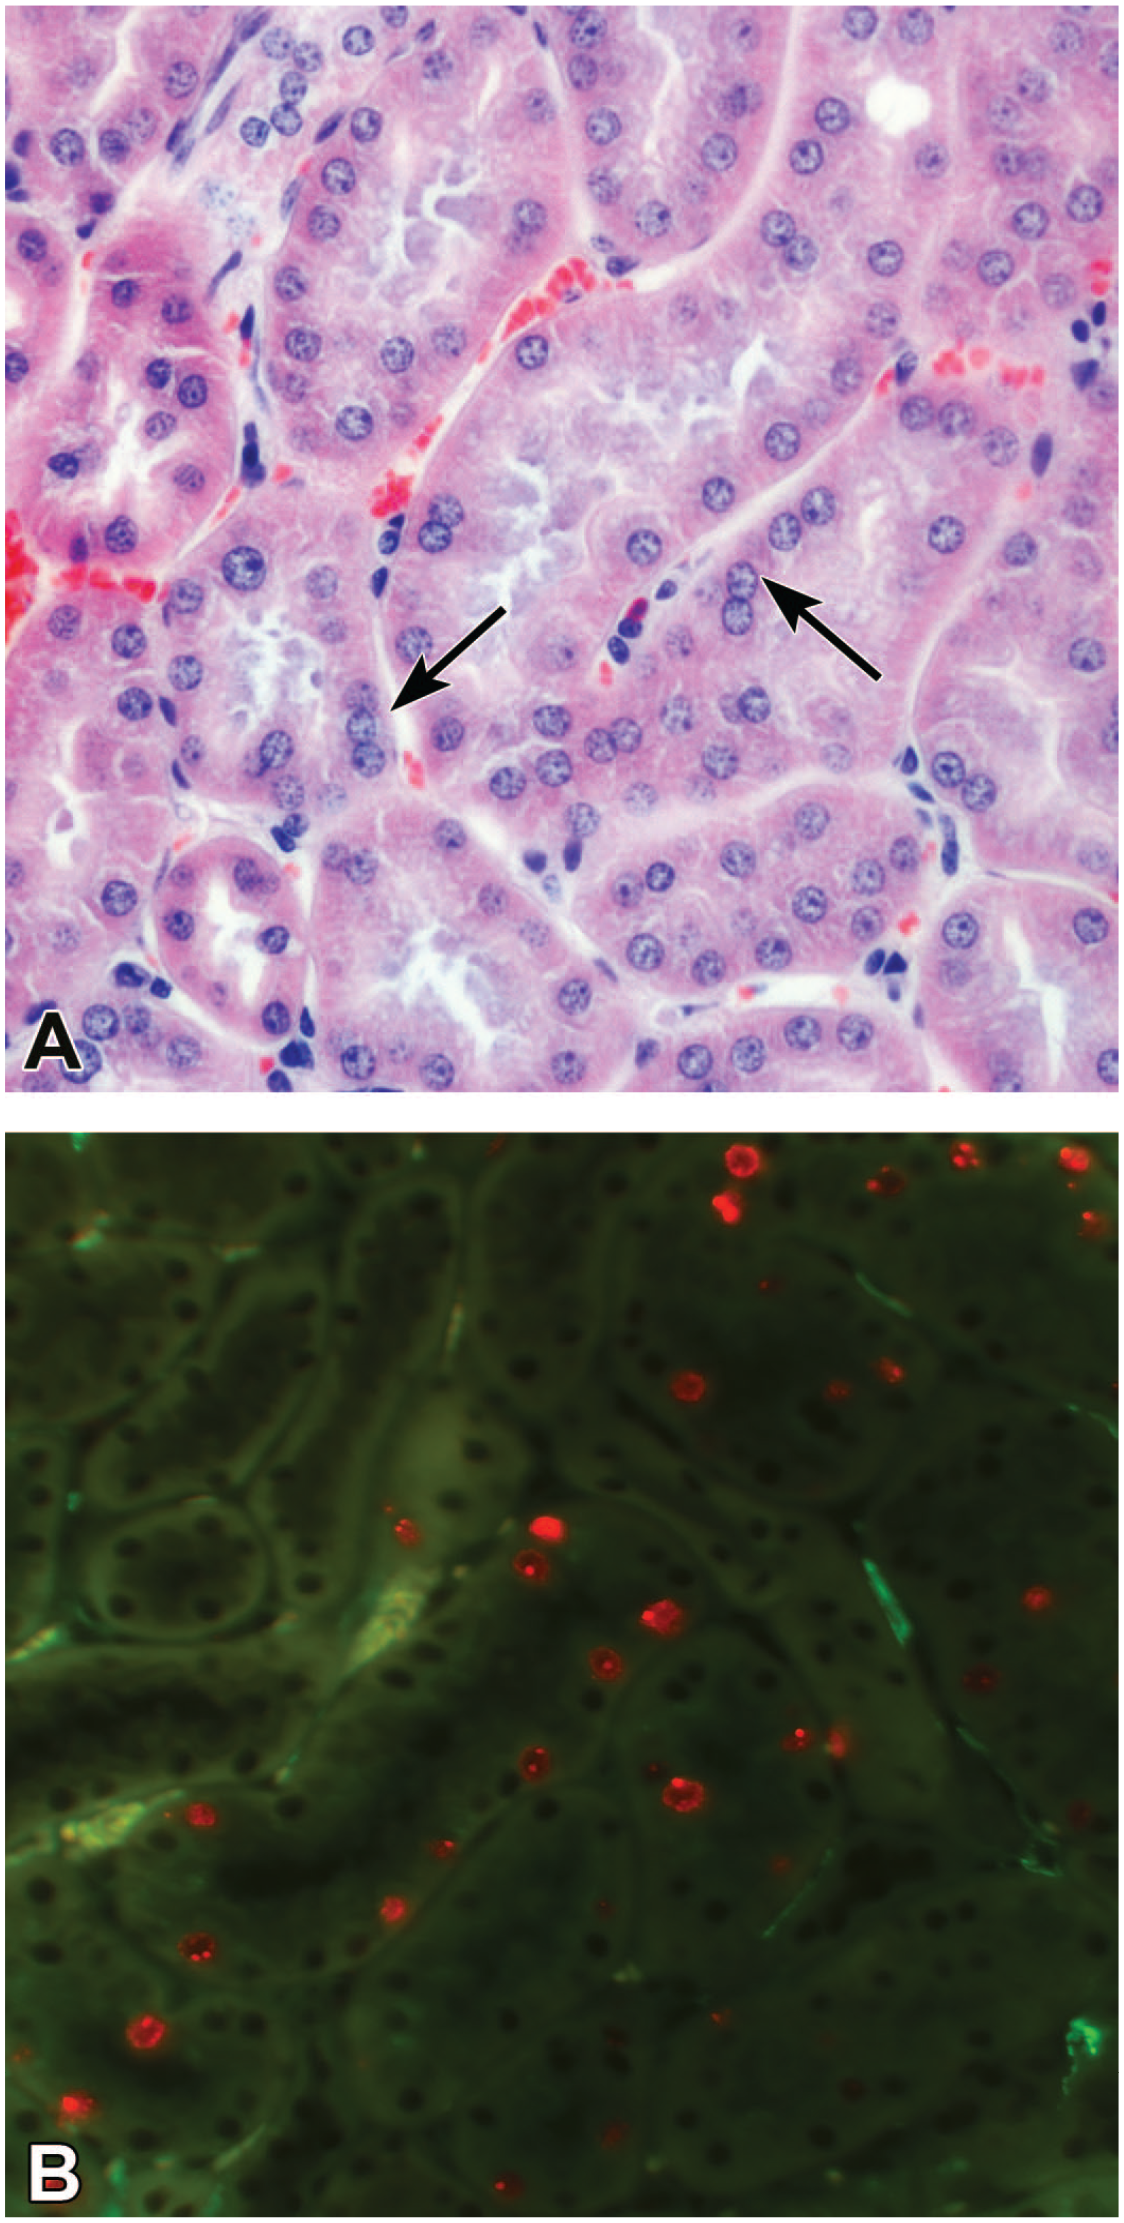
Early stages of chronic progressive nephropathy in renin-overexpressing mice. (A) Initial nuclear crowding is barely recognizable with routine PAS staining (arrows). (B) Immunofluorescence of Ki-67 (red) in the same region on the consecutive section clearly demonstrates the beginning of proliferation activity in tubular cells. α-smooth muscle actin (green) is absent in the interstitium, except in small arteries. PAS, periodic acid-Schiff.
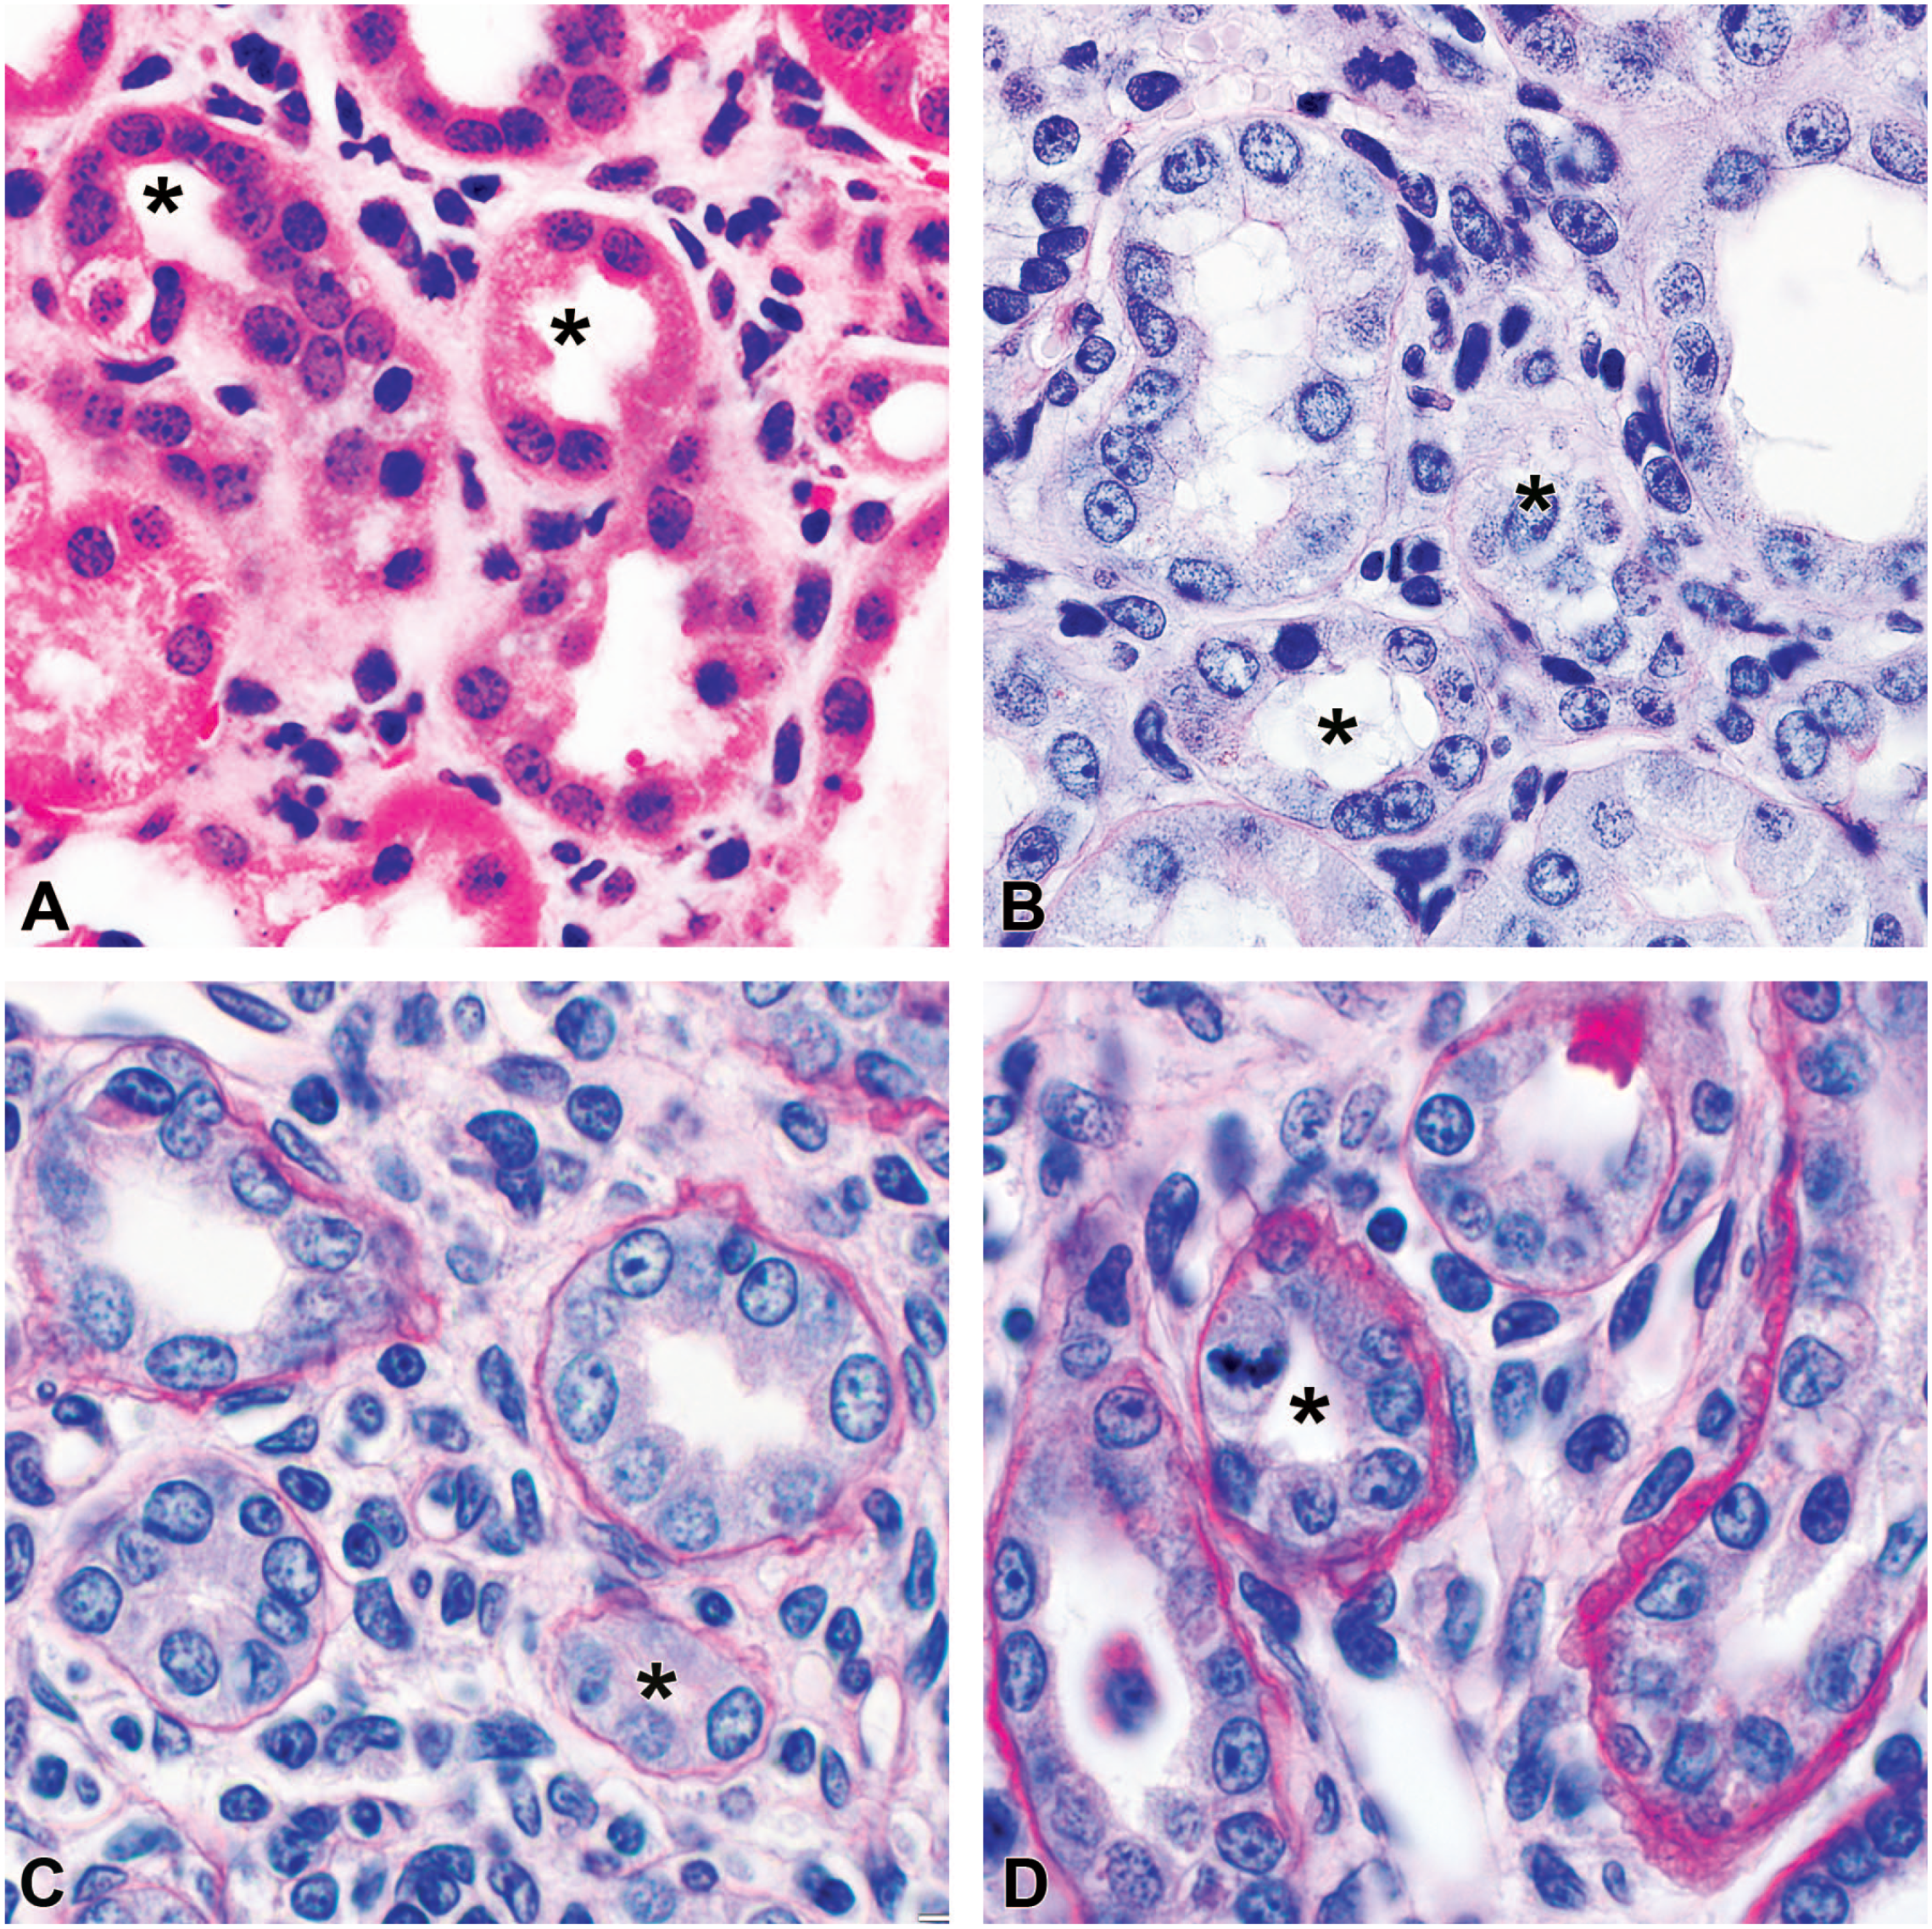
Chronic progressive nephropathy in rodent models corresponds to tubulointerstitial renal disease. The renal cortex demonstrated monocyte infiltration that was essentially limited to the interstitium with minimal evidence of tubulitis. Tubular basement membranes are mostly intact. Interstitial cells did not invade the tubular epithelium even in advanced lesions when tubular size was significantly reduced (asterisks) due to atrophy. (A) and (B) Angiotensin II–infused and renin-overexpressing mice; (C) and (D) the nonclipped and clipped kidneys in rats, respectively. (A) Hematoxylin and eosin, (B-D) periodic acid-Shiff staining.
Glomerulopathy was analyzed and reported in our recent study. 3 In both mouse models studied, the areas with developing CPN glomeruli were intact and not involved in surrounding lesions (Supplementary Figure 3).
Hypertensive Tubulopathy in the Rat Models
SHR demonstrated minimal involvement of the tubular compartment during chronic hypertension with no signs of tubular atrophy, interstitial fibrosis, and interstitial infiltration, and normal appearance of tubular epithelial cells, tubular basement membranes, and interstitial space (Supplementary Figure 2). The tubular atrophy score was not different from control rats (Figure 2(A)). Morphometry data were similar to TTRhRen mice: IVD was greatly expanded (+54%), whereas LVD was reduced by 26%, with no change in TWVD (Figure 2(B)), that is, similar to TTRhRen mice, proximal tubules in SHR had smaller lumens, the same thickness of the epithelial layer, but expanded interstitial volume, compared with control rats. Of note, the substantial increase in IVD was not confined to either a greater amount of interstitial collagen or the number of interstitial cells. In fact, the number of interstitial cells was mildly reduced by ~27% (Figure 2(C) and (D)). Ki-67-positive cells were randomly and evenly distributed within the tubules and interstitium of the renal cortex, although the number of proliferative cells was significantly lower than in control rats: 32% decrease for the tubules and 40% for the interstitial space (Figures 4(E) and 5(A) and (B)). CPN was not found in this group.
The most significant and complex histopathologic features were observed in 2K1C rats, where more abundant and extensive features of CPN were detected.
In the nonclipped kidneys, early CPN tubular lesions became evident at 6 weeks after surgery (Figure 9). Within the intact renal cortex, small foci of tubular epithelium demonstrated clusters of tubular cells with nuclear crowding but otherwise had a normal appearance. The proliferative cells were randomly distributed within the renal cortex as in control rats, and only a few tubular segments showed an increased LPA. In some areas, they merged into larger zones of basophilic tubules with epithelial hyperplasia and increased mononuclear cell infiltration in the interstitium; LPA in those tubules was estimated to be ~6-fold greater than in control (Figure 9(C) and (F)). Areas involved in CPN occupied ~6% of the renal cortex. At 9 weeks after surgery, approximately 80% of the renal cortex maintained a normal appearance, but subtle changes were detected only with morphometry analysis. LVD and IVD were expanded (+30% and +10%, respectively) with no change in TWVD (Figure 2(B)). Proliferative activity in the renal cortex, free from CPN, was mildly enhanced in the proximal tubules (+22%) and the interstitium (+29%) (Figure 4(F) and 5(A) and (B)). CPN lesion extension varied greatly among animals. The mean size of the cortical area involved in CPN was estimated to be ~20%, while the minimum and maximum varied between 1.2% and 98%, and did not correlate with the severity of histopathological lesions in the clipped kidneys (P > .87) (Supplementary Figure 4). CPN zones contained foci of basophilic tubules with epithelial hyperplasia and a mild presence of monocytes in the interstitium (Figure 10(A), (D), and (G)). LPA in the proximal tubules and interstitium was ~12-fold higher than in control rats, and ~9-fold higher than in the rest of the cortex free from CPN (Figure 5(A) and (B)). Advanced lesions were represented as alternating zones of widespread dense monocyte infiltrates and interstitial fibrosis (Figure 10(B), (C), (E), and (F)). The local mitotic activity in dense cell infiltrates around tubules with hyperplasia was greater than in fibrotic areas (Figure 10(H) and (K)). Morphometry data for the nonclipped kidney reflected the significant presence of CPN in the renal cortex. Only CPN areas were associated with ~1.8-, 2.5-, and 6-fold increased mean values for interstitial cells, interstitial collagen, and tubular atrophy score, respectively (Figure 2(A), (C), and (D)).
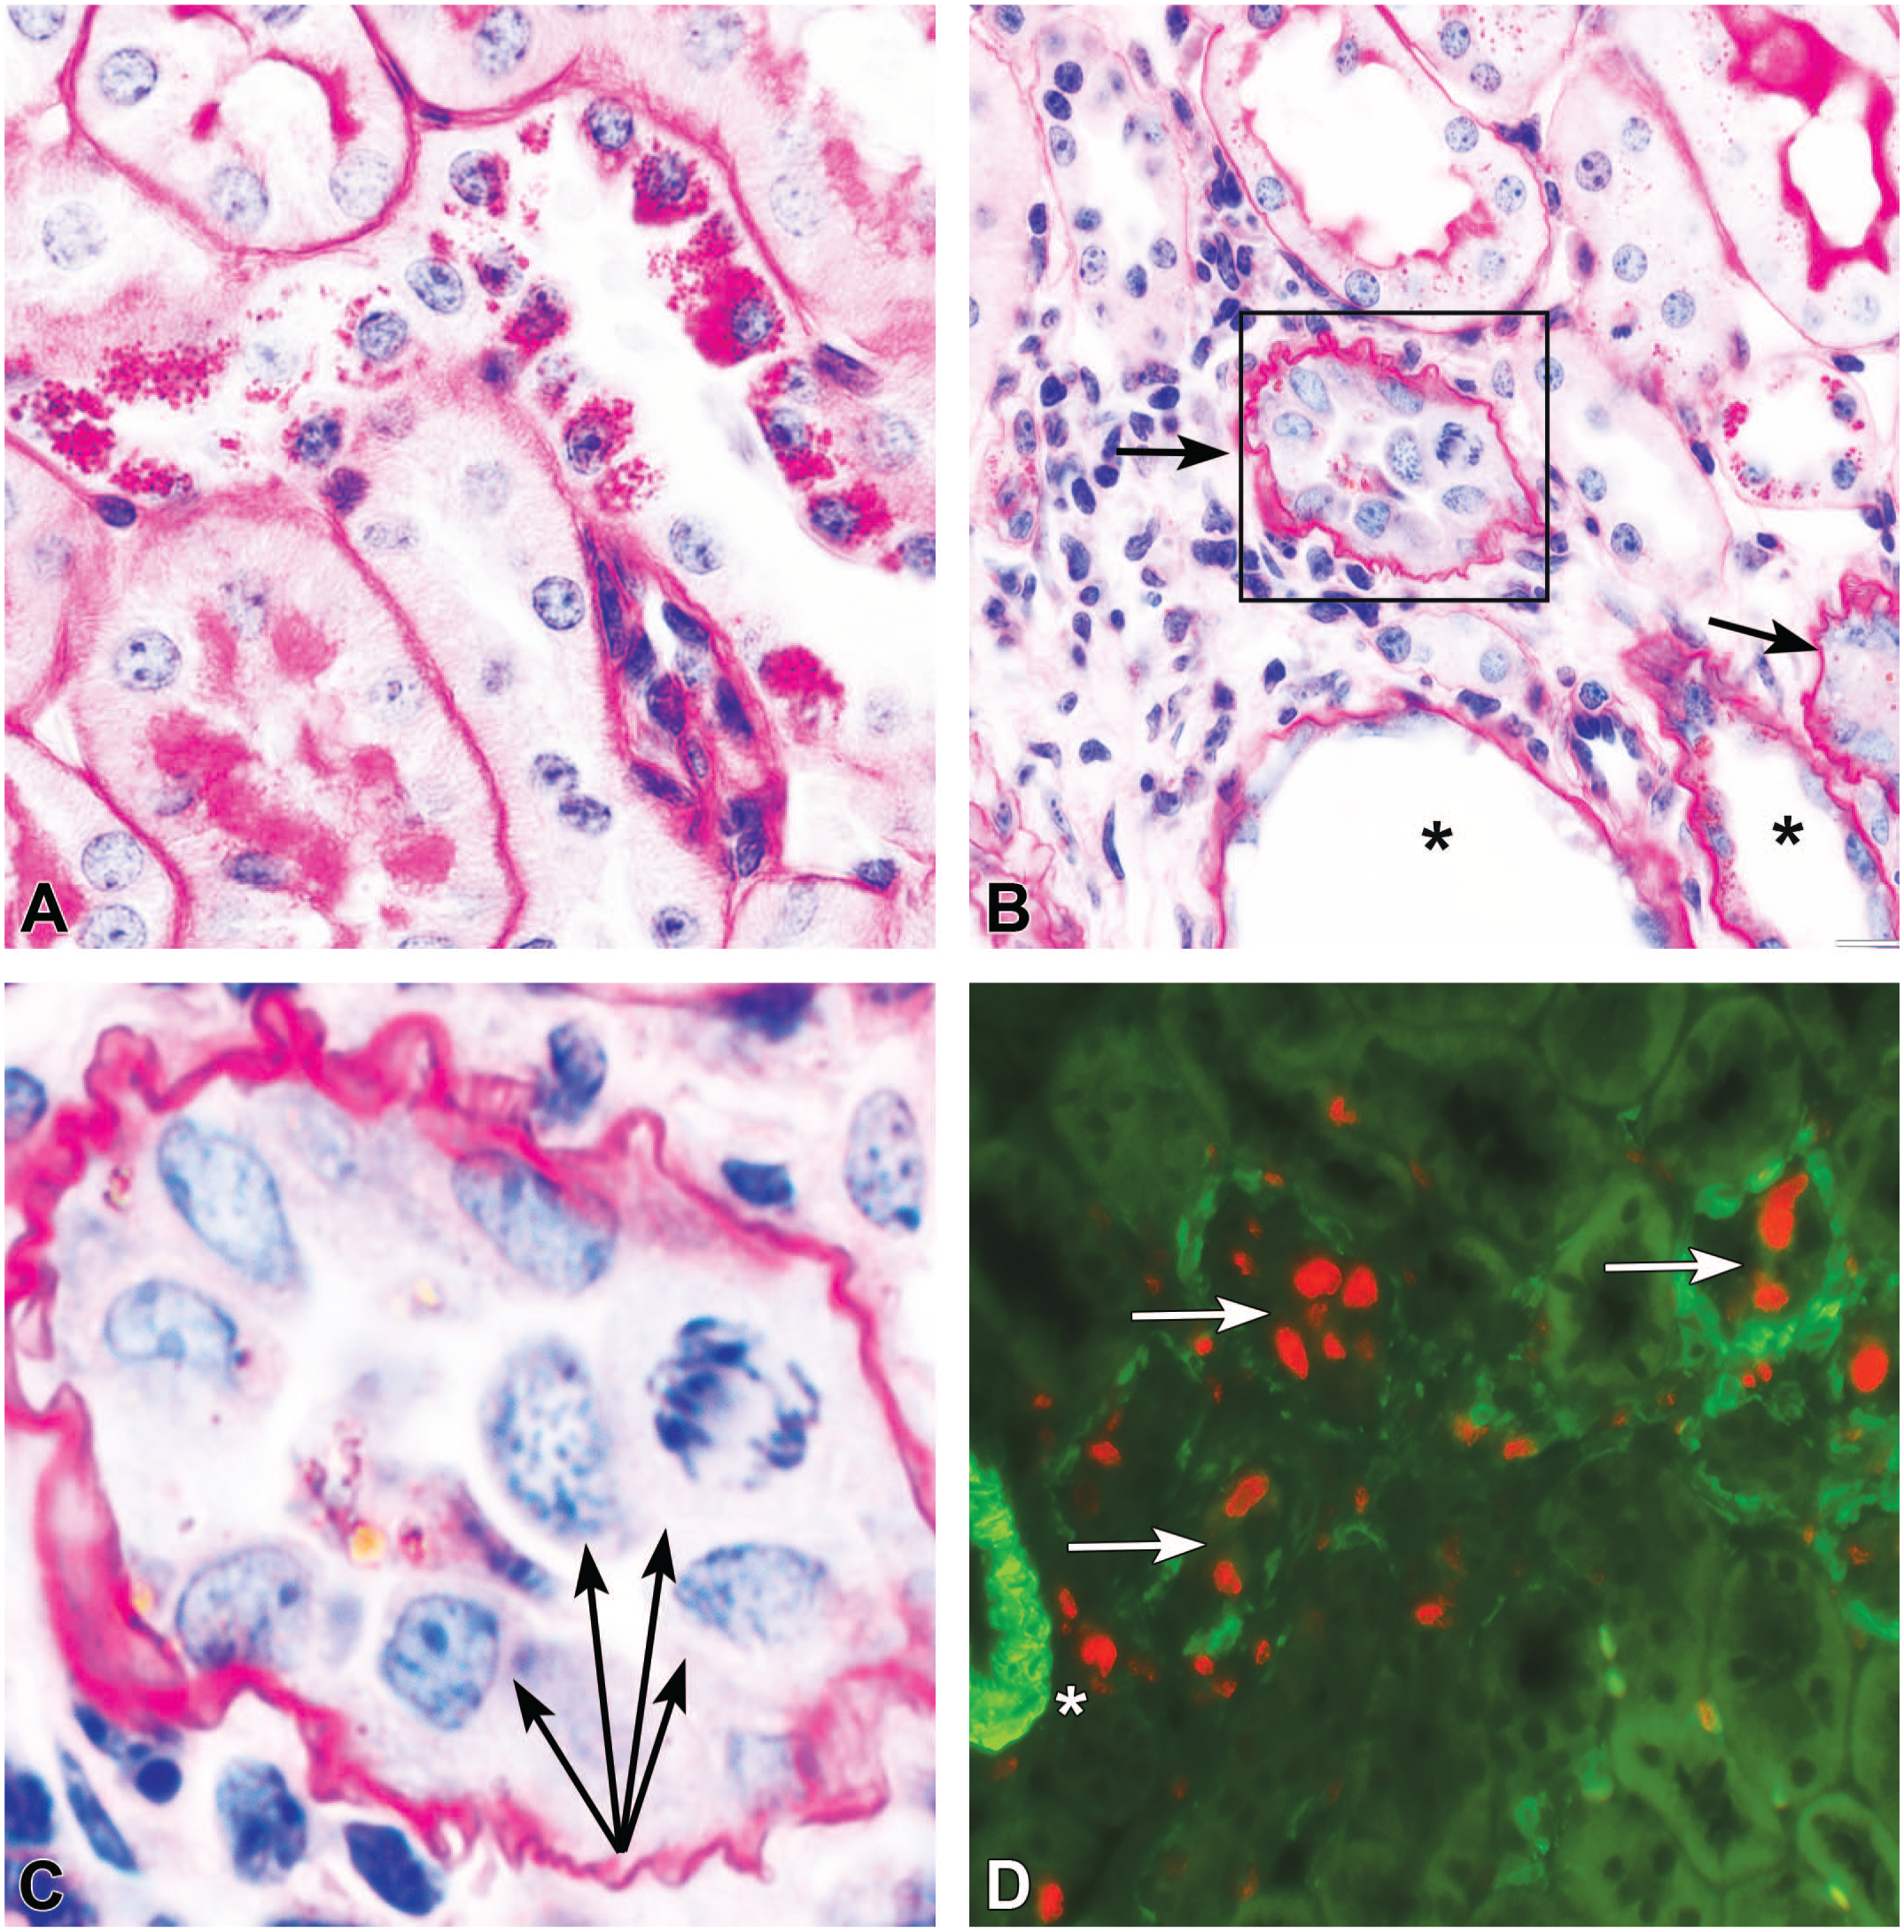
Early signs of chronic progressive nephropathy in the nonclipped kidney at 6 weeks after surgery. (A) Most of the cortex is normal except for slightly edematous interstitial space. (B) Clusters of tubular cells (arrows) containing small nuclei with indistinct cytoplasm, but otherwise normal tubular profiles. (C) Areas of tubular basophilia, nuclear crowding, and mild interstitial monocyte infiltration. (D-F) Immunofluorescence of Ki-67-positive nuclei in the tissue sections consecutive to (A-C), respectively. Basophilic tubules contain highly proliferative epithelial cells (red), and α-smooth muscle actin (green) is not present in the interstitium and visible only in small arteries. (A-C) Hematoxylin and eosin staining.
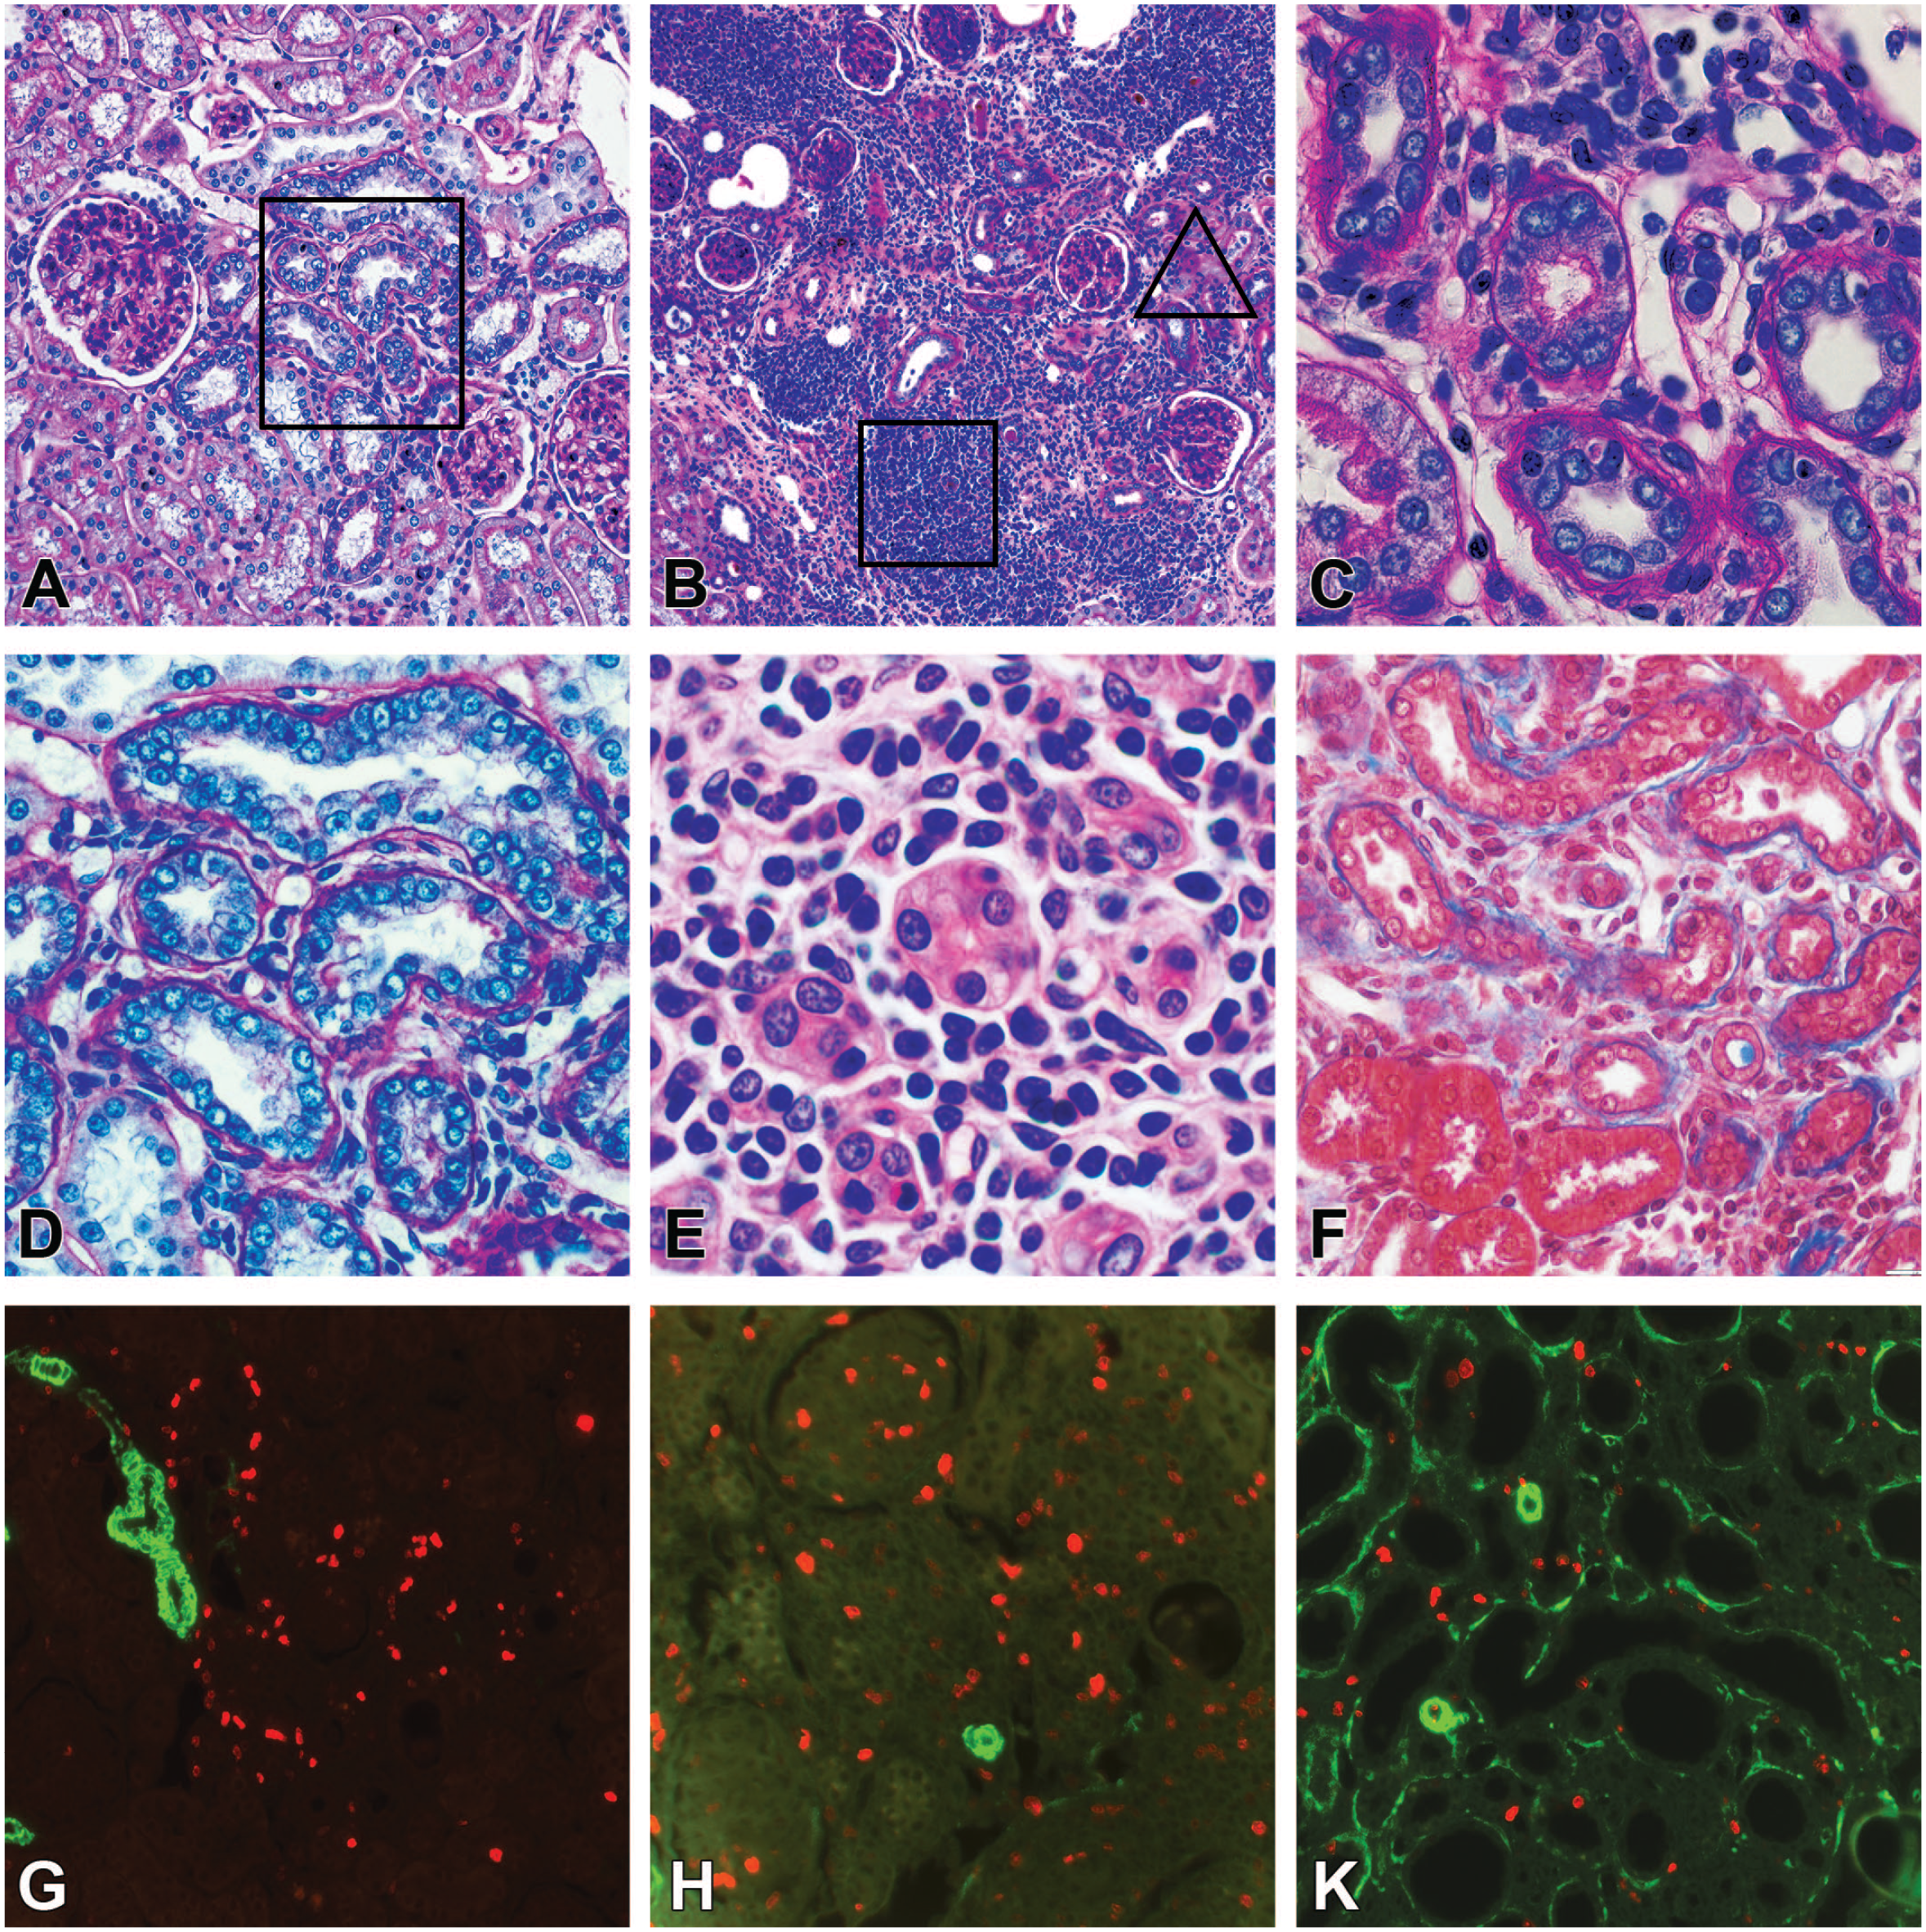
Various appearances of chronic progressive nephropathy (CPN) in the nonclipped kidney at 9 weeks after surgery. (A) Groups of basophilic tubules in the cortex. (D) The boxed area in (A). Hyperplasia of the tubular epithelium with polymorphic crowding nuclei, thickened basement membranes. Mononuclear cells and fibrotic components increased in the interstitium. (B) Tubular basophilia and cellular infiltration expanded and became multifocal. Mononuclear infiltrates aroused within affected areas. (E) The boxed area in (B). Tubular atrophy. Dense infiltrates contain monocytes, macrophages, and lymphocytes. (C) The triangle area in (B). Atrophic tubules with thickened basement membranes. The loose edematous interstitium contains distended capillaries and infiltrated by monocytes, macrophages, and some lymphocytes. (F) Severe tubular atrophy and interstitial fibrosis. (G-K) Immunofluorescence of Ki-67 (red) and α-smooth muscle actin (green) in sections consecutive to (D-F), respectively. (G) CPN was detected by high local proliferative activity. (H) Proliferative cells present mostly in mononuclear infiltrates, not in tubules as in (C). (K) In areas of severe interstitial fibrosis, mild proliferative activity is randomly distributed within the atrophic tubules and interstitium. (A-D) Periodic acid-Shiff; (E) hematoxylin and eosin; (F) trichrome staining.
In clipped kidneys tubulopathy was most prominent with some similarity to human lesions, although differing substantially. The histopathologic lesions in the ischemic kidney were extremely irregular occupying from 5% to 80% of the renal cortex, as we previously analyzed. 3 Due to the significant presence of CPN detected in the nonclipped kidney, we analyzed whether CPN could be found in the clipped kidney. For this, only parenchymal zones with normal appearance were carefully examined on total section scans. Foci of CPN were found in the typical form of tubular epithelial hyperplasia with high LPA (Figure 11(A-C)). Recognition of CPN within more advanced lesions was more challenging. Areas containing tubules with crowded nuclei, dense monocyte infiltrates in the interstitium, and active local proliferation were alternating with foci of typical tubular atrophy and fibrosis (Figure 11(D-K)). It was difficult to quantify CPN areas within ischemic lesions. The clipped kidney demonstrated ~12-fold and ~6-fold elevation in the tubular atrophy score and interstitial collagen area that was closer to human data (Figure 2(A) and (C)). A significant increase in interstitial monocyte infiltration (~6-fold) reflected the presence of CPN rather than hypertensive tubulopathy since progressive atrophy and fibrosis decrease interstitial cellularity (Figure 1). The morphometry data showed a mild increase in LVD (+18%), a significant reduction in TWVD (~2-fold), and greater IVD (~3-fold) (Figure 2(B)). The mean proliferative activity in the cortex was estimated ~8-fold higher than in control rats. It was impossible to detect high LPA outliers among complex intermixed lesions as for other kidneys. Statistically, the value set had a normal distribution without outliers (Figure 5(A) and (B)).
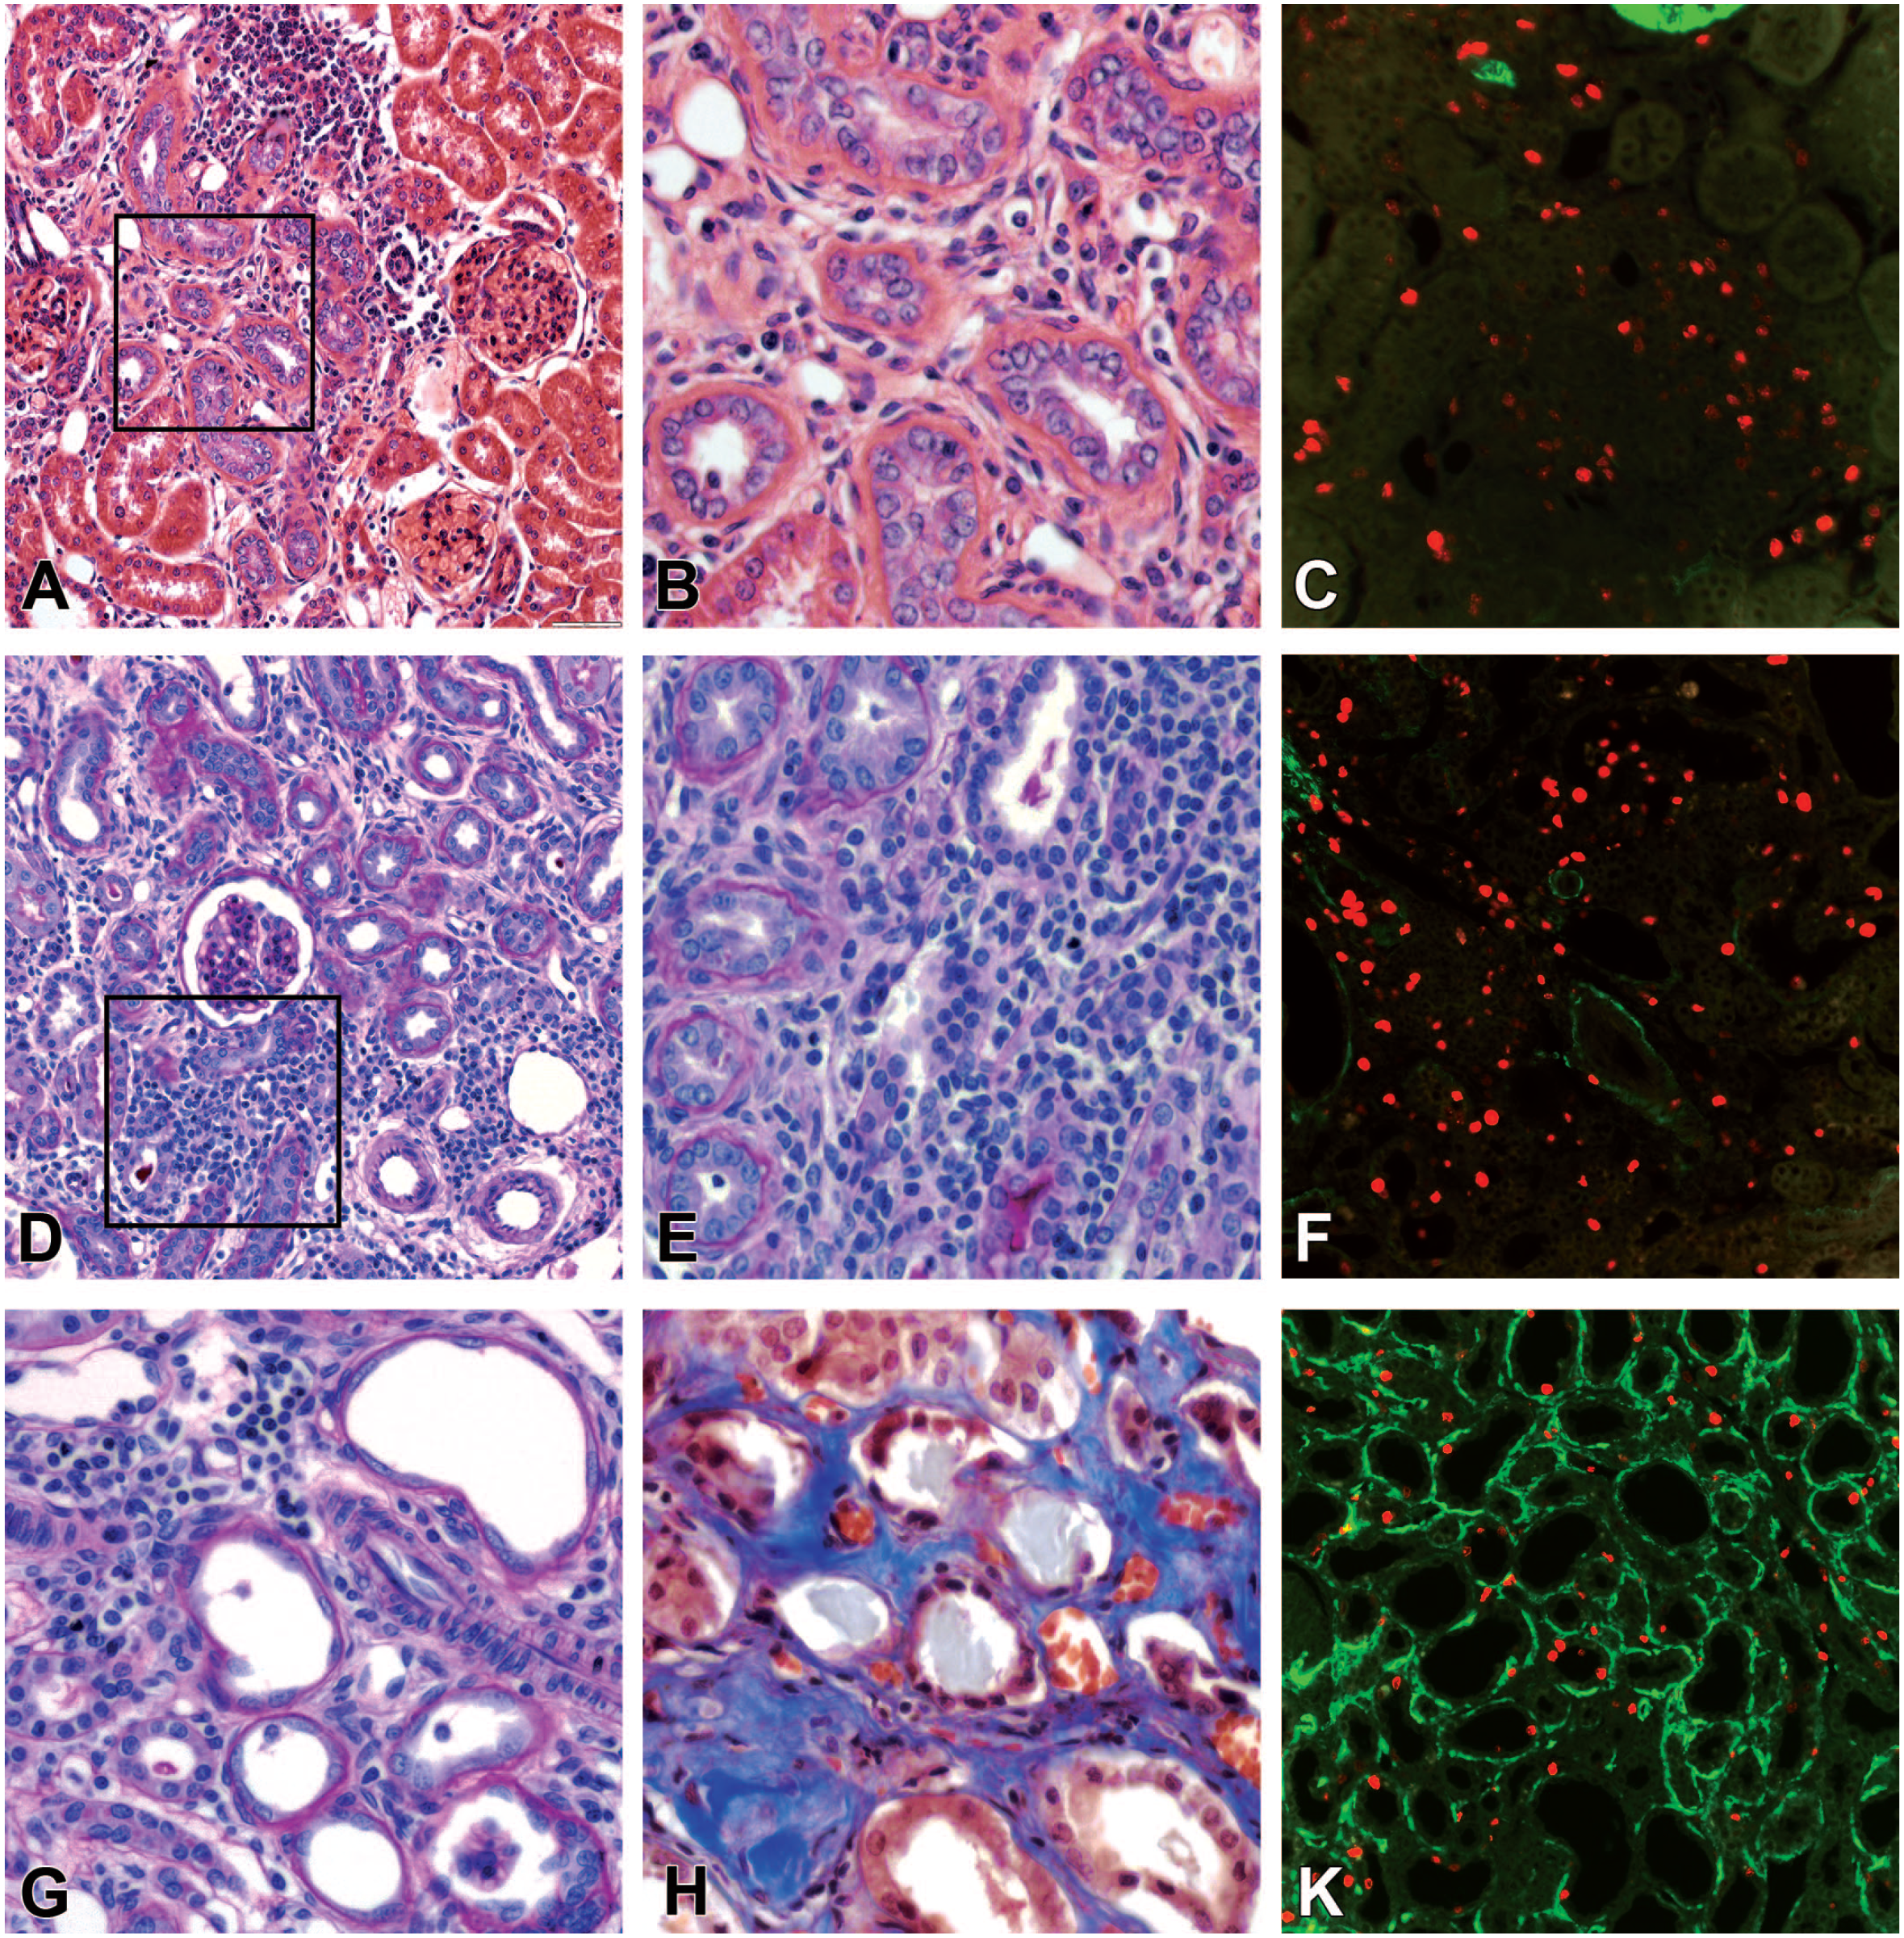
Chronic progressive nephropathy (CPN) accompanies hypertensive tubulopathy in the clipped kidney. (A) The area of CPN demonstrates characteristic features of tubular basophilia with crowded epithelial nuclei. (B) The boxed area in (A). Mild monocyte infiltration in the interstitium started around the proximal tubules with epithelial hyperplasia. (C) The consecutive section to (A). Typical appearance of numerous Ki-67-positive cells identified high local proliferative activity in the CPN area. (D) and (E) (the boxed area in (D)). The presence of CPN was difficult to detect in zones with mixed tubular atrophy, interstitial fibrosis, and dense mononuclear infiltrates. (F) The consecutive section to (D). Numerous Ki-67-positive cells were identified within the proximal tubules, interstitium, and dense monocyte infiltrates. (G) and (H) Severe tubular atrophy with flattened tubular epithelium, thickened basement membranes, and interstitial fibrosis. (K) The consecutive section to (H). Random distribution of Ki-67-positive cells within atrophic tubules and interstitium. (A) and (B) hematoxylin and eosin; (D), (E), and (G) periodic acid-Shiff; (H) trichrome staining. Ki-67 (red), α-smooth muscle actin (green).
Similar to the finding in the mouse models, abundant infiltrating interstitial cells did not invade the tubular basement membranes and epithelium, that is, histopathological signs of tubulitis were minimal (Figure 8(C) and (D)). Glomerulopathy was precisely analyzed in our recent study. 3 In the areas with developing CPN, glomeruli were intact and not involved in surrounding lesions (Supplementary Figure 3).
Discussion
The studied mouse models did not develop tubular atrophy, interstitial infiltration, and interstitial fibrosis. In Ang II–infused mice, tubular cytoplasmic accumulation of PAS-positive granules and vacuoles in cytoplasm in the tubular epithelium are not considered specific for hypertensive lesions nor are they associated with CPN.33,48,49 Since in healthy control animals the collagen area occupies only ~0.24%, the enhancement to 1.45% in Ang II–infused mice means a 6-fold increase and is considered quite significant. Similar results were obtained in the majority of studies involving Ang II-infusion12,13,16,24,50 and TTRhRen mice.39,51 Nevertheless, the increase is very mild when compared with human data (Supplementary Tables 4 and 5).
It is well established that Ang II infusion augments intrarenal Ang II level by Ang II type 1 receptor–mediated internalization and substantial stimulation of endogenous Ang II formation. 52 Because Ang II is a powerful mitosis activator, 53 this explains the greatly increased proliferation activity in renal tubular and interstitial compartments in Ang II–infused mice. 54 In contrast, TTRhRen mice with normal or slightly elevated plasma Ang II levels 55 demonstrated diminished proliferative activity within the renal cortex and the number of interstitial cells decreased. The other attribute of TTRhRen mice was a difference in the volume density of the interstitial space and tubular lumens. Narrower lumens and the same tubular wall thickness verified the absence of tubular atrophy, while the expanded interstitial space without a corresponding increase in the collagen content confirmed the absence of interstitial fibrosis.
The most important feature found in mouse models was the detection of CPN. It was not observed in our previous studies of the Ang II infusion model 37 or TTRhRen mice,38,55 confirming the spontaneous random nature of CPN.33,56 Evaluation of consecutive sections revealed a very important observation: increased local mitoses in tubular cells were found at the earliest stage when tubules appeared normal on routine staining—that is, they preceded tubular basophilia and interstitial infiltration (Figure 7). This finding suggests that unknown causative factors of CPN are mitogenic. Once CPN was identified in our study, we reviewed publications that had been analyzed in the references. Reexamination of histopathology description and available images revealed that in many studies lesional variables corresponded to CPN. For example, focal tubular lesions with characteristic CPN features were present in TTRhRen mice,51,57 Ang II–overproducing double transgenic Tsukuba mice, 21 human renin-angiotensinogen double transgenic rat, 58 and deoxycorticosterone acetate + Ang II–infused mice. 32 In Ang II–infused rats CPN was apparent and authors described the histopathological lesions as predominantly tubulointerstitial with the proliferation increased in tubules, 50 or defined them as tubulointerstitial nephritis. 59 CPN-like lesions were even more evident in studies that accompanied Ang II infusion with a high-salt diet. According to these studies, histologic injury occurred primarily in tubulointerstitial areas and the contribution of glomerular abnormalities was minor.12,60,61 High LPA in tubules was documented in Ang II–infused rats. 62 Of note, in all studies, histopathologic lesions were attributed to hypertensive tubulopathy, not CPN.
Among the analyzed groups, SHR demonstrated minimal features of hypertensive tubulopathy with no signs of tubular atrophy, interstitial fibrosis, or interstitial infiltration. The results are in agreement with numerous other studies that showed no tubular involvement in SHR; therefore, tubulopathy assessment is quite often omitted in SHR studies.63,20,64 There were no signs of CPN in SHR. Our retrospective literature analysis found CPN features in SHR challenged with a high-salt diet which was interpreted as typical hypertensive nephropathy. 65
In the nonclipped kidneys, a substantial presence of CPN was detected. In fact, CPN-like lesions in the nonclipped kidneys have been described in many studies of the 2K1C model, although they were not diagnosed as CPN. Retrospective analysis of the literature revealed that images from those experiments documented interstitial infiltrates and tubular atrophy dominating over glomerular and vascular involvement.15,17,19,66 Interstitial infiltrates were 3- to 5-fold more severe than in the clipped kidneys.19,30,64 The presence of LPA has been verified, while interstitial infiltrates contained macrophages, T lymphocytes, and B lymphocytes.14,30,31,67,68 It is well established that tubulointerstitial damage precedes glomerular injury in the nonclipped kidney of Goldblatt hypertensive rats, suggesting a dominant role in nephrosclerosis.67,68,69 The development of CPN compromised the nonclipped kidney as the object which is considered to represent “true” hypertensive nephropathy if compared with ischemic lesions in the clipped kidneys.30,31,66
In the clipped kidneys, the severity of alterations varies significantly due to certain factors that we discussed recently. 3 The histopathological lesions resembled human tubulopathy, whereas the severity of lesions was close to morphometric data obtained in human studies (Supplementary Table 4). Moreover, the stenotic kidneys exhibit not only expected ischemic tubular atrophy and interstitial fibrosis but also obvious CPN lesions with a characteristic feature of high LPA in primary affected tubules. A retrospective analysis of the literature confirmed that CPN in the stenotic kidneys has been documented in some studies but reported as hypertensive tubulopathy.14,23,70
Although CPN is considered the most commonly encountered spontaneous background finding in laboratory rodents, 71 we have not found publications examining hypertensive animal models, including various drug and substance applications, that recognized CPN either as a result or a confounding background factor. Failure to recognize CPN in hypertensive models can be attributed to certain reasons. First, tubular lesions are mixed into various “integrated scores” but, at the same time, in many studies, tubulopathy analysis is reduced to the value of interstitial fibrosis only (Supplementary Tables 3 and 5), while inflammatory infiltrates with specific cell populations and localization is a diagnostic variable for various renal diseases. 9 Second, proliferative markers are not used on a regular basis.6,7,8 Third, if proliferative markers are applied, they usually are quantified “per area” regardless of localization.26,27,28 Moreover, high LPA values, the main phenotype marker of CPN in the tubules, could be readily distinguished only at early stages, before progressing to interstitial infiltration, sclerosis, and tubular atrophy, which disguise this very important diagnostic feature. 36 Fourth, toxicology pathology data dominate in the pharmaceutical industry and those educational and informational sources are less known in academic pathology. Our study reveals for the first time that CPN could significantly compromise animal models of hypertension, especially numerous experimental studies implicating inflammation in hypertension. 72
Based on histopathological features, CPN belongs to the group of tubulointerstitial renal diseases. 9 However, CPN is not equivalent to drug-induced interstitial nephritis in humans. Three major differences make this disease rodent-specific. First, inflammatory infiltrates arise between basophilic tubules with epithelial hyperplasia. In humans, tubular hyperplasia is absent as a defined pathological variable. 9 Second, monocytes and lymphocytes are predominant, while in humans, interstitial infiltrates are often accompanied by eosinophils, plasma cells, and neutrophils. Third, the sign of tubulitis as the penetration of inflammatory cells through tubular basement into the tubular epithelium is rather common, but is minimal in rodents, even in advanced lesions (Figure 8).33,35,73
In toxicity studies, CPN complicates aged rodents after long-term application of different substances,33,35,74 but for our relatively short models (4-9 weeks), the time was sufficient to induce overt CPN in younger animals. Importantly, CPN was found in renin-dependent models, but not in SHR. To date, only one review was published that analyzed possible intrarenal renin-angiotensin-aldosterone system alterations in CPN development and progression. 71
Conclusion
Because research on animals is aimed to model human diseases, terminology, classification, and assessment methods in animal pathology should be standardized with human pathology. Such efforts are critical to provide meaningful comparisons between research studies and clinical trials:
The diagnostic criteria for renal tubulopathy include three independent pathological variables—tubular atrophy, interstitial fibrosis, and interstitial infiltration. Incorporation of those pathological descriptors in one “integrated” score is not appropriate since it creates uncertain and incomparable values.
The hypertensive model should be considered effective if more than 30% of the cortex undergoes tubular atrophy and interstitial fibrosis.
Identifying infiltrating cells with phenotype markers or routine staining should also verify localization within glomeruli, tubules, or interstitium. The simple count “per area” or “per field” creates uncertain incomparable data. The same is necessary for proliferative markers.
CPN is a special entity in rodent renal pathology that is not related to hypertensive tubulopathy per se, despite similarity in advanced stages, and represents an additional confounding factor that contributes to variations in lesion severity and progression.
Uncontrolled random presence of CPN could significantly compromise data, especially for components and pathways of inflammatory processes. Quantification of proliferative markers in the renal tubules to estimate LPA is necessary to eliminate CPN in histopathology analysis.
Supplemental Material
sj-docx-5-tpx-10.1177_01926233231191128 – Supplemental material for Comparative Analysis of Hypertensive Tubulopathy in Animal Models of Hypertension and Its Relevance to Human Pathology
Supplemental material, sj-docx-5-tpx-10.1177_01926233231191128 for Comparative Analysis of Hypertensive Tubulopathy in Animal Models of Hypertension and Its Relevance to Human Pathology by Alex A. Gutsol, Taben M. Hale, Jean-Francois Thibodeau, Chet E. Holterman, Rania Nasrallah, Jose W. N. Correa, Rhian M. Touyz, Chris R. J. Kennedy, Dylan Burger, Richard L. Hébert and Kevin D. Burns in Toxicologic Pathology
Supplemental Material
sj-docx-6-tpx-10.1177_01926233231191128 – Supplemental material for Comparative Analysis of Hypertensive Tubulopathy in Animal Models of Hypertension and Its Relevance to Human Pathology
Supplemental material, sj-docx-6-tpx-10.1177_01926233231191128 for Comparative Analysis of Hypertensive Tubulopathy in Animal Models of Hypertension and Its Relevance to Human Pathology by Alex A. Gutsol, Taben M. Hale, Jean-Francois Thibodeau, Chet E. Holterman, Rania Nasrallah, Jose W. N. Correa, Rhian M. Touyz, Chris R. J. Kennedy, Dylan Burger, Richard L. Hébert and Kevin D. Burns in Toxicologic Pathology
Supplemental Material
sj-docx-7-tpx-10.1177_01926233231191128 – Supplemental material for Comparative Analysis of Hypertensive Tubulopathy in Animal Models of Hypertension and Its Relevance to Human Pathology
Supplemental material, sj-docx-7-tpx-10.1177_01926233231191128 for Comparative Analysis of Hypertensive Tubulopathy in Animal Models of Hypertension and Its Relevance to Human Pathology by Alex A. Gutsol, Taben M. Hale, Jean-Francois Thibodeau, Chet E. Holterman, Rania Nasrallah, Jose W. N. Correa, Rhian M. Touyz, Chris R. J. Kennedy, Dylan Burger, Richard L. Hébert and Kevin D. Burns in Toxicologic Pathology
Supplemental Material
sj-tif-1-tpx-10.1177_01926233231191128 – Supplemental material for Comparative Analysis of Hypertensive Tubulopathy in Animal Models of Hypertension and Its Relevance to Human Pathology
Supplemental material, sj-tif-1-tpx-10.1177_01926233231191128 for Comparative Analysis of Hypertensive Tubulopathy in Animal Models of Hypertension and Its Relevance to Human Pathology by Alex A. Gutsol, Taben M. Hale, Jean-Francois Thibodeau, Chet E. Holterman, Rania Nasrallah, Jose W. N. Correa, Rhian M. Touyz, Chris R. J. Kennedy, Dylan Burger, Richard L. Hébert and Kevin D. Burns in Toxicologic Pathology
Supplemental Material
sj-tif-2-tpx-10.1177_01926233231191128 – Supplemental material for Comparative Analysis of Hypertensive Tubulopathy in Animal Models of Hypertension and Its Relevance to Human Pathology
Supplemental material, sj-tif-2-tpx-10.1177_01926233231191128 for Comparative Analysis of Hypertensive Tubulopathy in Animal Models of Hypertension and Its Relevance to Human Pathology by Alex A. Gutsol, Taben M. Hale, Jean-Francois Thibodeau, Chet E. Holterman, Rania Nasrallah, Jose W. N. Correa, Rhian M. Touyz, Chris R. J. Kennedy, Dylan Burger, Richard L. Hébert and Kevin D. Burns in Toxicologic Pathology
Supplemental Material
sj-tif-3-tpx-10.1177_01926233231191128 – Supplemental material for Comparative Analysis of Hypertensive Tubulopathy in Animal Models of Hypertension and Its Relevance to Human Pathology
Supplemental material, sj-tif-3-tpx-10.1177_01926233231191128 for Comparative Analysis of Hypertensive Tubulopathy in Animal Models of Hypertension and Its Relevance to Human Pathology by Alex A. Gutsol, Taben M. Hale, Jean-Francois Thibodeau, Chet E. Holterman, Rania Nasrallah, Jose W. N. Correa, Rhian M. Touyz, Chris R. J. Kennedy, Dylan Burger, Richard L. Hébert and Kevin D. Burns in Toxicologic Pathology
Supplemental Material
sj-tif-4-tpx-10.1177_01926233231191128 – Supplemental material for Comparative Analysis of Hypertensive Tubulopathy in Animal Models of Hypertension and Its Relevance to Human Pathology
Supplemental material, sj-tif-4-tpx-10.1177_01926233231191128 for Comparative Analysis of Hypertensive Tubulopathy in Animal Models of Hypertension and Its Relevance to Human Pathology by Alex A. Gutsol, Taben M. Hale, Jean-Francois Thibodeau, Chet E. Holterman, Rania Nasrallah, Jose W. N. Correa, Rhian M. Touyz, Chris R. J. Kennedy, Dylan Burger, Richard L. Hébert and Kevin D. Burns in Toxicologic Pathology
Footnotes
Declaration of Conflicting Interests
The author(s) declared no potential conflicts of interest with respect to the research, authorship, and/or publication of this article.
Funding
The author(s) received no financial support for the research, authorship, and/or publication of this article.
Supplemental Material
Supplemental material is available in the online version of the article.
References
Supplementary Material
Please find the following supplemental material available below.
For Open Access articles published under a Creative Commons License, all supplemental material carries the same license as the article it is associated with.
For non-Open Access articles published, all supplemental material carries a non-exclusive license, and permission requests for re-use of supplemental material or any part of supplemental material shall be sent directly to the copyright owner as specified in the copyright notice associated with the article.