
Abstract
Branaplam is a splicing modulator previously under development as a therapeutic agent for Spinal Muscular Atrophy Type 1 and Huntington’s disease. Branaplam increased the levels of survival motor neuron protein in preclinical studies and was well tolerated in early clinical studies; however, peripheral neurotoxicity was observed in a preclinical safety study in juvenile dogs. The aim of this study was to determine whether serum neurofilament light chain (NfL) concentrations in dogs could serve as a monitoring biomarker for branaplam-induced peripheral neurotoxicity. A 30-week time-course investigative study in dogs treated with vehicle control (negative control), neurotoxic pyridoxine (positive control), or branaplam was conducted to assess neuropathology, nerve morphometry, electrophysiological measurements, gene expression profiles, and correlation to NfL serum concentrations. In branaplam-treated animals, a mild to moderate nerve fiber degeneration was observed in peripheral nerves correlating with increased serum NfL concentrations, but there were no observed signs or changes in electrophysiological parameters. Dogs with pyridoxine-induced peripheral axonal degeneration displayed clinical signs and electrophysiological changes in addition to elevated serum NfL. This study suggests that NfL may be useful as an exploratory biomarker to assist in detecting and monitoring treatment-related peripheral nerve injury, with or without clinical signs, associated with administration of branaplam and other compounds bearing a neurotoxic risk.
Introduction
Monitoring the adverse effects of drug treatment on the peripheral nervous system (PNS) often requires techniques, such as electrophysiological testing and nerve biopsies, that may be unpleasant or invasive to the patient. In recent years, sensitive methods for detecting neurofilament proteins in serum and plasma have been developed to monitor patients and animals with neurological lesions including peripheral polyneuropathies.1-6 Neurofilaments, a major component of the neuro-axonal cytoskeleton, are released during injury, and concentrations of neurofilaments in the blood and cerebrospinal fluid (CSF) may correlate with the extent of neuro-axonal damage in neurodegenerative diseases.1,7
Clinical data indicate correlations between PNS lesions and increased neurofilament protein concentration in blood.2,8 Studies in rats established a correlation between microscopic findings, electrophysiological testing, and increased neurofilament levels following drug-induced peripheral neuropathy,4,5 and found a correlation between the severity of microscopic findings and neurofilament light chain (NfL) levels. Here, we aimed to determine whether serum NfL assays were sensitive enough to detect subtle PNS pathology and serve as early indicators of subclinical neurotoxicity in a clinical setting.
Branaplam (NVS-SM1, LMI070), an orally administered small molecule that modulates survival motor neuron 2 (SMN2) transcript splicing to increase the amount of functional SMN protein, 9 and lowers total huntingtin (HTT) transcript and protein by modulating splicing of HTT pre-mRNA, 10 was under consideration for development for treatment of Spinal Muscular Atrophy Type 110,11 and Huntington’s disease. Non-clinical safety evaluations in juvenile dogs receiving branaplam daily by oral gavage revealed nerve fiber degeneration in the PNS. This effect is believed to be caused by the stabilization of microtubule polymerization induced by branaplam. Microtubule stabilization reduces cell dynamicity, promoting mitotic arrest, and cell death. 11 In light of these results, we were interested in finding a safety biomarker that could be measured quickly, accurately, and non-invasively in preclinical animal studies that would then translate to, and have utility in, clinical studies.
Toward this goal, we evaluated whether serum NfL concentrations can serve as a sensitive biomarker to monitor for potential branaplam-related PNS toxicity.
Materials and Methods
Dogs
Juvenile male beagles were obtained from Covance Inc. (Cumberland, VA, USA). Animals were group-housed in pens for psychological and environmental enrichment and fed a standard diet. Animals were acclimatized for 5 weeks before start of dosing; they were weighed and randomized to treatment groups to achieve similar group-mean body weights. At initiation of dosing, the dogs were 14 to 17 weeks old and weighed 4.1 to 6.9 kg. The study protocol was reviewed and approved by the Institutional Animal Care and Use Committees of at Novartis Institutes for BioMedical Research (Cambridge, MA, USA) and Charles River Laboratories, Inc. (Senneville, Quebec, Canada). All procedures were in compliance with the National Institutes of Health Guidelines for the Care and Use of Laboratory Animals.
Treatment
A detailed dosing regimen for all treatment groups is illustrated in Figure 1. All dogs received daily oral administrations at 2 ml/kg of either a vehicle (0.5% methylcellulose with 0.5% Tween solution), pyridoxine (positive control; Sigma-Aldrich, batch STBG4285V), or branaplam (Novartis) by 2 different dosing regimens (continuous branaplam dosing for up to 30 weeks and intermittent branaplam dosing comprising 2 dosing cycles [11 and 13 weeks] separated by a 4-week dosing-free period).
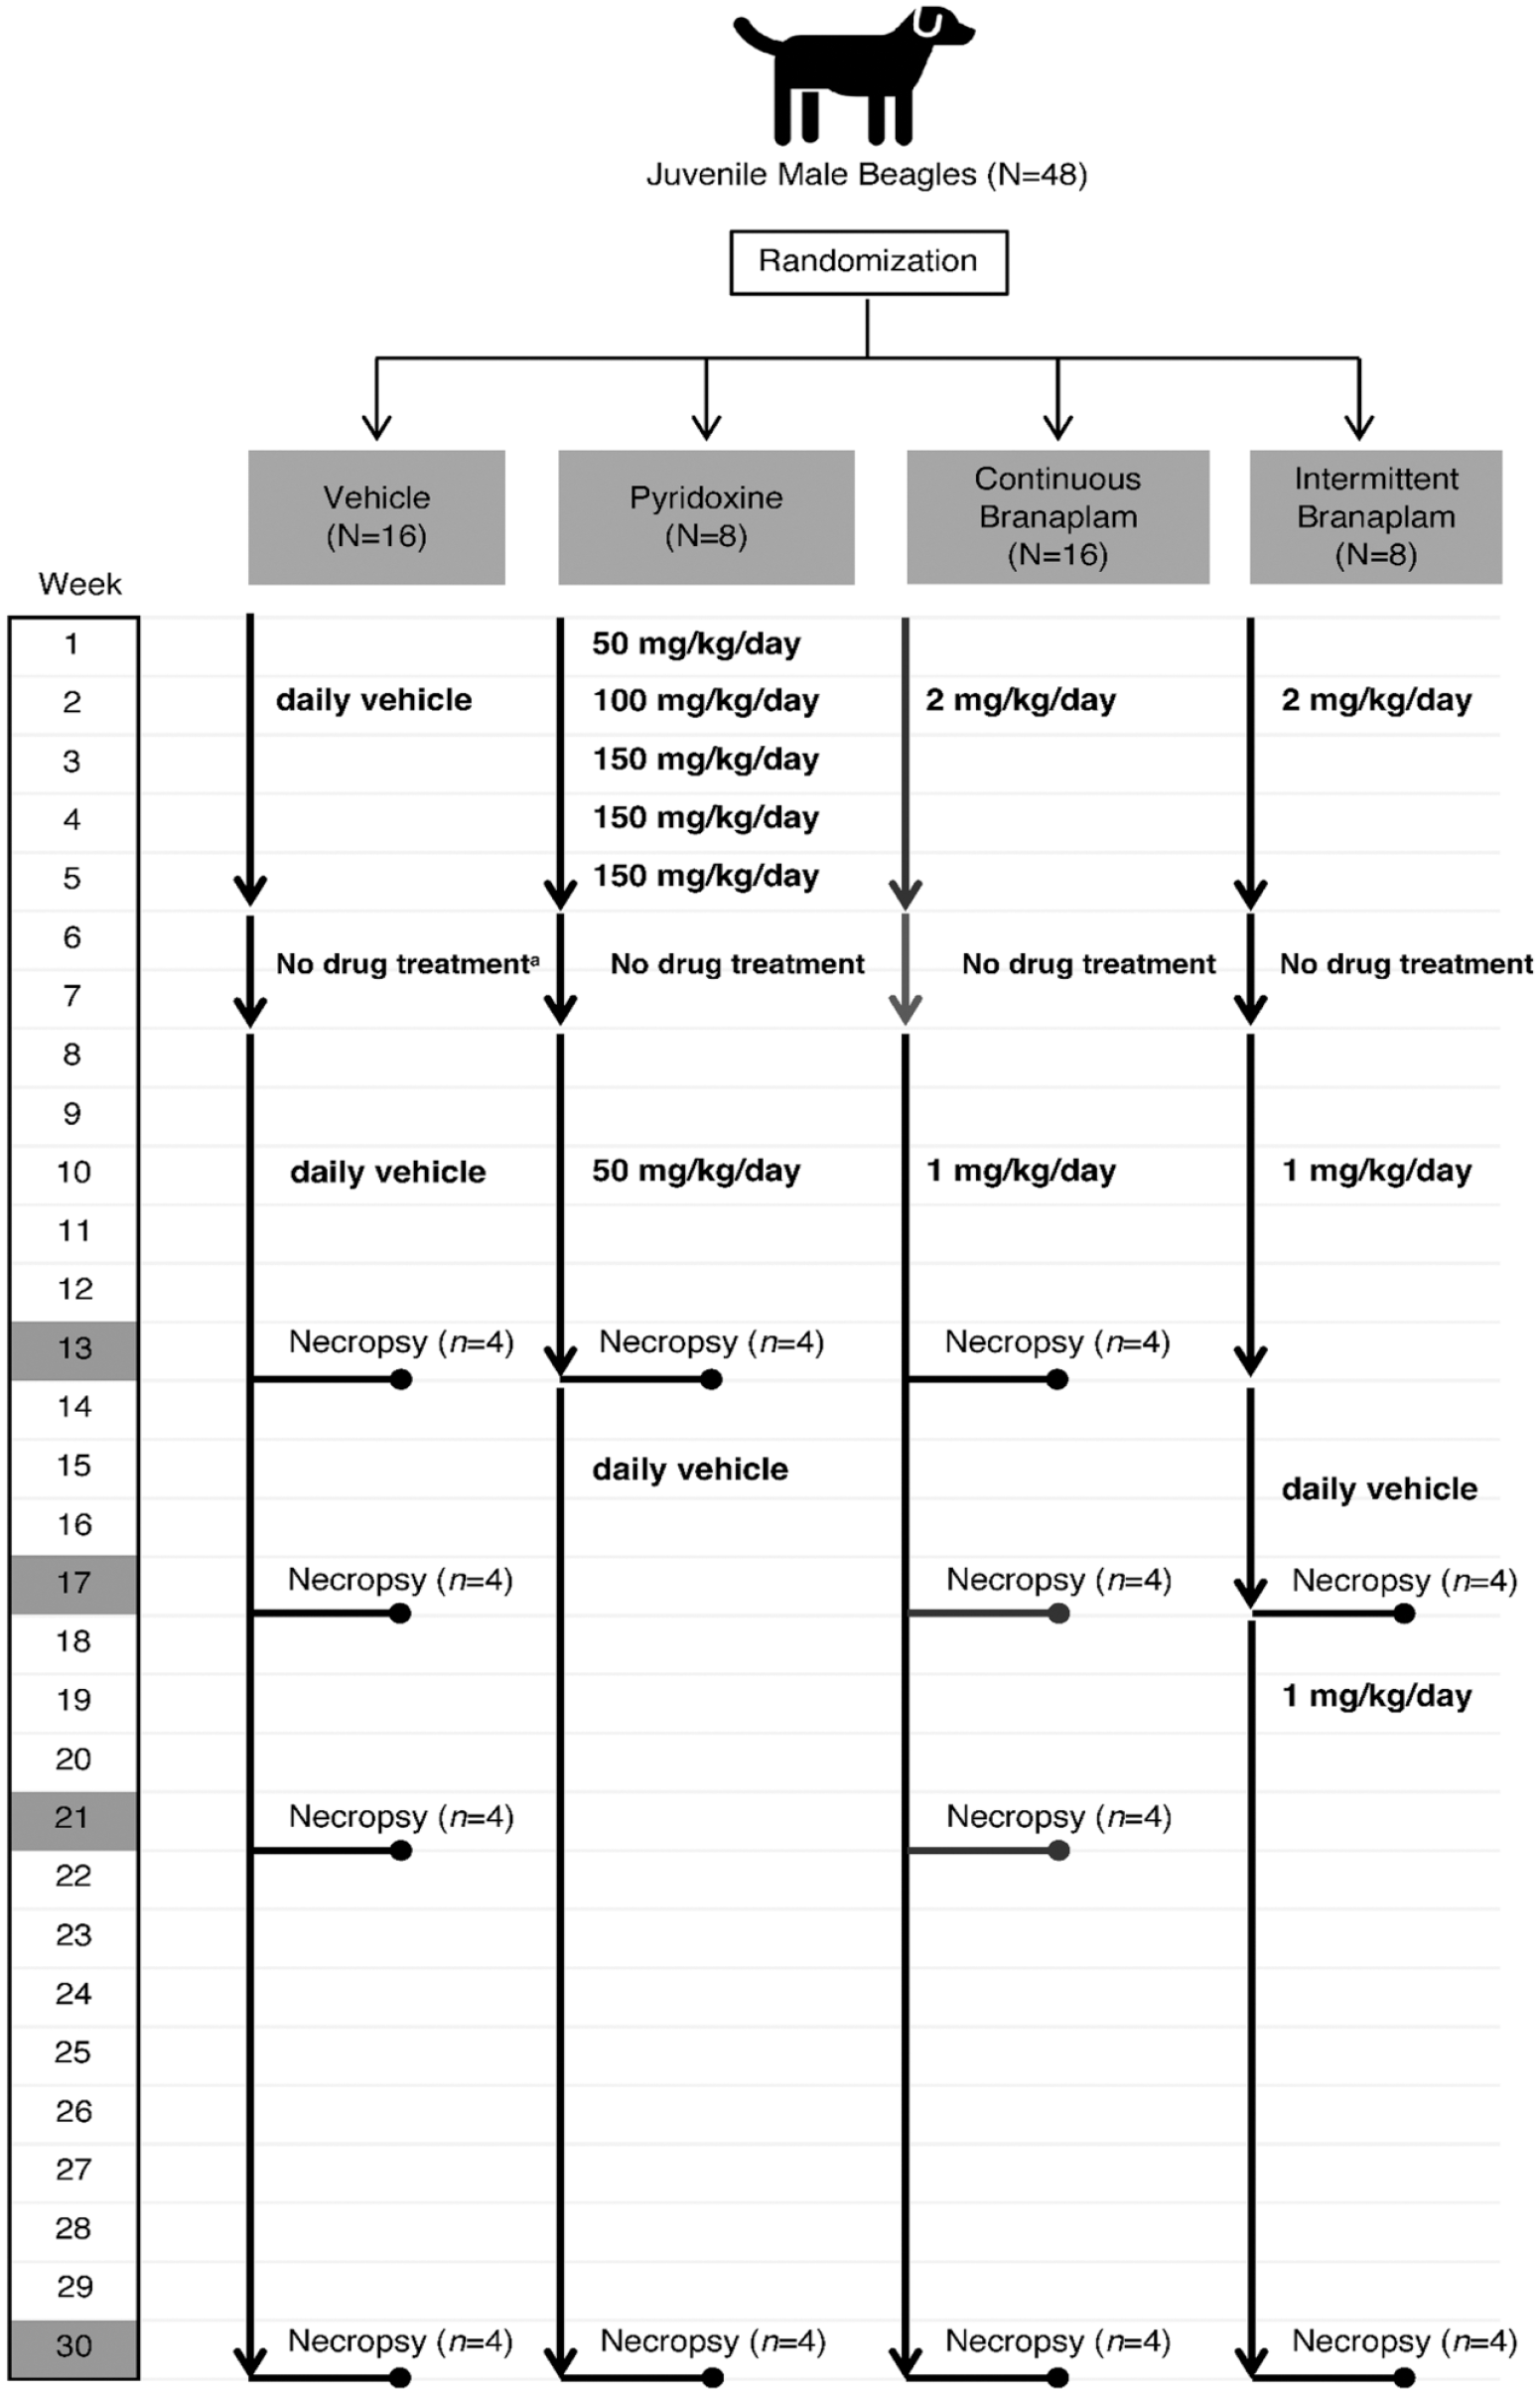
Treatment schema of animals. Dogs in the control group received the vehicle, administered daily by oral gavage, and were killed for necropsy at the end of weeks 13, 17, 21, and 30. Dogs in the pyridoxine group received increasing doses of pyridoxine up to the end of week 5. At weeks 6 and 7, the animals received no drugs. Beginning at week 8, due to toxicity issues, animals received 50 mg/kg/day of pyridoxine until the end of week 13. Afterward, treatment was discontinued, and animals were placed on vehicle until the end of week 30. Dogs in the pyridoxine group were killed for necropsy at the end of weeks 13 and 30. Dogs in the continuous branaplam group received 2 mg/kg/day of branaplam for the first 5 weeks of the study. At week 6, treatment with branaplam was discontinued until the end of week 7. Between weeks 8 and 30, the dogs received a dose of 1 mg/kg/day of branaplam and were killed for necropsy at the end of weeks 13, 17, 21, and 30. Dogs in the intermittent branaplam group received 2 mg/kg/day of branaplam for the first 5 weeks of the study, followed by a 2-week treatment cessation. The dogs then subsequently received a dose of 1 mg/kg/day branaplam from weeks 8 to 13, vehicle between weeks 14 and 17, and 1 mg/kg/day of branaplam between weeks 18 and 30. Dogs in this group were killed for necropsy at the end of weeks 17 and 30. For all doses of pyridoxine and branaplam, concentrations are expressed as the free base, with the salt-to-base ratio of branaplam being 1.093.
The toxic dose levels of pyridoxine used in the study (100-150 mg/kg/day) were selected based on published data. 12 No Toxicokinteic assessment was included for pyridoxine in this study. Based on human reports peripheral neuropathy was observed when excessive pyridoxine is taken over many months to years, which suggested that the toxic effect is exposure driven.
Clinical and Neurological Examinations
Animals were examined twice daily for signs of ill health or reaction to treatment. Daily quantitative food consumption and cage-side observations (2-3 hours post-dosing), weekly detailed examinations, and twice-weekly body weight measurements were also performed. Blood samples were taken before study start and on weeks 5, 7, 11, 13, 17, 21, 23, 25, 27, and 30 for standard hematology, coagulation, and clinical chemistry end points.
Neurological evaluations were performed before study start and at study weeks 7, 15, 21, and 30 (±1 day) and comprised general attitude, motor function, postural reactions, cranial nerve functions, and spinal nerve functions.
Electrophysiological Testing
Electrophysiological testing was conducted in compliance with the practices of the Laboratory for Behavioral Neurophysiology at Albert Einstein College of Medicine, as outlined in Standard Operating Procedures on file at Charles River Laboratories, Senneville, QC, Canada. Testing was conducted before dosing and at study weeks 7, 15, and 21 with platinum needle electrodes (Grass-Telefactor Corp., West Warwick, RI, USA). All electrophysiological studies were performed under general anesthesia using an intramuscular cocktail injection of dexmedetomidine (0.02 mg/kg) and butorphanol (0.2 mg/kg). Atipamezole (0.2 mg/kg) was used to reverse the anesthesia following completion of the tests. Testing included determination of the peroneal motor nerve conduction velocity (NCV) and amplitude of compound muscle action potential as well as the sural sensory NCV and compound sensory amplitude. In addition, cauda equina latency was measured from the dorsal surface of the intact spinal canal at a distance of 6 to 10 cm to the proximal iliac crest, following maximal stimulation of the sciatic nerve at the head of the fibula. No formal statistical comparison of groups was performed due to the small number of animals in each group.
Neurofilament Assays
Blood samples were collected prior to initiation of dosing and during study weeks 5, 7, 9, 11, 15, 17, 21, and 30 by venipuncture in serum separator tubes. CSF was collected from all treatment groups at the scheduled necropsy time points (study weeks 13 and 30 for the pyridoxine treatment group and weeks 13, 17, 21, and 30 for the branaplam treatment groups). No pre-test (baseline) CSF samples were taken to avoid procedural (lumbar puncture) induced axonal damage in the spinal cord, which could induce alterations in NfL assay results. Samples were kept at −20°C until analysis.
When ready for testing, serum and CSF supernatant samples were thawed at room temperature, diluted 1:100 and measured in duplicates on a Simoa platform (Quanterix Corp., Boston, MA, USA) using an anti-NfL monoclonal antibody ELISA kit (UmanDiagnostics NF-light assay, Quanterix Corp.) as published previously.13,14 Concentrations of NfL above 40 pg/ml in serum and above 650 pg/ml in CSF were considered elevated.
Microscopic Examination
At scheduled necropsies (study weeks 13, 17, 21, and 30), four animals per time point were euthanized (see Figure 1), and tissues were collected for evaluation by light microscopy. Tissues collected included brain, spinal cord, selected dorsal root ganglia (DRG-cervical C1-C2, thoracic T6-T8, and lumbar L4-L5), trigeminal ganglia and nerve, and sciatic, sural, tibial, peroneal, vagus and ulnar nerves; these were immersion fixed in 10% neutral buffered formalin, routinely processed, embedded in paraffin, sectioned nominally at 4 μm (exact thickness not recorded), and stained with hematoxylin and eosin (HE) based on best practice guidelines recommended by the Society of Toxicologic Pathology and test facility standard operating procedures. 15 Additional ulnar and sural nerve samples were collected, immersion fixed in modified Karnovsky’s solution (Electron Microscopy Sciences Inc., Hatfield, PA, USA), and epoxy resin-embedded for semi-thin sectioning and toluidine blue staining according to established test site laboratory methods at the Sponsor Electron Microscopy and Digital Imaging Laboratory (Novartis Pharmaceuticals Inc., East Hanover NJ, USA). Semi-thin (approximately 70 nm) sections of stained resin-embedded nerve tissues were evaluated by light microscopy. The same ACVP-board certified Anatomic Pathologist experienced in toxicologic pathology evaluated both the HE-stained paraffin-embedded tissues and the toluidine blue–stained resin-embedded tissues and reported the results in a stand-alone anatomic pathology report to the Test Facility study director (RV).
Morphometry Assessments
For quantitative image analysis, semi-thin toluidine blue–stained transverse sections of sural and ulnar nerves were scanned using an Aperio scanner (ScanScope and ImageScope software for image tile generation, V12.1.0.5029; Leica Biosystems, Milton Keynes, UK), and the g-ratio was calculated using the 1-dimensional g-ratio parameter (defined by the length projection of a cell in the direction of its minimal diameter) and the 2-dimensional area-based g-ratio parameter (defined as the ratio of the axoplasm area over axoplasm + myelin area). 16
For the treatment group analysis, the median of g-ratio values over all analyzed cells per sample was used to represent an individual animal’s g-ratio. No further formal statistical comparison of groups was performed due to low number of animals in each dose group.
Gene Expression Profiling (GEP)
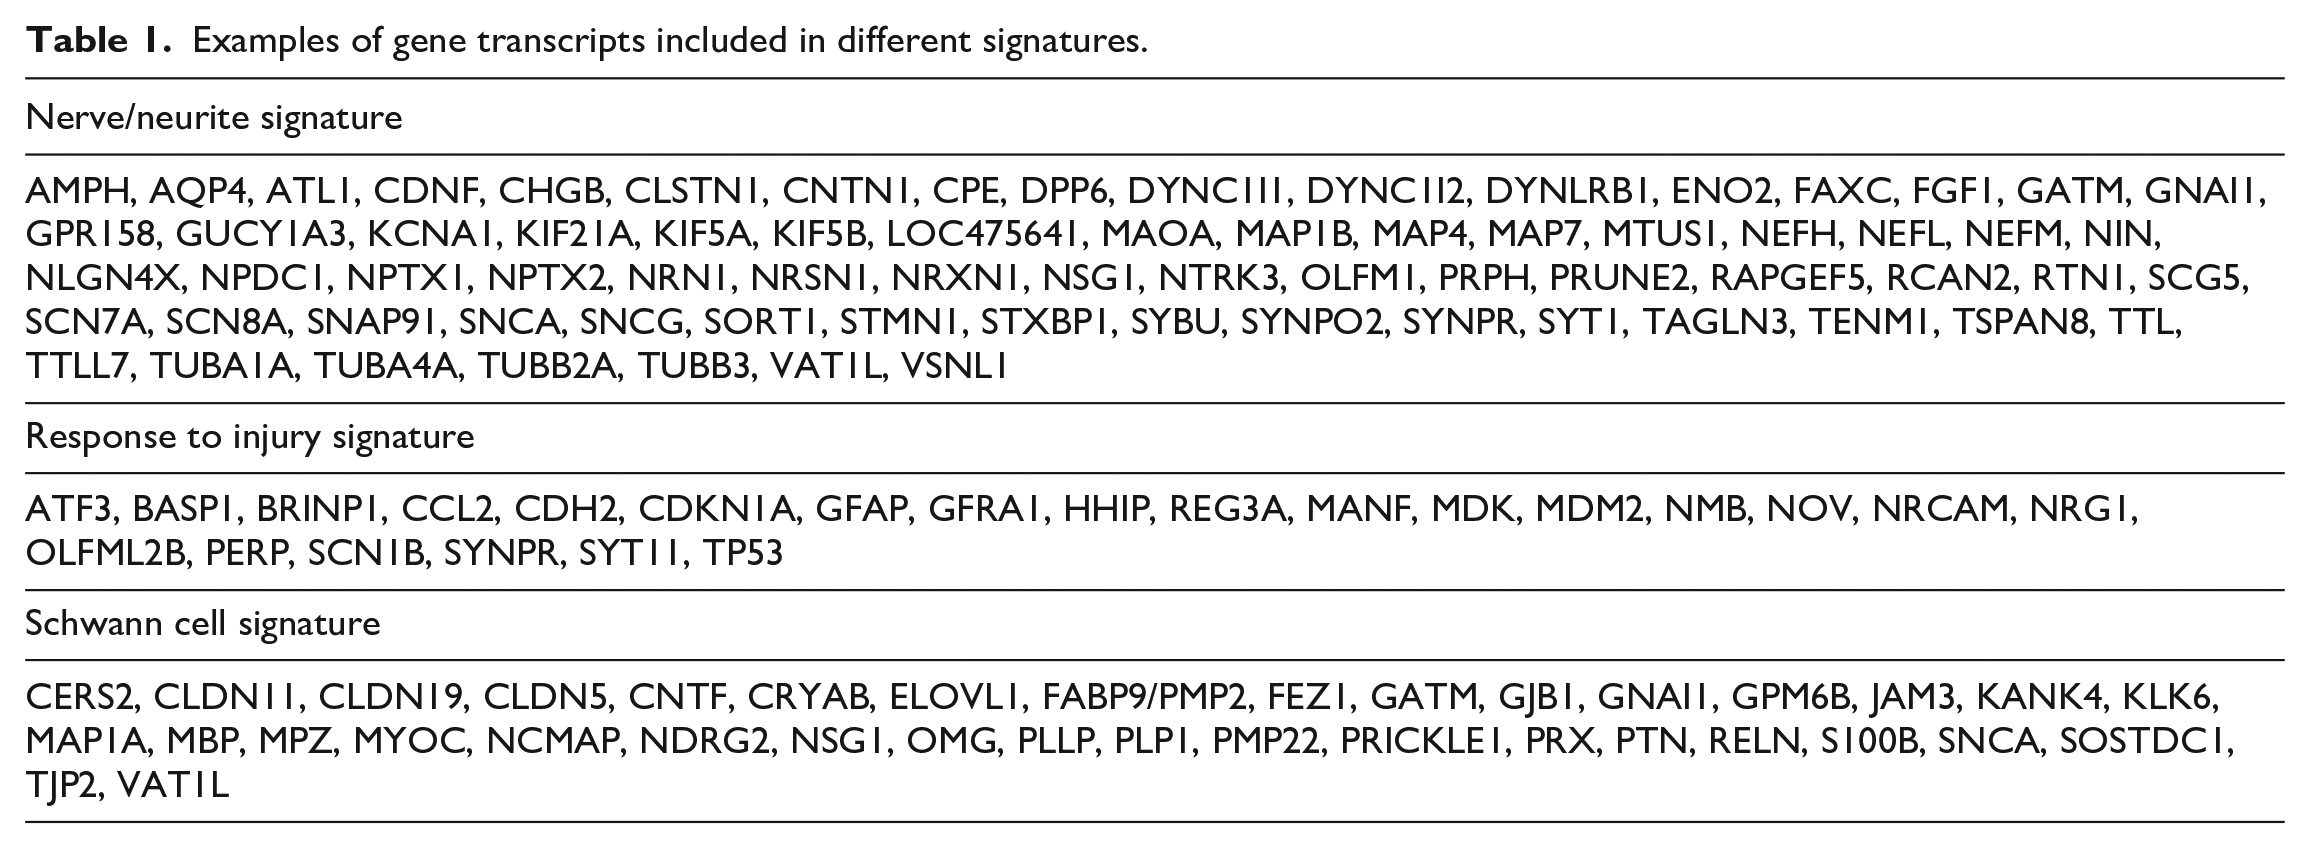
Sciatic and sural nerve samples, selected DRG (at the cervical, thoracic, and lumbar level), and a trigeminal ganglion from animals treated with pyridoxine or branaplam were harvested and flash frozen in liquid nitrogen at scheduled necropsy for transcriptional analysis. At least one cervical (C3), thoracic (T8), and lumbar (L5) dorsal root was sampled and pooled for gene expression profiling. GeneChip microarray experiments were conducted using Canine_2 Arrays (Affymetrix, Inc., Santa Clara, CA, USA) according to the manufacturer’s technical manual. Gene signatures, including a set of genes with highly correlated expression profiles belonging to the same molecular pathway or cell type, including sciatic and sural neurites (dorsal), ganglion neurons, and Schwann cell gene signatures, were initially generated from genes having more than 0.75 Pearson’s correlation coefficient using a complete linkage method. The signatures were then manually curated to exclude genes not considered biologically relevant and to include genes with biological significance even if at lower correlation coefficients. Gene signature scores were calculated as geometric mean of fold changes of all genes of the signature. Examples of transcripts included in different gene signatures are shown in Table 1.
Examples of gene transcripts included in different signatures.
Results
Clinical and Neurological Examination
In the pyridoxine-treated dogs, lower body weight gains and transient lower food consumption were observed under high-dose levels of pyridoxine. At week 15, neurological findings were noted as described in the literature, 12 manifested principally by ataxia, which were reversed at weeks 21 and 30.
In branaplam-treated dogs, no effect on body weight or food consumption or neurological findings was observed. Hematological changes (related to the known cell cycle effects of branaplam) included moderate to marked decreases in platelet and reticulocyte counts, which reversed by day 47.
Electrophysiological Testing
All NCV data are summarized in Figure 2A, and all amplitude data are summarized in Figure 2B and C. During baseline assessment, all measures were within normal limits with no meaningful differences across all treatment groups. The mean NCV for the peroneal motor response was 57.60 m/s for the vehicle control group, 55.82 m/s for the continuous branaplam group, 55.24 m/s for the pyridoxine group, and 57.30 m/s for the intermittent branaplam group. The mean sural sensory NCV was 52.32 m/s for the vehicle control group, 52.83 m/s for the continuous branaplam group, 53.97 m/s for the pyridoxine group, and 55.43 m/s for the intermittent branaplam group. The cauda equina responses and temperature levels were consistent across groups (data not shown).
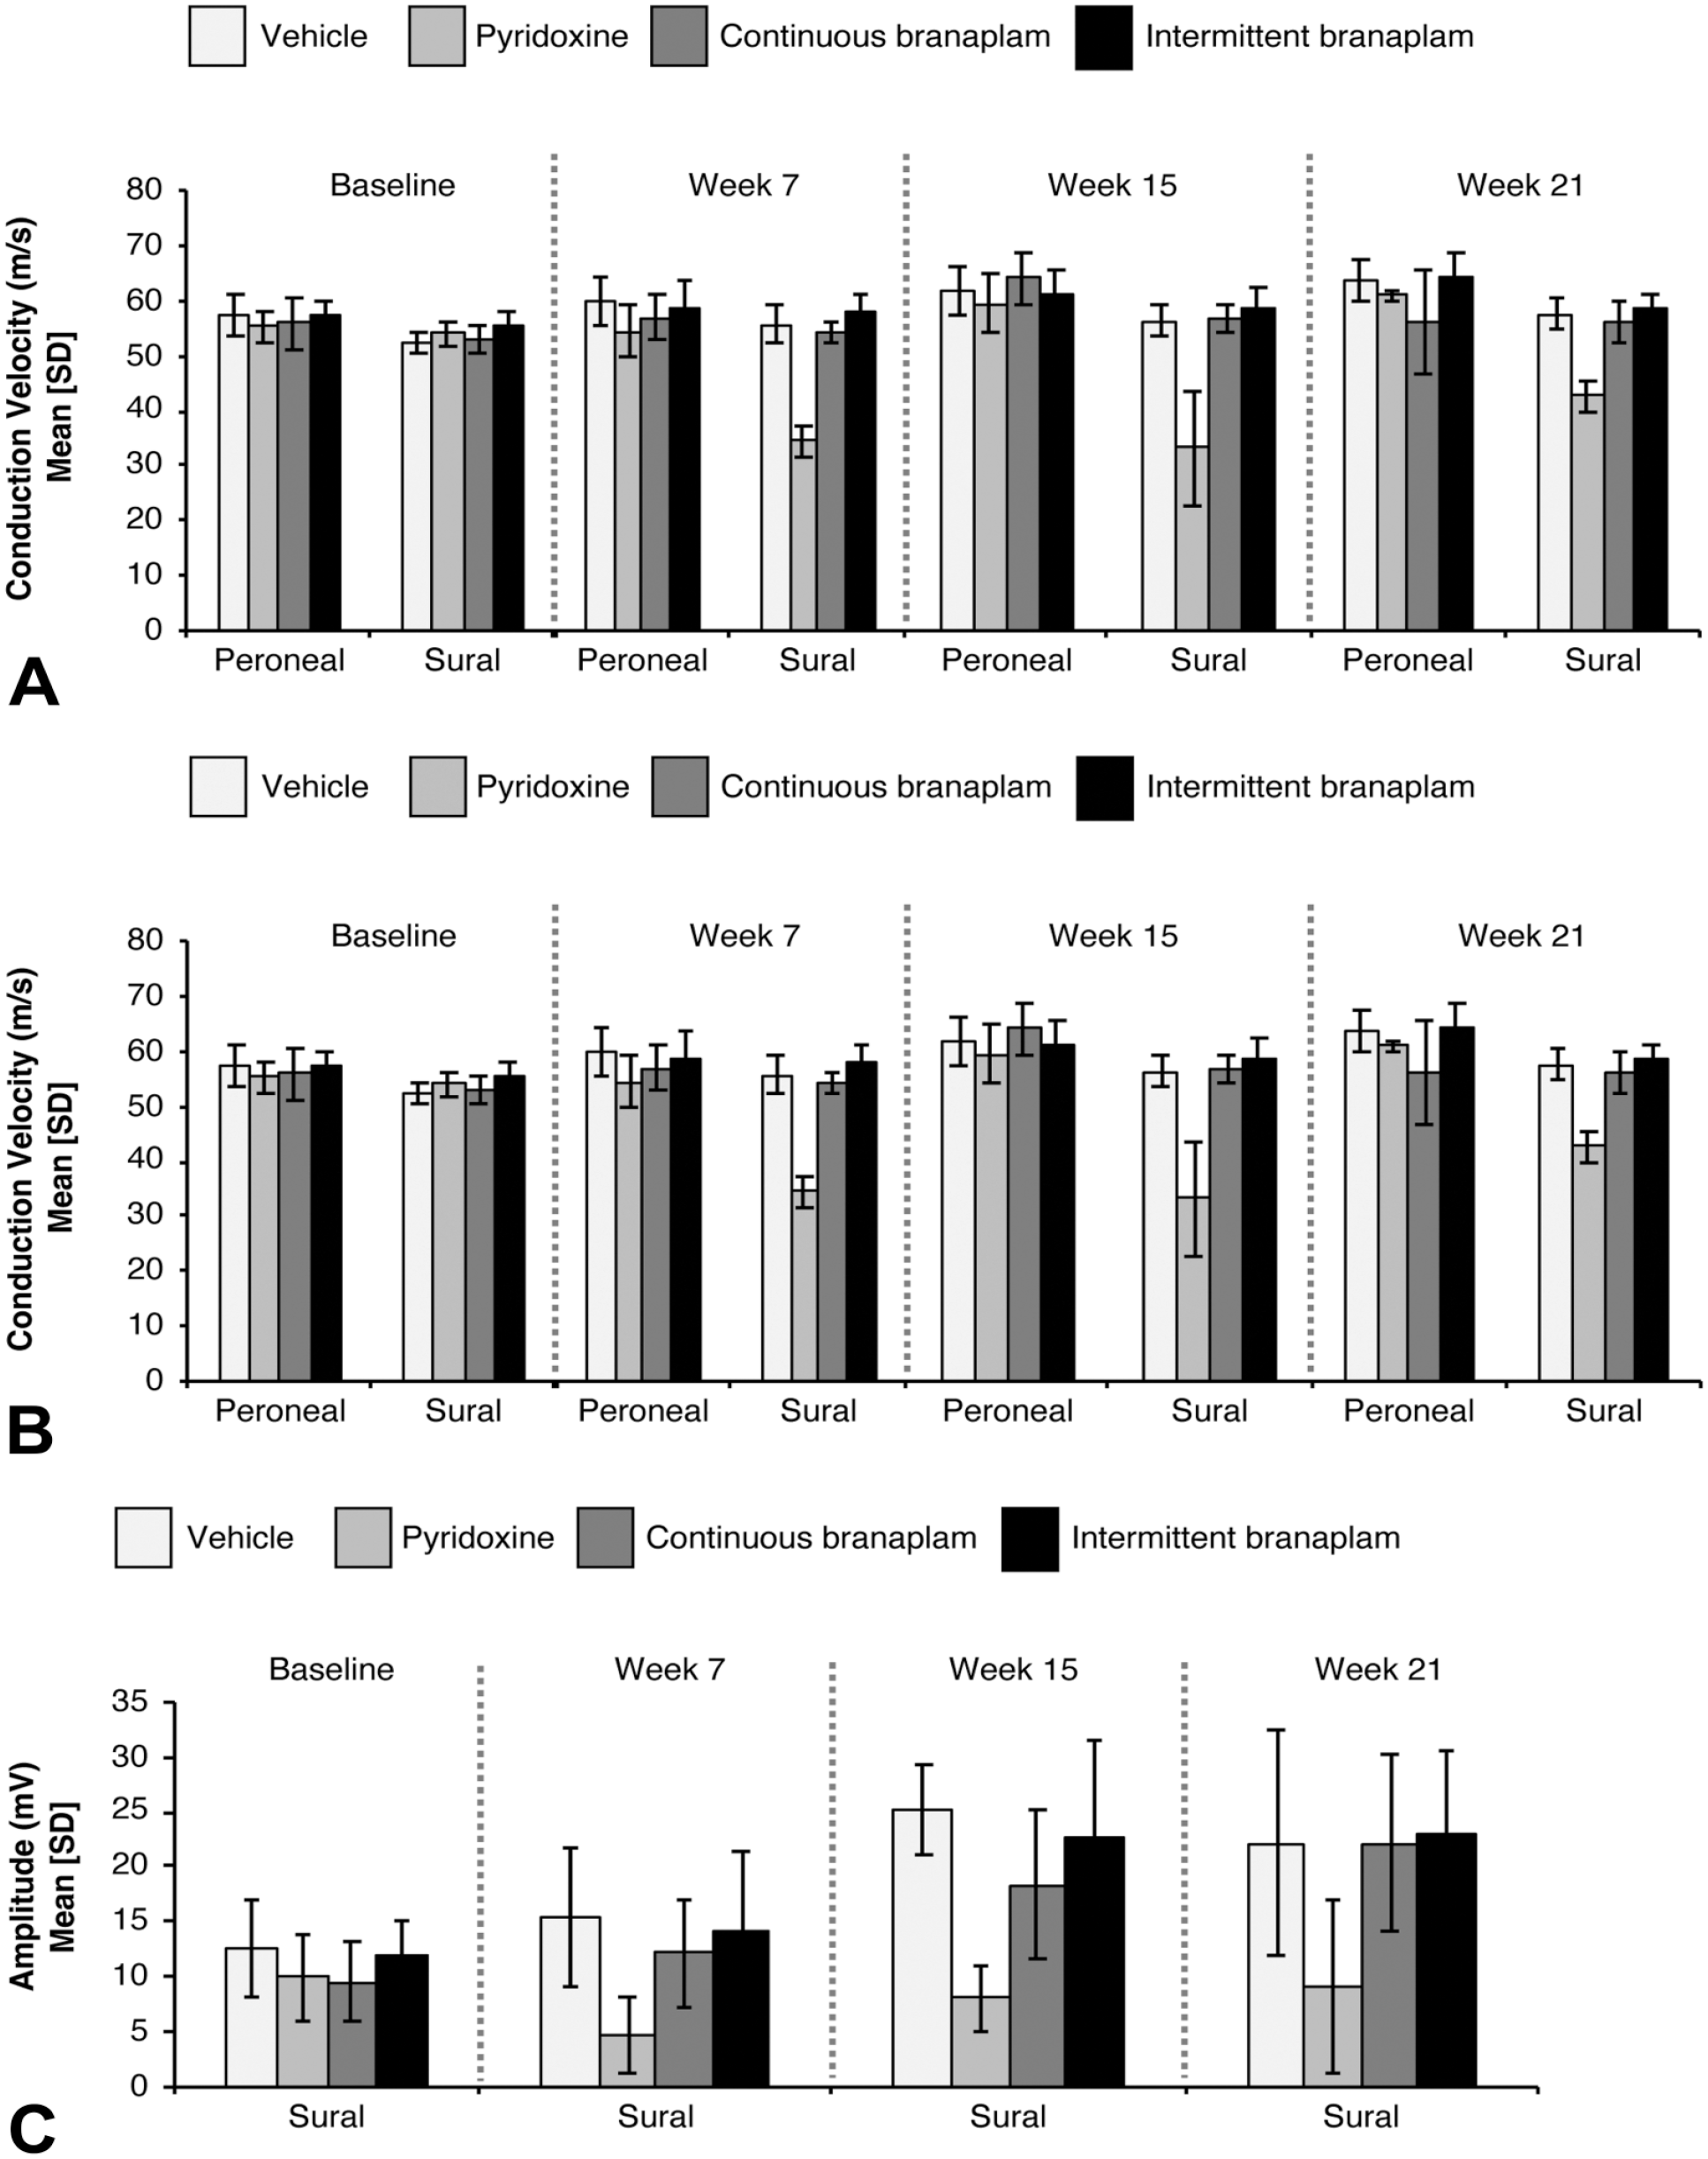
Nerve conduction velocities (A) and amplitudes (B,C) for the proximal and distal compound muscle action potentials for the peroneal nerve and the sensory nerve action potential of the sural nerve at baseline and weeks 7, 15, and 21 for dogs that received vehicle, branaplam, or pyridoxine. Baseline and week 7: n = 16 (vehicle and continuous branaplam, all), n = 8 (pyridoxine and intermittent branaplam, all). Week 15: n = 12 (vehicle and continuous branaplam, all), n = 4/3 (pyridoxine, peroneal/sural), n = 8 (intermittent branaplam, all). Week 21: n = 8 (vehicle, all), n = 7/6 (continuous branaplam, peroneal/sural), n = 4/2 (pyridoxine and intermittent branaplam, peroneal/sural). SD indicates standard deviation.
In the pyridoxine group, at week 7 there was a substantial reduction in the sural sensory NCV. At this early time point, the mean sural NCV was reduced to 34.25 m/s, an approximate 38% decrease compared with age-matched control animals. In addition to the slowing of the sural sensory signal, the sural response was absent in 2 (of 8 total) pyridoxine-treated animals. At this time point (week 7), no clear deficit in the latency of the cauda equina measure was observed, suggesting a sparing of the central tracts. At week 15, a mild slowing of the peroneal motor nerve velocity and amplitude was observed, whereas sural sensory response continued to deteriorate and now included dogs with sensory velocities as low as 21.99 m/s. At week 21, there was some degree of improvement in the pyridoxine-treated animals (4 total remaining due to necropsy at week 13).
In both the continuous and intermittent branaplam groups, exposure to branaplam did not result in a notable deficit in sensory or motor nerve conduction velocity measurements over a 21-week time period. At week 21, 1 dog (out of 8 total) in the continuous branaplam group exhibited a slowing of the peroneal NCV compared with week 15 (NCV at week 21, 42.25 m/s versus NCV at week 15, 60.56 m/s). This animal showed an increase in NfL at week 21 but no increase in NfL at weeks 15 or 30. Also, only minimal microscopic changes in the peroneal nerve were observed at necropsy (week 30). It is not clear whether peroneal slowing in this animal was related to dosing of branaplam. Besides the 1 animal mentioned above, responses of all animals in both branaplam groups were within the normal range for both velocity and amplitude. No clear deficit in the latency of the cauda equina measure was observed at any time point, suggesting a sparing of the central tracts.
GEP
Global transcriptional profiling of sciatic, sural nerves, and dorsal root ganglia was performed to characterize the temporal onset of expression changes linked to the peripheral nerve axonal degeneration and to compare distal versus proximal peripheral nerves and sensory ganglia in branaplam-treated animals. In addition, the same tissues sampled from animals treated with Pyridoxine were analyzed to assess similarities and differences to a compound known to induce peripheral neuropathy at high doses.
Overall, gene expression analysis of branaplam (intermittent or continuous) or pyridoxine-treated animals revealed overall minimal transcriptional changes. In addition, the changes were primarily observed in individual animals with no clear evolution over time. Three gene signatures encoding for transcripts expressed by neurons (neuron/neurite gene signature), expressed by Schwann cells (Schwann cell gene signature), or for genes usually regulated in response to injury (injury response gene signature) and were identified in the study.
In branaplam-treated animals, transcriptional changes were primarily observed in the sciatic nerve, and downregulation of signatures of nerve/neurite and Schwann cell, which reflected nerve injury, and upregulation of a “response to injury” signature, which likely reflected a repair response, were observed. A summary of the genes included in the response to injury signature is shown in Table 1. For each tissue, group-level expression data are provided in Supplementary Table S1.
The gene expression changes in the DRG were qualitatively similar, albeit to a lower degree than those observed in the sciatic nerve, with the exception of absence of clear modulation of the neuron/neurite signature or of transcripts encoding for neurofilaments in the DRG. The molecular changes in the DRGs did not have however any microscopic correlate. In the sural nerve, a few transcriptional changes were observed in individual animals, but these generally lacked time-dependency or consistency in the direction of modulation, suggesting inter-animal variability in this tissue rather than a treatment-related effect (Figure 3B and Supplementary File S1).
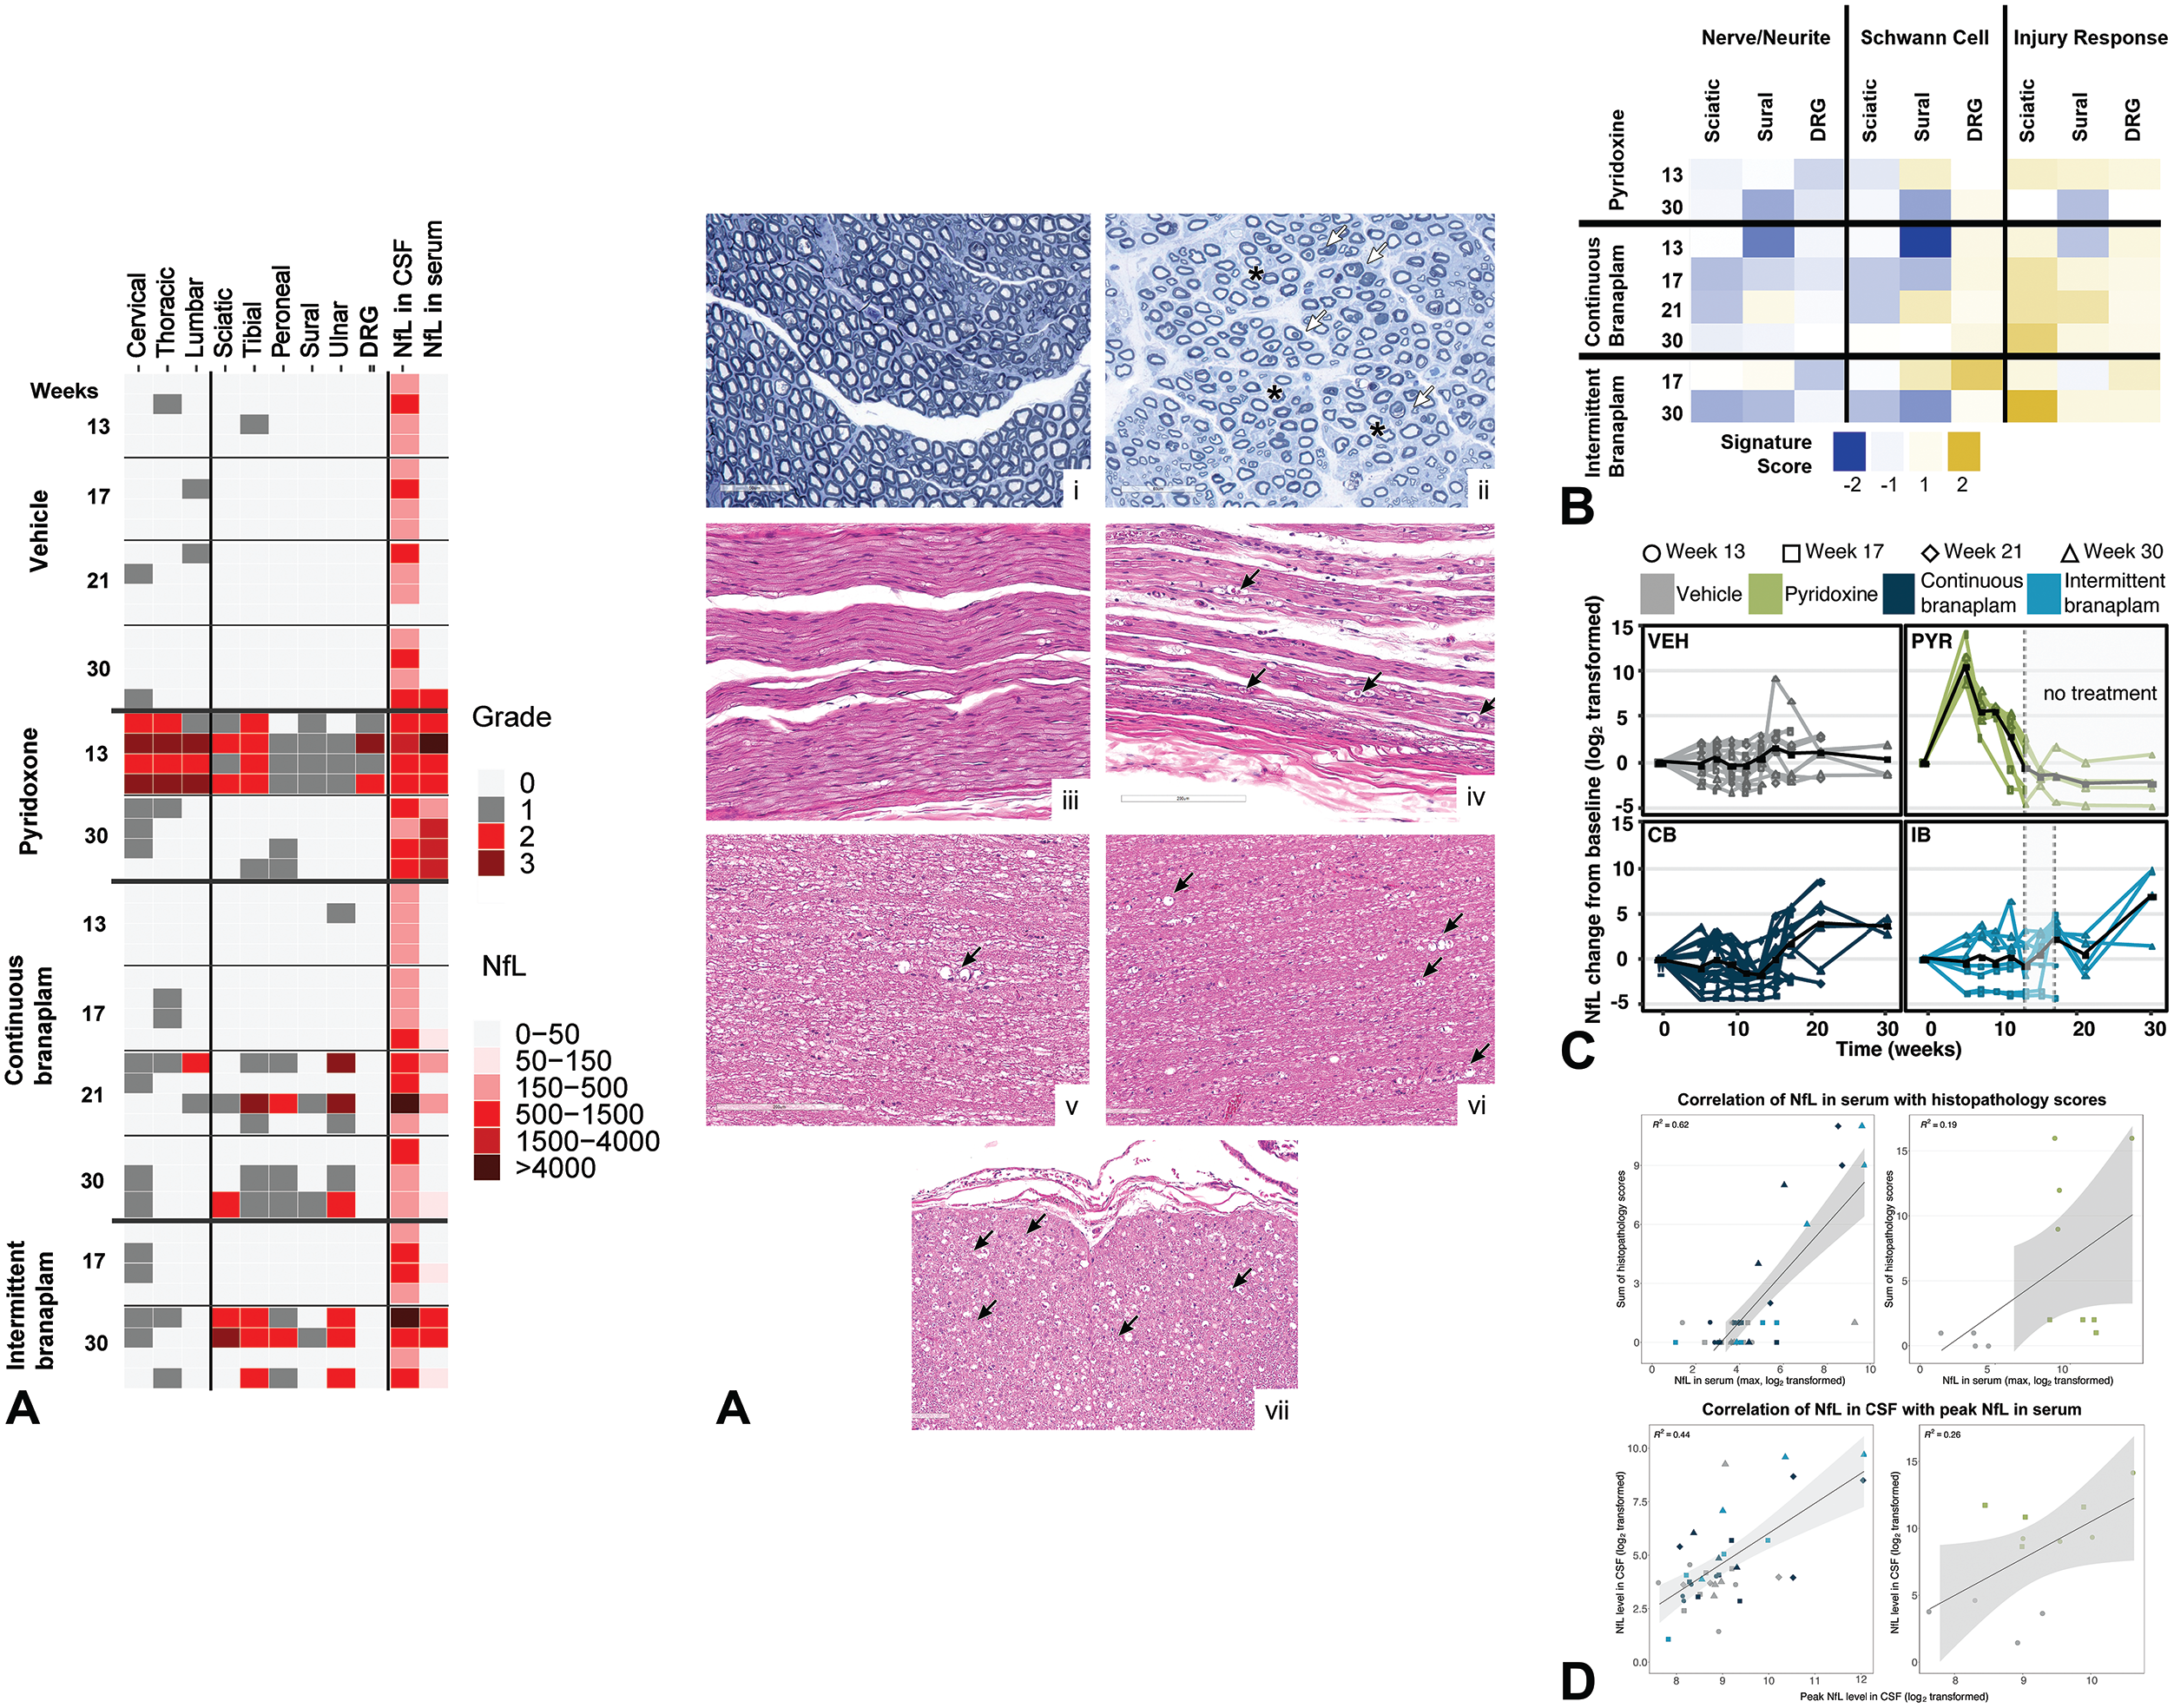
(A) Histopathology grades in the spinal cord and peripheral nerves versus NfL concentrations in serum and CSF. Toluidine blue staining ulnar nerve: (i) Transversal sections, vehicle-treated animal with normal axon density, and branaplam-treated animal (ii) with reduced axon density/loss of myelinated large fibers (red asterisks) and collapsed myelin sheets forming spheroids (white arrows). HE staining peripheral nerves: (iii) Longitudinal sections, vehicle-treated animal (normal appearance), and branaplam-treated animal (iv) with nerve fiber degeneration (axonal degeneration, black arrows) characterized by “digestion chambers” containing myelin and/or axonal debris and/or markedly distinct axonal swelling (“spheroids”). HE staining SC: (v) Longitudinal section through the cervical SC of a vehicle-treated animal with nerve fiber degeneration (black arrow, background finding), and longitudinal and transversal sections through the cervical SC of a branaplam-treated animal (vii, vii) with axonal nerve fiber degeneration (black arrows). (B) Gene signature scoring in branaplam- or pyridoxine-treated samples. (C) NfL concentrations in serum at different time points. The black line represents average NfL values. (D) Correlation of NfL in serum with histopathology scores and correlation of NfL in CSF with peak NfL in the serum. n = 4 for all groups. CB indicates continuous branaplam; CSF, cerebrospinal fluid; DRG, dorsal root ganglia; HE, hematoxylin and eosin; IB, intermittent branaplam; NfL, neurofilament light chain; PYR, pyridoxine; SC, spinal cord; VEH, vehicle.
Pyridoxine minimally downregulated the ganglion neuron signature in the DRG, while it respectively down- and upregulated the “Schwann cell” and the “response to injury” signatures in the sciatic nerve. No effects were observed in the sural nerve. Compared with branaplam, only a small proportion of the genes in these signatures were affected and the magnitude of the changes was lower (Figure 3B). Among the few genes downregulated by pyridoxine in the DRG neuron signature, there were also transcripts encoding for neurofilaments M and H. The minimal transcriptional changes reported in the pyridoxine group were attributed to the dosing scheme and necropsy time point, possibly already too far from the peak of neurotoxic effects (e.g., the 13-week necropsy time point comprises a 5-week dosing phase with neurotoxic levels of pyridoxine, followed by a 2-week treatment-free phase, and then by 6 weeks of a dosing phase with low dose levels of pyridoxine; the 30 week-necropsy time point comprises the treatment phases listed above plus an additional 17-week treatment-free period, see Figure 1).
Serum and CSF Levels of NfL
In the vehicle-treated group, 1 animal had elevated NfL concentrations in the serum at weeks 15 and 17, and had minimal microscopic axonal degeneration of unknown etiology (incidental finding) in the spinal cord. No CSF samples were taken from any study animals during this timeframe. At necropsy (week 30), this animal showed elevated NfL levels in the CSF. An increase of NfL in CSF was observed in an additional 3 animals with an incidental axonal degeneration in the spinal cord (Figure 3A and C). Two dogs that showed minimal axonal degeneration in the spinal cord or in 1 peripheral nerve had no elevated NfL concentrations in the serum or CSF.
In the pyridoxine-treated group, the highest NfL serum concentrations (10- to 450-fold higher than vehicle) were observed at week 5. After a 2-week drug-free period, slightly elevated serum NfL concentrations were still observed at week 7, but these returned to normal by week 11 (Figure 3C). The overall NfL profile and peak in NfL concentrations at week 5 matched the dosing regimen for this group (e.g., toxic pyridoxine dose levels were administered up to week 5; see Figure 1). Since the pyridoxine treatment group was necropsied at weeks 13 and 17, only a limited correlation of NfL serum levels with microscopic findings was possible (Figure 3A and D). An increase in CSF NfL concentrations compared with controls was observed in 3 animals at week 13 and 1 at week 30.
In the branaplam-treated groups, beginning at week 11, 1 animal in the intermittent dose group displayed a 2-fold increase in the NfL serum concentration compared with vehicle, and a 20-fold increase at week 30. Starting at week 17, 3 animals from both branaplam treatment groups showed a 3-fold increase in NfL serum concentrations at week 17, approximately 6- to 8-fold by week 21. By week 30, increased NfL serum concentrations were observed in 3 additional animals in the intermittent branaplam group (Figure 3A and C).
Elevated NfL CSF concentrations were observed in 1 of 4 animals in the intermittent branaplam group at week 17, in 3 of 8 in the continuous branaplam group at week 21, and in 2 of 4 animals in the intermittent branaplam group at week 30. In general, a correlation of NfL levels in CSF and serum was observed (Figure 3D). Except for 1 animal, elevated NfL concentrations were also seen in the sera at the respective time points. The 1 animal that did not exhibit elevated NfL in the serum had no microscopic findings in any of the nerves assessed but had minimal nerve fiber degeneration involving the cervical spinal cord. NfL data for individual animals are provided in Supplementary Table S2.
Microscopic Evaluation
In pyridoxine-treated animals, nerve fiber degeneration was observed in the spinal cord, peripheral nerves (sciatic, tibial, peroneal, sural, ulnar), trigeminal nerve, and DRG at week 13. These findings were consistent with findings reported in published literature.12,17 In the cervical (C1-C2) DRG of 2 of 4 pyridoxine-dosed animals, there were microscopic findings of minimal mononuclear inflammatory cell infiltrate, and in 2 of 4 animals, the lumbar (L4-L5) DRG were noted to have minimal nerve fiber degeneration. Microscopic findings were not observed in brain, including brainstem and cerebellum, thoracic (T6-T8) DRG, trigeminal ganglion, or vagus nerve. Nerve fiber degeneration was characterized by the presence of multiple sections of ballooned or dilated myelin sheaths variably containing fragments of axon and/or myelin “digestion chambers,” cellular debris; sometimes these fragments were observed and/or within the cytoplasm of phagocytic macrophages in the nerve or nerve fiber cluster. Following a 17-week recovery period (week 30), lower incidence and severity of microscopic findings of nerve fiber degeneration in both the spinal cord and peripheral nerves were observed compared with week 13 (Figure 3A).
In both branaplam-treated groups, no treatment-related microscopic findings were observed at week 13 (Figure 3A). At week 17, there was a slight increase in the incidence of nerve fiber degeneration in the spinal cord in both the continuous and intermittent branaplam groups compared with concurrent vehicle control animals. The degenerative changes were minimal in severity in the cervical and thoracic spinal cord of individual animals. The spinal cord lesions were small, focal, and did not have a specific anatomic distribution pattern in association with spinal cord tracts. At weeks 21 and 30, there was branaplam-related, minimal-to-moderate nerve fiber degeneration in the peripheral nerves (sciatic, tibial, peroneal, sural, and ulnar) and an increase in the incidence and/or severity of nerve fiber degeneration in the spinal cord. Representative images showing axonal degeneration in the peripheral nerves and spinal cord from animals treated with branaplam are shown in Figure 3A, i-vii.
The histopathology severity grading shown in Figure 3A was performed according to the suggested INHAND toxicological pathology nomenclature 18 and Society of Toxicologic Pathology “Points to Consider” document as well as established laboratory procedure of the sponsor test site. 19
Quantitative Image Analysis
The ratio of the axon diameter over the myelinated fiber diameter (g-ratio) represents one key parameter of nerve morphometry and is applied to assess hypomyelination as well as to assess axonal atrophy. 16 The results of the 1-dimensional g-ratio (Figure 4A and C) matched very well with the results of the 2-dimensional g-ratio (Figure 4B and D) in the sural and ulnar nerve in all treatment groups and at all time points.
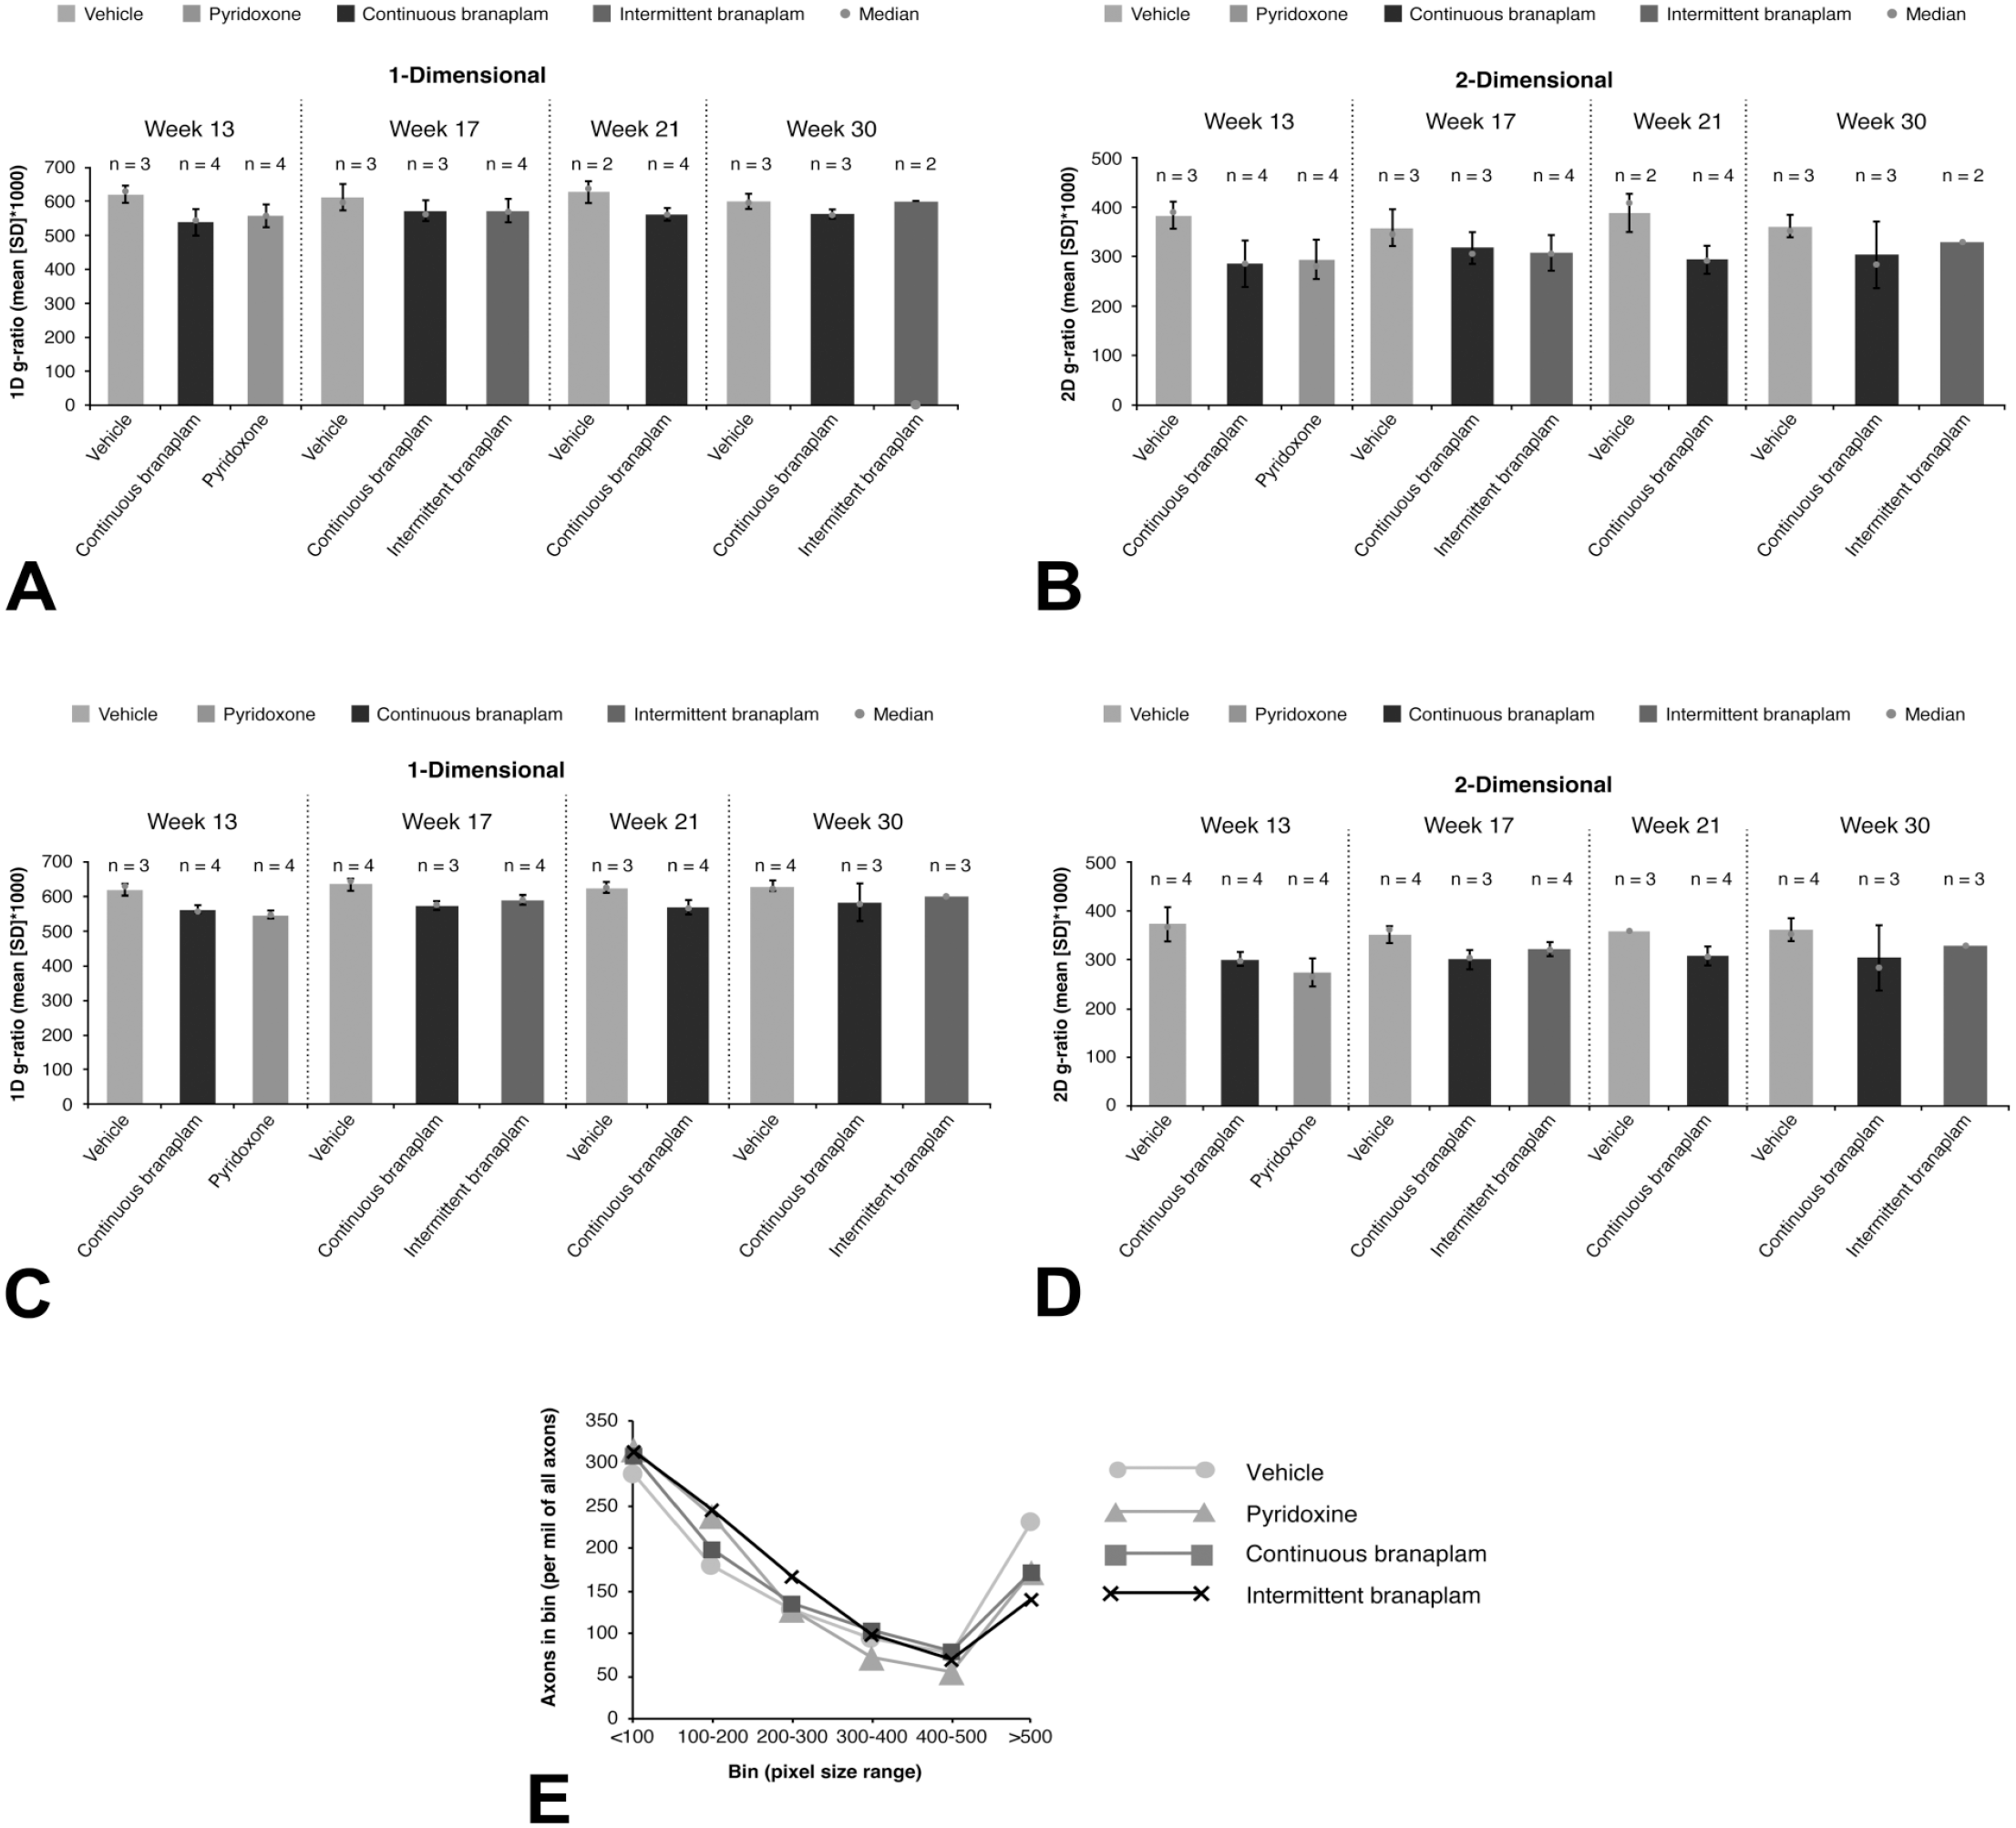
(A) 1D and (B) 2D g-ratio of the sural nerve. (C) 1D and (D) 2D g-ratio of the ulnar nerve. (E) Distribution of axon numbers across axon size bins of the ulnar nerve, at 30 weeks. The median over all cells per sample (scaled by a factor of 1000) was used to represent an individual animal’s g-ratio. 1D indicates 1-dimensional; 2-D, 2-dimensional; SD, standard deviation.
G-ratio values across treatment groups for the sural nerve and ulnar nerve are summarized in Table 2. In the vehicle-treated animals, the 1-dimensional g-ratio value was approximately 60% in the sural and ulnar nerves, and the 2-dimensional g-ratio was approximately 36%. Both g-ratio parameters remained constant over the different necropsy time points. Similarly, in a review of individual axon and myelin diameters of nerve fibers analyzed, the axon values ranged from 200 to 300 pixels, and the myelin values ranged from 400 to 600 pixels for both sural and ulnar nerves over the 4 sampling time points for the vehicle-treated animals. The fiber ratio parameter describing the density of nerve fibers across the section (percentage of total fiber area versus section area) remained approximately 50% for the ulnar and around 43% for sural nerves at the 13-, 17-, and 21-week time points. At week 30, an increase to approximately 60% for the ulnar and approximately 50% for the sural nerves was observed. A plot of the axon numbers across the axon size bins revealed a bimodal distribution of the myelinated fibers in the ulnar nerves (Figure 4E).
Morphometric parameters in the pyridoxine and branaplam treatment groups: relative changes compared with vehicle-treated animals.
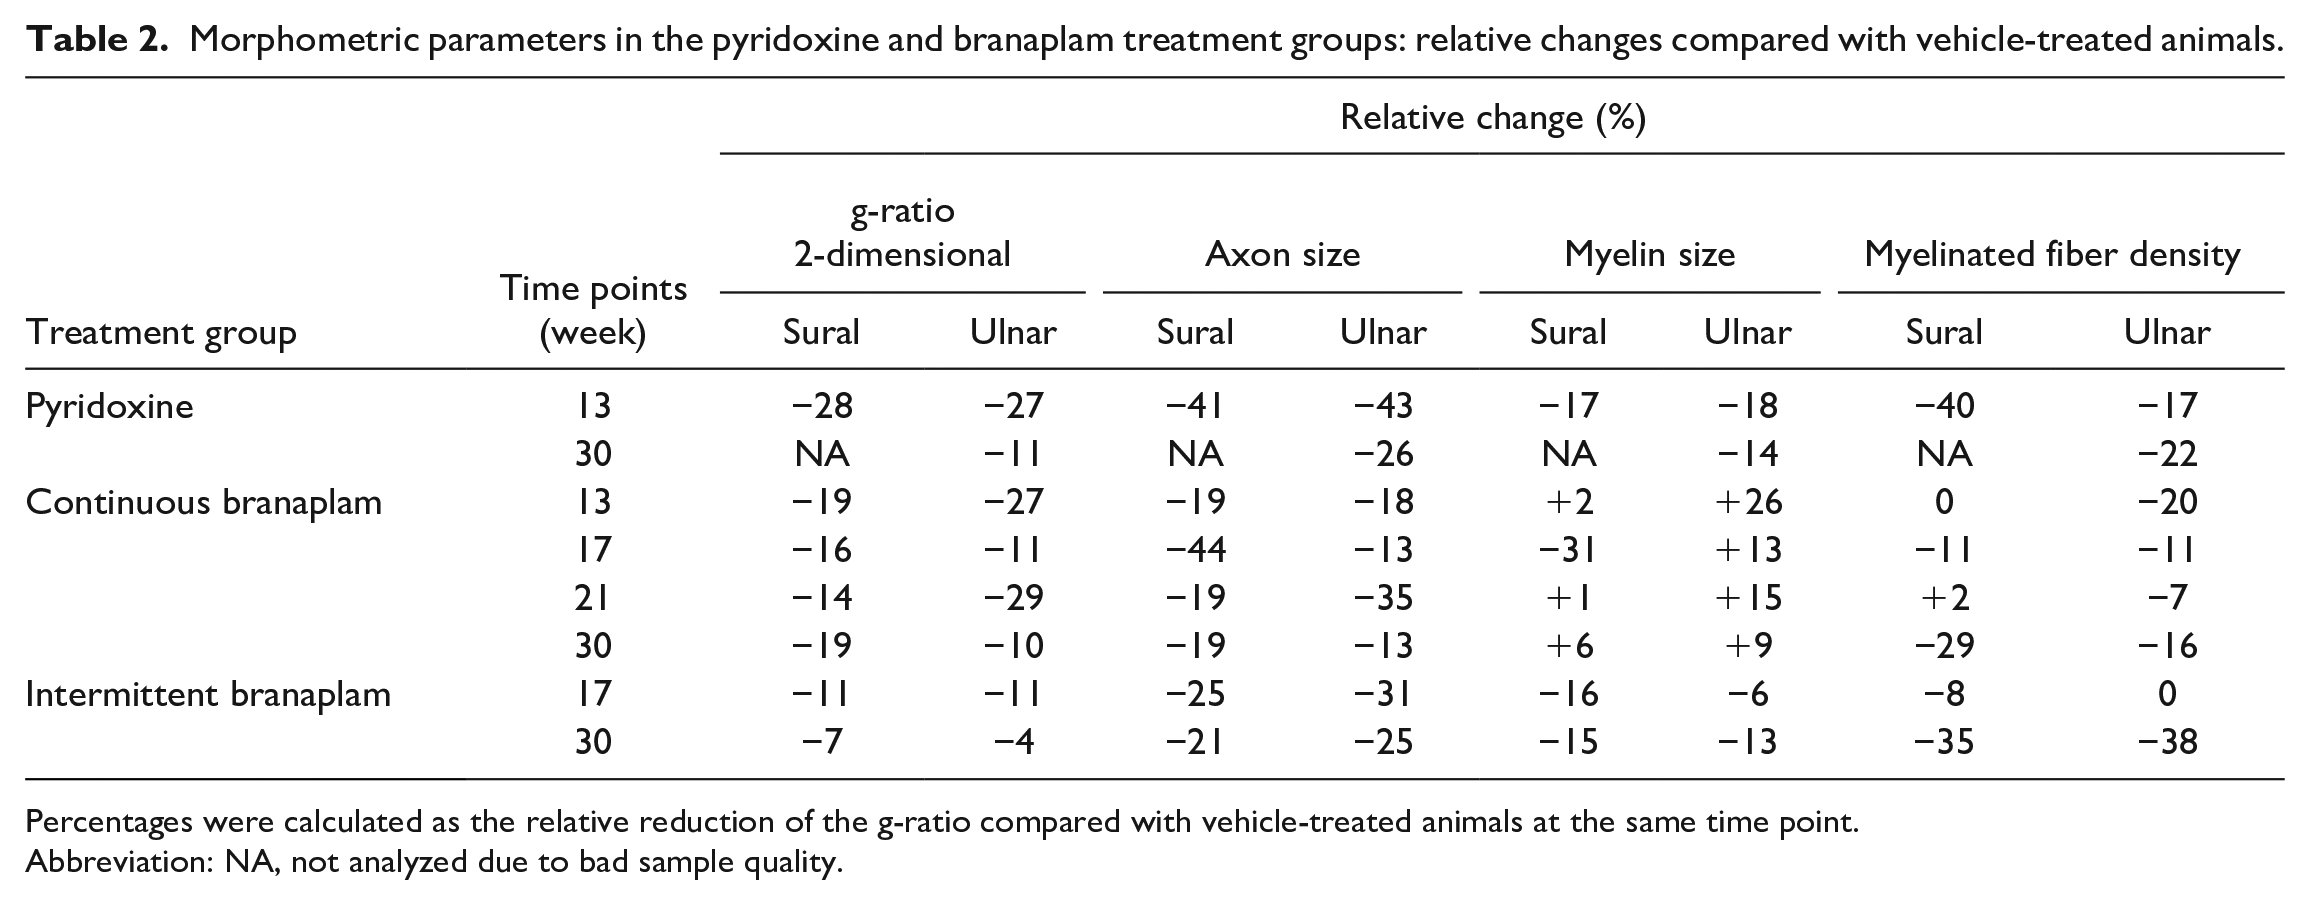
Percentages were calculated as the relative reduction of the g-ratio compared with vehicle-treated animals at the same time point.
Abbreviation: NA, not analyzed due to bad sample quality.
Discussion
In the present study, the utility or predictiveness of monitoring NfL concentrations in the serum to detect subtle nerve fiber degeneration in PNS induced by branaplam in dogs was evaluated. NfL is a major structural filament in nerve cells and is considered a promising biomarker of treatment response for certain neurological diseases. 20 During neuronal death of various central nervous system disorders, NfL is released into circulation, irrespective of the etiology of the disorder. 21 Thus, the release of NfL in the serum may also occur following peripheral axonal injury of various etiologies, including toxic injuries.3-5
Studies in humans with neurodegenerative dementia or multiple sclerosis reported a tight positive association between CSF and serum NfL levels, which highlights that serum levels closely reflect NfL release within the central nervous system.22,23 In a recent publication, it was shown blood and CSF NfL concentrations correlated with asymptomatic DRG/TG injury associated with AAV9 administration in Cynomolgus Monkeys, further suggesting that monitoring serum and plasma concentrations is as useful for assessment compared with more invasive CSF sampling. 24
In patients with severe chemotherapeutic-induced peripheral neuropathy, serum NfL levels were much higher compared with the central nervous system (CNS) diseases, which may be due direct release of NfL into the peripheral blood. 3
Branaplam is an SMN2 mRNA splicing modulator that was considered for potential treatment of Spinal Muscular Atrophy Type 1 and Huntington’s disease. As part of the non-clinical safety assessment studies of branaplam, a chronic toxicity study was conducted in juvenile dogs, in which no clinical findings and/or in-life neurological alterations were observed; however, during microscopic evaluation, an unexpected mild to moderate peripheral axonopathy was observed.
This microscopic finding, for which there was no correlative in-life neurological or clinical observations in the dogs, may have been caused by branaplam’s effect on the cell cycle, specifically, the stabilizing effect of branaplam on tubulin polymerization similar to Taxol (unpublished observation). Since monitoring of potential neurotoxic effects of drug treatment in a clinical setting may be challenging, particularly in infants, more suitable methods for sensitive detection of axonal damage are required. A promising method is the quantification of neurofilament concentrations in serum, which has previously been used successfully in clinical and experimental studies.1,25,26
In the current study, NfL concentrations from the serum of branaplam- and non-branaplam-treated dogs were assessed in correlation to the clinical, neurological, electrophysiological, neuropathological, morphometric, and gene profiling results. In addition, to demonstrate the sensitivity of the test system, pyridoxine, which is known to cause peripheral neuropathy at high dose levels, was used as a positive control.12,17
As expected from previous toxicological studies, both pyridoxine and branaplam induced lesions in the PNS and spinal cord. While pyridoxine clearly affected DRG and long myelinated fibers with nerve fiber degeneration with a recognizable distribution pattern, 27 branaplam induced scattered focal or multifocal lesions in peripheral nerves and spinal cord white matter without a specific distribution pattern. The ratio of the axon diameter to the myelinated fiber diameter (g-ratio) represents one key parameter of nerve morphometry and is applied to grade hypomyelination as well as to assess axonal atrophy. By applying morphometric evaluation to selected peripheral nerves, a mild reduction in the g-ratio was detected at all necropsy time points, which could be mainly attributed to a reduction in axon size and, simultaneously, little or no increase in myelin. A reduction of the g-ratio together with a slight reduction in the myelinated nerve fiber density in the sural and ulnar nerves of branaplam-treated animals was indicative of axonal atrophy at earlier time points, which manifested as pure axonopathy of large axons at the end of the study (week 30).
Pyridoxine-treated animals exhibited neurological signs with significant progressive deficits in the electrophysiological parameters, which tended to recover following cessation of dosing. NCV evaluations showed that exposure to pyridoxine caused early and substantial slowing of nerve conduction indicative of peripheral neuropathy with myelin involvement, with sensory nerves being especially vulnerable. The assessment of central conduction with recordings overlying the cervical spinal cord demonstrated no clear patterns indicative of a central neuropathy. In contrast to the pyridoxine-treated animals, branaplam treatment neither induced consistent neurological signs nor significantly altered electrophysiological parameters. While each treatment model exhibited nerve fiber degeneration of a different character and pattern, both resulted in release of neurofilament proteins into the extracellular space that was detected in the serum. Overall, results of the NfL measurements correlated well with the microscopic and morphometric data and were in line with the gene expression profiling data.
Highest NfL serum concentrations were observed in all pyridoxine-treated animals at week 5. NfL concentrations were 10- to 450-fold higher than in the vehicle-treated animals. Slightly elevated serum NfL concentrations were still observed at week 7, and returned to normal beginning with week 11. The overall NfL profile and peak in NfL concentrations corresponded with the administration of toxic dose levels of pyridoxine up to week 5.
In the branaplam-treated groups, a slight increase in the NfL serum concentration above control or baseline levels was observed in an individual animal starting with week 11 of treatment. The initial changes were 2-fold and increased up to 20-fold at the end of treatment. The levels of NfL in the CSF (fold change increase) were in general higher than the fold changes in the serum; however, the levels of serum NfL correlated better with the microscopic changes in peripheral nerves. Apart from one animal, an increase of NfL was observed also in the CSF at the time of necropsy. An increase of NfL was observed in the CSF, but not the serum, of one animal. Interestingly, an increase in NfL in CSF was also observed in dogs treated with vehicle with an incidental minimal nerve fiber degeneration in the spinal cord. Only one dog treated with vehicle had a transient increase of NfL in serum.
Minimal severity of nerve fiber degeneration in the spinal cord or nerves, whether incidental or induced by a neurotoxicant, did not always correlate with increased NfL in CSF or serum, whereas moderate severity of nerve fiber degeneration in the peripheral nerves always correlated with an increase of NfL in serum and/or CSF. Minimal nerve fiber degeneration with no increase of NfL in serum or CSF may relate to the distribution, extent, and/or evolution of axonal injury (e.g., a disseminated minimal axonal degeneration at many locations may lead to increase NfL levels in serum or CSF, whereas only a few focal axonal lesions do not lead to increased NfL levels; a minimal amount of axonal lesion needs to persist for some time before NfL is detected in CSF or serum). Increased NfL concentrations without correlative microscopic findings may be related to the tissue sampling, which is by nature limited. From the collected tissue, only small 1-dimensional neuro tissue samples (4.0 µm thickness) are evaluated microscopically. Therefore, any observed microscopic finding is significant, and lack of a microscopic finding does not necessarily rule out a false negative due to sampling. Hence, increased NfL concentrations in CSF or serum likely reflect an undetected minimal axonal injury. No microscopic changes were observed in the brain after administration of branaplam or pyridoxine. Nerve fiber degeneration was observed in the spinal cord with both compounds. In the DRG, nerve fiber degeneration was observed only in the pyridoxine-treated animals. An increase in NfL concentrations in the CSF but not in serum was observed when only spinal cord lesions were present. Based on this, an increase in NfL in the CSF is more sensitive for CNS lesions. However, CSF sampling by lumbar puncture may induce lesions in the spinal cord, which could lead to an increase in NfL concentration in the CSF and false positive results. 28
The mechanism of axonal injury induction and development differed between the compounds and could further be corroborated by GEP. Branaplam and pyridoxine-induced axonal damage with different severity and different patterns of distribution that were reflected in the gene signatures for nerve/neurite, Schwann cell, and response to injury. In the DRG, pyridoxine minimally downregulated a subset of genes of the ganglion neuron signature, including transcripts encoding for neurofilaments M and H, whereas no such transcriptional changes were induced by branaplam. Conversely, branaplam consistently downregulated the neurite signatures in the sciatic nerve, and to a lesser extent in the DRG, whereas pyridoxine did not modulate the neurite signature in the analyzed nerves or DRG. It cannot be ruled out that pyridoxine also modulated the neurite signatures at week 5, when animals were treated with high dose levels of pyridoxine and increased NfL concentrations were observed in serum, as the GEP was performed at week 13 and may have been too far from the peak of neurotoxic effects. In the sciatic nerve, pyridoxine and branaplam downregulated Schwann cell signature and upregulated the response to injury signature, albeit to a different extent for each compound. Interestingly, minimal changes in the latter signatures were also observed in the DRG of animals treated with branaplam, in which no morphological changes were observed by light microscopy, in contrast to animals treated with pyridoxine, in which clear morphological changes were observed. The GEP changes in the DRGs of branaplam-treated animals may be due to an ongoing adaptive/regenerative response, a process which is not active anymore in the DRGs of animals previously treated with pyridoxine (e.g., 6 weeks since the last toxic dose of pyridoxine).
In conclusion, all branaplam-treated animals that exhibited a moderate severity nerve fiber degeneration of peripheral nerves showed elevated NfL levels in serum. Furthermore, no neurological and electrophysiological changes were observed in these animals, indicating that serum NfL elevations may be more sensitive. However, in pyridoxine-treated animals that showed axonal degeneration in peripheral nerves and exhibited increased NfL concentrations in serum, minimal nerve fiber degeneration and mononuclear inflammatory cell infiltrate in the DRG, electrophysiological, and clinical changes were observed. Serum NfL collection allows a non-invasive and sensitive assay that can detect neurotoxic effects and can be used to monitor drug-induced neurotoxicity in preclinical and clinical trials.
Supplemental Material
sj-pdf-1-tpx-10.1177_01926233231180179 – Supplemental material for Neurofilament Light Chain: A Translational Safety Biomarker for Drug-Induced Peripheral Neurotoxicity
Supplemental material, sj-pdf-1-tpx-10.1177_01926233231180179 for Neurofilament Light Chain: A Translational Safety Biomarker for Drug-Induced Peripheral Neurotoxicity by Diethilde Theil, Jens Kuhle, Dominique Brees, Elaine Tritto, François Pognan, Wilfried Frieauff, Kelley Penraat, Emily Meseck, Reginald Valdez and Andreas Hartmann in Toxicologic Pathology
Footnotes
Acknowledgements
We are grateful to Professor Vandevelde for his invaluable scientific input. We would thank study monitor Marilynn Schneider (Novartis, East Hannover, NJ), and Christopher Hayden (Novartis, Cambridge, MA) for preparing the semi-thin sections of PNS samples and scanning for digital morphometry, Dr Joseph Arezzo for performing the electrophysiological assessments and Charles River Laboratories Senneville ULC for carrying out the animal experiments. Anjeza Petersen, PhD, Apurva Dave, PhD, and John Carron, PhD, of Nucleus Global, provided editorial support for the manuscript.
Declaration of Conflicting Interests
The author(s) declared the following potential conflicts of interest with respect to the research, authorship, and/or publication of this article: Drs, Brees, Tritto, Pognan, Frieauff, Penraat, Meseck, and Hartmann are employees of Novartis (which owns patent rights to branaplam) and receive stock options from Novartis. Drs Theil and Valdez are former employees of Novartis. Dr Kuhle is a consultant for Novartis.
Funding
The author(s) disclosed receipt of the following financial support for the research, authorship, and/or publication of this article: This study was funded by Novartis.
Supplemental Material
Supplemental material for this article is available online.
References
Supplementary Material
Please find the following supplemental material available below.
For Open Access articles published under a Creative Commons License, all supplemental material carries the same license as the article it is associated with.
For non-Open Access articles published, all supplemental material carries a non-exclusive license, and permission requests for re-use of supplemental material or any part of supplemental material shall be sent directly to the copyright owner as specified in the copyright notice associated with the article.