
Abstract
In this study, we assessed the toxicity and toxicokinetics of racemic vigabatrin and its S- and R-enantiomers (vigabatrin consists of 50:50% of the two enantiomers) by administering doses of the three test articles to male Long Evans rats via oral gavage. The animals were housed under high-intensity light conditions and the study consisted of an escalating dose phase and a 21-day fixed-dose phase. Systemic toxicity of vigabatrin appears to be due to the Vig-S-enantiomer only, as increasing doses of Vig-S or Vig-RS caused body weight loss, decreased food consumption, and affected activity. Administration of the Vig-R-enantiomer did not cause any such effects. Systemic exposure to R- and S-enantiomers was approximately linear with dose. Compared to administration of the racemate, there appeared to be a tendency for animals to take up higher amounts of Vig-R and lower amounts of Vig-S when administered as enantiomer. Bilateral retinal atrophy was observed in the fixed-dose phase in rats receiving Vig-S (either alone or as part of Vig-RS) and was characterized by irregular thinning and disorganization of the outer nuclear layer and thinning of the photoreceptor layer. The administration of the R-enantiomer alone did not cause any microscopic retinal change.
Keywords
Introduction
Vigabatrin (Vig-RS) is an antiepileptic agent that has a unique mode of action as it directly affects the γ-aminobutyric acid (GABA) metabolic pathway via a direct and irreversible inhibition of GABA-transaminase.1-3 Vigabatrin is a γ-vinyl-aminobutyric acid structural analog of the inhibitory neurotransmitter GABA. It prevents the degradation of GABA and thus increases GABA levels at the synaptic neuron cleft.2,4 The drug vigabatrin is a racemic mixture of the Sinister and Rectus enantiomers (here termed Vig-S and Vig-R, respectively), present in equal amounts.
In a previous publication, we validated the Long Evans rat as a pigmented animal model for studying the retinal effects of vigabatrin. 5 Pigmented animals have a natural melanin-based retinal protection toward light-induced effects and Rapp and Williams 6 suggested that the inherent susceptibility of the retina to damage induced by light would be the same for both pigmented (e.g., Long Evans) and nonpigmented rats (e.g., Sprague-Dawley) had it not been for the pigmentation-related resistance to light damage. Rasmussen et al. 5 demonstrated that retinal toxicity in the Long Evans rat could be induced by submitting the animals to ambient high light intensity (approximately 2000 lux, corresponding to average daylight intensity) combined with mydriasis, and that administration of vigabatrin would amplify the effects with a dose-related trend. Also, it was shown that administration of vigabatrin did not cause retinal effects in animals that were not housed under high light intensity. Histological evaluation of the eyes showed degeneration of the photoreceptor layer and outer nuclear layer, with progressive involvement of the outer plexiform and inner nuclear layers, in animals treated with vigabatrin at 30 or 150 mg/kg/day combined with high light exposure. These retinal changes were observed after 1 week of treatment and a time-dependent progression in severity was clearly seen after 3 and 6 weeks of treatment. The specific pattern of retinal toxicity characterized by a degeneration of the photoreceptor layer and the outer nuclear layer with a multifocal undulating appearance with a tendency to form the rosette-like structure was seen in vigabatrin-treated animals under these study conditions, when compared to vigabatrin-treated animals which were not submitted to high light exposure. In addition, a functional evaluation by electroretinography (ERG) revealed alterations of the ERG morphology, an increased implicit time and a decreased amplitude indicating that the combined exposure to vigabatrin at 150 mg/kg/day and high light exposure induced an alteration of the retinal function in this pigmented strain of rats.
It is assumed that only Vig-S is responsible for the GABA-transaminase activity and thus the therapeutic activity. 1 Following the administration of vigabatrin to mice, Walters et al. 7 demonstrated that the tissue ratio of Vig-S to Vig-R varied between 1 and 1.5 in the eye and the brain, increasing to approximately 13 in the retina. The observed pronounced accumulation of Vig-S in the retina caused the authors to suggest the involvement of a stereospecific transporter and in support of this hypothesis the work by Police et al. 4 demonstrated the involvement of the taurine transport in the retinal uptake of vigabatrin. Taurine is an essential amino acid and is one of the most abundant amino acids in the retina. 8
The detrimental effects of vigabatrin on the retina and vision in general have been studied for several years. 9 The clinical safety profile is well documented and includes the risk of retinopathy characterized by irreversible, bilateral, concentric peripheral visual field constriction.3,10 The visual field defects have been shown to correlate with changes in the retinal rod and cone b-wave amplitudes in ERG recordings. 11 The effects of vigabatrin on the ERG have also been demonstrated in animals5,12 and several studies have confirmed that light is a significant enhancer of vigabatrin toxicity, perhaps mediated by phototransduction signaling in the photoreceptors.5,13
The purpose of this study was to expand on our previous work on the toxicity of vigabatrin in Long Evans rats, this time focusing on the contributions of the individual enantiomers on the systemic and retinal toxicity of the compound. To be able to compare with previous findings the study design mimicked the design used previously. 5
Materials and Methods
This study was carried out in two phases. The main objective of the first phase was to assess the systemic toxicity based on daily clinical observations, body weight measurements (predose; then after 1, 3, 5, and 7 days of treatment at each dose level), and food consumption evaluation as well as the kinetics of the racemic vigabatrin form Vig-RS, and each enantiomer Vig-S and Vig-R, at escalating doses (each dose level was administered daily for 7 days), ultimately allowing for setting optimal doses for the second phase. Vig-RS consisted of a 50:50 mix of R- and S-vigabatrin as used in patients. While building on existing data on dose levels, this phase was needed to obtain results on the effects of each enantiomer compared to the racemic mixture, thus making sure the dose levels used in the fixed-dose phase were optimal. Phase 1 contained 5 animals per group.
The second phase was designed to assess systemic toxicity based on daily clinical observations, body weight measurements (predose; then weekly), food consumption evaluation and to assess more specifically the retinal toxicity of the three test articles by histological evaluation of the retina of the animals after an administration period of 21 days at fixed doses. In addition, a more detailed assessment of the kinetics of the three test articles was performed. Phase 2 contained six animals per group.
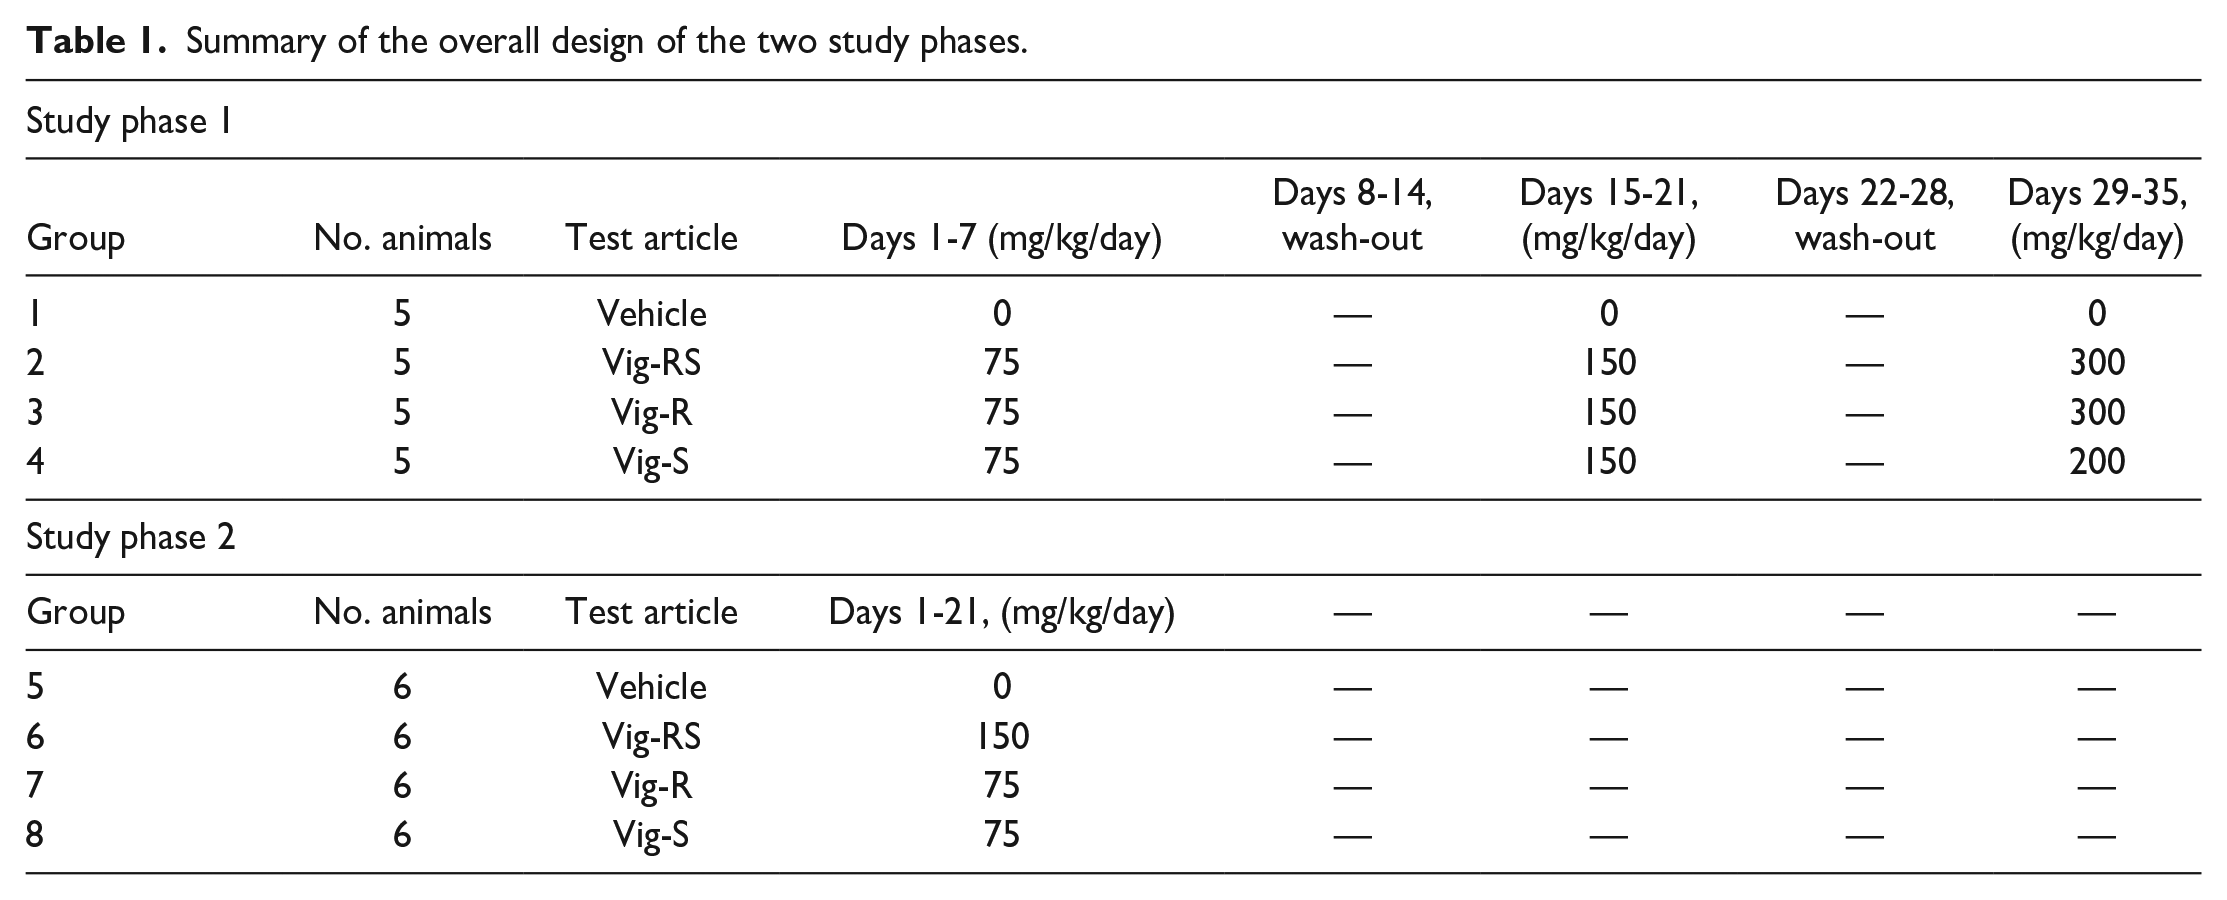
The study phases were run consecutively at Charles River Laboratories, Safety Assessment SAS, 329 Impasse du Domaine Rozier, Les Oncins, 69210 Saint Germain sur L’Arbresle, France, during 2019 and 2020. The study was performed in male Long Evans (LE) rats of the strain RjOrl: LE. All animals were purchased from CERJ Centre d’Elevage R. Janvier, Route des Chênes Secs, 53940 Le Genest-St-Isle, France. The animals were approximately 11 weeks of age when allocated to the study and weighed approximately 300 g at the initiation of treatment. The animals were group housed with appropriate bedding, fed with rat-pelleted complete diet ad libitum (Diet reference Safe A04C-10) and had unrestricted access to water. The overall study design is shown in Table 1.
Summary of the overall design of the two study phases.
Restriction of the study to include males only was judged sufficient to compare the TK profiles and toxicity of the three test items.
During both study phases, animals were administered Vig-RS, Vig-R, or Vig-S by oral gavage once daily using water as vehicle. The escalating dose phase consisting of three dose levels tested for 7 days (phase 1) was performed on the same groups of animals, while new groups of animals were used in phase 2.
Control animals were administered water at the same dose volume (15 mL/kg). All animals were subjected to high-intensity light of approximately 2000 lux using a 12-hr dark/12-hr light regime6,14 as also used in our previous study. 5 Mydriasis was induced by ocular instillation of 1% atropine in both eyes at least twice weekly during the treatment periods. The eyes of all animals were hydrated with daily instillations of 0.9% NaCl eye drops, up to 5 times per day. Animals were observed at least twice daily for mortality/morbidity and clinical signs. Body weights were recorded regularly.
The initial phase 1 dose levels were based on our previously published work in which a dose of 150 mg/kg/day Vig-RS was acceptable to Long Evans rats for up to 6 weeks, while a dose of 200 mg/kg/day Vig-RS caused unacceptable decreases in body weight. As Vig-RS contains 50% Vig-R and 50% Vig-S and it was unknown if one or both enantiomers caused the systemic toxicity, it was decided to use initial doses of 75 mg/kg/day Vig-RS, Vig-R, and Vig-S. Phase 1 had a duration of 35 days and consisted of 3 dosing periods, each lasting 7 days, with dose-free 7-day intervals in between. At the end of the phase, the animals were sacrificed without further procedures.
The phase 2 dose levels of 150 mg/kg/day Vig-RS, 75 mg/kg/day Vig-R and 75 mg/kg/day Vig-S were based on the results from phase 1 as well as our previously reported results. 5 Phase 2 had a duration of 21 days, which was demonstrated sufficient in the previous study to show characteristic changes in the retina. Animals were sacrificed on day 22 and the eyes were collected.
In phase 1 of the study, blood samples were collected at 1-hr postdose on the first dosing day and at 0-, 1-, 4-, and 8-hr postdose on the last dosing day. In phase 2 of the study, blood samples were taken at 0, 0.5, 1-, 2-, 4-, and 8-hr postdose on the first and last days of dosing. Blood samples of 0.3 ml were obtained from the jugular vein into tubes containing K3-EDTA as an anticoagulant. The samples were centrifuged within one hour after sampling (1800 ×g, 10 min at 4°C). Plasma was collected into 1.0 ml Nunc cryotubes (Thermo Scientific, Roskilde, Denmark) and stored frozen at −80°C until analysis. All samples were analyzed for Vig-R and/or Vig-S using a fit-for-purpose validated analytical procedure based on solid-phase extraction followed by liquid chromatography-tandem mass spectrometry. For the control group only samples taken at 1 hr (expected tmax) were analyzed.
Rat plasma concentrations of Vig-S and Vig-R were determined by LC-MS/MS at the Department of LC-MS Bioanalysis, H. Lundbeck A/S, Ottiliavej 9, DK-2500 Valby, Denmark.
An enantioselective LC-MS/MS method was established using racemic vigabatrin for the preparation of calibration standards and quality control samples. Stock solutions of Vig-RS (101.2%, H. Lundbeck A/S, Valby, Denmark) were prepared at a concentration of 0.500 mg/ml by dissolving the requisite amount in purified water (Milli-Q, Millipore, MA, USA). The stock solution was further diluted with purified water to produce two series of working solutions, which were then used for the preparation of calibration standards and quality control samples, respectively. Six calibration standards were prepared in 1.0 ml Nunc cryotubes by spiking blank rat EDTA plasma with an appropriate volume of working solution to obtain concentrations of 50, 125, 300, 800, 2000, and 5000 ng of each enantiomer per ml plasma. Quality control samples were prepared in concentrations of 150, 500, and 4000 ng of each enantiomer per ml plasma in the same manner as the calibration standards, but from a separate working solution. The stock solution was stored at 4°C in the dark until required, whereas the working solutions were prepared fresh on the day of use.
A stable isotope-labeled internal standard (IS, rac-vigabatrin 13 C, 2 H2, H. Lundbeck A/S, Valby, Denmark) was used for the quantification. A stock solution of the internal standard was prepared at a concentration of 0.100 mg/ml in purified water and hereafter, a working solution at a concentration of 100 ng/ml was obtained by diluting the stock solution in 0.1M phosphoric acid (analytical grade, Merck, Darmstadt, Germany).
The analytes and internal standards were extracted from rat plasma using the following procedure: The solid-phase extraction plate (Oasis MCX µElution Plate, 30µm, Waters, Milford, MA, USA) was pre-conditioned with 200 µl methanol (HPLC grade; Honeywell, Muskegon, MI, USA) followed by 200 µl purified water. A 50-µl aliquot sample was diluted in 500 µl of the internal standard solution containing 0.1M phosphoric acid. This was loaded on the preconditioned solid-phase extraction column under vacuum and then sequentially washed with 200 µl of 0.1M phosphoric acid followed by 200 µl methanol. The analytes and internal standards were eluted into a 96-well collection plate, 2 ml (Waters, Milford, MA, USA) using two times 100 µl aliquots of purified water: methanol: 25% ammonium hydroxide (analytical grade, Merck, Darmstadt, Germany) (75:25:5%v/v/v). The eluent was dried under a stream of nitrogen at 45°C and reconstituted in 200 µl of mobile phase for subsequent LC-MS/MS analysis.
Liquid chromatography (Waters Acquity UPLC, Milford, MA, USA) was performed using an Astec Chirobiotic TAG column (250 × 2.1 mm, 5-µm particles) supplied by Merck, Darmstadt, Germany. Resolution of enantiomers was achieved by isocratic elution using methanol, acetic acid (glacial, analytical grade, Merck, Darmstadt, Germany), and ammonium hydroxide (25%) in the ratio 100:0.1:0.1 (v:v%) as mobile phase at a flow rate of 0.300 ml/min. The runtime was 16 min, and the injection volume was 7.5 µl. The column was kept at room temperature whereas the temperature in the sample manager was retained at 4°C. Detection was achieved using a Xevo TQ mass spectrometer (Waters, Milford, MA, USA) equipped with an electrospray ionization interface. The optimized MS-parameters were: Cone voltage 15 V (analytes and IS), and collision energy 14 and 15 eV for analytes and IS, respectively. The mass spectrometer was operated with positive ionization in the multiple reaction monitoring mode (MRM) to monitor precursor-product ion pair transitions of m/z 130.1 → 71.0 for vigabatrin enantiomers and m/z 133.1 → 74.0 for the IS. Data acquisition and processing were performed in UNIFI version 1.9.2. Linear regression and quantification were performed in Watson LIMS version 7.4.2 (Thermo Fisher Scientific, Waltham, MA, USA) using a weighing factor of 1/x 2 and origin excluded. Calibration curves were linear over a range of 50.0 to 5000 ng/ml and the assay had an LLOQ of 50.0 ng/ml for each enantiomer. AUC was calculated by the linear up/log down trapezoidal rule using Watson LIMS version 7.4.2.
At the end of phase 2, animals were euthanized by carbon dioxide inhalation and exsanguination. Animals were subjected to a complete necropsy examination. The eyes were fixed in Davidson’s fixative for 2 days and then stored in Neutral Buffered Formalin (10%). Fixed eyes were paraffin-embedded, and 4- to 5-µm-thick tissue sections (one mid-sagittal section from each eye) were processed and stained with hematoxylin and eosin (H&E)-stained for routine light microscopic examination by a board-certified veterinary pathologist (P. Fant). The optic nerves were not submitted for microscopic evaluation.
Descriptive statistical evaluations of numerical data were performed (means and standard deviations).
All statistical tests were conducted at the 5% significance level. Pairwise comparisons were conducted using two-sided tests and were reported at the 1 and 5% levels. Levene’s test was used to assess the homogeneity of group variances. The groups were compared using an overall one-way ANOVA F-test if Levene’s test was not significant or the Kruskal-Wallis test if it was significant. If the overall F-test or Kruskal-Wallis test was found to be significant, then pairwise comparisons were conducted using Dunnett’s or Dunn’s test, respectively.
Research Involving Animals
This study was performed on Long Evans rats. The animals were housed and maintained in accordance with Charles River Laboratories and H. Lundbeck A/S animal welfare rules and according to EU principles for housing, maintaining, and handling experimental animals.
All animal procedures were conducted according to national animal welfare legislation as well as to the animal welfare policy of H. Lundbeck A/S and Charles River Laboratories. The study design was reviewed and approved by the ethical committee of Charles River Laboratories. Animal use was minimized to provide sufficient data for meaningful assessment.
Results
Systemic Toxicity
In phase 1, systemic toxicological effects were mainly observed as changes in body weight and food consumption, and to a minor degree as clinical signs (Figures 1-3). As can be seen from Figure 1, the mean body weight of the groups administered Vig-RS and Vig-S increased less than that of the control group during the 1-week treatment periods, while the group administered Vig-R showed no meaningful differences from the control group. The decreases in body weight gain were clearly dose-dependent and eventually became statistically significant, and at the highest dose levels, the decreases turned into actual body weight loss. When comparing the groups administered Vig-RS and Vig-S, it is apparent that the body weight changes in the Vig-RS group were caused by the Vig-S component as the amplitude of the changes in the Vig-RS group is roughly half of the change of the Vig-S group correlating with the amount of the S-enantiomer in the racemic formulation.
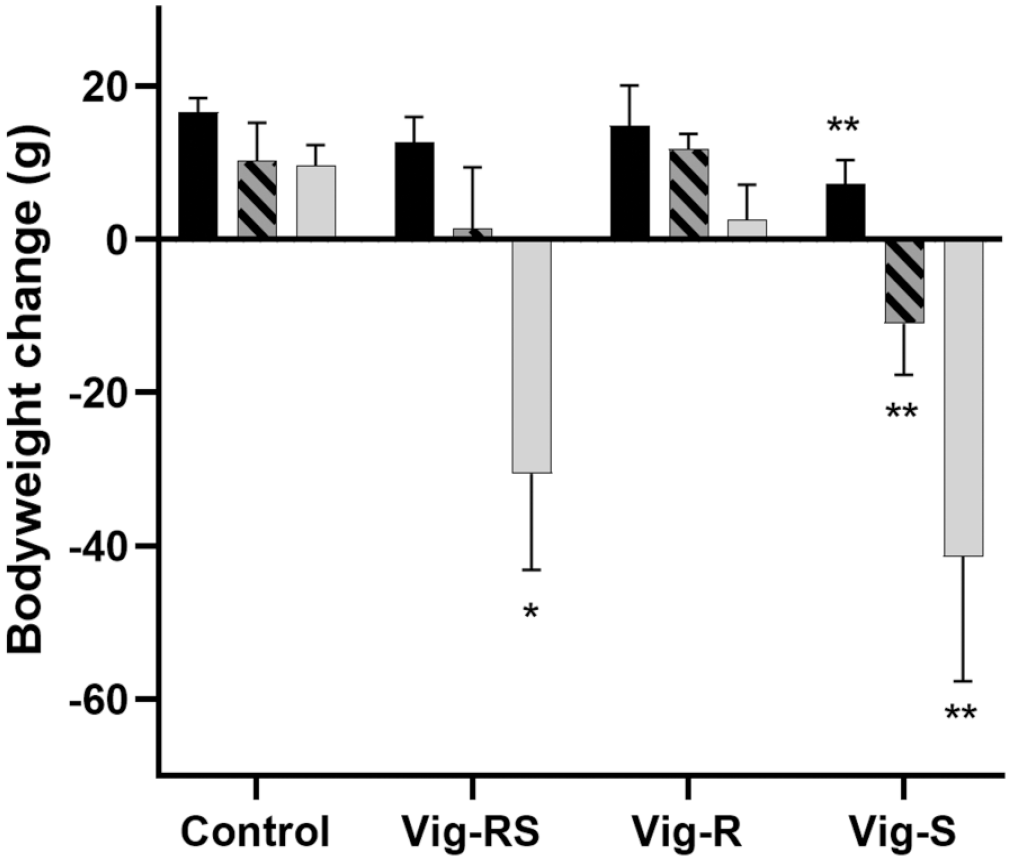
Phase 1 group mean body weight changes (g ± SD) following 1 week of treatment at each dose level according to Table 1. Black: day 1-7; Hatched: day 15-21; Grey: day 29-35. Data plotted as mean with SD. Treated group compared to the corresponding control group for the same time period. SD, standard deviation.
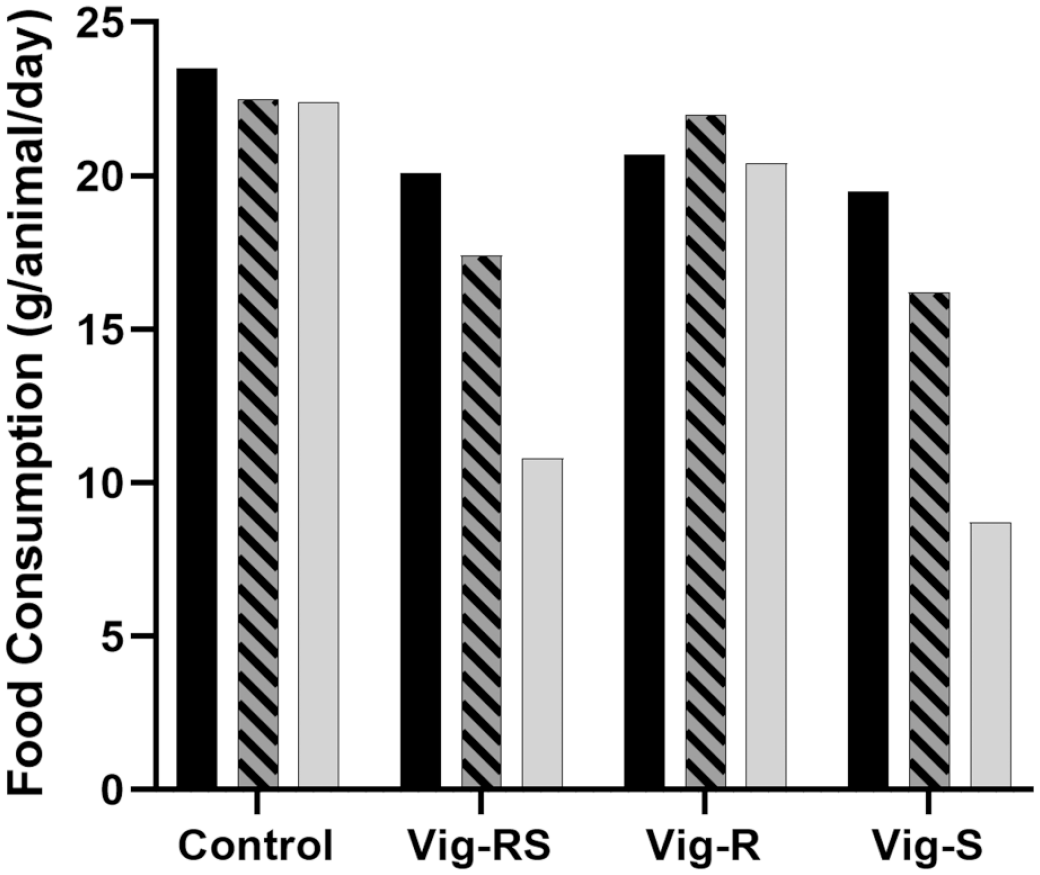
Phase 1 food consumption (g/animal/day) during 1 week of treatment according to Table 1. Black: Day 1-7; Hatched: Day 15-21; Grey: Day 15-21.
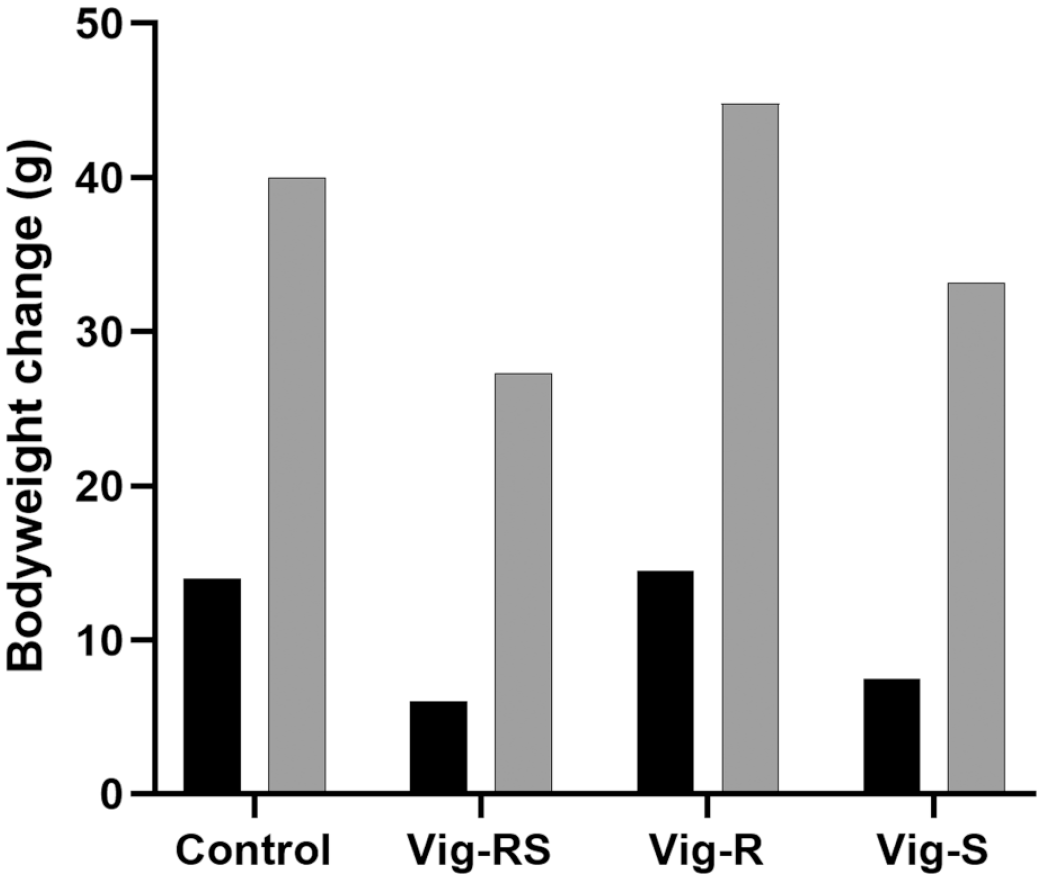
Phase 2 body weight changes (g) following treatment according to Table 1. Black: Day 1-7; Grey: Day 1-21.
The effects on food consumption (Figure 2) correspond to the effects seen on body weight (Figure 1). While not quite as apparent and not reaching statistical significance, a dose-related effect could be noted for both Vig-RS and Vig-S when compared to the control group, while no clear effect is seen for Vig-R.
Despite the clear effects on body weight and food consumption, only limited clinical signs in the form of decreased activity were recorded during phase 1. These findings were confined to the group administered Vig-S and were only recorded at the highest dose of 200 mg/kg/day (data not shown).
Results from phase 2 of the study confirm the results seen in phase 1 (Figure 3). Three weeks of administration of Vig-RS or Vig-S caused decreased body weight gain with effects after week 1 being similar to the changes seen after 1 week of treatment in phase 1, while 3 weeks of treatment apparently allowed the animals to adapt somewhat to the compounds resulting in less pronounced effects. No effects on body weight gain were seen in animals administered Vig-R.
Effects on food consumption were identical to those seen in phase 1 (data not shown) and as expected based on the phase 1 results no clinical signs were recorded in any groups.
Ocular Histopathology—Phase 2
Vig-RS, Vig-S, and Vig-R did not induce any macroscopic changes at the necropsy at the end of phase 2 (Table 2).
Overview of the retinal findings recorded in phase 2.
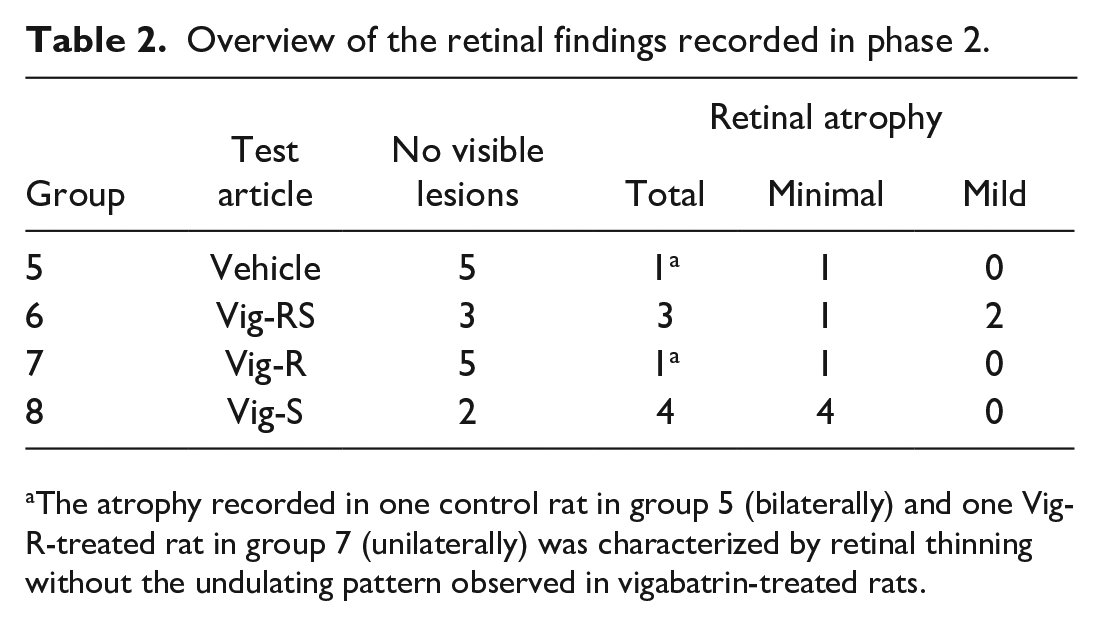
The atrophy recorded in one control rat in group 5 (bilaterally) and one Vig-R-treated rat in group 7 (unilaterally) was characterized by retinal thinning without the undulating pattern observed in vigabatrin-treated rats.
Microscopically, bilateral retinal atrophy was observed in 3 out of 6 rats given Vig-RS and 4 out of 6 rats given Vig-S and was characterized by the presence of foci of irregular thinning and disorganization of the photoreceptor, outer and inner nuclear and outer plexiform layers predominantly in the central retina. When compared with the normal architecture of rat retina (Figure 4), fewer nuclei were observed in the outer nuclear layer, and this exhibited an irregular undulating appearance. The thickness of the photoreceptor and outer plexiform layers was irregular, as well, and less disorganization was also noted in the inner nuclear layer (Figure 5). The inner plexiform and ganglion cell layers were considered unaffected. The architectural disruption of the retinal layers was not accompanied by any inflammatory change.
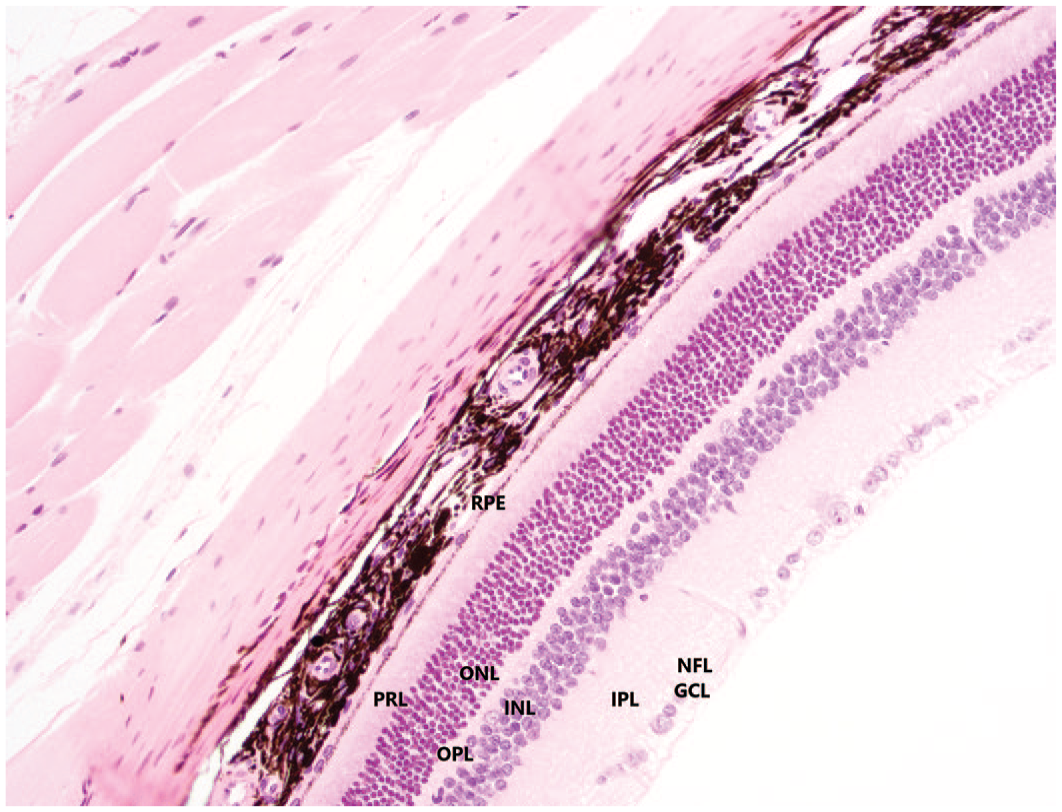
Normal anatomy of the retina in a control rat. H&E stain, original objective 20×. GCL, ganglion cell layer; H&E, hematoxylin and eosin; INL, inner nuclear layer; IPL, inner plexiform layer; NFL, nerve fiber layer; ONL, outer nuclear layer; OPL, outer plexiform layer; PRL, photoreceptor layer; RPE, retinal pigment epithelium.
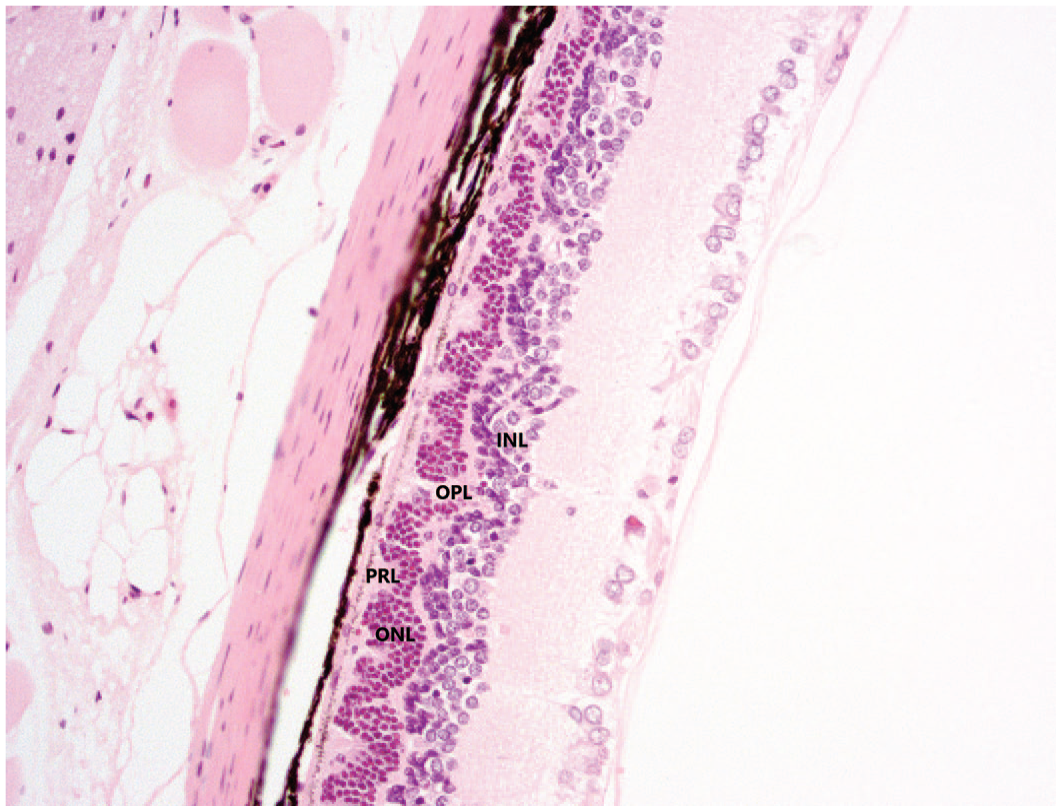
Vig-RS-related retinal atrophy was characterized by irregular attenuation of the PRL, ONL, OPL, and INL layers, resulting in an undulating retinal architecture. H&E stain, original objective 20×. H&E, hematoxylin and eosin; INL, inner nuclear layer; ONL, outer nuclear layer; OPL, outer plexiform layer; PRL, photoreceptor layer.
One out of 6 rats administered Vig-R displayed unilateral retinal atrophy characterized by focal thinning of the outer nuclear and photoreceptor layers. In this animal, however, the retinal atrophy was not characterized by the undulating-like disorganization noted in rats given Vig-RS or Vig-S. This change was considered spontaneous and unrelated to Vig-R and was similar to that observed bilaterally in one out of 6 untreated control rats (Figure 6).
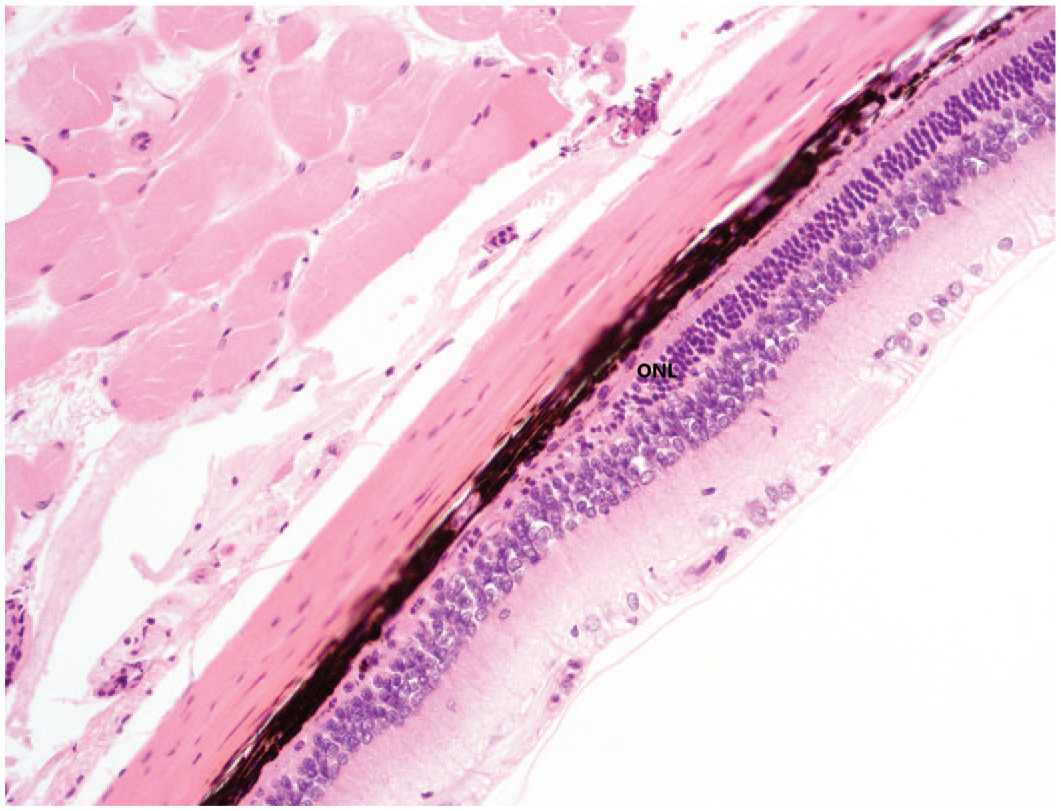
Spontaneous retinal atrophy in a control rat characterized by a decreased number of nuclei in the ONL and thinning of the outer plexiform layer and photoreceptor layer. This focus of atrophy does not exhibit the undulating-shaped architecture observed in Vig-RS-related retinal atrophy. H&E stain, original objective 20×. H&E, hematoxylin and eosin; ONL, outer nuclear layer.
Systemic Exposure to Vig-RS, Vig-R, and Vig-S
Phase 1
In general, plasma exposure in terms of Cmax values of Vig-R and/or Vig-S increased with increasing doses of Vig-RS and with increasing doses of Vig-R or Vig-S, respectively (Table 3). The increases in Cmax were approximately linear, with the dose-normalized exposure (exposure/dose) being approximately constant with increasing doses within a group.
Systemic exposure values of Vig-S and Vig-R following administration of Vig-RS, Vig-S and Vig-R. Top table: Cmax values for phase 1 (following 7 days of treatment). Bottom table: Cmax, AUC (area-under-the-curve) and Tmax values for phase 2 (following 21 days of treatment).
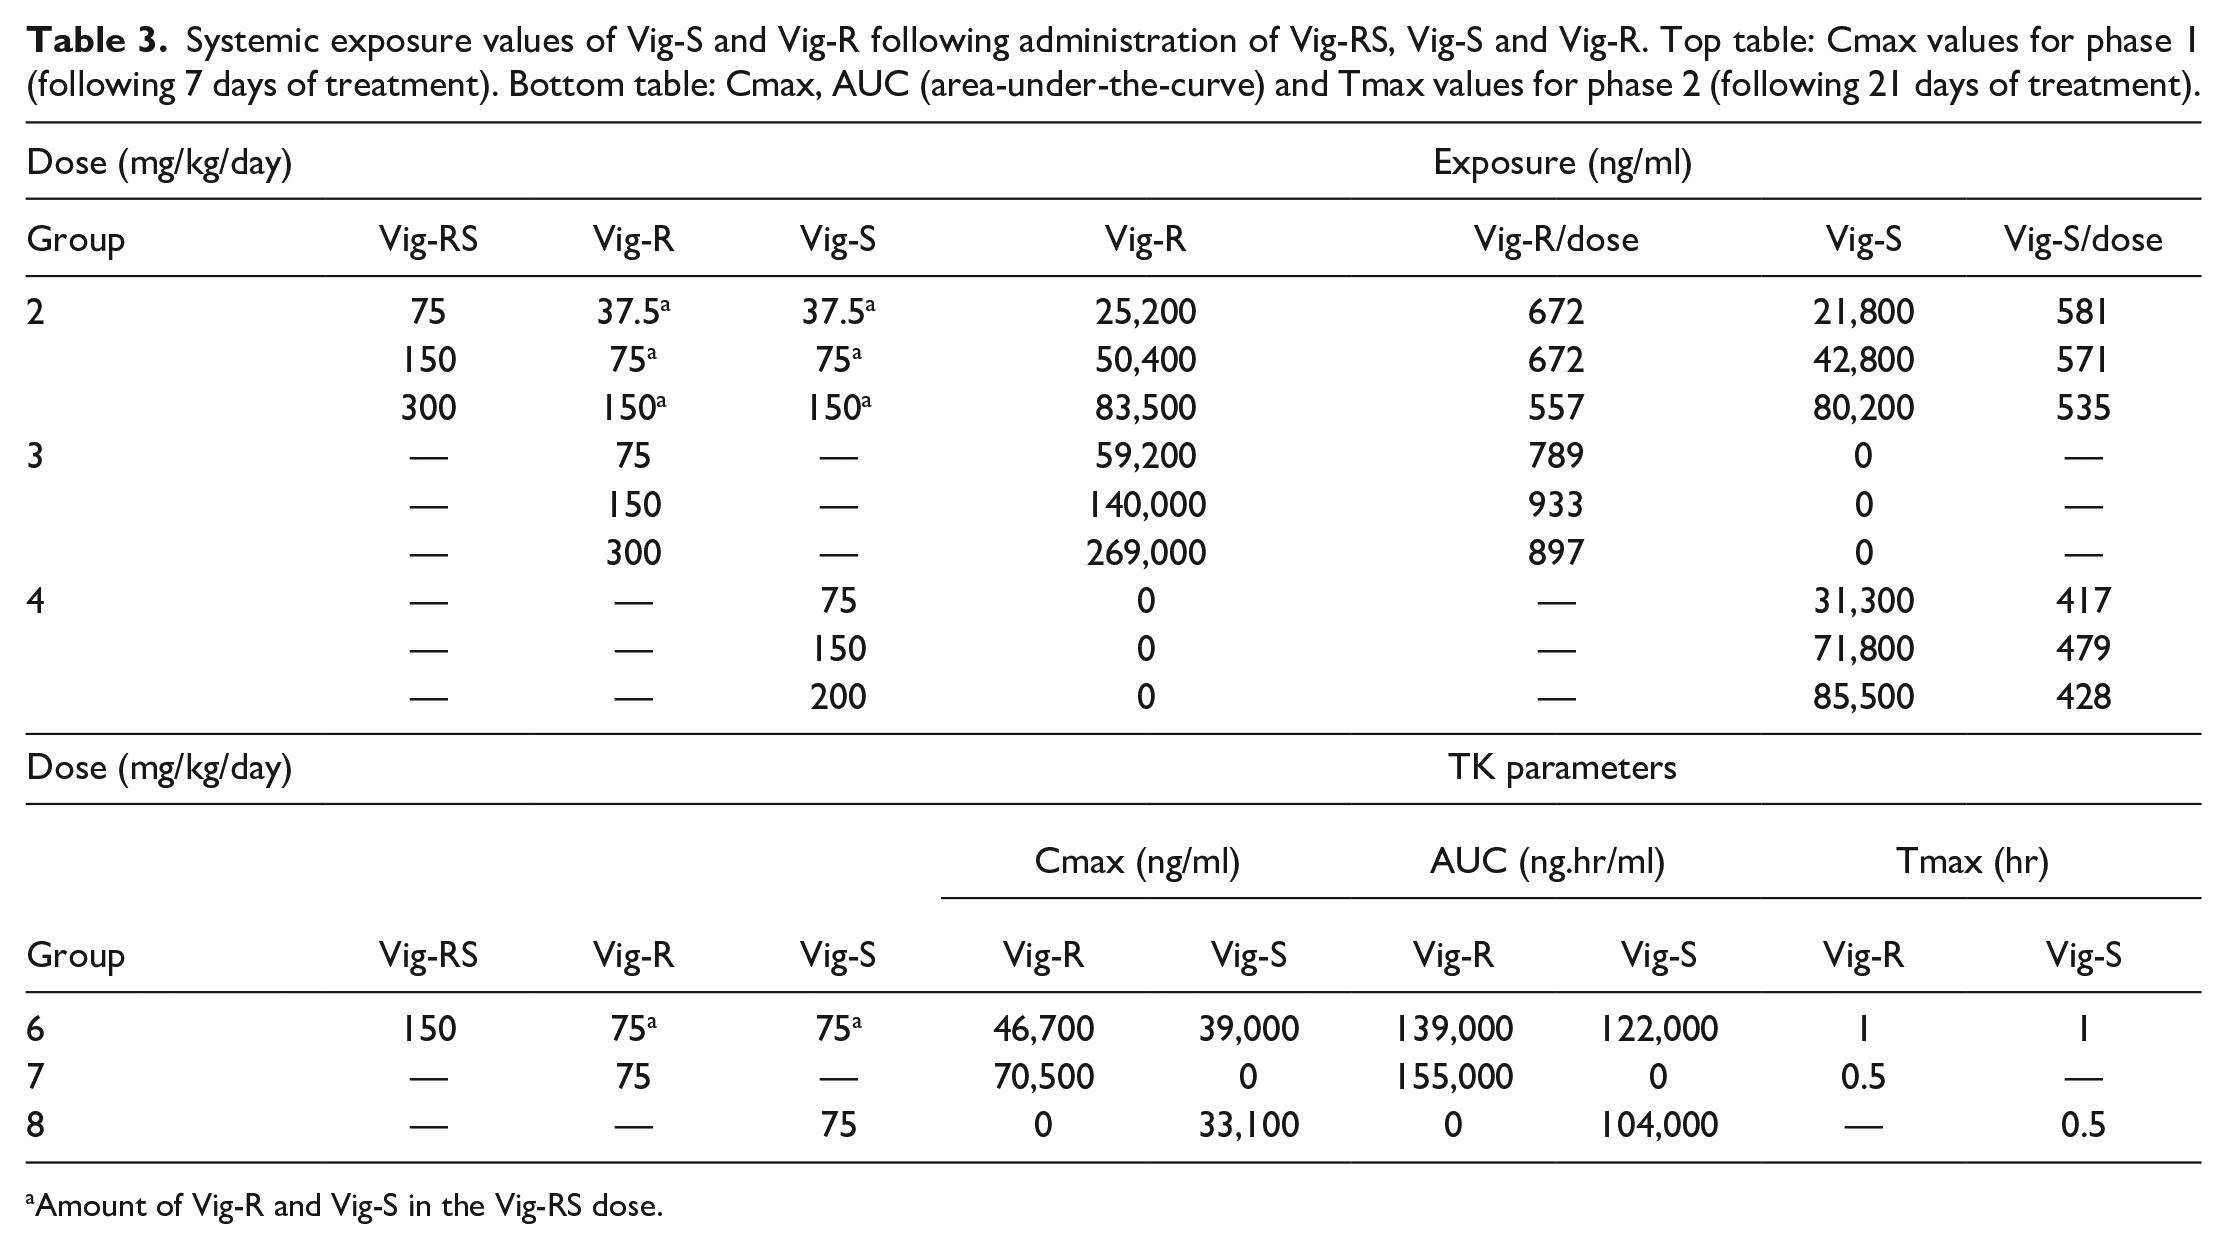
Amount of Vig-R and Vig-S in the Vig-RS dose.
When administering Vig-RS at doses of 75, 150, or 300 mg/kg/day the dose-normalized exposures were approximately equal for Vig-R and Vig-S. However, administration of the enantiomer (Vig-R or Vig-S) at daily doses of 75 and 150 mg/kg/day resulted in higher dose-normalized exposure for Vig-R, but lower for Vig-S, when compared to the dose-normalized exposures of Vig-R and Vig-S obtained after administration of the racemate.
Phase 2
In phase 2, rats in group 6 were administered 150 mg/kg/day Vig-RS (corresponding to 75 mg/kg/day Vig-R and 75 mg/kg/day Vig-S), while animals in group 7 and group 8 were administered 75 mg/kg/day Vig-R or Vig-S, respectively. Plasma concentration versus time profiles for phase 2 are depicted in Figures 7 and 8. The enantioselective analysis following either R or S administration suggested that chiral inversion of vigabatrin did not occur in vivo, as indicated by the absence of the nondosed enantiomer in the plasma samples.
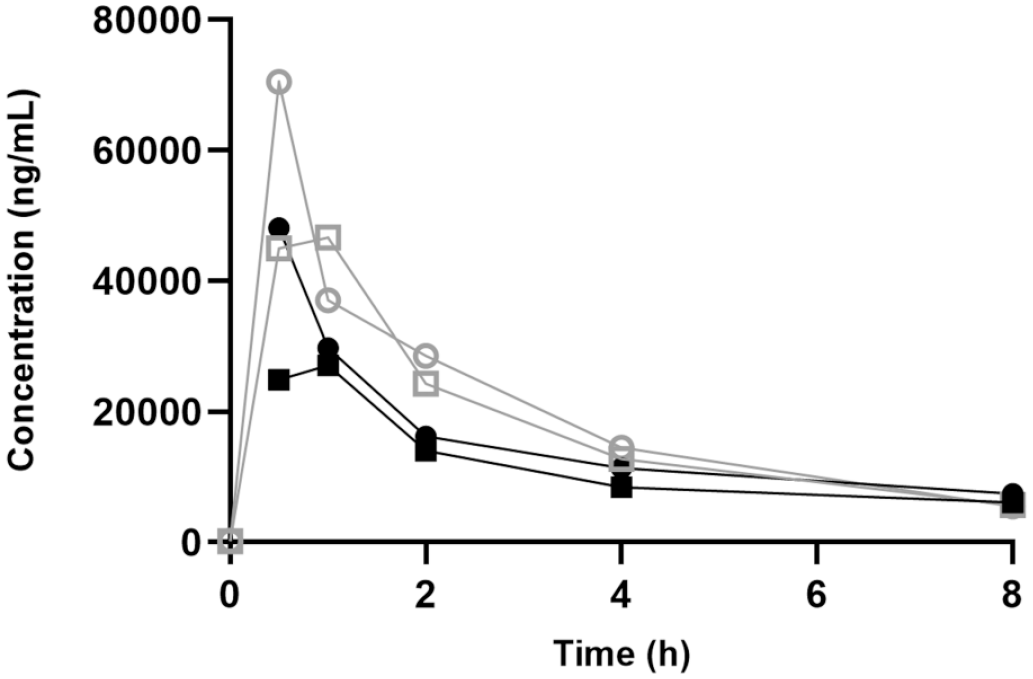
Pharmacokinetic profiles of Vig-R on day 1 (closed symbols) and day 21 (open symbols) following oral administrations of 150 mg/kg/day Vig-RS (square) or 75 mg/kg/day Vig-R (circle).
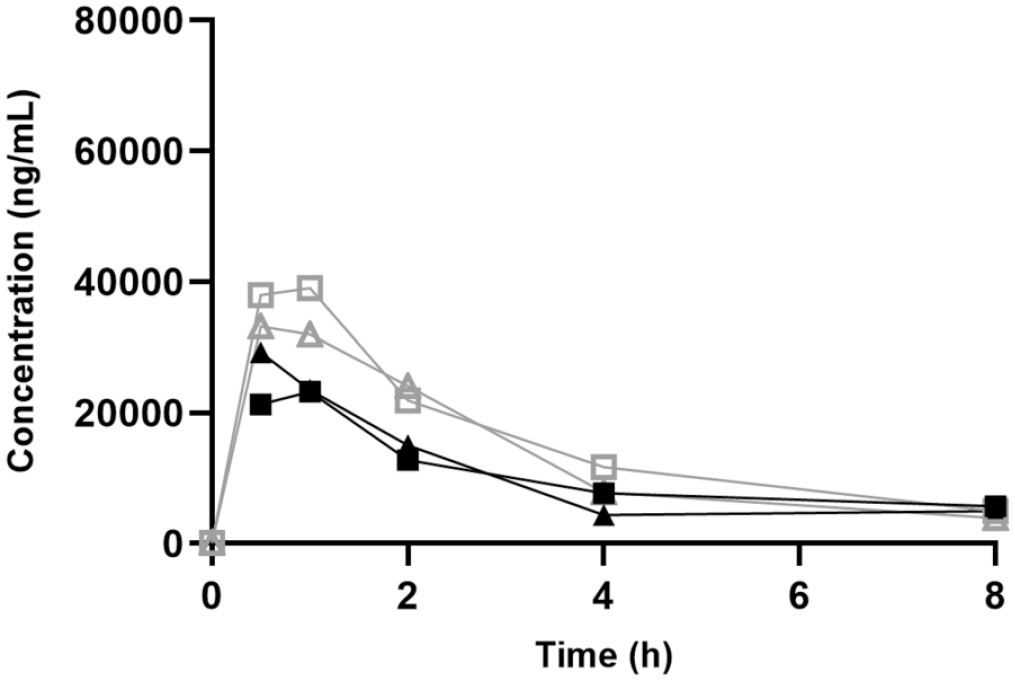
Pharmacokinetic profiles of Vig-S on day 1 (closed symbols) and day 21 (open symbols) following oral administrations of 150 mg/kg/day Vig-RS (square) or 75 mg/kg/day Vig-S (triangle).
Cmax and AUC values obtained in phase 2 (Table 3) corroborate the findings from phase 1 in two ways: First, the individual Cmax values from Phase 1 and Phase 2 were generally comparable, and second, when the enantiomers were administered individually there was a trend toward higher Vig-R exposure and lower Vig-S exposure as compared to the combined administration of Vig-R and Vig-S as Vig-RS. This trend was also apparent when comparing AUC values, as higher Vig-R and lower Vig-S values were seen when the two enantiomers were administered separately compared to administration as the racemate. Finally, the Tmax values for both Vig-R and Vig-S were 1 hr when administered together, but only 0.5 hr when administered as enantiomers.
Discussion
Administration of vigabatrin to patients is subject to a Risk Evaluation and Mitigation Strategy (REMS) and a warning of vision loss was issued as a black box warning on the FDA label. Several studies, both clinical 15 and nonclinical,12,14 have demonstrated the detrimental retinal effects of vigabatrin in humans and animals, and several publications on animal studies have contributed to the understanding of how this effect is brought about.3,10,16,17 It should be noted that some retinal damage in adult humans that has been attributed to vigabatrin may have been pre-existing to its administration. 18 It is not the intent of the authors to review all the findings here. Instead, we would like to draw attention to the wealth of information that has been created and to the fact that animal models exist that can be used to focus on both retinal accumulation and toxic effects of vigabatrin. It does, however, appear as if all published toxicity studies have been performed with vigabatrin as a racemic mixture with no knowledge of the effects of the individual enantiomers (R- and S-) on systemic and retinal toxicity. In the present study, we provide data that are linked to the individual enantiomers and evaluate their relative contributions to systemic and retinal toxicity.
Systemic Toxicity
Our results demonstrate that clear differences in the systemic toxicity exist when comparing the two enantiomers of vigabatrin. When administered as individual enantiomers, the R-enantiomer appeared well tolerated and nontoxic, with no effects on clinical signs, body weight, or food consumption at doses up to 300 mg/kg/day for 7 days or 75 mg/kg/day for 21 days. The results obtained when administering the S-enantiomer (Vig-S) were in striking contrast, as administration for 7 days resulted in a dose-related inhibitory effect on body weight increase with greater severity at 75 or 150 mg/kg/day, ultimately resulting in body weight loss at 200 mg/kg/day. This increase in dose was accompanied with decreased food consumption and even clinical signs at the highest dose and the findings were consistent with the findings following 21 days of administration of 75 mg/kg/day Vig-S.
When the vigabatrin S- and R-enantiomers were administered together the toxicological pattern was the same as described above for the S-enantiomer and could, on a dose-to-dose comparison, be linked exclusively to the S-enantiomer, i.e., the magnitude of the toxicological findings mirrored the findings observed in animals administered S-enantiomer exclusively. The results may also suggest that the R-enantiomer does not interfere with the effects of the S-enantiomer.
How the systemic toxicity of Vig-S is brought about is unknown, but it seems possible that this is an “on-target” effect of the enantiomer and thus caused by its intended mode of action. For example, it is known that vigabatrin affects the GABA shunt in the mitochondria and thus oxygen concentrations, 19 which potentially may affect all cells in the body. Also, vigabatrin enters the brain (as demonstrated by for instance Walters et al. 7 ) to exert its intended effect and although no clear clinical signs were recorded in our study brain effects may result in secondary effects on body weight and food consumption. The link to brain oxygen was demonstrated in a recent study 20 where it was shown that the intended vigabatrin-mediated inhibition of the brain GABA-transaminase prevented seizures in rats exposed to hyperbaric oxygen. It should be noted that the above-mentioned studies were performed using vigabatrin with no discrimination between the enantiomers.
It has not been possible to find data that could expand on the absence of toxicity of the R-enantiomer nor on the apparent lack of interaction between the R- and S-enantiomer when it comes to toxicity.
Retinal Toxicity
As only the S-enantiomer is responsible for GABA-transaminase inactivation and therapeutic activity it has been assumed that the S-enantiomer is responsible for ocular toxicity of vigabatrin. 1 Recent work 7 has demonstrated that Vig-S accumulates in the retina at a much higher concentration than Vig-R following administration of Vig-RS. The authors suggest that this is caused by a stereospecific transporter and plays a role in the vigabatrin-induced retinal toxicity. Although our work does not provide additional data on vigabatrin accumulation in the retina it does demonstrate a clear difference between the enantiomers with respect to retinal effects. The administration of the S-enantiomer alone or as part of the racemic mixture caused retinal atrophy that was observed bilaterally and was characterized by irregular thinning and disorganization of the outer nuclear layer as well as thinning of the photoreceptor layer. The administration of the R-enantiomer alone did not elicit similar findings. The recording of a single unilateral finding of retinal atrophy characterized by thinning and decreased cellularity of the retinal layers with no evident disorganization of the outer nuclear layer in one animal administered the R-enantiomer was considered unrelated to the treatment and consistent with spontaneous possibly light-induced retinal atrophy, which is known to occur in rats of different strains. 21 The retinal findings induced by Vig-RS and Vig-S were comparable to our previous findings 5 that were collected using the same model and study design as we used in this study.
Toxicokinetics of Vig-S and Vig-R
The toxicokinetic analysis demonstrated that the plasma concentration of the S- and R- enantiomers was similar when administered by oral gavage as the racemic mixture (Vig-RS, containing app. 50% of each enantiomer). Also, exposure in terms of Cmax was almost linearly related to dose. When administered separately, however, the uptake of the R-enantiomer was higher than would be expected based on the data from the administration of the racemic mixture, whereas the uptake of the S-enantiomer was lower than would be expected. The design of the present study did not allow for further investigation into this finding, but while this may have been a random finding based on the relatively low number of animals in the groups, the uptake of vigabatrin into tissues is still being investigated, especially into the retina. Walters et al. 7 demonstrated partitioning of preferably the S-vigabatrin into the retina and suggested the involvement of a stereospecific transporter. Work by Police et al. 4 suggests that the taurine transporter is involved in the uptake and accumulation of vigabatrin in the retina. In terms of intestinal absorption, a role for the proton-coupled amino acid transporter (PAT1) has been proposed as a possible mechanism of carrier-mediated uptake of vigabatrin from the intestinal lumen into the intestinal epithelial cell. 22 Thus, it may be hypothesized that the uptake of the enantiomers across the intestinal wall is also governed by specific transporters and that differences in affinities and saturation kinetics may influence the gastrointestinal uptake. That enantiomers may have different kinetic profiles and may even be best described using different compartment models has been seen for other compounds such as S- and R-ketorolac. 23
Footnotes
Acknowledgements
The authors would like to acknowledge colleagues and coworkers for a critical review and valuable comments on this paper.
Declaration of Conflicting Interests
The author(s) declared no potential conflicts of interest with respect to the research, authorship, and/or publication of this article.
Funding
The author(s) received no financial support for the research, authorship, and/or publication of this article.