
Abstract
Fibroblast growth factor 21 (FGF21) and FGF15/FGF19 belong to the same subgroup of FGFs and are believed to have therapeutic potential in the treatment of type 2 diabetes and associated metabolic dysfunctionalities and pathological conditions. FGF19 has been proposed to induce hyperplasia and liver tumors in FVB mice (named after its susceptibility to Friend leukemia virus B), mediated by the FGF receptor 4 (FGFR4). The goal of this work was to investigate whether FGF21 might also have a potential proliferative effect mediated via FGFR4 using liver-specific Fgfr4 knockout (KO) mice. We conducted a mechanistic 7-day study involving female Fgfr4 fl/fl and Fgfr4 KO mice with a treatment regimen of twice daily or daily subcutaneous injections of FGF21 or FGF19 (positive control), respectively. The Ki-67 liver labeling index (LI) was evaluated by a semi-automated bioimaging analysis. The results showed a statistically significant increase in FGF21- and FGF19-treated Fgfr4 fl/fl mice. Interestingly, in Fgfr4 KO mice, this effect was absent following both treatments of FGF19 and FGF21, indicating that not only the FGFR4 receptor is pivotal for the mediation of hepatocellular proliferation by FGF19 leading finally to liver tumors but it seems also that FGFR4/FGF21 signaling has an impact on the hepatocellular proliferative activity, which does not promote the formation of hepatocellular liver tumors based on the current knowledge.
Introduction
Over the past 20 years, fibroblast growth factor 21 (FGF21) and fibroblast growth factor 19 (FGF19) mimetics have been subject to intensive research and have been suggested for the treatment of type 2 diabetes and obesity. Both FGF19/FGF15 (FGF15 the murine analog) and FGF21 together with FGF23 belong to a subgroup of FGFs with specific hormone-like/endocrine functionality. Beneficial effects in human beings, 1 obese nonhuman primates, 2 and in ob/ob mice 3 are reported for FGF21 mimetics, in which body weight reduction, increased insulin sensitivity, improved lipid profile, and reduced liver fat in steatosis have been shown. It is believed that those beneficial effects are mediated by the activation of FGFR1, a member of the FGF receptor family represented by the FGFR1c, FGFR1b, FGFR2c, FGFR2b, FGFR3c, FGFR3b, and FGFR4 isotypes. Because of its unique role, FGFR1 specificity is described to be a key characteristic of potential antidiabetic/antiobesity drugs. Concurrent with this, the lack of specificity toward FGFR1 could be the reason for unwanted site effects including the promotion of hepatocyte proliferation, 3 described for the chimera of FGF21 and FGF19 missing FGF receptor specificity. Co-expression of klotho beta (KLB), the cofactor of FGF21 and FGF19/15, is a critical component in this pathway to achieve target specificity. 4 A growing number of reports indicate that FGF19 promotes hepatocellular carcinomas (HCC) shown in FGF19-treated or transgenic mice overexpressing FGF19, 5 as well as in humans, 6 leading to the assumption that FGF19, FGFR, and KLB inhibitors could be promising therapeutic targets against specific types of human HCC.7 -9 Furthermore, it is reported that the activation of the FGF19/FGFR4 downstream signaling induces proliferation of hepatocytes, leading to tumor generation (preneoplastic hepatocellular hyperplasia, adenomas, and carcinomas).5,10,11 Our own observations from previous proliferation studies with FGF21 and FGF19 (Supplemental Material 1) have confirmed the proliferative activity of FGF19. However, in contrast to the literature, we also observed a proliferative potential in hepatocytes when treated with FGF21, especially in acute studies using young (6 to 8 weeks old) FVB female mice. The 7-day treatment with FGF19 or FGF21 revealed a proliferation rate of 11-fold vs 4-fold, and after the 28-day treatment, a comparable proliferation rate of 3- to 4-fold for both FGF19 and FGF21 was observed. To reproduce and reinforce these data and to investigate the role of FGFR4, we initiated the current mechanistic study.
Here, we report the results of our mechanistic proliferation study that was carried out in female Fgfr4 fl/fl and Fgfr4 KO mice and characterize the role of FGFR4 in mediating proliferative effects of recombinant human proteins FGF21 and FGF19 by applying semi-automatic computer-assisted image analysis. Because of specific functionality and histomorphology of different liver lobular regions, a zone-dependent evaluation of the liver lobules was performed in order to cover zone-specific proliferative activity.12,13
Material and Method
Generation of Liver-Specific Fgfr4 KO Mice
To generate conditional knockout (cKO) of the murine Fgfr4 gen, we floxed exon 6 of the target gene, which leads to a frameshift under cre recombination and, hence, disruption of the gene expression (Figure 1A). We applied the CRISPR/Cas9 technology (Custered Regularly Interspaced Short Palindromic Repeats/Endonuklease Cas9) to mediate the knock-in of the two loxP sites. For this, we designed proximal (gggtttagcttgctgtcaggagg) and distal (aaataagcccaagggtcagcagg) guide RNAs targeting introns 5 and 6 of the mouse gene, respectively. Floxed founder animals were produced via microinjection of Cas9 reagents into FVB (FVB/NCrl; strain code: 207) zygotes followed by embryo transfer to pseudopregnant females. The resulting live births were screened for mutations by PCR and sequencing of the region flanking the Cas9 targeting site(s). The mutant founders 198 and 194 were further characterized, and the founder 194 was selected for expansion and production of the cohort, which were crossed with Alb-cre mice with cre expression directed specifically to the liver. The crossbreeding of Fgfr4 floxed (Fgfr4 fl/fl) mice with Alb-cre mice produces offsprings that are deficient for Fgfr4 (Fgfr4 KO) in the liver. The genotypes were analyzed and confirmed by PCR on the genomic DNA extracted from tail biopsies. The used primer and probes for the genotyping assay and the PCR conditions are provided in Table 1.
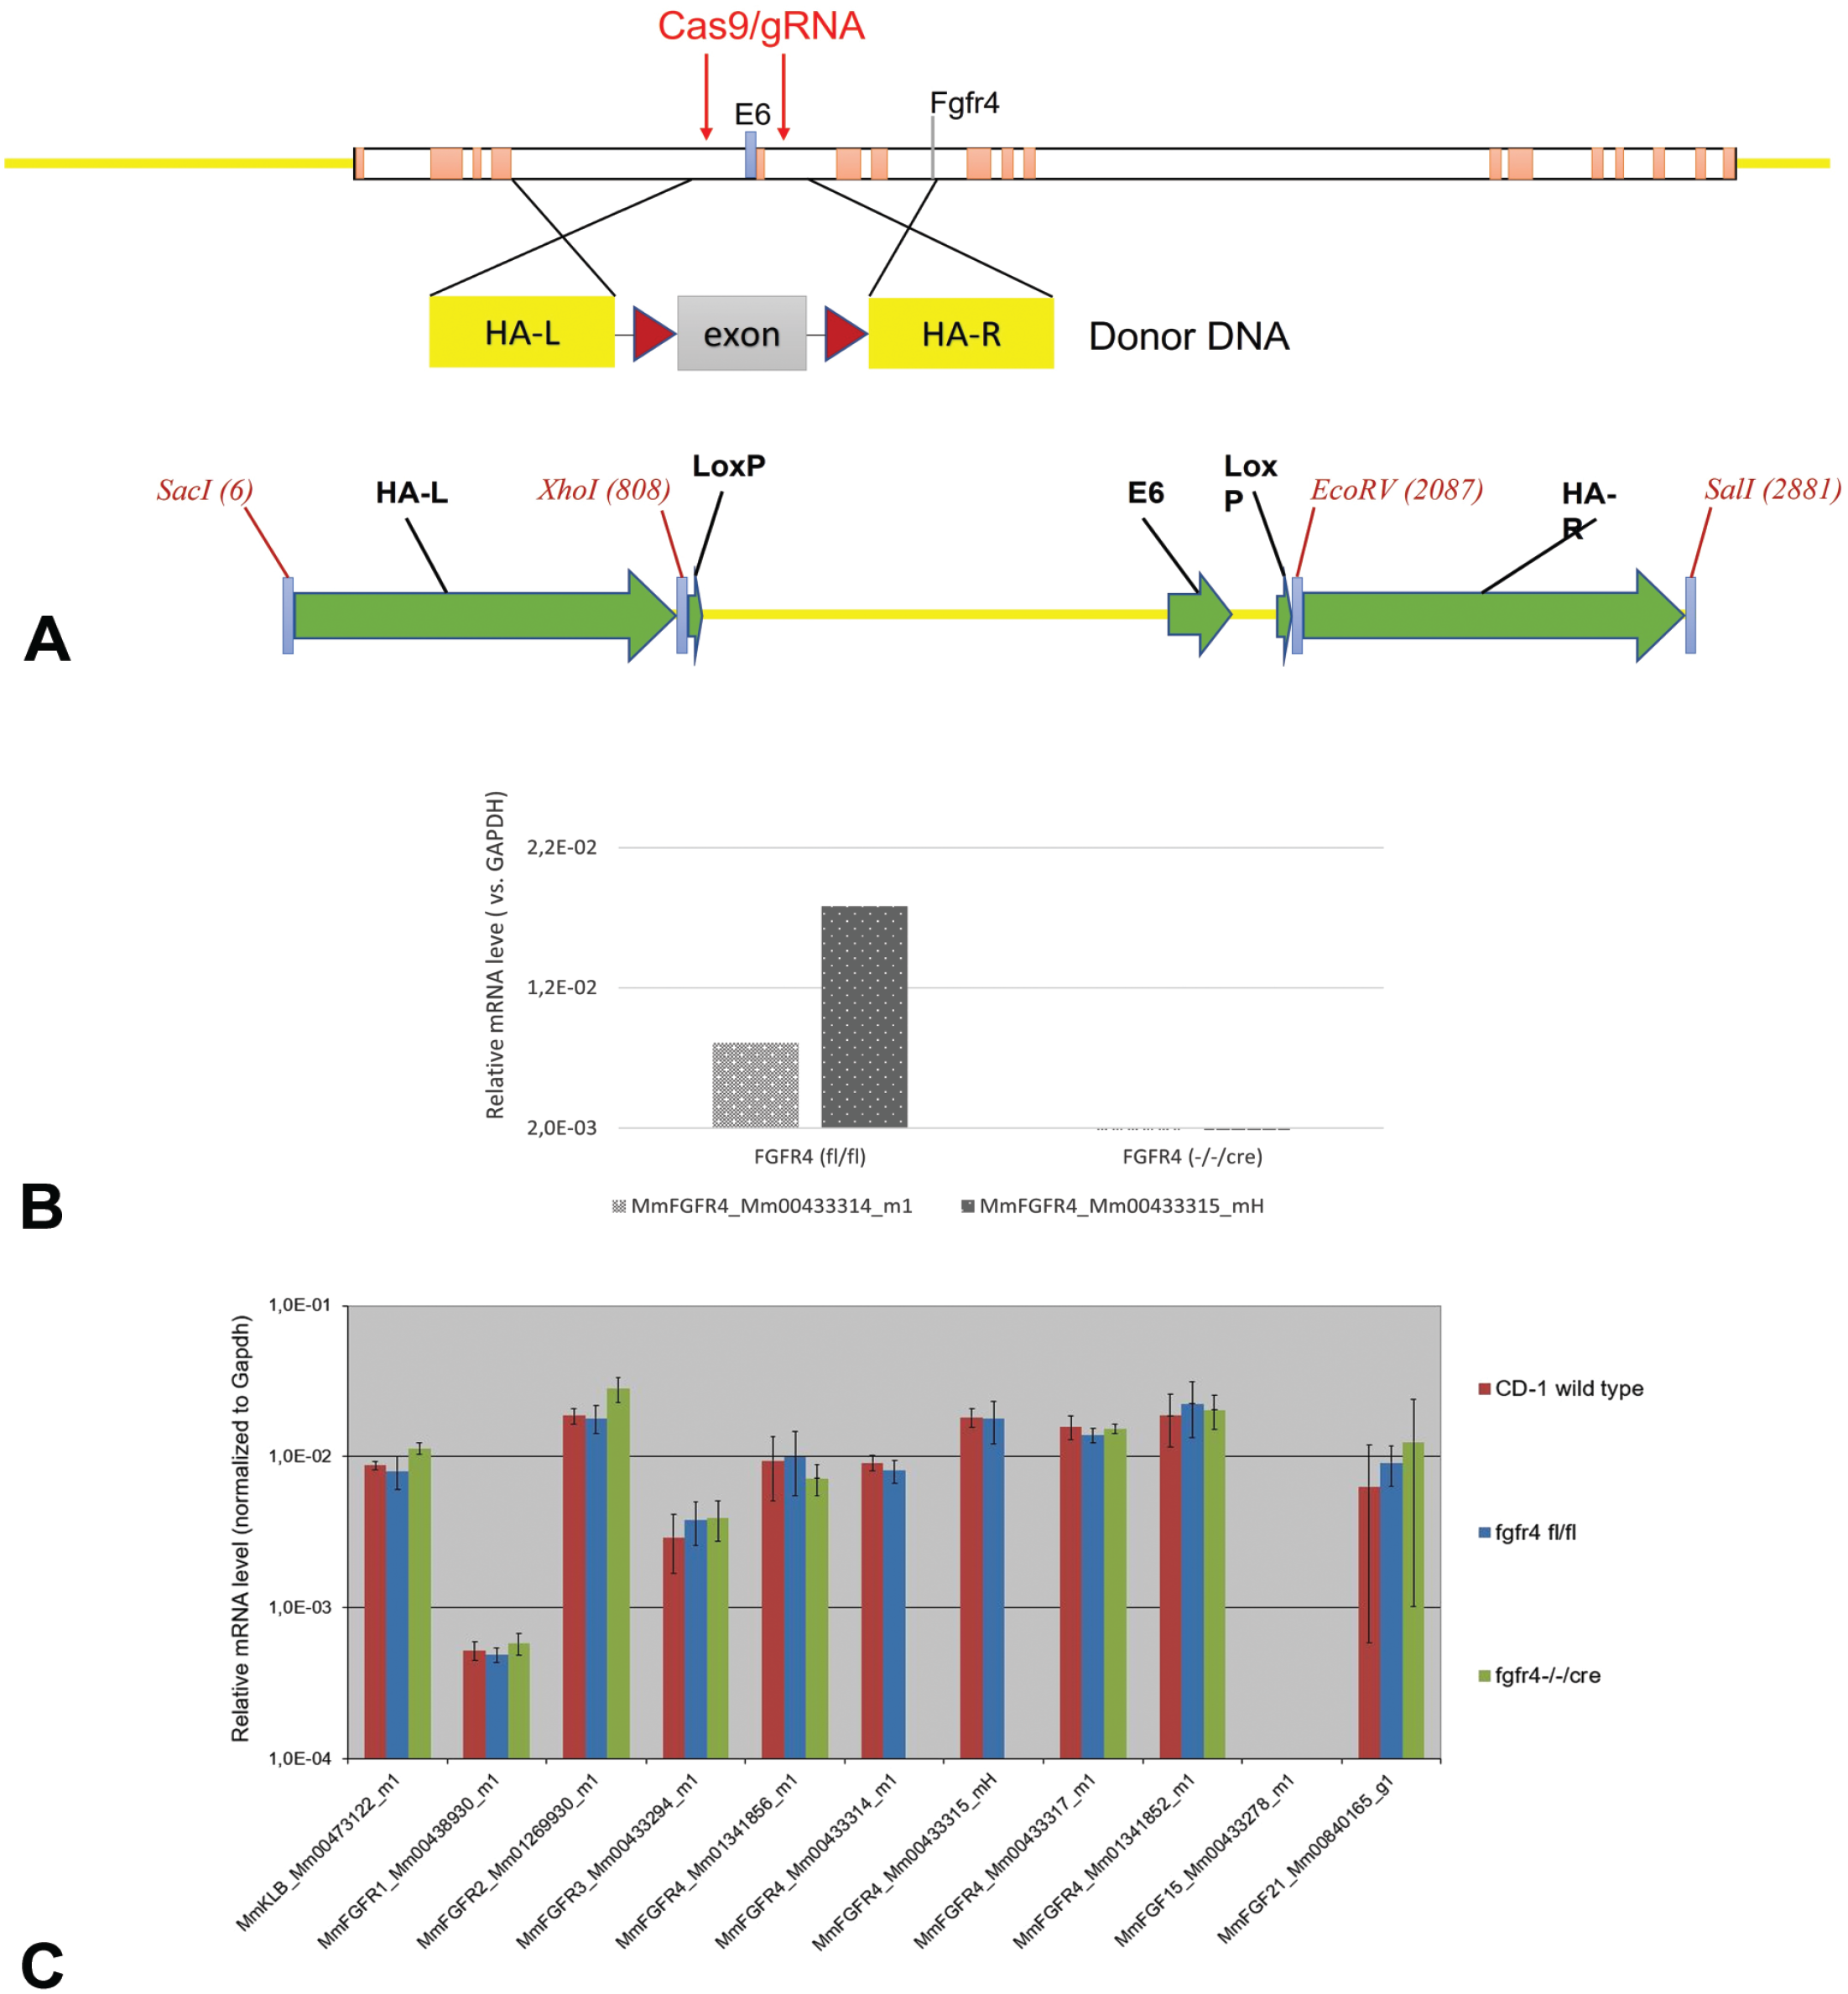
(A-C) Gene targeting strategy and confirmation of Fgfr4 gene inactivation. (A) The mouse genomic locus of Fgfr4 gene on chromosome 13, the position of CRISPR guide-RNAs and homology arms for homologous recombination and insertion of flox sequences flanking exon 6 are shown. NCBI GeneID: 14186; RefSeq transcript: NM_008011.2. (B) PCR analysis of liver samples of floxed (Fgfr4 fl/fl) or Fgfr4 mutant homozygous mice (Fgfr4-/-/cre; syn. Fgfr4 KO). Fgfr4 PCR gene expression assays with two exon-6-specific probes were performed on liver samples of study animals from control and from Fgfr4 liver cKOs. Liver Fgfr4 gene transcript is absent in KO mutant liver samples (Fgfr4-/-/cre) in comparison to the robust expression found in Fgfr4 floxed samples (Fgfr4 fl/fl) indicating disruption of Fgfr4 gene expression in the liver of studied cKO animals. GAPDH expression has been used for the normalization of the PCR data. (C) To ensure that the KO is specific to Fgfr4, we profiled the expression of Fgfr 1 to 4 beside Klb, Ffg15, Fgf21 in Fgfr4 fl/fl and Fgfr4 KO (Fgfr4 -/-/cre) mice. No significant differences were noted between floxed mice and Fgfr4 KO mice for Fgfr1 to Fgfr3, Klb, Fgf15, and Fgf21. MmFGFR4_Mm00433314_m1 and MmFGFR4_Mm00433315_m1 do exist in generated floxed mice (Fgfr4 fl/fl with FVB background) and no longer give any signals in the generated Fgfr4 KO mice (FBV background). In addition, CD1 mice used in previous studies showed an expression profile comparable to that of the Fgfr4 fl/fl mice. GAPDH expression has been used for the normalization of the PCR data. DNA indicates deoxyribonucleic acid; FGFR4, fibroblast growth factor receptor 4; KO, knockout; and RNA, ribonucleic acid; CRISPR, Clustered Regularly Interspaced Short Palindromic Repeats; GAPDH, Glyceraldehyde 3-phosphate dehydrogenase; HA-L, HA-R, left and right homology arms.
PCR primers and conditions.
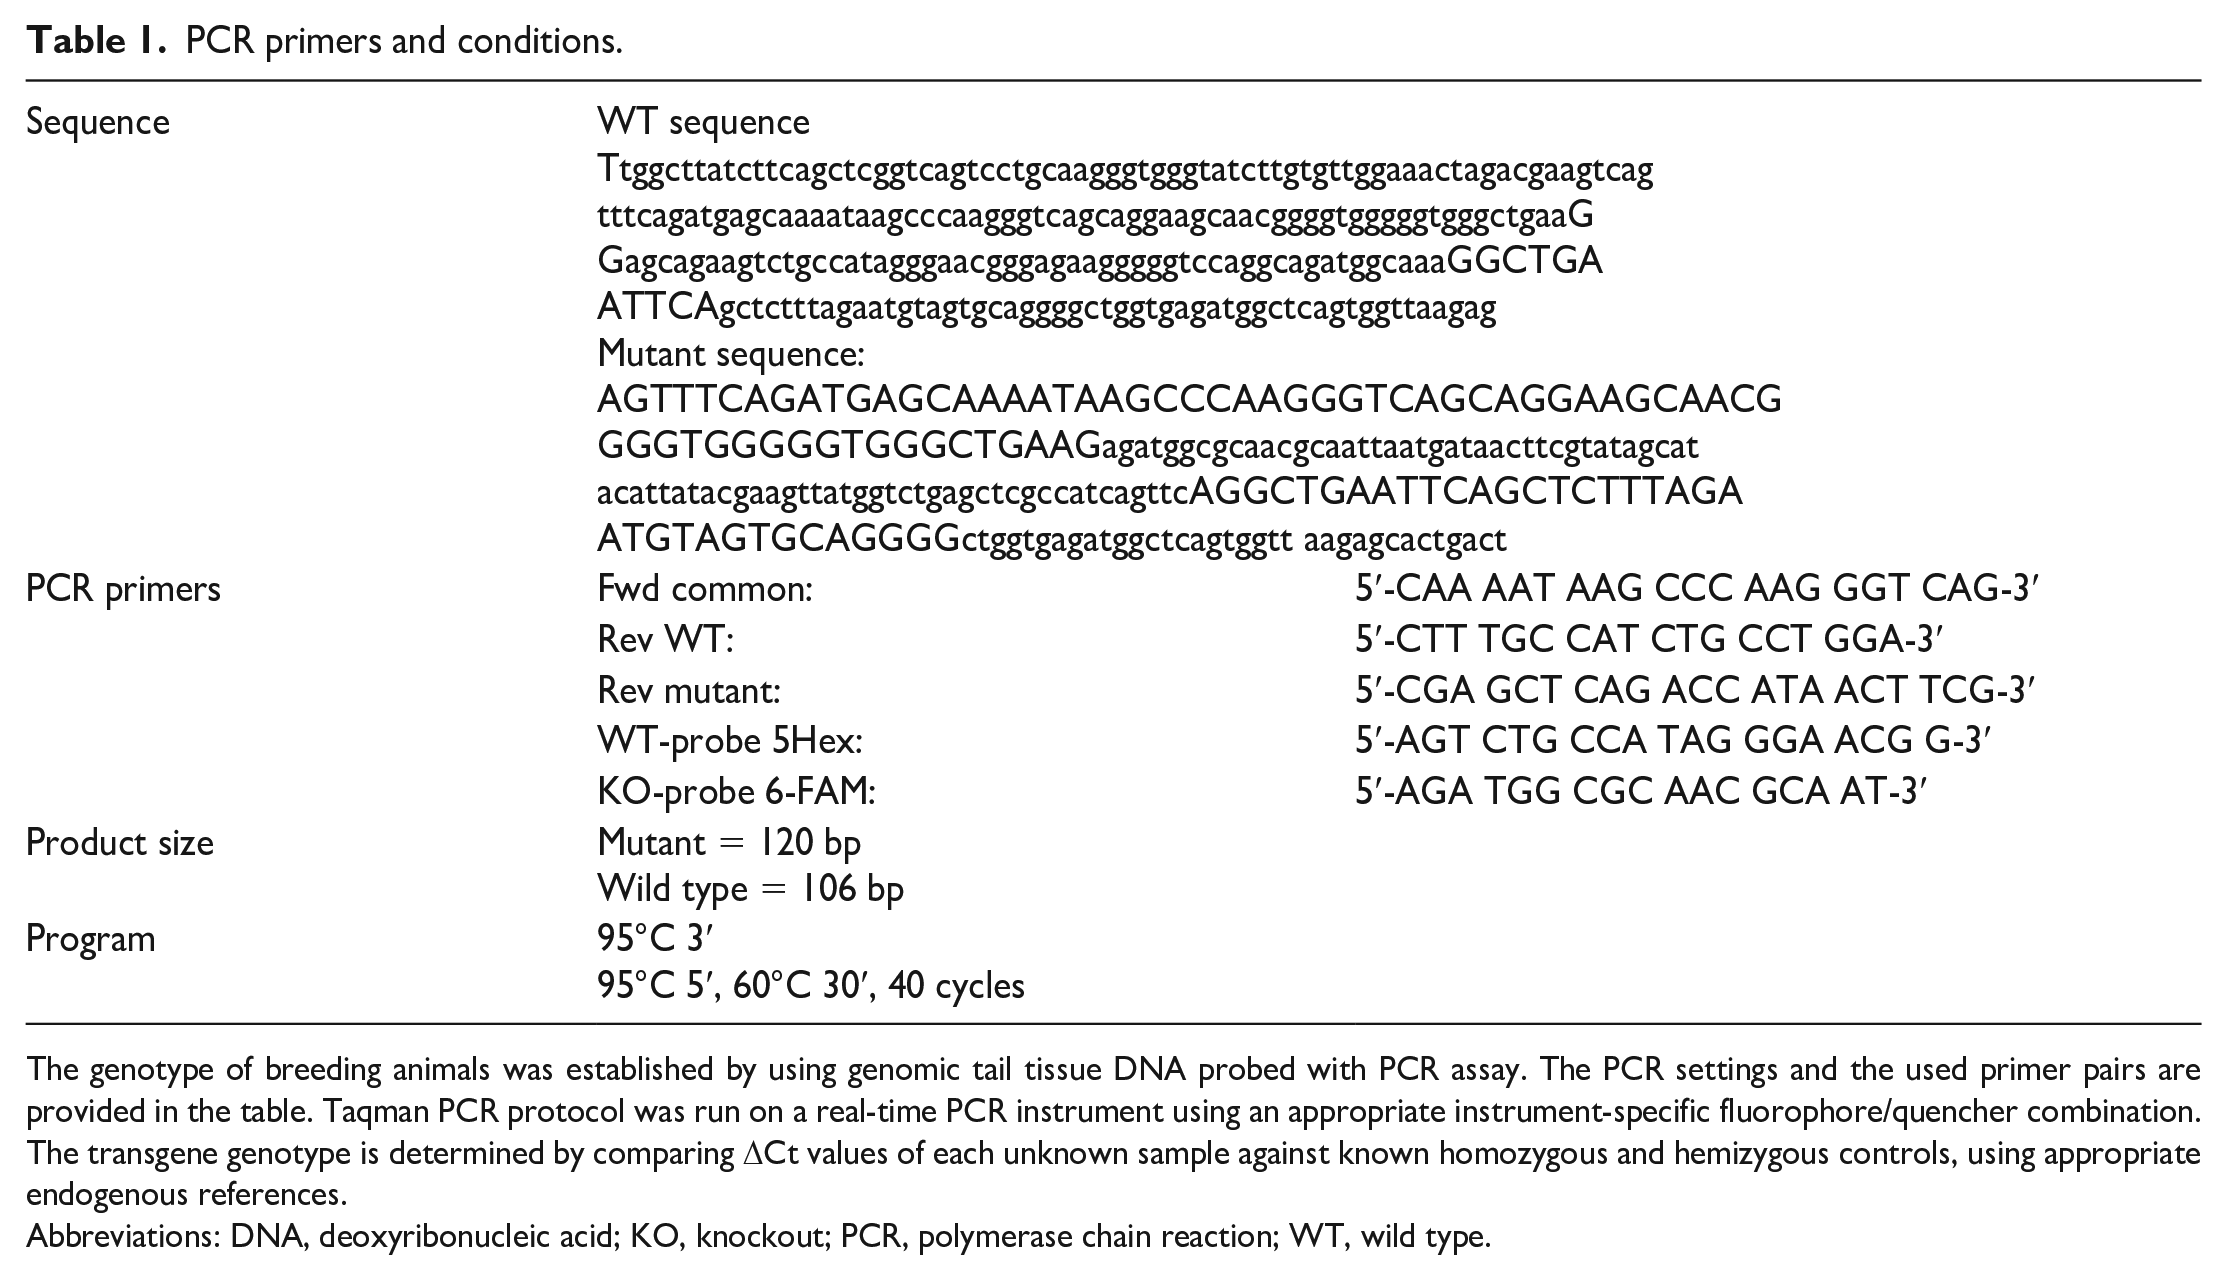
The genotype of breeding animals was established by using genomic tail tissue DNA probed with PCR assay. The PCR settings and the used primer pairs are provided in the table. Taqman PCR protocol was run on a real-time PCR instrument using an appropriate instrument-specific fluorophore/quencher combination. The transgene genotype is determined by comparing ΔCt values of each unknown sample against known homozygous and hemizygous controls, using appropriate endogenous references.
Abbreviations: DNA, deoxyribonucleic acid; KO, knockout; PCR, polymerase chain reaction; WT, wild type.
To recombine the genomic loxP sites and KO the Fgfr4 gene, Fgfr4 fl/fl mice were crossed with the Alb-Cre strain [FVB(Cg)-Tg(Alb1-cre)1Dlr/J (Stock#16833); the Jackson Laboratory, Bar Harbor, Maine]. Following cre recombination, no Fgfr4 expression was observed in Fgfr4 KO (Fgfr4-/-/cre) mice (Figure 1B). To investigate the disruption of Fgfr4 gene expression, commercially available FGFR4 TaqMan gene expression assays Mm00433314_m1 (catalog number: 4331182) and Mm00433315_mH (catalog number: 4351372) from Thermo Fisher Scientific were used.
In a second mRNA analysis, liver samples of CD1, Fgfr4 fl/fl, and Fgfr4 KO mice were investigated for the expression of Klb, Fgfr1 to Fgfr4, Fgf15, and Fgf21 (Figure 1C).
Mice were kept and bred under specific pathogen-free conditions in the animal care facility, and all mouse experiments were approved by the Institutional Animal Care and Use Committee.
Study Design
Animals: transgenic mice (Fgfr4 fl/fl and Fgfr4 KO mice)
Transgenic female mice (Fgfr4 fl/fl and Fgfr4 KO) on FVB background were 7 to 10 weeks old (13.1-26.4 g body weight) at dosing initiation. Animals were assigned to the study using a computerized procedure designed to achieve body weight balance with respect to group assignment and treated for seven consecutive days via subcutaneous administration. Dosing area was divided into two sections, and the sites for each injection were rotated. FGF21 was administered twice daily (BID) with a dose of 5 mg/kg BID, and FGF19 was administered once daily with a dose of 2 mg/kg. Dose selection was based on a previous proliferation study (Supplemental Material 1 and 2) in wild-type (WT) FVB mice that showed significantly elevated proliferative activity in hepatocytes already at 2 mg/kg FGF21 or FGF19 SC (subcutaneously) after a single daily administration over a period of 7 or 28 days. Dose groups of 15 or 20 animals were used based on a statistical group size analysis to reach a statistical power of at least 80%. In total, 6 groups were used, as shown in Table 2, consisting of 2 control groups without FGF treatments (Fgfr4 fl/fl control and Fgfr4 KO control) and 2 comparable groups that were each treated with either FGF21 (Fgfr4 fl/fl; FGF21 and Fgfr4 KO; FGF21) or FGF19 (Fgfr4 fl/fl; FGF19 and Fgfr4 KO; FGF19). Mice were microchipped and kept group-housed with up to three animals/cage. Certified Rodent Diet #2014C (Envigo RMS, Inc.) and water was offered ad libitum, acclimation lasted at least 2 weeks, and cage-enrichment devices and dietary enrichment were applied. Health monitoring was performed twice daily (i.e.,
Group designation and dose level.
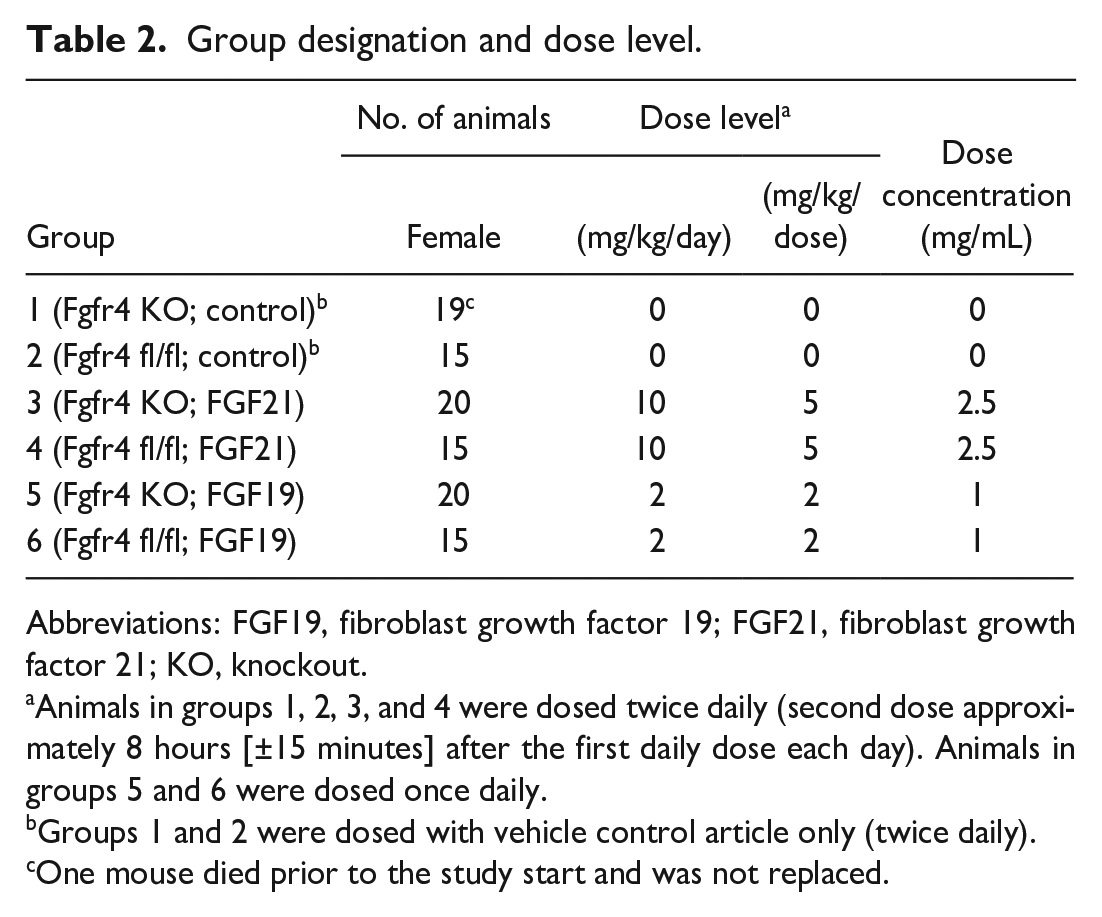
Abbreviations: FGF19, fibroblast growth factor 19; FGF21, fibroblast growth factor 21; KO, knockout.
Animals in groups 1, 2, 3, and 4 were dosed twice daily (second dose approximately 8 hours [±15 minutes] after the first daily dose each day). Animals in groups 5 and 6 were dosed once daily.
Groups 1 and 2 were dosed with vehicle control article only (twice daily).
One mouse died prior to the study start and was not replaced.
Test substances: rhFGF21 and rhFGF19
The administered test articles FGF21 and FGF19 are recombinant human proteins (rhFGF21, rhFGF19) carrying N-terminal glycine as a remnant of the protein expression and purification process (sequences shown in Supplemental Material 3). The 50% effective concentration (EC50) for extracellular signal-regulated kinases (ERK) phosphorylation was <9 nmol/L, and stability of the solution of rhFGF21 and rhFGF19 in buffer was verified. Dulbecco’s phosphate-buffered saline adjusted to pH 7.4 ± 0.1 was used as the control vehicle and for the preparation of the FGF21/FGF19 solutions. Purities of the test substances were >95%. In this study, FGF19 served as a positive control.
Clinical observation, body weight, and food consumption
On each day of dosing, cage-side observations were made for each animal approximately 4 and 8 hours after the first daily dose and for each animal in groups 1 to 4 (control and FGF21-treated groups) 2 to 4 hours after the second daily dose. The second dose was applied 8 hours after the first dose. Body weight and food consumption were recorded pre-dose and on days 1, 2, 4, and 7. Absolute and relative organ weights were measured, and macroscopic and histological examinations were performed.
Necropsy, organ weight, microscopy
On day 8, all surviving animals, having been fasted overnight, and the single sacrificed animal (D1) were anesthetized with sodium pentobarbital, exsanguinated, and necropsied. Terminal body weights were recorded for sacrificed animals. A macroscopic examination of the external features of the carcass; external body orifices; abdominal, thoracic, and cranial cavities; organs; and tissues was performed. Organ weights were recorded. Organs and tissues were preserved in 10% neutral-buffered formalin (except for eyes which were fixed in modified Davidson’s fixative).
Toxicokinetic
Blood samples were taken using nonserial sampling (2 animals per time point) and collected in K2 EDTA tubes prior to dosing and at 0.5, 1, 2, 4, and 8 hours after dose administration on day 7 in order to determine FGF21 exposure data. Plasma was harvested (1650 g at 4°C for approximately 10 minutes) within 1 hour of collection und stored at −80°C before plasma samples were analyzed using enzyme-linked immunosorbent assay (ELISA) (FGF21 ELISA Kit; Eagle Bioscience Cat.). Parameters evaluated included Cmax (observed maximum concentration), tmax (time of maximum concentration), and AUC0-8 (area under the plasma concentration-time curve calculated by the linear trapezoidal method from 0 to 8 hours after dose). The concentrations of FGF21 in plasma were measured following the 13th administration on day 7. The concentration of FGF21 in plasma was determined by an ELISA assay. The lower limit of quantification (LLOQ) was 0.313 ng/mL. No exposure data for FGF19 were determined.
Immunohistochemistry
The left lateral lobes of the livers were removed, fixed in 10% neutral buffered formalin for a maximum of 48 hours, transferred to 70% ethanol, and processed to paraffin blocks. Ki-67-immunohistochemistry was conducted using the ABC/alkaline phosphatase/fast red method, as described in the following paragraphs.
After rinsing the deparaffinized and rehydrated paraffin sections with distilled water, antigen retrieval was performed using citrate buffer (pH 6.0) in the pretreatment module (a pressure cooker instrument) for 20 minutes, followed by preincubation with a blocking reagent (anti-mouse Fab fragments 1:50 dilution) for 10 minutes. Incubation with ready-to-use anti-rat Ki-67 antibody, clone SP6, was performed for 1 hour, and the enzyme detection of positive reactions was made using the UltraVision LP detection system: AP-Ultra Vision LP/AP polymer kit, Epredia/Fisher Scientific GmbH, Schwerte (primary antibody enhancer for 20 minutes; alkaline phosphatase polymer kit for 30 minutes; chromogen fast red for 12 minutes; counterstaining with hemalum).
Image analysis with Definiens software
Ki-67-stained liver slides were scanned using the Nanozoomer 2.0 HT from Hamamatsu Photonics, Hamamatsu City. These scans were evaluated by a customized image analysis program developed by Definiens Inc., Carlsbad. This software performed the quantitative analysis of the immunohistochemical proliferation marker Ki-67 in periportal and centrilobular zones of the liver. The main steps of the zonal image analysis using the Definiens-Architect module were as follows
Loaded images display proliferating cells (Ki-67-labeled-nuclei in red) and nonproliferating cells (Hemalun-stained nuclei in blue) (Figure 2A).
Initially, a rough discrimination between the liver tissue that appeared colored by the hemalun staining and vascular spaces that appeared empty (white) was provided. These vascular spaces, labeled by the software, represented the basis for the discrimination between centrilobular and periportal areas. Vascular spaces that were too small (e.g., sinusoids) or too large (e.g., interlobular veins) were automatically excluded by defined-size criteria and indicated in gray. Subsequently, the vascular spaces had to be assigned manually to centrilobular veins indicated in blue or portal tracts indicated in red (Figure 2B). Vascular spaces that had not been labeled automatically because they were congested with acellular material or blood cells and, therefore, did not appear as white also had to be added and assigned manually. Labeled centrilobular and portal vascular spaces were automatically expanded by a defined radius to create the respective centrilobular and periportal areas to be analyzed for zone-dependent hepatocellular proliferation (Figure 2C).
Annotated images were transferred to the Definiens-Tissue Studio module, a generic image analysis software program for cell and tissue analyses. The discrimination between proliferating and nonproliferating cells was based on the presence of the proliferation marker Ki-67 that was now indicated in yellow, whereas the nonproliferating cells were marked in dark blue in order to increase the contrast and to facilitate the analysis (Figure 2D). Cells that exhibited features different to hepatocytes were excluded using size, shape, and color intensity criteria. Total numbers of hepatocytes and proliferating hepatocytes were separately recorded for periportal and centrilobular zones. Finally, the LI for every specimen/animal was calculated as the percentage of KI-67-positive nuclei per total number of counted nuclei and used as an indicator of proliferative activity.
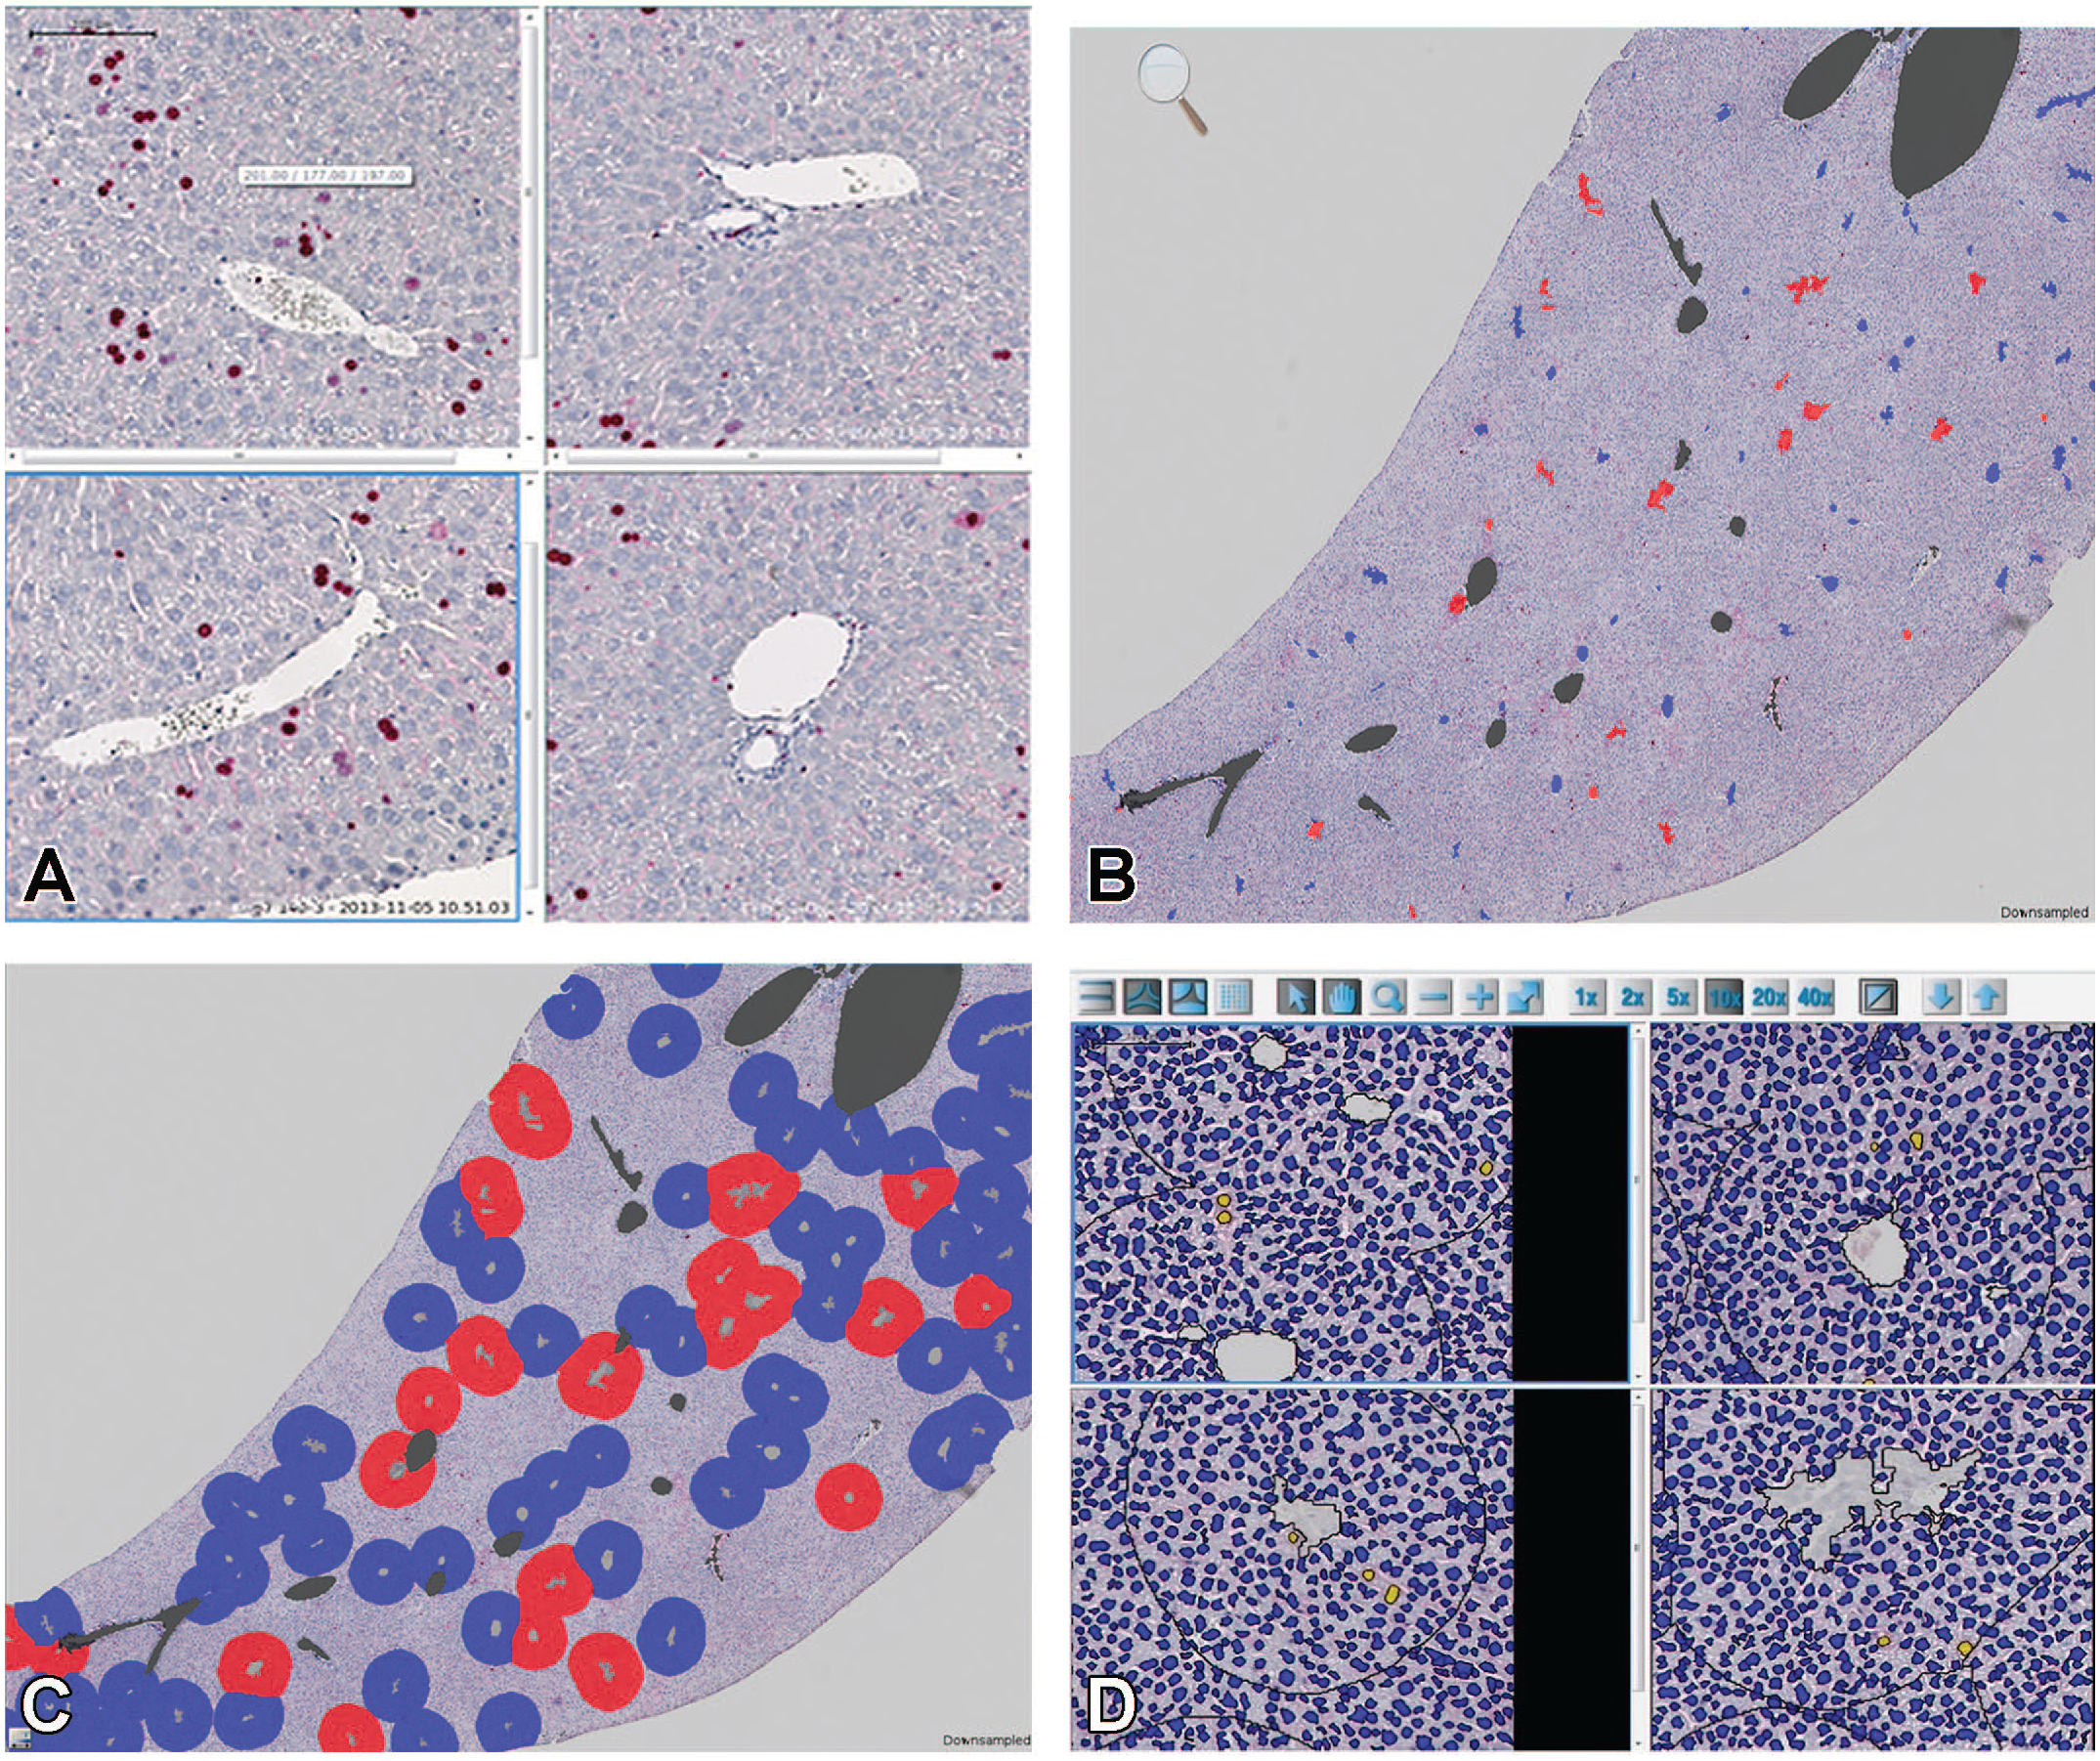
(A) Screenshot of liver image analysis software (Definiens-Architect module): hepatocellular proliferation in centrilobular (left column) and periportal (right column) zones. Proliferating cells (Ki-67-labeled nuclei in red) and nonproliferating cells (Hemalum-stained nuclei in blue). (B) Screenshot of liver image analysis software (Definiens-Architect module): differential detection of central veins (red) and portal tracts (blue). Gray areas represent vascular spaces different from central veins or portal tracts that were excluded from the analysis. (C) Screenshot of liver image analysis software (Definiens-Architect module): creation of centrilobular (blue) and periportal (red) zones by expansion of respective vascular spaces with a defined radius. Other vascular lumens excluded from analysis in gray. (D) Screenshot of liver image analysis software (Definiens-Tissue Studio module): final detection and counting of proliferating (yellow nuclei) and nonproliferating (blue nuclei) cells in centrilobular (left column) and periportal (right column) zones.
Statistical analysis (power and group size evaluation and Ki-67 LI statistics)
A power and sample size calculation had been previously performed for the FGFR4 KO mice study based on proliferation data from earlier proliferation studies in FVB mice. Power and sample size calculations were based on a 2-sided test with α = 0.05 on the ratio of negative binomial rates for two samples. A balanced design and a minimum power of 80% were selected. Results were obtained using the East V6.3 software, Transoft Solution, British Columbia. To detect a 3-fold increase in the mean proportion of proliferative cells as being statistically significant with a minimum power of 80%, a total sample size of 30 for a two-sample comparison, 15 animals per group, is required.
The number of Ki-67-positive hepatocytes of Fgfr4 KO mice and Fgfr4 fl/fl mice was analyzed using negative binominal regression. The analysis was based on a log-linear model. For each comparison and each region, the odds ratios of the number of Ki-67-positive cells with associated 95% adjusted confidence interval (CI) were estimated.
Results
Confirmation of Fgfr4 Gene Disruption Specifically in Liver
We generated a liver-specific Fgfr4 KO mouse model as a murine model system to specifically investigate the functions of FGFR4 in hepatocytes in adult mice. Global knockdown of Fgfr4 mice induces depleted gallbladders and affects the bile acid pool in constitutive Fgfr4 KO mice, 14 thereby confounding interpretation of its potential role in hepatocyte proliferation and homeostasis. Therefore, the tissue-specific disruption of Fgfr4 was designed to avoid disruptive interaction with the physiology and function of nontarget tissues or embryonal development. The liver-specific Fgfr4 KO mice were generated by crossing loxP-flanked Fgfr4 (Fgfr4 fl/fl) mice with the Cre-deleter mice that express cre recombinase under the liver-specific promoter albumin (Alb-cre). The KO mice that result from this breeding scheme did not show an overt phenotype and had normal body growth and fertility.
Fgfr4 PCR gene expression assays with two exon-6-specific markers were performed on liver samples of Fgfr4 fl/fl and Fgfr4 KO mice. Liver Fgfr4 gene transcript was absent in liver samples of cKO mice in comparison to the robust expression found in the samples of floxed mice (see Figure 1B; Fgfr4-/-/cre vs Fgfr4 fl/fl), indicating disruption of Fgfr4 gene expression in the liver of the animals on study.
In the second liver gene expression analysis (Figure 1C), a comparison between WT CD1 mice and the Fgfr4 fl/fl and KO mice was performed. We examined the expression of Klb, Fgfr1, Fgfr2, Fgfr3, Fgf15 (Fgf19 mouse analog), and Fgf21 genes and showed that they were of a comparable magnitude in CD1 and transgenic mice on an FVB background (Fgfr4 fl/fl and KO mice).
Clinical Effects, Organ Weight, Microscopy
No test article-related deaths occurred. Two animals were sacrificed before the scheduled termination; one animal (Fgfr4 fl/fl control group) was sacrificed prior to the study start due to complications following implantation of the transponder and could not be replaced. Another mouse treated with FGF19 (Fgfr4 KO; FGF19 group) was sacrificed on day 1 after the first dosing with a marked body weight change prior to the study start of −8.6 grams, and therefore, the death was considered to be unrelated to the administration of the positive control article. No test article–related clinical observations were noted.
Statistically significant decreases in body weight gain were noted at most of the time points and also cumulatively (i.e., days 1 through 7) for both Fgfr4 fl/fl and KO mice administered FGF21 compared with their respective controls (Supplement 8). Because of the low magnitude (mean body weight loss <1 g) and without any noticeable effect in terms of clinical condition, this effect was considered not to be adverse over the course of the 7-day treatment period.
For animals administered FGF19 (Fgfr4 fl/fl and KO mice), statistically significant decreases in body weight gain were noted only on days 4 through 7, compared with their respective controls; this was not observed in the overall cumulative response (days 1 through 7), and so this effect was considered to be incidental to treatment with FGF19. As with animals administered FGF21, the mean body weight loss was <1 g.
In Fgfr4 KO mice, administration of FGF21 or FGF19 resulted in statistically significant increases in food consumption, compared with the untreated KO control group, on days 2 to 4 and days 4 to 7 (Supplement 7). For FGF21-treated floxed mice, no test article-related effects were observed; in floxed animals treated with FGF19, a statistically significant increase was noted only on days 1 to 2, compared with their untreated control (Fgfr4 fl/fl control). The latter was considered to be coincidental given the shortness of the interval and the variability generally associated with food consumption data in mice. Body weight reduction in mice is thought to be due to FGF21-induced increase in energy expenditure by browning of white adipose tissue, and this can be simultaneously accompanied with a compensatory increase in food intake. 15 In other mice studies with diabetic or obese mouse models, body weight reduction was not associated with an increase in food consumption after FGF21 administration. 16 However, in our previous 7-day and 2-month CD1 mice studies (nondiabetic and nonobese mice), food intake was also elevated significantly in a dose-dependent manner but without significant changes in the body weight development compared to the control groups (data not shown).
No FGF21- or FGF19-related differences in absolute or relative organ weights (including liver weights) were present. There were no FGF21- or FGF19-related macroscopic findings, and no FGF21- or FGF19-related microscopic findings occurred in the liver of either mouse type. No notable difference was observed in microscopic liver findings between the untreated floxed control group (group 2, Table 2) and the KO control group (group 1, Table 2).
Slight- or moderate-focal to multifocal necrosis occurred in the brain of two Fgfr4 fl/fl and one Fgfr4 KO mice administered FGF21, which were characterized by focal areas with rarefaction of the neuropil, neuronal necrosis, hemorrhage, and/or neutrophilic inflammation (Supplement 5, Figure 1A and B). In all three animals, the necrosis involved the dentate gyrus of the hippocampus and extended into other nearby areas of the brain: visual cortex (Fgfr4 KO mouse); midbrain, and amygdala/entorhinal area (Fgfr4 fl/fl mice). It is very likely based on our own knowledge from other repeated dose studies (7 days, 28 days, 2 months, see Supplement 1) performed mainly with CD1 mice, treated with up to 5 mg/kg BID without any central nervous system (CNS) lesions that the described CNS alterations in this study are attributed to the FVB background. However, a contribution of FGF21 cannot be completely excluded because it was only noted in groups treated with FGF21, and not in controls. Neuronal necrosis in the hippocampus, cerebral cortex, and thalamus has been described in FVB and FVB/N mice associated with nonspecific clinical observations, including lethargy, matting of fur, hunched back, and/or reluctance to move, as well as seizures occasionally.17,18
In the eye, severe bilateral photoreceptor degeneration/loss in the retina occurred in all animals including controls (Supplement 5, Figure 2A and B). Photoreceptor degeneration/loss is an expected finding in FVB-derived mice because they are homozygous for the retinal degeneration (rd1) allele of Pde6brd1. 19 In addition, minimal dysplasia of the corneal epithelium of the eye occurred in 27% to 45% of animals in all groups, including controls (Supplement 5, Figure 3). Corneal epithelial dysplasia was characterized by small foci in which corneal epithelial cells had dark, condensed nuclei and a scant amount of cleared cytoplasm and were arranged as a nest, pit, or rosette, with a clear lumen. Dysplastic foci were generally located in the peripheral cornea. Corneal dysplasia has not been described previously in FVB-derived mice to our knowledge. The cause was not apparent.
Toxicokinetic
Animals were systemically exposed to FGF21 concentrations above the LLOQ (0.313 ng/mL) for the whole 8‑hour observation period, and time to peak concentration (tmax) values varied between 0.5 and 1 hour after dose administration. All plasma concentration values of the control animals were below the LLOQ. Cmax and AUC0-8 values are shown in Table 3. The differences observed between untreated Fgfr4 fl/fl and Fgfr4 KO mice in Cmax and AUC levels with slightly lower values in KO mice were considered to reflect biological variance. Only two animals per group and time point were sampled with relative variable individual FGF21 plasma levels. No toxicokinetic data were obtained from the positive control groups treated with FGF19.
Summary of toxicokinetic parameters of FGF21 on day 7.
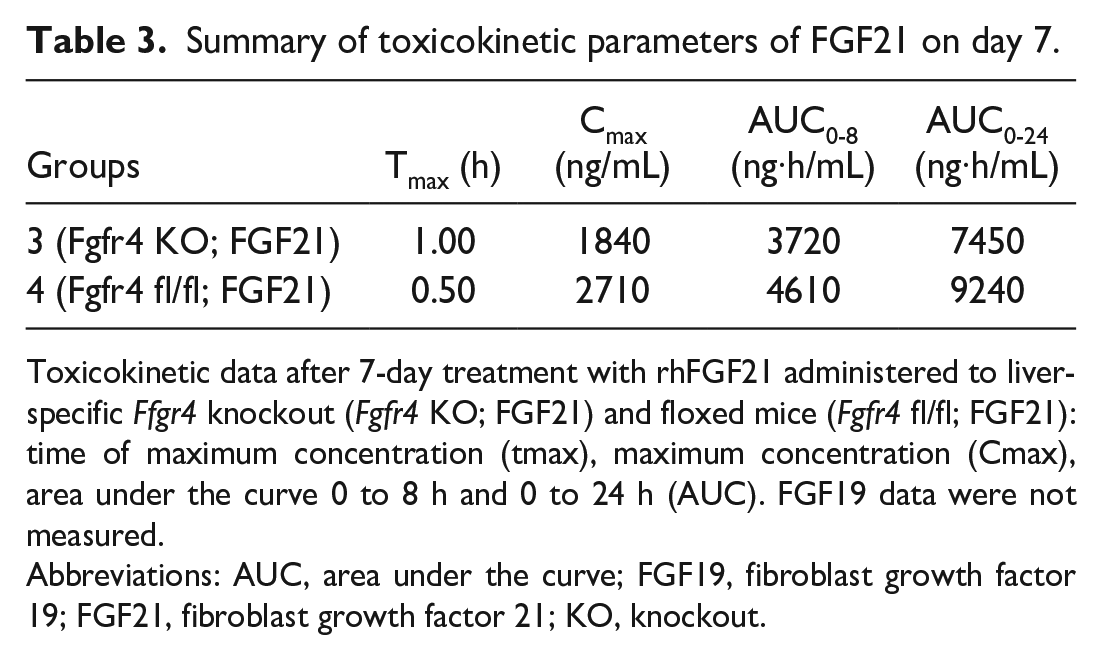
Toxicokinetic data after 7-day treatment with rhFGF21 administered to liver-specific Ffgr4 knockout (Fgfr4 KO; FGF21) and floxed mice (Fgfr4 fl/fl; FGF21): time of maximum concentration (tmax), maximum concentration (Cmax), area under the curve 0 to 8 h and 0 to 24 h (AUC). FGF19 data were not measured.
Abbreviations: AUC, area under the curve; FGF19, fibroblast growth factor 19; FGF21, fibroblast growth factor 21; KO, knockout.
Liver Ki-67 Labeling Index Evaluation
The treatment group composed of FGF19-treated Ffgr4 fl/fl mice (Ffgr4 fl/fl; FGF19) was used in this study as the positive control. Published data 5 and data from our own previous studies (see Supplemental Material, Table 2) have indicated that FGF19 is able to induce hepatocellular proliferation in FVB males and to a greater extent in FVB females. This was confirmed in this study after 7 days of treatment with FGF19. The comparison of FGF19-treated fl/fl mice with the untreated floxed control group (Ffgr4 fl/fl; control) revealed a statistically significant increase of the centrilobular LI by 2.99-fold (P < .0001) and the periportal LI by 1.89-fold (P = .0272). However, this effect was absent for both liver lobular regions in the FGF19-treated KO group lacking FGFR4 without any statistically relevant differences seen when compared to the KO control. Therefore, it can be concluded that the FGFR4 is crucial in the mediation of hepatocellular proliferation related to FGF19 (Tables 4 and 5).
Statistical analysis of LI as indicator of hepatocellular proliferation.
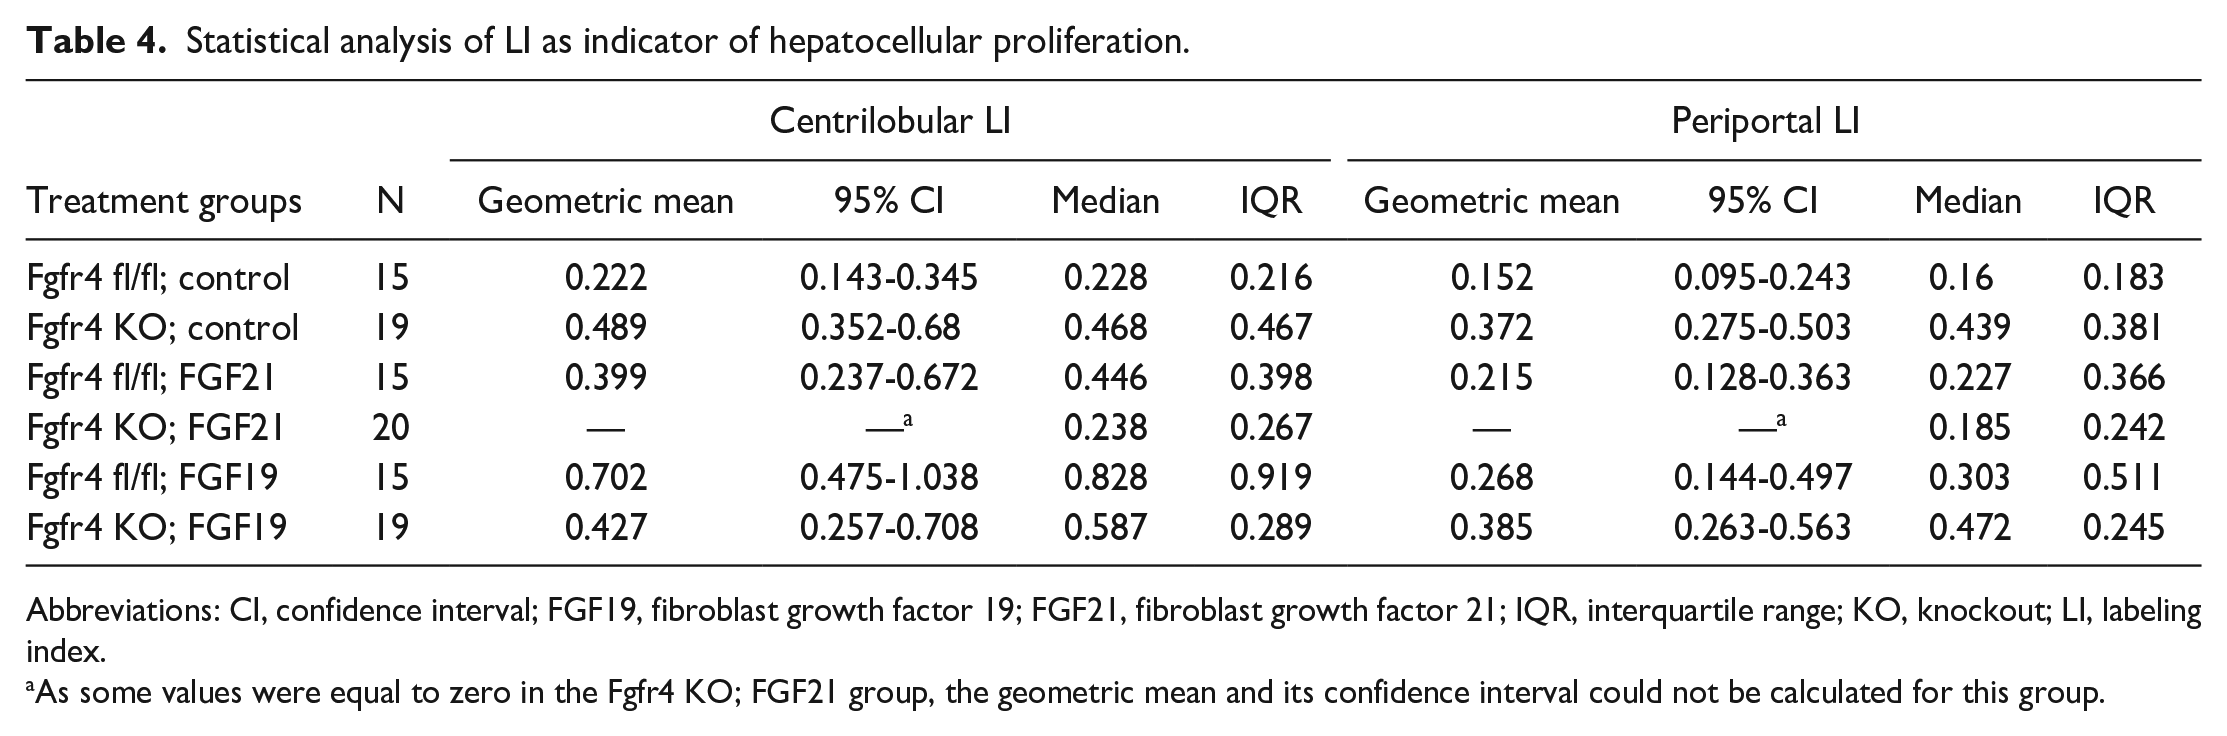
Abbreviations: CI, confidence interval; FGF19, fibroblast growth factor 19; FGF21, fibroblast growth factor 21; IQR, interquartile range; KO, knockout; LI, labeling index.
As some values were equal to zero in the Fgfr4 KO; FGF21 group, the geometric mean and its confidence interval could not be calculated for this group.
FGF19-treatment: comparative statistical analysis of LI as an indicator of hepatocellular proliferation.
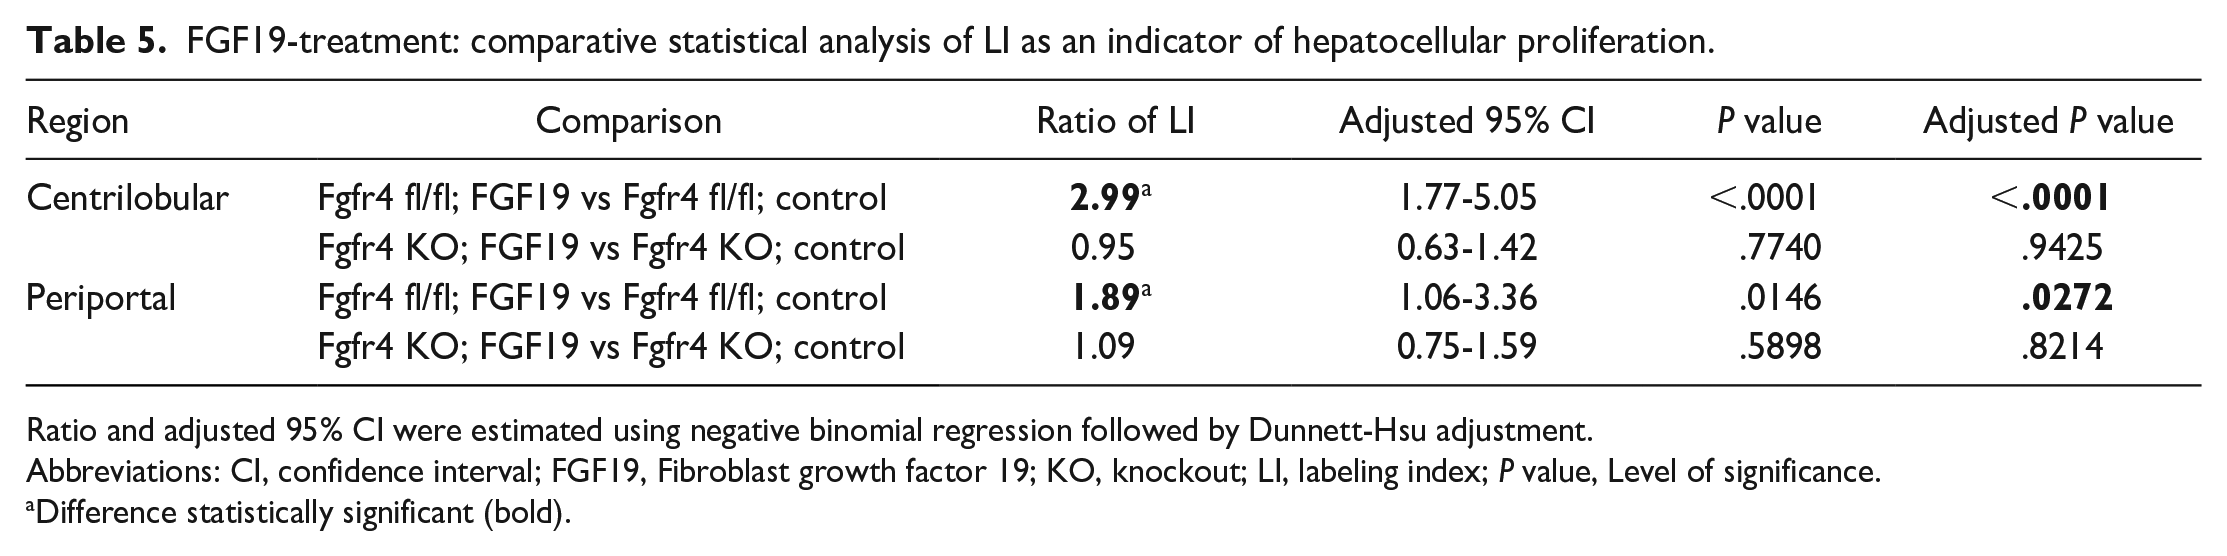
Ratio and adjusted 95% CI were estimated using negative binomial regression followed by Dunnett-Hsu adjustment.
Abbreviations: CI, confidence interval; FGF19, Fibroblast growth factor 19; KO, knockout; LI, labeling index; P value, Level of significance.
Difference statistically significant (bold).
FGF21 treatment of floxed mice (Ffgr4 fl/fl; FGF21) induced a statistically significant increase of the centrilobular LI only by 1.93-fold (P = .0281) when compared to the floxed control group, indicating FGF21-induced elevation of hepatocellular proliferation in a range slightly lower than that shown for FGF19. This effect was also absent in the Fgfr4 KO mice when compared to Fgfr4 KO control and was even statistically significantly decreased to 0.40-fold (P = .0002) and to 0.42-fold (P < .0001) in the centrilobular and periportal regions, respectively (see Tables 4 and 6).
FGF21-treatment: comparative statistical analysis of the LI as an indicator of hepatocellular proliferation.
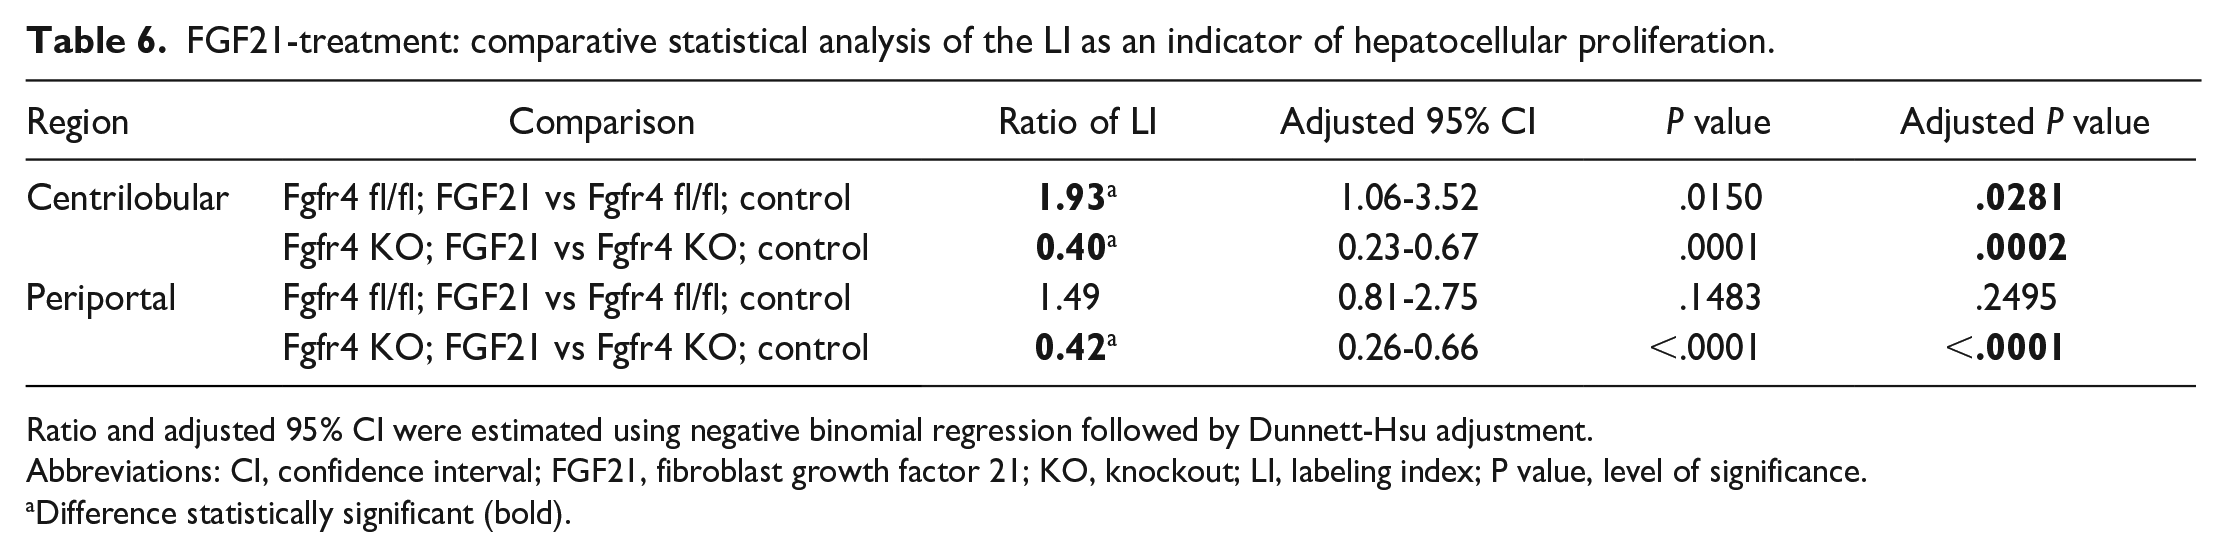
Ratio and adjusted 95% CI were estimated using negative binomial regression followed by Dunnett-Hsu adjustment.
Abbreviations: CI, confidence interval; FGF21, fibroblast growth factor 21; KO, knockout; LI, labeling index; P value, level of significance.
Difference statistically significant (bold).
Discussion
We performed a mechanistic study to investigate the hepatocellular proliferative potential of FGF21 in female Fgfr4 fl/fl and Fgfr4 KO mice. Although there are reports arguing that there is no proliferative risk associated with FGF21,20,21 evidence from our previous research (Supplemental Material 1, 2) had strongly indicated increased proliferation with FGF21 in short-term studies. Interestingly and unexpectedly both treatments with FGF21 and FGF19 had revealed comparably increased LI indices of hepatocytes after a 28-day treatment (Supplement 2, Table 2.3). Considering that FGF19/FGFR4 signaling does promote hepatocellular tumor formation, we sought to investigate the role of the FGFR4 for FGF21 proliferative potential in more detail by using Fgfr4-deficient mice.
In the present study, female Fgfr4 fl/fl mice that were treated with 2 mg/kg once daily of FGF19 for a period of 7 days showed a statistically significant increased proliferation rate in hepatocytes both in the centrilobular and periportal regions of the liver lobules. A more pronounced proliferation activity was noticed with a 3-fold increased labeling index in the centrilobular region, which was less pronounced but still statistically significant in the periportal lobular region. This proliferative effect—qualitatively and quantitatively—and the location within the liver lobules are in line with the results from Nicholes et al., 5 showing a 3-fold to 5-fold increase in hepatocellular proliferation in FGF19-injected FVB female mice treated with approximately 2 mg/kg (30 µg per mouse, intraperitoneally) once daily for 6 days. The slightly higher incidence in the Nicholes study might be related to a different mode of administration using BrdU-Alzet minipumps instead of KI-67 labeling as used in our mechanistic study. In contrast to Fgfr4 fl/fl mice, Fgfr4 KO mice treated with FGF19 have lacked the proliferative potential, indicating that FGF19/FGFR4 signaling is involved in the proliferative pathway and leads to hepatocellular tumor formation as it has been previously documented9,22,23 and also contributes to the progression of tumor growth in other organs beside the liver.24 -26 In addition to neoplastic lesions, FGF19/FGFR4 signaling also plays a role in proliferative nonneoplastic lesions like psoriasis, inducing keratinocytic proliferation and wound healing.27,28
Regarding the proliferative potential of FGF21, in the present study, female Fgfr4 fl/fl mice showed (in line with our previous mouse studies) mild but statistically significant increases in the hepatocellular proliferation rate of approximately 2-fold in the centrilobular region. In contrast, in Fgfr4 KO mice, the proliferative effect was abolished. In addition, we have also observed that in these mice, the hepatocellular proliferation rate was significantly decreased by about 0.4-fold, in the centrilobular and periportal regions. These data support the conclusion that despite the low binding affinity of FGFR4 to FGF21, the supraphysiological concentration of FGF21 may indeed induce a signal via FGFR4, leading to a mild activation of the hepatocellular proliferation rate, which is abolished by a knockdown of liver-expressed FGFR4. It could also be argued alternatively that FGF21 administration might have an antiproliferative effect in the liver of Fgfr4 KO mice. But such an antiproliferative effect in hepatocytes induced by FGF21 has not been described in the current literature. Using a cancer disease mouse model, Luo et al. 29 found that constitutive knockdown of the Fgfr4 gene leads to net inhibition of breast cancer progression and suspected that, in part, this was due to the secondary increase of FGF21 plasma levels (5-fold higher vs FGFR4+/+ mice), with favorable effects on the metabolic environment in breast cancer. This study supports a FGFR4-independent negative regulation of proliferative activity by FGF21, which is in line with our observations from the current study that shows an antiproliferative signal in both liver lobular regions following removal of Fgfr4 gene expression, especially in the periportal zone without any increased proliferative activity in Fgfr4 fl/fl mice.
Nevertheless, in the present study, a doubling of the labeling index in FGF21-treated floxed mice is less than expected from our earlier studies (3- to 4-fold after 7 and 28 days treatments; Supplemental Material 2, Tables 2.1 and 2.3). Also FGF19-treated floxed mice showed a reduced LI that might be related to the different methods used for counting Ki-76-positive hepatocytes or could be related to other reasons not yet identified. The zone-dependent evaluation of hepatocellular proliferation as described by Bahnemann and Mellert 12 is the gold standard for hepatocellular proliferation studies recommending a subdivision of liver lobules into 3 regions: centrilobular, intermediate, and periportal, especially for substances with zone-dependent proliferative activity. With regard to the zonal specificity of FGF19, a series of publications have shown that the most proliferatively active region is centrilobular. 10 In our mechanistic Fgfr4 KO mice study, all hepatocytes of both defined lobular subregions, centrilobular and periportal, were counted by a semi-automated system increasing the statistical power of our analysis compared to our previous studies which counted only 1000 hepatocytes/subregion. However, the zone-specific sensitivity might be impaired by subdividing the liver lobules only into two subregions instead of three. To avoid further variability on the labeling index and to provide reliably increased proliferation rates as observed in earlier studies, transgenic Ffgr4 fl/fl and Ffgr4 KO mice with an FVB background of the same age were used, the animal group size was increased, the in vitro potencies (ERK phosphorylation EC50 values) of rhFGF21 and rhFGF19 applied were in the same range, and the doses of FGF21 were increased from 2 mg/kg SID to 5 mg/kg BID FGF21 (FGF19 dose was the same with 2 mg/kg once daily). Exposure of FGF21-treated floxed mice (Cmax and AUC0-8h) was comparable to that of CD-1 mice treated with 5 mg/kg BID SC for 7 days (2740 ng/mL and 4340 ng.h/mL, see Supplement 4). Finally, it remains to elucidate why the statistical significance of the LIs were less pronounced in FGF21- and FGF19-treated floxed mice than that of the LIs from FVB WT mice from literature 5 and our own previous studies.
It is known that FGF21 also has paracrine activity in the liver and does not activate FGFR4 in the same manner as described for FGF19.10,30 The role of the cofactor KLB to regulate FGF19/FGF21-FGFR4 binding and downstream activity is significant. Also, in the presence of KLB (highly expressed in the liver like FGF21 and FGFR4), the binding affinity to FGFR4 is clearly higher for FGF19 than for FGF21. It is assumed that physiological concentrations of FGF21, which can increase during starvation, 31 and increased levels under pathological conditions like type 2 diabetes and obesity32 -34 can be neglected in order to produce a relevant activation of liver cell proliferation. 30 In the mechanistic Fgfr4 KO mice study, animals received 5 mg/kg BID FGF21 leading to a maximum plasma concentrations of 2710 and 1840 ng/mL and AUC0-24h levels of 9240 and 7450 ng.h/mL in Fgfr4 fl/fl and KO mice, respectively, reaching a clear supraphysiological plasma level (FGF19 plasma concentration was not measured). Physiological circulating concentrations of FGF21 in nonobese mice range from 0.1 to 1 ng/mL. 35 In diet-induced obese mice, higher plasma levels were reported, rising from 600 ± 62 pg/mL (lean mice) to 2300 ± 270 pg/mL. 36 A broad range of FGF21 plasma levels were reported for humans showing a marked interindividual variation ranging from 5 pg to 5 ng/mL and having higher plasma FGF21 levels with excess body weight, e.g., in obese patients (BMI 30-39.5), 102.6 ± 108 pg/mL. 37
Unexpectedly, the basal proliferation rate in untreated Fgfr4 KO mice was statistically significant and increased by 2-fold compared to untreated Fgfr4 fl/fl mice in both regions, centrilobular and periportal (see Table 7, Figure 3). To our knowledge, an increased basal proliferation rate in hepatocytes of Fgfr4-deficient animals has not been reported. Instead, there have only been reports that hepatocellular hypertrophy in a wound-healing disease mouse model lacking FGFR4 was shown to be the only compensatory effect on liver damage without the proliferative activity mediated by FGFR4 during liver regeneration and tissue repair. 27
Untreated controls: comparative statistical analysis of the LI as an indicator of hepatocellular proliferation.
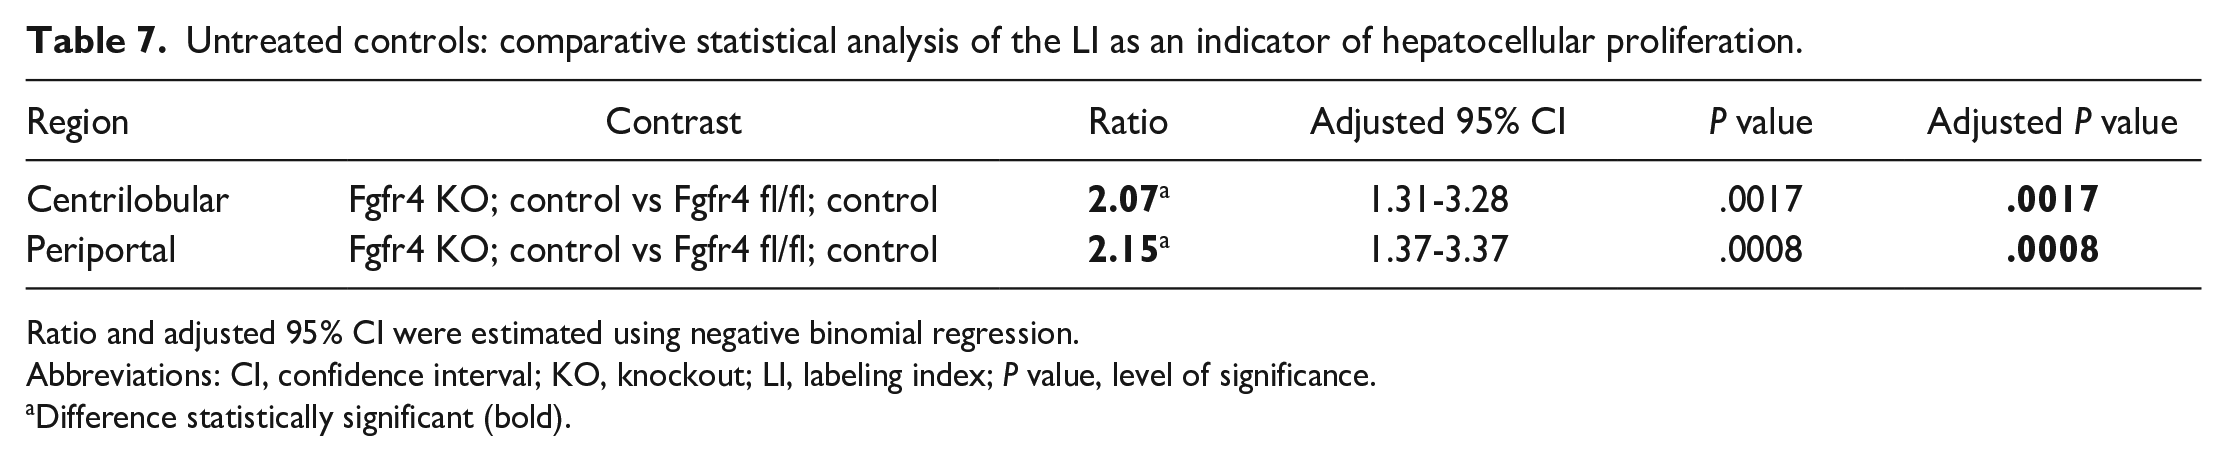
Ratio and adjusted 95% CI were estimated using negative binomial regression.
Abbreviations: CI, confidence interval; KO, knockout; LI, labeling index; P value, level of significance.
Difference statistically significant (bold).
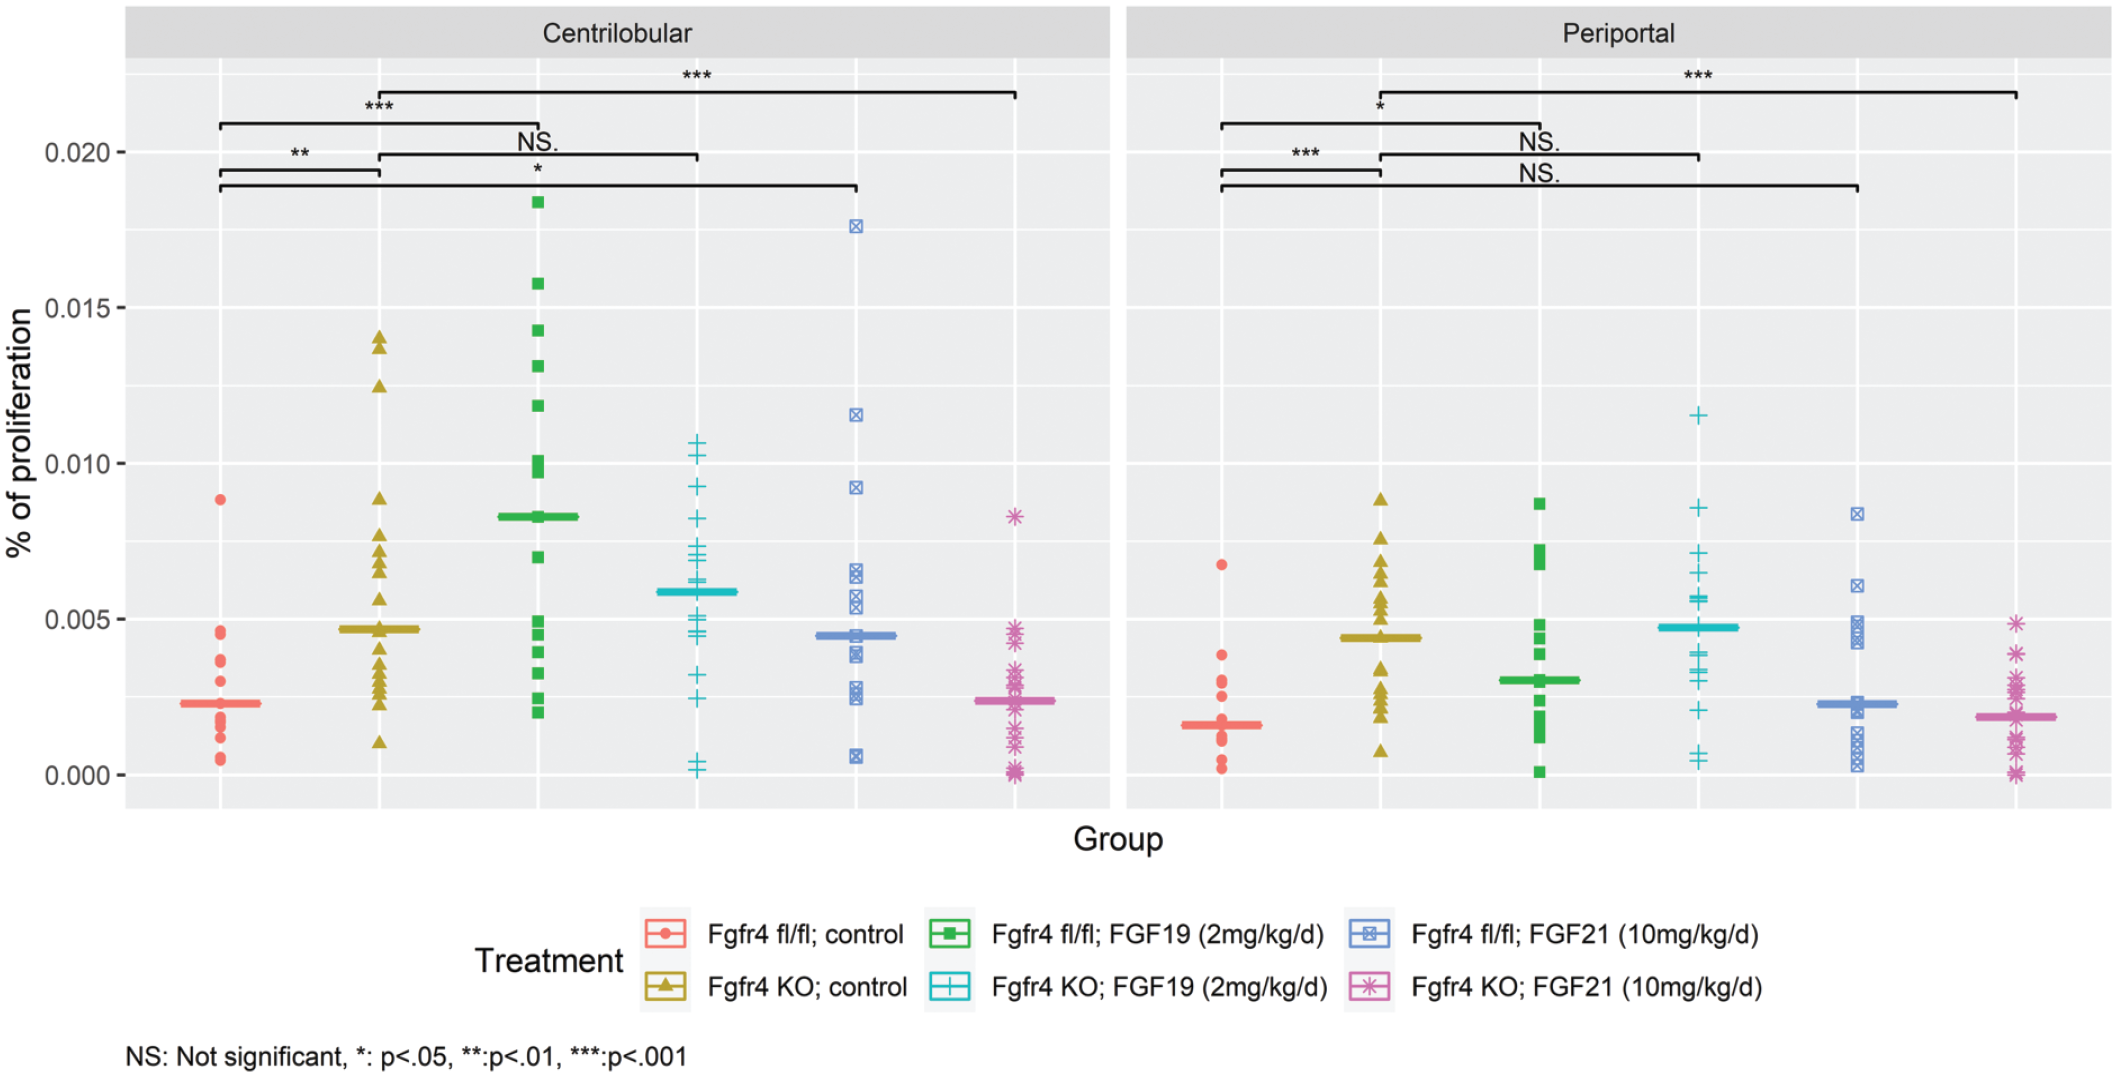
Percentage of proliferating cells differentiated by region and treatment group (with median). Fgfr4 fl/fl or Fgfr4 KO mice groups were treated for 7 days with FGF19 or FGF21. Proliferation rate was determined by a semiquantitative bioimaging system counting Ki-67-positive hepatocytes. A significant difference in the proliferation rate is shown between Fgfr4 fl/fl control and Fgfr4 KO control. FGF19- and FGF21-treated animals were compared to the respective control groups, and statistically significant data were highlighted. FGF19 indicates fibroblast growth factor 19; FGF21, fibroblast growth factor 21; and KO, knockout.
In conclusion, our current mechanistic Fgfr4 KO mice study and the earlier mouse studies (see Supplemental Material 1, 2) indicate that there is a mild but reproducible hepatocellular proliferative activation induced by high doses of FGF21 in young female FVB mice and Fgfr4 fl/fl mice treated daily for 7 days or 28 days (28-day data collected only in the previous study). Fgfr4 deficiency abolishes this effect and leads even to a reduced hepatocellular proliferation below the baseline level (potential antiproliferative effect). Based on these results, it was relevant to ask whether a long-term treatment with suprapharmacological doses of FGF21 could finally lead over time to hyperplasia and tumor generation. Therefore, subsequently, an explorative six-month AAV (adeno-associated virus) study with db/db mice (db/db:BKS. Cg-Dock7m+/+Leprdb/OlaHsd [Harlan]) was performed overexpressing FGF21 or FGF19 to assess efficacy and tumorigenic potential. Db/db mice are homozygous for the diabetic spontaneous mutation (Leprdb), leading to an obese, hyperglycemic, and hypoinsulinemic phenotype (for details of study design, see Supplement 6). Six months after the single intravenous injection of 3 × 10¹¹ virus copies of AAVrh8R-FGF21 or AAVrh8R-FGF19, multiple liver masses were observed in all lobes for all animals overexpressing FGF19 (12 out of 12 mice) and correlated with HCCs and adenomas (Figure 4). Liver masses varied in size from <3 mm to 10 mm in diameter. For many animals, 5 to 30 liver masses per animal were counted. In contrast, there were no neoplastic or preneoplastic lesions in mice overexpressing FGF21 (n = 10). Pharmacokinetic data confirmed the overexpression of each AAV construct (max dose levels of 4 µg/mL and 1.8 µg/mL for FGF19 and FGF21, respectively), leading to expected pharmacological effects, e.g., lowering of serum blood glucose and HbA1c (data not shown). Db/db mouse model–related findings (pancreatic islet cell atrophy or hyperplasia, atrophy of female reproductive tissue) were observed in addition in control and treated mice (not reported). Based on the AAV study data, we conclude that the hepatocellular proliferative effect observed with suprapharmacological doses of FGF21 in young female Fgfr4 fl/fl and FVB WT mice after a treatment duration of 7 or 28 days is only transient over the short term and/or only present in younger animals and does not translate into hyperplasia or tumor generation after a long-term exposure. In contrast, 6-month overexpression of FGF19 provokes HCCs and adenomas in db/db mice and confirms FGF19’s mitogenic activity. According to literature and our study data (not shown), a lower binding affinity of FGF21 and its dependency from KLB to activate FGFR4 and downstream signaling (pERK) may contribute to the different mitogenic potential of both FGFs 19 and 21.
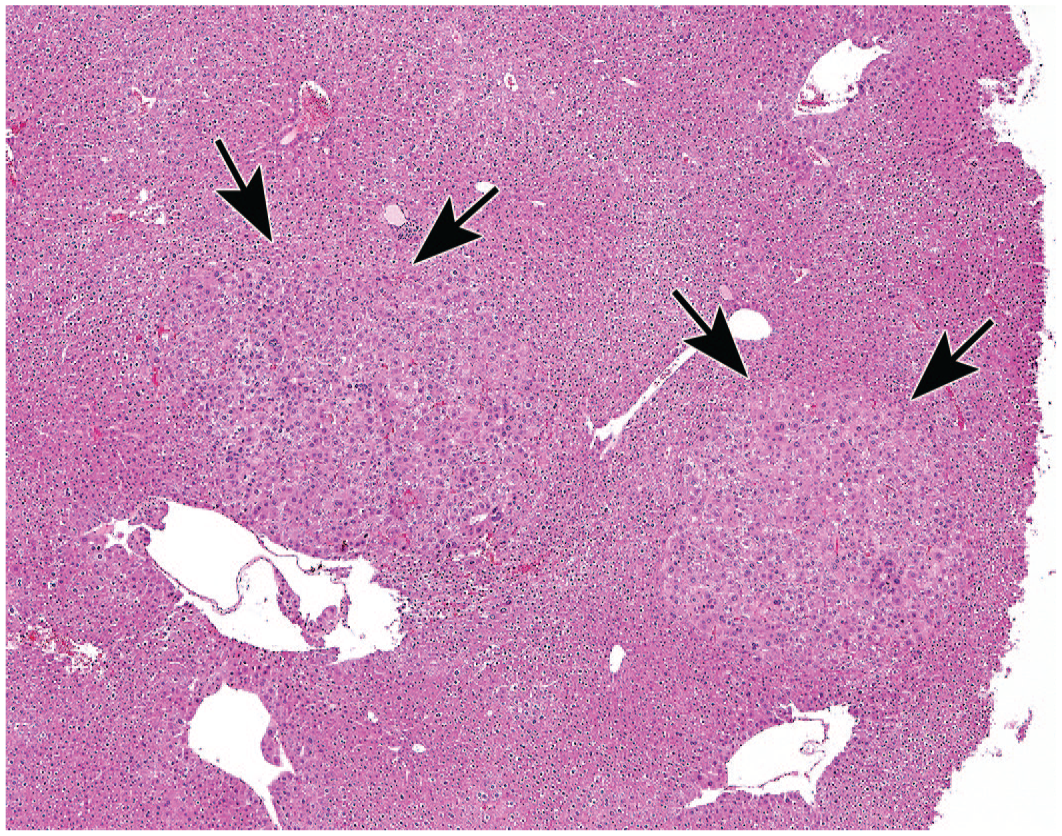
Liver of a db/db mouse from the AAV study with overexpression of FGF19 leading to tumor formation in all animals of this group: Two circular areas are shown (arrows) with atypic hepatocytes without a clear demarcation and infiltrative growing in the surrounding liver tissue (original objective 4X), H&E. FGF19 indicates fibroblast growth factor 19; AAV, adeno-associated virus; and H&E, hematoxylin and eosin.
Supplemental Material
sj-docx-1-tpx-10.1177_01926233231164097 – Supplemental material for Investigation of the Proliferative Potential of FGF21 or FGF19 in Liver-Specific FGFR4-Deficient Mice
Supplemental material, sj-docx-1-tpx-10.1177_01926233231164097 for Investigation of the Proliferative Potential of FGF21 or FGF19 in Liver-Specific FGFR4-Deficient Mice by Kerstin Wäse, Thomas Bartels, Uwe Schwahn and Mostafa Kabiri in Toxicologic Pathology
Footnotes
Acknowledgements
The authors would like to thank Petra Scherer and her group for the preparation of the histological slides and Ki-67 staining; Fanny Windenberger and Malwina Mackowiak for the statistical evaluation and group size calculation; Ferenc Levai and Sabine Nellen for the toxicokinetic evaluation; Mark Sommerfeld for the initiation and designing of the AAV mice study and for the general project support; Oliver Boscheinen und Thomas Langer for providing the rh proteins FGF19 and FGF21; and Thomas Kissner for the general project support. The authors also thank Nigel Room (Toxicology and Toxicologic Pathology Consultant, Versailles, France) for the critical review.
Author Contributions
Authors contributed to concept and design (KW, MK, TB); data acquisition, analysis, or interpretation (TB, KW, MK, US); drafting the manuscript (KW, TB, MK, US); and critically reviewed the manuscript (KW, TB, MK, US). All authors gave final approval and agreed to be accountable for all aspects of work in ensuring that questions relating to the accuracy or integrity of any part of the work are appropriately investigated and resolved.
Declaration of Conflicting Interests
The author(s) declared the following potential conflicts of interest with respect to the research, authorship, and/or publication of this article: All authors are or were Sanofi employees and may hold shares and/or stock options in the company.
Funding
The author(s) received no financial support for the research, authorship, and/or publication of this article.
Animal Welfare,Care,and Use Statement
Mechanistic study in Fgfr4 fl/fl and KO mice and AAV study in db/db mice were conducted at Covance Laboratories fully accredited by the Association for Assessment and Accreditation of Laboratory Animal Care (AAALAC). All procedures in the protocol of the reported studies were in compliance with applicable animal welfare acts and were approved by the local Institutional Animal Care and Use Committee (IACUC).
Supplemental Material
Supplemental material for this article is available online.
References
Supplementary Material
Please find the following supplemental material available below.
For Open Access articles published under a Creative Commons License, all supplemental material carries the same license as the article it is associated with.
For non-Open Access articles published, all supplemental material carries a non-exclusive license, and permission requests for re-use of supplemental material or any part of supplemental material shall be sent directly to the copyright owner as specified in the copyright notice associated with the article.