
Abstract
Increased cell proliferation is a central key event in the mode of action for many non-genotoxic carcinogens, and quantitative cell proliferation data play an important role in the cancer risk assessment of many pharmaceutical and environmental compounds. Currently, there is limited unified information on assay standards, reference values, targeted applications, study design issues, and quality control considerations for proliferation data. Here, we review issues in measuring cell proliferation indices, considerations for targeted studies, and applications within current risk assessment frameworks. As the regulatory environment moves toward more prospective evaluations based on quantitative pathway-based models, standardization of proliferation assays will become an increasingly important part of cancer risk assessment. To help address this development, we also discuss the potential role for proliferation data as a component of alternative carcinogenicity testing models. This information should improve consistency of cell proliferation methods and increase efficiency of targeted testing strategies.
Carcinogenesis is now recognized as a multistep process in which normal cells progressively acquire a set of core traits that facilitate and ultimately characterize a malignant state (Hanahan and Weinberg 2000, 2011). Of these features, perhaps the most fundamental is a sustained proliferative signal. Disruption in normal cell proliferation is considered to be a common early event in the natural history of cancer and a requirement for progression of a normal cell through the various steps to malignancy. This basic process drives the selection, growth, and eventual autonomy of neoplastic cells. Biomarkers related to proliferation play a key role in clinical characterization of different human cancers, including tumor grade, response to therapy, and prognosis (Dowsett et al. 2011; Sestak et al. 2013), and specific pathways involved in cell proliferation serve as important targets for a large number of anticancer therapeutics (Hudis 2007; Cataldo et al. 2011).
Cancer may be defined as poorly controlled cellular growth arising from errors in DNA. Typically, multiple (uncorrected) errors in a single cell are required in critical portions of specific oncogenes or tumor suppressor genes for progression to malignancy. Although DNA replication is highly precise in most cell types, spontaneous errors occur every time DNA is copied. These errors are the result of processes or alterations that occur in the DNA of all cells, including oxidative damage, deamination, and adduct formation (Ames and Gold 1990; Swenberg et al. 2011). The number of replication errors varies with cell type, and increasing evidence indicates that for such mistakes to result in cancer, they must occur in progenitor/stem cells of the target tissue (Knudson 1971; Moolgavkar and Knudson 1981; Greenfield, Ellwein, and Cohen 1984; Flesken-Nikitin et al. 2013; Tomasetti and Vogelstein 2015). When errors do occur, they are permanently fixed during DNA replication in the S phase of the cell cycle. Based on these principles, an agent can increase the risk of cancer by directly inducing DNA damage (DNA reactive), by indirectly promoting errors through increased DNA replication (proliferative), or by a combination of these events (Knudson 1971; Moolgavkar and Knudson 1981; Greenfield, Ellwein, and Cohen 1984; Cohen and Ellwein 1990, 1991). Increased cell division may thus drive clonal expansion of cells with prior DNA damage, increase the number of target cells for DNA-damaging agents, or increase the probability of spontaneous genetic errors (Preston-Martin et al. 1990; EPA 2005).
At a basic level, increased cell proliferation occurs by an increase in cell births and/or a decrease in cell deaths (Moolgavkar and Knudson 1981; Cohen 1995). An increase in cell births can occur either by mitogenicity resulting from hormonal or growth factor signals or by cytotoxicity followed by regeneration. Direct mitogenicity usually involves interactions with specific cellular receptors, while cytotoxicity usually involves necrosis, apoptosis, and/or inflammation, which can result in local signals leading to regenerative proliferation (Pastoor et al. 2005; Dragan et al. 2001). Other less common mechanisms of increased cell proliferation include removal or inhibition of suppressive growth signals, resulting in indirect mitogenesis. A decrease in cell death can occur by inhibiting apoptosis or cell differentiation, which can lead to an accumulation of target cells even if the rate of cell proliferation remains the same. Alternatively, greater proliferation at an early point in time may have an amplifying effect on cell number later in life (Ellwein and Cohen 1990). In such cases, the number of cell replications, rather than the replication rate, may be a key parameter in evaluating overall proliferative activity.
Given the important role of cell proliferation in carcinogenesis, quantitative proliferation markers are now widely used in cancer risk assessment of pharmaceutical and environmental compounds. When tumor outcomes have been identified in animals, cell proliferation data are often an important part of the carcinogenic mode of action (MOA), which characterizes the requisite key events and/or processes leading to the observed tumor (Sonich-Mullin et al. 2001; Meek et al. 2003; Boobis et al. 2006; Meek et al. 2014). For non-genotoxic carcinogens, these key events often include an increase in proliferation of the target cell population. Increasingly, proliferation data are also being incorporated into predictive or prioritization models of chemical agents with unknown carcinogenic potential (Cohen 2004, 2010; Sistare et al. 2011). In such models, identifying true risk signals associated with cancer risk will be an important challenge in the future requiring greater data consistency.
The goal of this article is to present unified information related to the generation, interpretation, and use of proliferation data. Although our focus here is carcinogenesis, many of the concepts covered are applicable to other areas of safety assessment. We will review standard methods for measuring cell proliferation in tissue sections and address common sources of technical and analytical variability. We will also present design considerations for targeted studies and discuss the use of cell proliferation data within current risk assessment frameworks. Finally, we will discuss the potential role for proliferation data in proposed alternative carcinogenicity testing models and the importance of standardization in these efforts.
Immunohistochemical Markers for Cell Proliferation
Commonly used methods for quantifying cell proliferation in fixed tissue sections are based on chromogenic labeling by immunohistochemistry (IHC). The most common markers are 5-bromo-2′-deoxyuridine (BrdU), Ki-67 (syn. Ki-67, MKi-67), and proliferating cell nuclear antigen (PCNA). Other less commonly used proliferation markers detected by IHC (e.g., phospho-histone H3), in situ hybridization (e.g., histone messenger RNA), and fluorescence microscopy (e.g., 2′-deoxy-5-ethynyluridine [EdU]) are not discussed here. Rather, our focus will be on cell labeling index (LI) for BrdU, Ki-67, or PCNA as a common metric for cell proliferation data. As we will discuss, these markers identify cells actively moving through the cell cycle. Their primary use is in assessing changes in proliferation LI within a population of target cells during a specific window of time. While increased LIs may in some cases correspond to preneoplastic or neoplastic changes, these markers do not specifically identify dysregulated or aberrant proliferation at the level of an individual cell.
The original in situ measure for proliferating cells in formalin-fixed paraffin-embedded (FFPE) sections was the mitotic index, determined by counting the number of mitotic figures within a given field or population of cells. While technically simple, this approach is often impractical in studies of nonneoplastic tissues with low proliferation rates such as liver, kidney, urinary bladder, or mammary gland. The mitotic phase of the cell cycle can be up to 10 times shorter than the S phase (Alberts et al. 2007), leading to low counts per field in many tissues and requiring extensive and laborious counting. To improve sensitivity and reduce the number of cells required to count, tritiated (3H)-thymidine methods were developed (Hughes et al. 1958). When combined with autoradiography, this method was the first to allow microscopic counting of cells that had entered the S phase of the cell cycle (Figure 1A). The main disadvantages of this method were the use of radioactive materials and the long duration needed for autoradiography (>2 weeks). In the early 1980s, IHC staining using antibodies to the synthetic thymidine analog BrdU was introduced as an alternative approach for measuring S phase cells without radioisotopes or autoradiography (Gratzner 1982). Immunostaining for BrdU was faster (1–2 days) and provided better visualization of cells in sections (Figure 1B). These advantages led to widespread adoption of BrdU by the early 1990s as the standard for measuring proliferation LI, particularly in toxicological studies (Leif, Stein, and Zucker 2004). The major disadvantage of BrdU is the requirement for in-life labeling, typically by injection or surgical placement of osmotic pumps, which precludes in situ detection of BrdU in human tissues and archival nonclinical specimens without prior BrdU exposure.
Markers of cell proliferation. (A) Tritiated thymidine labeling of mouse hepatocytes. Note dark granules indicating radiolabeled thymidine molecules. Hematoxylin and eosin (H&E) background stain, 40× objective magnification. (B) 5-bromo-2′-deoxyuridine (BrdU) labeling of rat colonic crypt epithelial cells. Hematoxylin background stain, diaminobenzidine (DAB) chromogen, 40× objective magnification. (C, D) Images of Ki-67-labeled mouse hepatocytes before (C) and after (D) automated cell selection. In this example, cells were sorted and color-coded by nuclear shape, size, and label. Hematoxylin background stain, DAB chromogen, 10× objective magnification.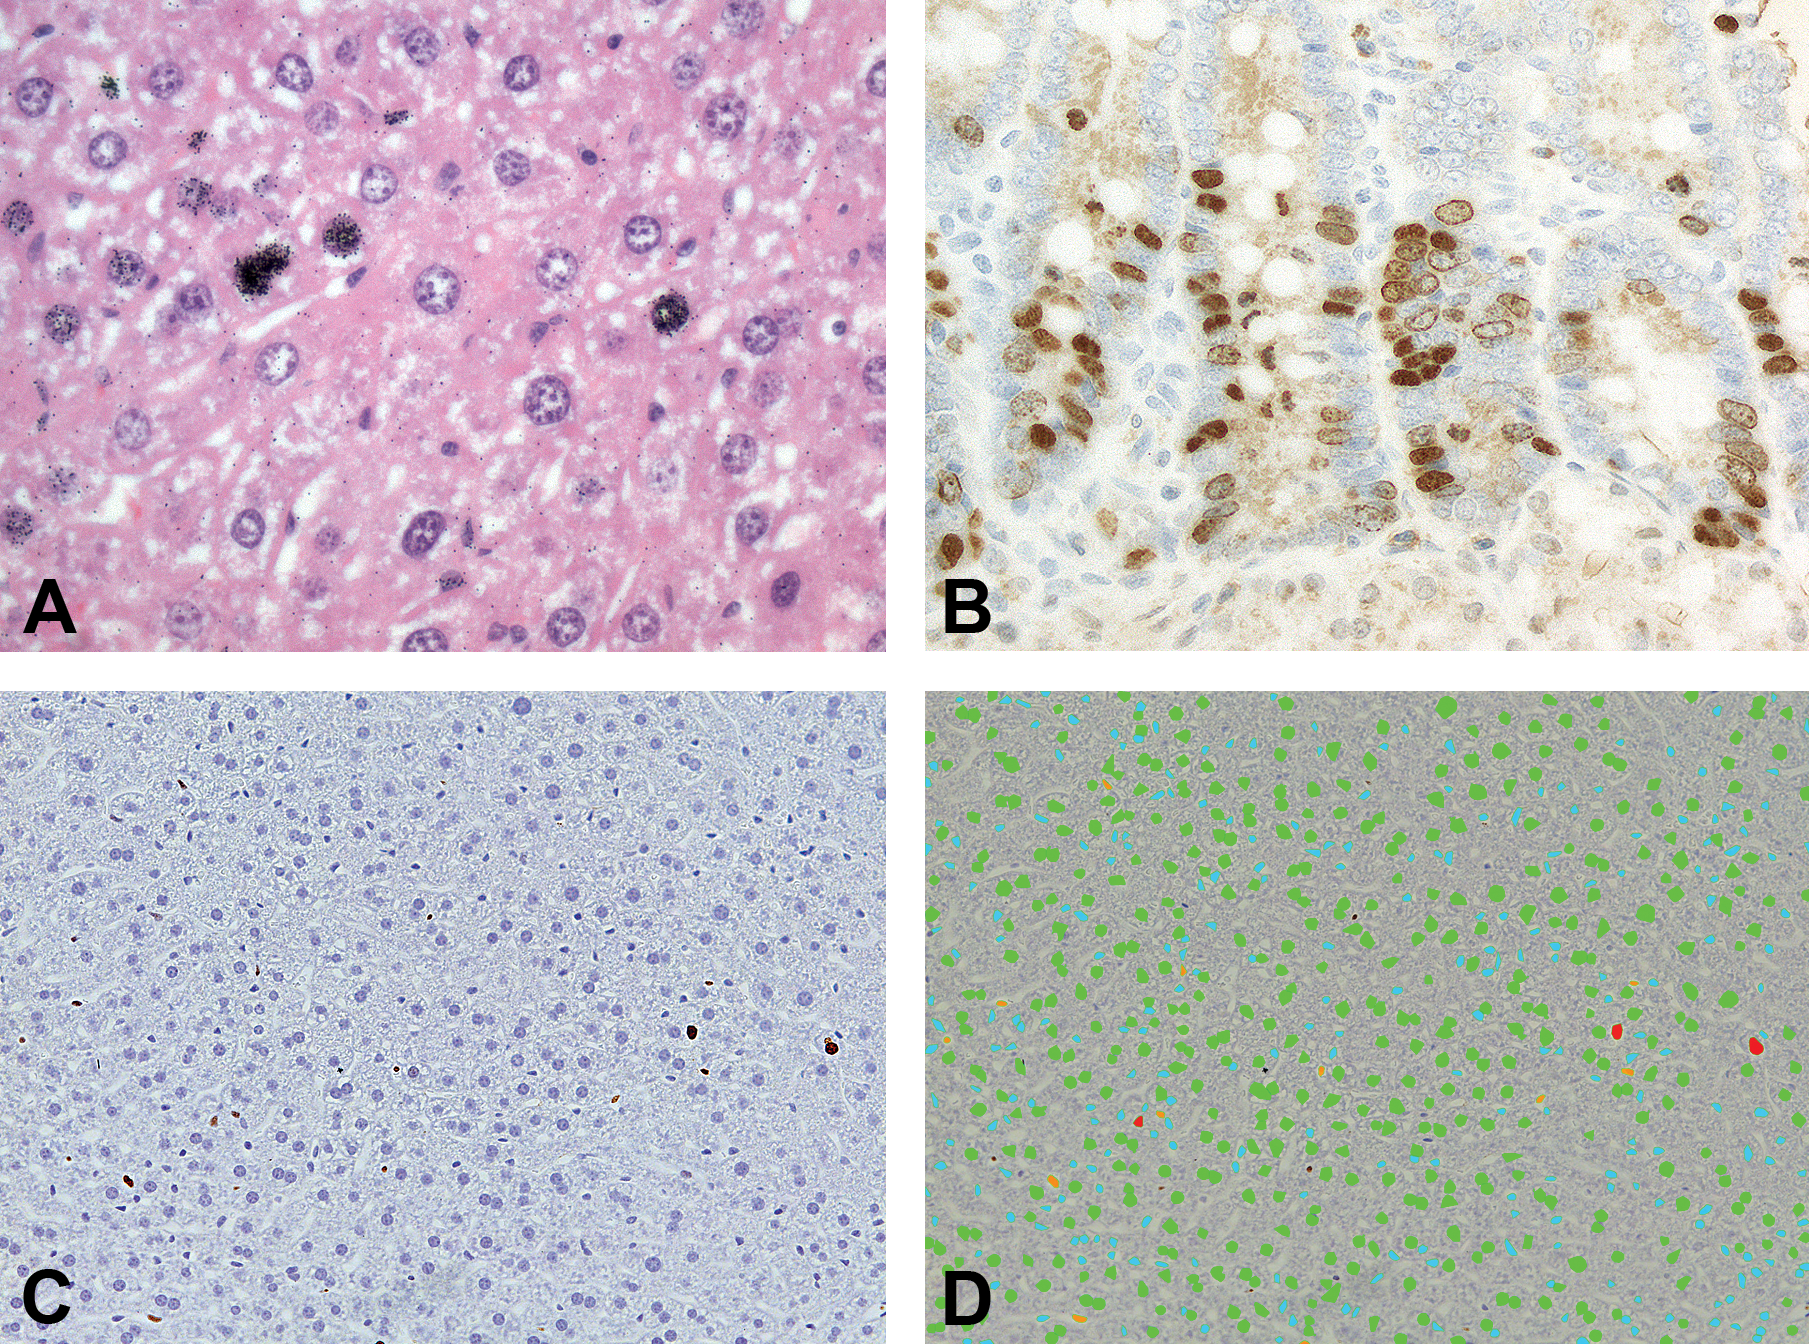
To address these limitations, monoclonal antibodies (mAbs) to PCNA and Ki-67 were developed concurrently in the 1980s for immunolabeling of proliferating cells without in-life treatment (Gerdes et al. 1983; Figure 1C–D). PCNA is a nonhistone nuclear protein that acts as a sliding DNA clamp during DNA replication (Paunesku et al. 2001), while Ki-67 is thought to function in ribosomal RNA transcription (Bullwinkel et al. 2006). In contrast to BrdU, PCNA and Ki-67 proteins are expressed by cells in G1, S, G2, and M phases of the cell cycle but not the G0 phase and thus more accurately measure the growth fraction (or proliferative “state”) of a cell population (Kurki et al. 1986; Scholzen and Gerdes 2000). Maximal PCNA expression occurs in the late G1 and S phases (Scholzen and Gerdes 2000), while Ki-67 levels are low during G1 and early S phases and progressively increase from mid-S phase until late M phase, when levels rapidly decline (Lopez et al. 1991; Figure 2A). These 2 markers label virtually all known cell types across a wide variety of species, allowing for cross-species comparisons. Expression across multiple stages of the cell cycle also provides greater dynamic range in LIs compared to mitotic counts, which may be zero or near zero in many nonneoplastic tissues.
Patterns of expression for different cell proliferation markers. (A) labeling dynamics for 5-bromo-2′-deoxyuridine (BrdU), proliferating cell nuclear antigen (PCNA), and Ki-67 across the cell cycle. Note that these are general patterns that may vary based on cell type. Broken lines indicate potential die-off (for BrdU) and persistence (for PCNA). (B) Labeling dynamics for different proliferative responses over time. Classic patterns include plateau mitogens (e.g., ERα agonists > uterus), burst mitogens (e.g., PPARα agonists > liver), and regenerative proliferation following cytotoxicity (e.g., chloroform > kidney), which may appear at acute to chronic time points.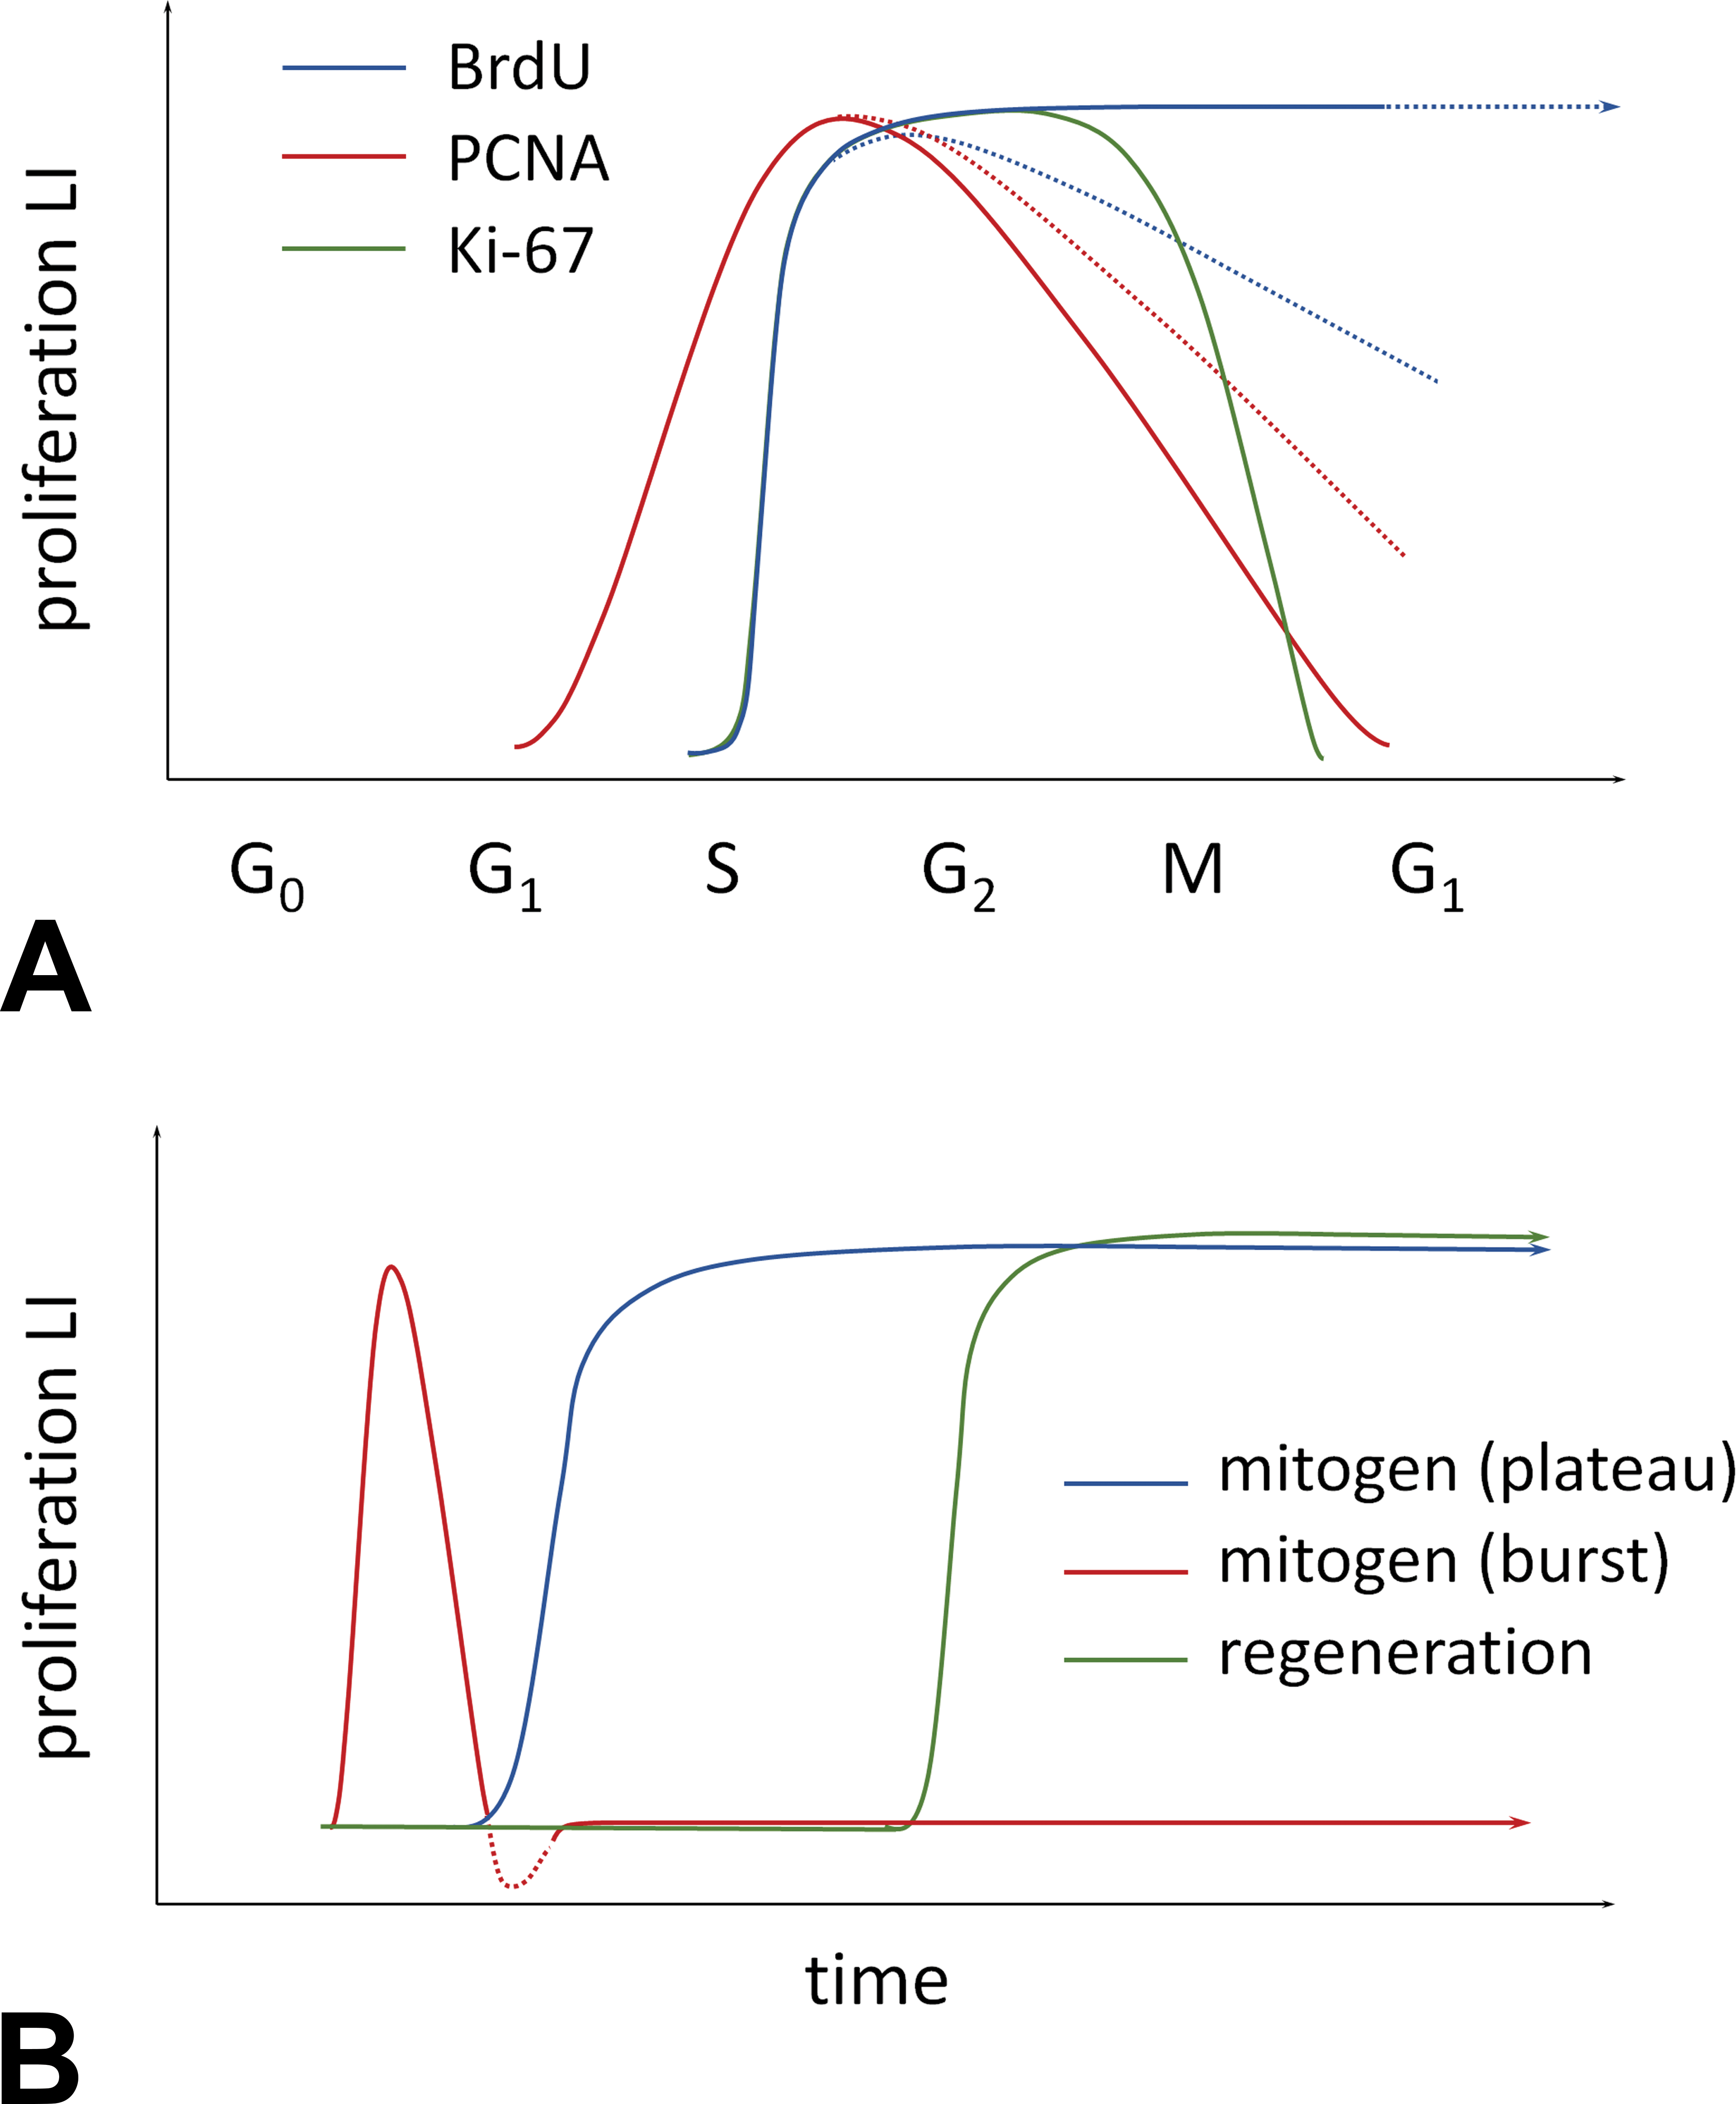
Early use of PCNA and Ki-67 favored PCNA mainly because the primary antibody to PCNA (PC10) could be used on both frozen and FFPE sections, while the original Ki-67 antibody was limited to frozen sections only. This situation changed with the development of MIB-1 and other Ki-67 mAbs in the 1990s that could be used on both frozen and FFPE sections (McCormick et al. 1993). Other evidence showed sensitivity of PC10 to fixation and heat-induced antigen retrieval (AR) methods and potential functions of PCNA distinct from cell proliferation (Tahan et al. 1995; Prosperi 1997; Scholzen and Gerdes 2000), leading to greater use of Ki-67 in human cancer research and other fields.
Numerous human and rodent studies have shown significant correlation among BrdU, PCNA, and Ki-67 LIs (Goodson et al. 1998; Thor et al. 1999; Birner et al. 2001; Urruticoechea, Smith, and Dowsett 2005; Dowsett et al. 2011). Marker LIs also tend to correlate well with mitotic index in samples with high enough proliferation rates to get meaningful mitotic counts, mainly tumor studies (Thor et al. 1999). Notable inconsistencies between markers have also been reported. Such differences may relate to variations in fixative, antibody, IHC protocol, tissue type, duration of BrdU exposure, and treatment conditions, as discussed subsequently (Holt et al. 1997; Tanaka et al. 2011). In general, Ki-67 labeling appears to correlate more strongly with BrdU than with PCNA in most tissues (Urruticoechea, Smith, and Dowsett 2005; Dowsett et al. 2011), while PCNA shows variable correlation with Ki-67 or BrdU (Muskhelishvili et al. 2003; Eldridge and Goldsworthy 1996).
Summary features for different immunohistochemical proliferation markers.
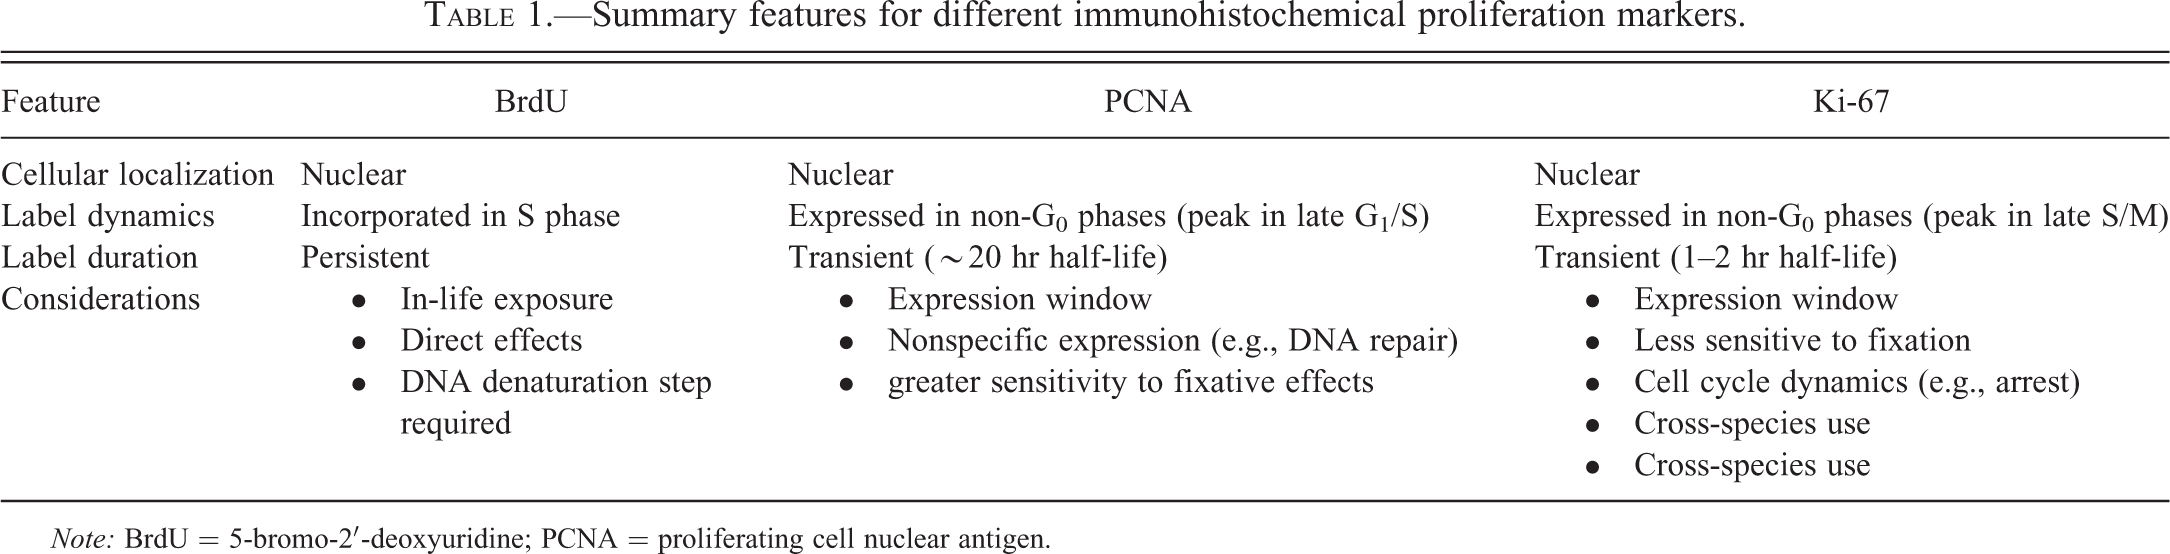
Note: BrdU = 5-bromo-2′-deoxyuridine; PCNA = proliferating cell nuclear antigen.
Antibodies to BrdU, PCNA, and Ki-67 are commercially available for IHC in all standard research species. Anti-BrdU mAbs are most diverse (Liboska et al. 2012); common clones include BU20a in mouse and BU-1/75 in rat, but there is wide variation in anti-BrdU antibodies across studies. For PCNA, the PC10 clone mouse mAb is most widely used and cross-reacts with most species tested; however, other clones may be preferred for mouse tissues to avoid background staining due to nonspecific binding to endogenous immunoglobulins. For Ki-67, the MIB-1 antibody widely used for human tissues cross-reacts with the Ki-67 protein in many nonhuman species (e.g., monkey, dog, ox, horse, sheep) but not rodents (Birner et al. 2001), for which other clones are available (e.g., MIB-5 and SP6).
Variability in Methods for Measuring Cell Proliferation
Consistency between laboratories and studies is an important issue in evaluating cell proliferation data (Dowsett et al. 2011; Polley et al. 2013; Nolte et al. 2005). Most laboratories rely upon indirect IHC methods with primary and secondary antibodies, horseradish peroxidase– or alkaline phosphatase–conjugated streptavidin labels, commercial chromogens such as diaminobenzidine (DAB), and counterstaining with hematoxylin. Beyond these standard procedures, there may be important differences across laboratories related to sample fixation, tissue processing and storage, marker and antibody selection, IHC equipment, and other technical details of IHC protocols. Such differences may impact LI readouts. Several work groups have been formed to address this issue for clinical applications related to the Ki-67 marker (Dowsett et al. 2011; Polley et al. 2013). Similar efforts exist for preclinical applications as well, although to date these have been more limited (Nolte et al. 2005). In this section, we will briefly consider pre-analytical sources of variation in LI data.
Sample Preparation
Tissue collection should be one of the initial considerations for any cell proliferation study. Sampling protocols will vary by experiment and tissue type but should be clearly defined prior to necropsy to ensure consistency and alignment with study goals. A technically detailed collection and trimming protocol will aid in the identification of the same macroscopic region for each target tissue and increase concordance between target site and proliferation measurements. For example, if nasal epithelial tumors were observed in a carcinogenicity study within a specific region of the nasal turbinates, then it is critical to analyze this region in the corresponding shorter-term proliferation study and not an arbitrary region of the nasal cavity. If mass lesions are observed in the target tissue, these should be collected separately from grossly normal tissues to avoid a mixed batch of neoplastic and nonneoplastic samples resulting in missing or biased data. Cell proliferation LIs from proliferative lesions (e.g., hyperplastic focus or tumor) should generally be excluded or analyzed separately from morphologically normal areas.
Tissue fixation is another variable to consider in cell proliferation studies. The most widely used fixative for histology is formalin, which preserves tissue architecture mainly by cross-linking proteins. These cross-links may mask antigens and thereby interfere with IHC labeling (Puchtler and Meloan 1985). Prior studies have consistently shown that formalin fixation for prolonged periods (typically >24 hr) may decrease BrdU LIs compared to matched frozen samples (McGinley, Knott, and Thompson 2000). Similar or greater effects have been reported for PCNA LIs (Tahan et al. 1995; Casasco et al. 1994). Labeling for Ki-67 (MIB-1 at least) has generally shown more resistance to formalin fixation effects compared to BrdU and PCNA, but loss of antigenicity may still occur (McCormick et al. 1993; Hendricks and Wilkinson 1994; Benini et al. 1997; Holt et al. 1997; Arber 2002; Otaliet al. 2013). These observations have led to the practice of fixing tissues for IHC initially in 10% buffered formalin (or fresh 4% paraformaldehyde) for 12 to 24 hr and then transferring them to 70% ethanol or alternative alcohol-based fixatives that do not form protein cross-links (McGinley, Knott, and Thompson 2000; Otali et al. 2013). In some instances, fixation directly in 70% ethanol may be optimal (Ohnishi et al. 2007), depending on the specific requirements of the antibodies used. Ideally, internal optimization and validation of fixation protocols should be documented in the operating procedures for each laboratory. Use of a positive proliferation control reference group (e.g., treated with a known mitogen for the tissue of interest) will also help distinguish true negative results from signal loss related to fixation, especially for studies in which low control LIs are expected.
The length of time FFPE tissues stay in paraffin block (or sectioned on slide) prior to IHC staining can also affect antigenicity for proliferation markers. Age-in-block is an important consideration when using archived samples that differ in age (e.g., tumor case series) or performing a retrospective analysis of tissue samples from an older study (Greenwell, Foley, and Maronpot 1993). Prolonged age-in-block can lead to variable or tissue-specific loss of antigenicity depending on storage conditions and prior tissue processing (Karlsson and Karlsson 2011; Xie et al. 2011). For archival case studies or cross-study comparisons, it is important to include fixation method and age-in-block as covariates in the analysis.
Immunolabeling
Potential differences in IHC procedures across laboratories include the use of automated compared to manual slide staining, primary antibody dilution, buffer selection, and incubation times (Nolte et al. 2005). Given this variability, it is critical that internal optimization and validation of IHC protocols are used to determine the most appropriate staining conditions (Hendricks and Wilkinson 1994). Reporting full details of these methods will also facilitate greater concordance between studies and laboratories and aid in interpretation of unexpected or marginal treatment effects.
General recommendations for IHC quality control include negative and positive staining control slides run for each staining batch. For negative control slides, nonimmune serum from the same species as the primary antibody is often applied in place of the primary antibody. For positive controls, a tissue with high basal proliferation (e.g., intestine, stomach, or lymph node) from the same animal or study may be run in each batch or on each slide to confirm appropriate label administration (for BrdU) and staining. Non-target cells with proliferative activity (e.g., lymphocytes) may also serve as internal positive controls for some tissues. For new mAb clones or lots, a dilution series is recommended to account for any shifts in affinity.
Epitopes masked by fixative cross-links, FFPE processing, and age-in-block effects can be partially recovered through various AR methods (D’Amico, Skarmoutsou, and Stivala 2009; Shi, Key, and Kalra 1991; Greenwell, Foley, and Maronpot 1993). While critical to many IHC protocols, the degree of epitope recovery often varies (McGinley, Knott, and Thompson 2000). The most common AR method is heating via microwave, water bath, or steamer, often with a citrate buffer; alternative techniques include use of proteolytic enzymes or other chemical treatments (D’Amico, Skarmoutsou, and Stivala 2009). Importantly, both heat and chemical AR methods may potentially increase background labeling (D’Amico, Skarmoutsou, and Stivala 2009; Bak and Panos 1997). General recommendations to minimize this nonspecific labeling include avoidance of extreme AR conditions (e.g., heat and pH), inclusion of control conditions for endogenous antigens, and performing initial optimization protocols (D’Amico, Skarmoutsou, and Stivala 2009; Greenwell, Foley, and Maronpot 1993).
An AR issue unique to BrdU IHC is the specificity of anti-BrdU mAbs for single-stranded DNA. Antibody binding thus requires a denaturation or degradation step, typically with hydrochloric acid and/or nuclease digestion. These treatments can further increase background BrdU staining, alter immunoreactivity to other antigens, and disrupt tissue morphology (Kass et al. 2000; Dover and Patel 1994; Liboska et al. 2012). Approaches developed to avoid these issues include use of sodium hydroxide to relax DNA and monovalent copper ions to create gaps in DNA (Liboska et al. 2012). EdU, which is a more recently developed thymidine analog, does not require this denaturation step and is currently used as a fluorescence-based alternative to BrdU (Mead and Lefebvre 2014).
Quantification of Cell Proliferation Markers
Perhaps the most important source of variation in proliferation LIs is the method used for measuring positively labeled cells. For example, a recent interlaboratory reproducibility study of Ki-67 in the same set of human cancer samples reported mean LIs from 7% to 24% (Polley et al. 2013). This wide range was attributed to differences in region selection, cell counting methods, and subjective thresholds for positive labeling. Other sources of variation include selection criteria for specific cell types; tissue heterogeneity and staining hot spots; the number of fields and cells counted; and digital imaging applications (Dowsett et al. 2011). Variability in cell counting methods can limit comparisons to historical control values, inter-study and interlaboratory data comparisons of treatment effects, and use of proliferation LI data for modeling applications and clinical and safety assessments. Here we will briefly review basic counting approaches and discuss considerations that may influence data interpretation and improve standardization.
The simplest way used to quickly assess the number of proliferating cells is by visual estimation. Typically, arbitrary categories for percentage of positive cells are preset (e.g., <10%, 10–25%, 25–50%, 50–100%), and one or more pathologists blindly grade slides according to these categories. Staining intensity (e.g., 1+ to 4+) may be included as an additional descriptor. While expedient, this method is more subjective than individual cell counts and applicable mainly to tumor samples with a much greater range of LIs compared to nonneoplastic tissues, which generally have control LI ranges <10% (and often <1%). Such low values cannot be reliably categorized by qualitative evaluation.
The most common method for determining LIs in targeted toxicological studies is cell counting by light microscopy. An important recommendation for these studies is to use actual cell counts for the LI (i.e., positive target cells/total target cells counted) rather than the positive cells per field or unit tissue area. Percentage-based LIs provide a standardized end point and avoid bias resulting from changes in cell or tissue size. Prior to digital imaging, cells were counted manually in real time using a click counter; today, counts are typically performed on digital images that can be annotated and saved for reference (Dölemeyer et al. 2013). As with IHC staining protocols, there are many different techniques used for manual counts and limited standardization of methods, which are often tissue-specific and developed empirically within each laboratory. General considerations include field selection, the number of fields and cells to count, signal thresholds for positive labeling, and whether to focus on a specific tissue compartment, region, or cell type of interest.
Take, for example, a targeted cell proliferation study in the liver. The following criteria should be determined prior to counting: number of total cells counted per sample (typically ≥1,000), the objective magnification for imaging (20× or 40×), and the number of fields to be counted (typically 3–6 across 2 or 3 different lobes; Ross et al. 2010). Fields are often selected using random coordinates or arbitrary assignment, excluding areas with clear artifacts or lesions (e.g., extensive necrosis, inflammation, or neoplasia). Adjacent sections stained with hematoxylin and eosin (H&E) for histopathology may be helpful for identifying lesions in the area to be counted. Morphological cell selection criteria should also be predetermined to distinguish large mature hepatocytes from smaller or spindle-shaped cells, which may or may not represent a hepatocyte lineage or target cell of interest. Finally, compartmentalization of liver counts into centrilobular, midzonal, and periportal regions may be needed in some cases to discern a zone-specific effect.
For tissues with potential clustering of proliferative cells, digital filters may be useful to spread out counts over a larger area, define regions of interest (ROIs), and reduce the impact of hot spots. For example, normal intestinal epithelium has a high background rate of proliferation in the crypt cells but not in more apical cells. Here it is important to systematically divide the tissue into crypt and apical compartments and perhaps even more specific ROIs. For such rapidly proliferating tissues such as the intestine, morphometric evaluation of crypt size may be a more sensitive indicator of cell proliferation rather than LI. The LI may be similar in untreated versus treated intestine, despite significant expansion of the crypt size and consequently the number of proliferating cells. Applying digital color thresholds for positive cells is another important way of increasing consistency and reducing intra- and interobserver variation in cell counts. For manual counting, establishing reference images of borderline weak positive cells prior to data collection are helpful in maintaining these thresholds.
Digital image analysis methods now allow for automated measurement of LIs (van der Loos et al. 2013). Advantages of this approach include improved efficiency (e.g., decreased observer time), objectivity (e.g., for positive cell thresholds), tissue coverage (e.g., with whole slide analyses), and quantitative analytical capabilities (e.g., target cell/ROI selection). Automated identification of labeled and unlabeled nuclei is typically based on thresholding functions that partition a digital image into elements based on pixel intensity values across different color channels. Optimal thresholds for detection of negative and positive nuclei will vary based on a number of different pre- and post-processing factors. Thus, analytical programs are generally specific to a particular laboratory, study, or even batch of IHC slides within a study. For any automated counting system, it is important that only the target cell type of interest is actually counted rather than multiple or all cell types.
Standardization of image capture and processing (e.g., white balance, contrast) and internal validation of thresholds (e.g., using a comparison of manual and automated LIs) should be addressed on a case-by-case basis. Tissue-specific considerations include the use of cell size and shape thresholds, establishing ROIs (e.g., to exclude non-target cells or compartments), and splitting of touching nuclei into separate objects (e.g., in colonic epithelium). As for manual counts, the sampling parameters should be clearly defined, and inferences should be limited to the specific cell populations counted. For IHC staining, it is important to optimize counterstaining, since variation here may impact negative cell counts (e.g., weaker counterstain may inflate LI) or decrease specificity between labeled and nonlabeled cells. Other quality control issues relate to management of raw and annotated digital images as archived data (Dölemeyer et al. 2013), particularly in good laboratory practice (GLP) studies. For example, to maintain compliance with U.S. Food and Drug Administration (FDA) electronic record guidelines, software used to generate, measure, and assess GLP data must have an audit trail and a reliable method of electronic storage (FDA 2003).
In some cases, more sensitive stereological approaches may be needed to detect subtle changes in LI or density of labeled cells with greater confidence. Stereology allows reconstruction of the third dimension within an organ using statistical sampling principles and modeling analyses, which are particularly useful for specialized structures or cell populations (Falcão et al. 2013). Proper stereological methods avoid potential sources of bias inherent to methods using a limited number of sections (such as lack of uniformity throughout the organ) and accommodate changes in organ size for cell density estimates. For proliferation studies, stereological methods may also be used to capture the number of labeled cells at a whole organ level, expressed as sum totals or density estimates normalized by organ volume. This type of information is important for treatments that may significantly affect organ volume and/or total cell number without altering LI. More detailed reviews of these approaches are provided elsewhere (Boyce et al. 2010).
Considerations for the Design of Proliferation Studies
Cell proliferation is a dynamic process influenced by many factors, including the target tissue and cell type, time course of exposure, model system, and treatment conditions. Experimental factors such as diurnal variation and whether to fast animals prior to termination should be addressed, as these can significantly alter the LI of some tissues. Proper understanding of such factors can be important to the quality of data obtained from targeted proliferation studies. In this section, we will discuss issues related to study design, focusing on marker selection, temporal dynamics of marker expression, and model and statistical considerations.
Marker Selection
The most widely used IHC label for proliferation in preclinical in vivo studies is BrdU. Despite being widely considered as the marker of choice, BrdU is contraindicated in certain tissues and study types. As noted earlier, the major disadvantage of BrdU for standard applications is the requirement for in-life labeling either by pulse or continuous exposure. Surgical placement of osmotic pumps can introduce a number of potential study issues, including loss of animals due to health complications (e.g., anorexia, infections) and potential effects on other study parameters influenced by anesthesia and surgery near the time of sacrifice (e.g., hormonal, metabolic, or inflammatory markers; Wyatt et al. 1995). Decreased feed intake may in turn affect dosing of the test article if given via the diet. Administration of BrdU can be directly toxic when administered at high doses or for long durations, or in some cases induce proliferative activity (e.g., in the thymus and adrenal cortex), potentially confounding experimental results (Nolte et al. 2005). Exposure of cultured cells to BrdU has also been shown to alter gene expression, DNA repair, and mutational profiles (Minagawa et al. 2005; Masterson and O’Dea 2007; Taupin 2007), and thus BrdU may not be suitable for studies with concurrent genomic or genetic end points.
Unlike BrdU, Ki-67 and PCNA markers do not require in-life labeling. This allows for retrospective evaluation of archived samples (e.g., tumor case series) and eliminates potential in-life marker effects on transcriptomic data. Disadvantages of PCNA include formalin sensitivity and expression due to functions beyond cell proliferation, including DNA repair and apoptosis (Paunesku et al. 2001). Use of PCNA may thus be contraindicated for proliferation studies of potential DNA-damaging agents. The longer half-life of PCNA may also mask a potential treatment effect in tissues with higher background rates of proliferation by increasing control LIs. Both PCNA and Ki-67 have discrete windows of expression in the cell cycle and thus avoid the cumulative labeling of cells seen with BrdU. This single time point (snap shot) feature may be a disadvantage if time course dynamics of a potential mitogenic burst effect are very acute or not known. For example, using a 7-day exposure time point for a mitogen that caused an acute burst of proliferation at day 3 may lead to a false negative result. In cases when predicted changes are uncertain, multiple time points are recommended. An additional consideration for Ki-67 is the lag effect relative to the cell cycle (low G1 and high G2 expression), which could potentially skew expression lower for agents that arrest cells in G0/G1 and higher for agents that arrest cells in G2/M (Scholzen and Gerdes 2000; Dowsett et al. 2011). Other effects such as loss of histone deacetylation have also been shown to selectively alter Ki-67 expression during mitosis (Xia et al. 2013). Use of an alternate label is recommended if such marker-specific effects are suspected. For Ki-67 and other labeling methods, if there is concern about the results (e.g., apparent lack of increased LI in the presence of obvious cytotoxicity), complementary assessment of mitotic rate can be helpful.
In-life BrdU Exposure
As described earlier, frequency and duration of BrdU exposure may have an important impact on LI. To account for variation, BrdU protocols should be optimized for the particular study type and tissue of interest. For rapidly proliferating tissues (e.g., intestinal or lymphoid tissues), a single exposure to BrdU will result in labeling of sufficient numbers of labeled cells to detect a treatment effect. These burst protocols are useful for defining the number of S phase cells over a short time period (≤6 hr) but do not provide information on kinetics (e.g., doubling time). Single-dose protocols may also show high intra- and inter-day variability, which can be minimized to some extent by standardizing the time of day that samples are collected.
In tissues with low proliferative activity, BrdU dosing often needs to be extended to provide an adequate dynamic range of labeled cells. Such tissues require continuous exposure to BrdU achieved through the use of osmotic mini-pumps or frequent dosing. For these studies, a 3- to 7-day exposure typically results in labeling of sufficient numbers of proliferating cells within target and control tissues. Continuous exposure protocols provide feedback on the total proliferative activity during administration but do not distinguish between cells in S phase and those that have exited S phase during the labeling period. Compared to pulse-labeling, continuous exposure protocols are better controlled for intra- and inter-day variability. Since labeling is a function of BrdU exposure time, LIs from studies with variable labeling-exposure durations generally should not be directly compared. If such comparisons are necessary, a division rate can be used to correct for labeling exposure (Moolgavkar and Luebeck 1992). In some tissues such as urinary bladder, placement of a subcutaneous mini-pump can produce sufficient stress to alter the LI. Under such circumstances, pulse-labeling or use of Ki-67 may be preferable (Cohen et al. 2007).
Model Considerations
Model selection should be tailored to the particular goals of the study. For targeted proliferation studies designed to address carcinogenic MOA, the species, strain, and sex should match that of the bioassay in which the tumor outcome was observed. In addition, the source of animal, diet, and starting age of the animals should be matched as much as possible. Similarly, in investigative studies, the experimental models should match as closely as possible the life stage and hormonal context of the human disease being studied. Diet considerations include caloric intake and soy isoflavone exposure from chow-based formulas, which can potentially influence cell proliferation (Allred et al. 2004). In general, isoflavone-free diets should be used. Finally, specialized protocols should be consulted when using proliferation markers in alternative models such as small fish (Law 2001; Santhakumar et al. 2012).
Tissue-specific Dynamics
Tissues from adult control animals exhibit a wide variation in normal background rates of cell proliferation, from constant high LIs (e.g., hematopoietic cells, intestinal epithelial cells, male germ cells) to low or barely detectable LIs (e.g., cerebrocortical neurons, cardiomyocytes). Given the many variables that may affect LIs, it is difficult to provide specific background rates of proliferation for most individual tissues or cells. However, a working knowledge of control LI ranges previously reported in the literature can help identify variance estimates for sample size determination and potential technical problems when they occur. For example, control hepatocyte LIs in a study of young adult B6C3F1 male mice using osmotic mini-pumps with 3-day administration are typically <3%; values much higher than this may be cause to question the validity of methods or data (e.g., nonspecific staining).
Temporal Dynamics
The time course of a mitogenic or regenerative LI response is often cell- or tissue-specific. Schematic examples are given in Figure 2B, which shows hypothetical proliferation LI curves for an acute burst mitogen (e.g., peroxisome proliferator-activated receptor α [PPARα] agonist in liver), a plateau mitogen (e.g., estrogen in endometrial glands), and a delayed regenerative proliferative response (e.g., chloroform in kidney tubular epithelium). Note that the timing of initial response and “decay” following an acute burst may vary by tissue, agent, and dose. Understanding these types of time course dynamics for the target tissue of interest is an important element of study design. For example, proliferation studies in the liver often include a 3- to 7-day time point to detect acute mitogenic effects with a 28-day time point to confirm reversal of the burst and to detect any delayed regenerative effects (Ross et al. 2010). Data from a single 14-day time point in between mitogenic and regenerative proliferation windows may be more difficult to interpret. Other tissues such as lung may also require short <7-day windows for detection of acute proliferation bursts (Strupp et al. 2012; Cruzan et al. 2013). For tissues lacking well-established responses, pilot studies using known positive mitogenic controls may be needed to establish temporal dynamics.
Dose Considerations
For known tumorigens, a suitable dose range should allow evaluation of concordance between any effects on proliferation LI and tumorigenic responses in the corresponding carcinogenicity study (e.g., EPA 2005). For proliferation-based MOAs, concordance would be supported by a proliferative response at or below the tumorigenic dose level. In contrast, a single-dose proliferation study at an exposure above the carcinogenic dose would not be considered adequate. If available, results of other toxicity studies on the agent of interest should be reviewed to avoid systemic toxicity or overt cytotoxic effects in the target tissue. As noted elsewhere, cytotoxicity with regenerative proliferation may potentially mask a direct mitogenic effect and increase variability in LI data (Wood et al. 2014).
Tissue Compartmentalization
Measurement of LIs should be restricted to target compartments and cell types of interest within a given tissue type. In many cases, these compartments or cell types can be reliably identified by morphology (e.g., mammary gland lobular and ductal epithelium). However, different protocols and/or studies may still be required to accurately assess LIs across cell types. For example, within the kidney, proliferation LI responses vary between glomeruli and tubules and between proximal and distal tubules (Umemura et al. 2004). If the proximal tubules are targeted, a 3-day BrdU labeling-exposure would be adequate based on proliferation rates of the epithelium. If the collecting ducts are targeted, the labeling-exposure should be longer (>7 days; Nolte et al. 2005).
For counting, it is often challenging to obtain LIs for cell types that are difficult to identify histologically. Examples include C-cells in the thyroid gland, endothelial cells in liver or adipose tissue, and smaller non-hepatocyte cell populations in the liver (Nolte et al. 2005; Ohnishi et al. 2007). In such cases, a double-labeling IHC approach may be required using a proliferation label in combination with a cell-specific marker (e.g., calcitonin for C-cells, CD31 for endothelial cells, and CD68 for Kupffer cells). This type of approach may also be helpful in mechanistic studies for relating proliferative responses to upstream molecular events (e.g., receptor expression). Without a double label, it is important to clearly specify what visual or computer-assisted cell selection criteria were used to identify target cells of interest.
Other Statistical Considerations
As with other end points, sample size and effect variance will determine the statistical power of LI results. Expected treatment effect (change versus control) as well as control LIs will inform the number of samples and cells to count per sample (Morris 1993). Sample size is the primary driver for power, so power decreases as sample size is reduced, even if more cells are counted per sample. In general, for a given fold-change in LI from control, larger sample sizes are needed to meet power thresholds when the control LIs are lower. Similarly, treatment-induced changes will be harder to detect when LIs are lower, and thus more cells per sample should be counted to reduce variance and increase power in this case (Morris 1993). In a simple example provided by Morris (1993), a 2-fold increase in LI when the control value is near 5% was comparable in power to a 3.5-fold increase in LI when the control value was near 1%.
These concepts are illustrated in the Ki-67 LI data sets shown in Figure 3. Note that labeling data in both sets are asymmetrically distributed (clumped toward zero) with nonhomogeneous variance across groups. Analysis of group differences thus require nonparametric analysis, which is typical for LI data. This skew does not strongly influence power outcomes, which can be calculated using either a t-test or a rank sum test (Morris 1993). For the low-LI study (Figure 3A), the population mean and standard deviation were estimated at 1.5% and 1.4%, respectively, and the expected treatment effect was a 2-fold increase in LI. The sample size in each group providing an 80% chance at a .05 significance level to detect a statistically significant difference was 10 after adjusting for multiple comparisons. For the high-LI study (Figure 3B), the population mean and standard deviation were estimated at 9% and 14%, respectively, and the expected treatment effect was a 3.5-fold increase. Here, the sample size in each group required for 80% power was only 5. These data sets highlight the importance of using either historical or pilot data of the target cell population to assess both variance and range of LIs. When presenting LI data, it is recommended that actual means are given with standard deviation or standard error values rather than simple fold-change values from control (especially when LIs are low). As described earlier, presenting only the total positive cells per field (rather than LI) is not sufficient for standard analyses, since this metric may be biased by shifts in the total number of cells/nuclei present in each field.
Distribution and range of proliferation labeling index (LI) data in different tissue types. (A) Ki-67 labeling in hepatocytes showing lower LI control and response values and larger sample size (n = 10/group). (B) Ki-67 labeling in uterine glands showing higher LI values and response range and lower sample size (n = 5–6/group). con = control; d1–d3 = dose groups; t1–t3 = treatment groups. *p < .05 compared to control group.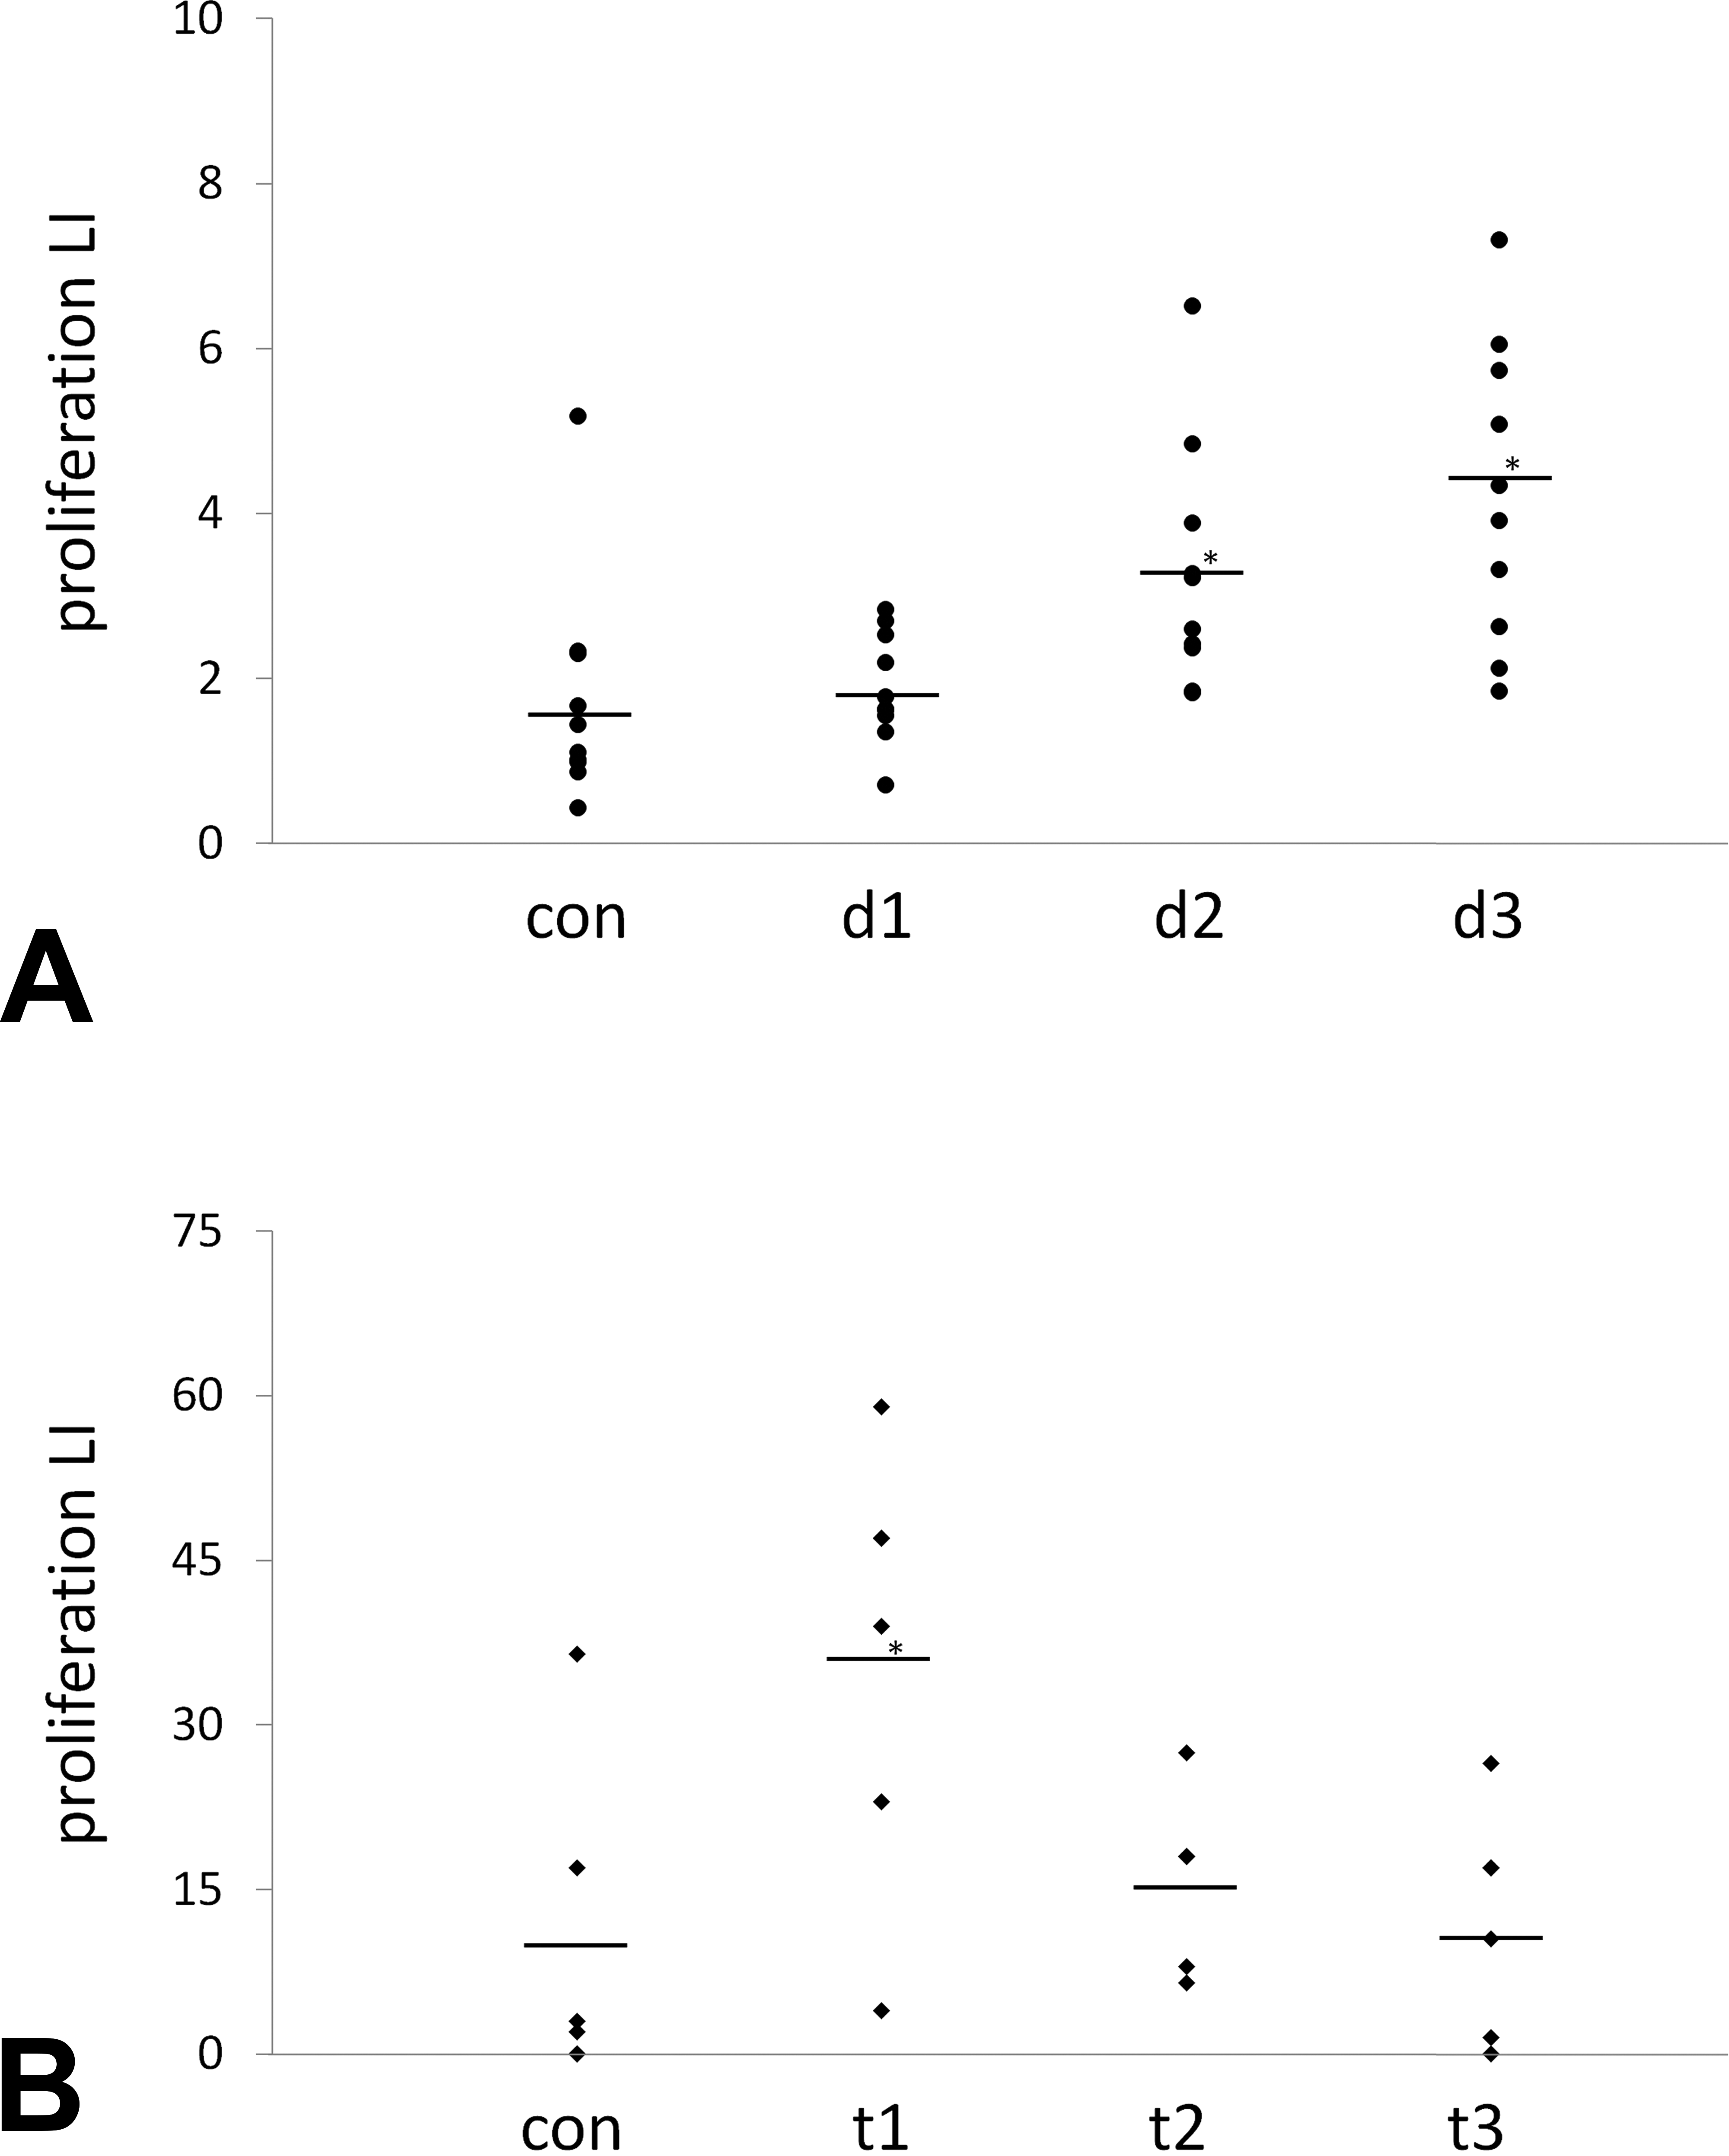
Complementary Markers
As with other potential treatment effects, cell proliferation data should be considered in context of other information about a given compound. Relevant effects may include gross and histopathological lesions (e.g., necrosis) and changes in organ weights, circulating hormones, gene expression markers, and biochemical or cell-based data. This information may help identify early molecular events associated with a proliferative signal, distinguish a risk signal from an expected pharmacologic response, and aid in the interpretation of marginal or equivocal treatment effects on LI.
One of the most common processes evaluated alongside cell proliferation is apoptotic cell death. Apoptosis plays a central role in organ homeostasis, and imbalance between apoptosis and cell proliferation has an established role in tumorigenesis (McDonnell 1993; Elmore 2007). Many different techniques are currently used to detect or measure apoptosis. These include evaluation of cellular morphology, either by light or electron microscopy; markers of DNA fragmentation (e.g., terminal deoxynucleotidyl transferase 2′-deoxyuridine, 5′-triphosphate nick end labeling [TUNEL]) and repair (e.g., poly-adenosine diphosphate-ribose polymerase); plasma membrane changes (e.g., annexin V); and expression of proteins directly involved in apoptotic pathways (e.g., caspases, Bcl-2, Bax, p53; Elmore 2007). While morphologic evaluations can be used for qualitative identification of apoptotic cells, these molecular indicators of apoptosis are generally required to demonstrate quantitative dose-related changes.
The most widely used IHC marker in toxicological evaluations for in situ measurement of apoptosis LI is TUNEL, which labels 3′ hydroxyl ends of fragmented chromatin from cells in the late stages of apoptosis (Negoescu et al. 1996). Due in part to off-target TUNEL staining in necrotic cells (due to endogenous endonuclease activity), the use of cleaved caspase 3 (CC3) has gained in popularity as a more specific IHC label for apoptotic cells (Gown and Willingham 2002). Assays for both TUNEL and CC3 IHC are applicable to standard FFPE tissues, and positively labeled cells are typically discrete and readily quantified.
Many of the pre-analytical and cell counting issues for measuring apoptosis LIs are similar to those described earlier for cell proliferation. Here, we will only highlight a few considerations that relate more specifically to the use of apoptosis LI data. Probably the most important issue related to cancer assessment is the fact that for certain tumorigenic agents the effect in question is apoptosis inhibition rather than induction. A classic example is 2,3,7,8-tetrachlorodibenzo-p-dioxin, which inhibits apoptosis and alters proliferation in the liver via activation of the aryl hydrocarbon receptor (AhR) pathway (Budinsky et al. 2014). The challenge here is that basal apoptosis indices are very low in many adult (nonlymphoid) tissue types (often <0.1%), making it unfeasible in many cases to show a statistically significant decrease in LI in normal cells. In some cases, an inhibitory effect on apoptosis LI may only be observable in specific cell populations such as preneoplastic hepatic foci (Stinchcombe et al. 1995; Budinsky et al. 2014). Given these low LIs, it is often necessary to count more cells for apoptosis compared to proliferation markers. Other potential issues related to apoptotic cell LIs, particularly with TUNEL, include cross-reactivity with cells undergoing necrosis or DNA repair, fixation and pretreatment effects on detection of DNA strand breaks, and sensitivity and specificity of the end-labeling technique.
Current Applications of Cell Proliferation Data
Cell proliferation data are most commonly used in cancer risk assessment to evaluate the MOA for a specific tumor outcome observed in a rodent carcinogenicity study (Boobis et al. 2006; EPA 2005). Establishing the key events in an MOA allows for assessment of human health relevance, dose–response extrapolation, and identification of potential susceptible populations (EPA 2005). Weight-of-evidence evaluations of key events in a putative MOA include strength, consistency, and specificity of effects; dose–response and temporal relationships; biological plausibility and coherence; and alternative MOAs (Sonich-Mullin et al. 2001; Boobis et al. 2006). Kinetic and dynamic factors and no observed adverse effect levels (NOAELs) are also used to evaluate the plausibility of tumorigenic effects relative to potential human exposure and whether or not the MOA events are rodent-specific (Boobis et al. 2006; Cohen et al. 1991, 2004; Cohen and Ellwein 1990).
Select examples of non-genotoxic modes of action for rodent tumor outcomes mediated by either mitogenic or regenerative proliferation.
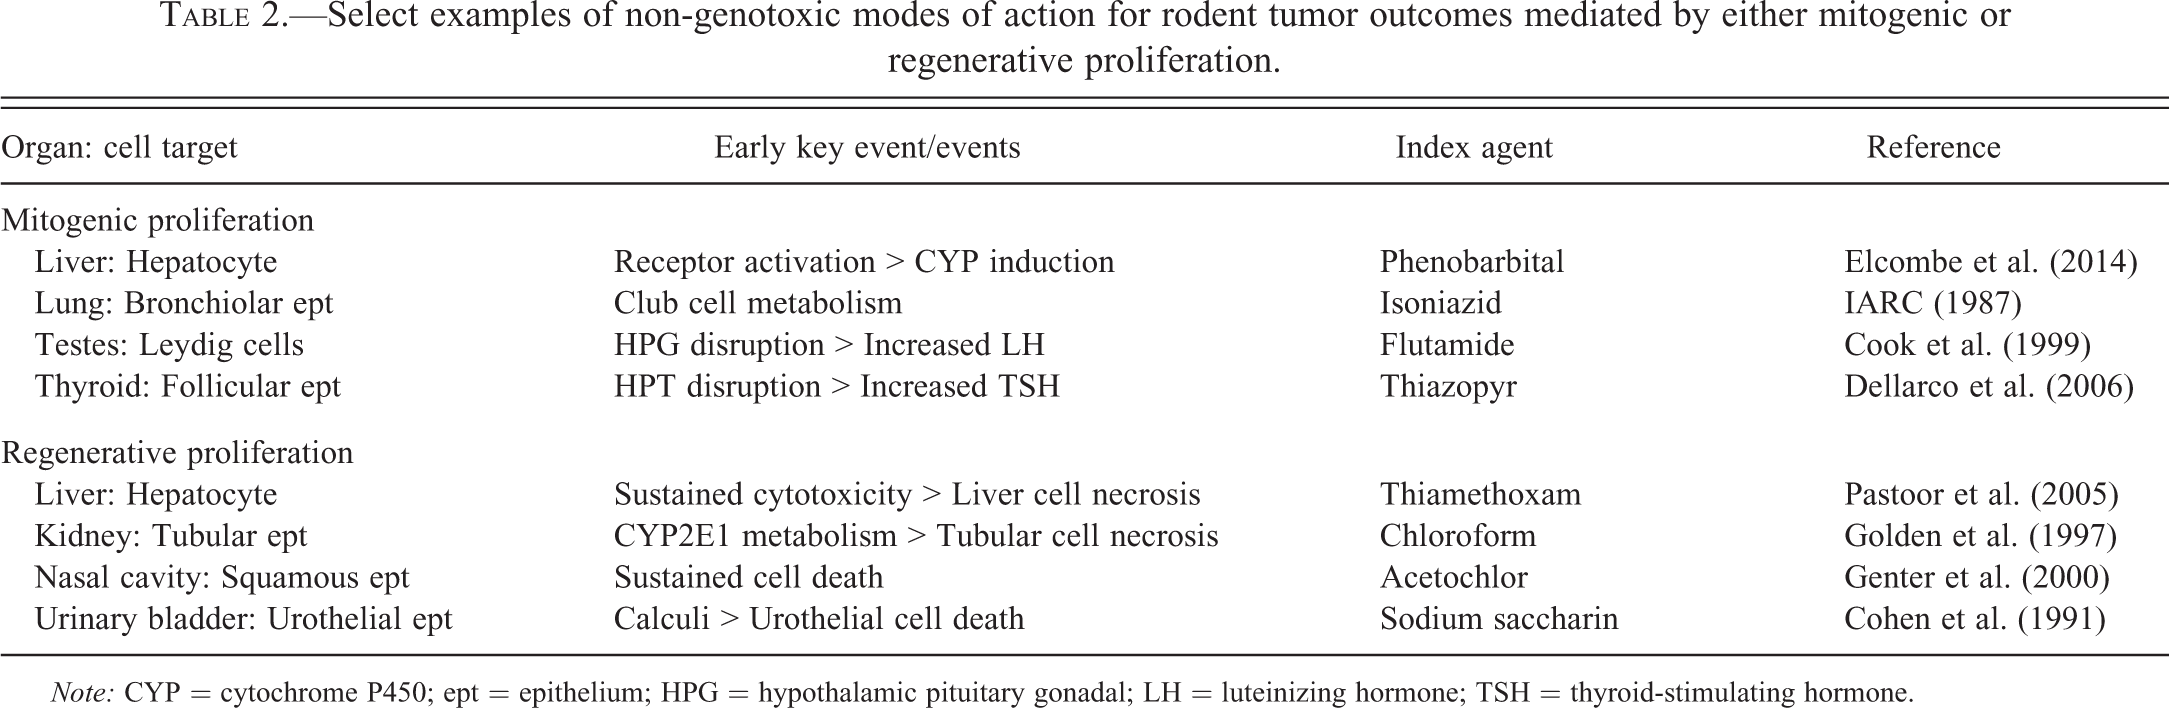
Note: CYP = cytochrome P450; ept = epithelium; HPG = hypothalamic pituitary gonadal; LH = luteinizing hormone; TSH = thyroid-stimulating hormone.
To examine the role of quantitative proliferation data in cancer MOA evaluation, a survey was recently conducted of pesticides previously assessed by the U.S. Environmental Protection Agency (EPA; Lake et al. 2014). The most common tumor site for proposed MOAs was liver. Of the 21 compounds with liver tumor MOAs, 16 had MOAs accepted by the EPA using current guidelines (EPA 2005). Mitogenic MOAs were predominant, and a significant increase in proliferation as measured by BrdU, Ki-67, or PCNA LI was observed at ≤7 days for all but one of these compounds with accepted MOAs. In contrast, short-term effects on proliferation LI were inconclusive or not provided for all unaccepted MOAs. Notably, the percentage of rodent liver tumorigens classified as likely human carcinogens was markedly lower among compounds with an accepted liver tumor MOA compared to those without an accepted MOA.
Proper demonstration of tumorigenic MOAs, and exclusion of alternative MOAs, includes quantitative cell proliferation data in most cases in which there is not a clear diagnosis of hyperplasia on histopathology. For non-genotoxic carcinogens, tumors occur at detectable incidences at the same, and often only at higher, doses than early key events such as proliferation. Establishing the lowest effect levels for these events thus provides a rationale for a biological threshold underlying a particular tumor outcome and a basis for the reference dose or concentration. Even for tumorigens with evidence of genotoxicity, proliferation data may be needed to evaluate alternative non-genotoxic MOAs (Cohen and Ellwein 1990). Following are 2 case examples illustrating how proliferation data have been used to assess MOAs and evaluate human relevance of tumor outcomes in rodent carcinogenicity studies.
Mitogenesis
Mitogenic carcinogens typically operate through hormonal or growth factor receptors. Examples of hormonal mitogens include estrogens in the uterus, thyroid-stimulating hormone (TSH) in thyroid follicular cells, and gonadotropins in the gonads. Nonhormonal mitogens include various endogenous growth factors (e.g., epidermal growth factor, tumor necrosis factor α) and xenobiotic agents that activate receptors such as constitutive androstane receptor (CAR) and PPARs, most prominently in the liver (Holsapple et al. 2006). Disruption of endocrine axes may also lead indirectly to mitogenesis. Common examples here include xenobiotic-induced liver metabolism of thyroid hormones leading to increased TSH and secondary thyrotropism and alteration of the hypothalamic–pituitary–gonadal axis leading to increased luteinizing hormone (LH) release and interstitial cell hyperplasia and neoplasia in the testes.
One of the most widely studied mitogenic rodent carcinogens is phenobarbital (PB), which was identified decades ago as a liver tumor promoter in mice (Elcombe et al. 2014). Activation of CAR has been shown to be the initiating requisite event in the tumorigenic MOA for PB, followed by increased hepatocyte proliferation, preneoplastic foci, and tumors (Holsapple et al. 2006; Elcombe et al. 2014). Pregnane X receptor (PXR) activation, cytochrome P450 enzyme induction, hepatocellular hypertrophy, and increased liver weight are considered to be associative events for CAR activation but not necessarily requisite key events (Elcombe et al. 2014).
Historically, PB has been an important reference agent in establishing the concept that some rodent tumor outcomes have low human health relevance (Elcombe et al. 2014). Epidemiologic data based on decades of PB use as a human pharmaceutical showed no evidence of increased liver tumor risk (IARC 2001), and experimental studies in mice lacking CAR and PXR did not exhibit hypertrophic or proliferative responses to PB (Ross et al. 2010). While the human liver expresses CAR and PXR, receptor activity is markedly lower than in rodents. These findings were supported by studies in mice expressing human CAR/PXR, which showed increased liver weight and enzyme induction without liver cell proliferation (as measured by BrdU LI) in response to PB (Ross et al. 2010). A more recent study further demonstrated that PB-related metabolic effects occurred in human cells in a chimeric mouse model, but without the proliferative effect (Yamada et al. 2014). This lack of proliferation in humanized models helped demonstrate the concepts that increased proliferation is an essential threshold-based event for mitogenic tumorigens and that early key events can be used to evaluate human relevance.
Cytotoxicity
The other major category for non-genotoxic tumorigens is chronic cytotoxicity. Key events in this MOA include necrosis (in rare cases apoptosis) with consequent growth factor signals leading to regenerative cell proliferation. This process is frequently, but not always, associated with inflammation, depending on the extent of the tissue damage. A classic case study of this MOA is sodium saccharin, which was shown in early carcinogenicity studies to induce urinary bladder tumors in rats. Mechanistic studies indicated that these tumors were associated with calcium phosphate-containing microcrystals that formed when high oral consumption of sodium saccharin produced a highly osmolar alkaline environment with high calcium and phosphate and urinary pH >6.5 (specific to the rat; Cohen et al. 1991; IARC 1999a). The crystals induce damage of the superficial urinary bladder epithelial cells leading to chronic regenerative cell proliferation and eventually tumors. Treatments that acidify urine inhibit the crystal formation, urothelial toxicity, cell proliferation, and tumor formation (Ellwein and Cohen 1990; IARC 1999a, 1999b). Crystal formation and bladder epithelial proliferation were not observed in studies of mice or nonhuman primates (Takayama et al. 1998), and no clear evidence of bladder carcinogenicity was demonstrated in human epidemiologic studies (Weihrauch and Diehl 2004; IARC 1999b; Elcock and Morgan 1993). As with the mitogenic example for PB, the tumorigenic effects of sodium saccharin were contingent upon the increase in urothelial cell proliferation observed specifically in rats (Ellwein and Cohen 1990).
Future Applications of Cell Proliferation Data
One of the primary goals of predictive toxicology is to facilitate a transition in safety assessment from traditional histopathology outcomes to more expedient toxicity pathway-based end points (Thomas et al. 2013). The scope of the MOA framework has recently been expanded to incorporate this type of approach and the broad range of data types required (Meek et al. 2014). These ideas have also been integrated recently into the adverse outcome pathway (AOP) construct, which is conceptually similar to an MOA but designed for more prospective or predictive applications (Ankley et al. 2010; OECD 2012). A primary aim of the modified MOA and AOP frameworks is to integrate quantitative data into models that link early events with more chronic health outcomes using probabilistic relationships (Simon et al. 2014). In the future, it is expected that these pathway-based models will have an increasingly prominent role in hazard identification, chemical prioritization for testing, and safety assessment (Thomas et al. 2013).
For cancer risk assessment, this “reverse engineering” approach would involve initial evaluation of more chemicals or drugs in the absence of 2-year rodent bioassay data. Current prospective risk models for cancer can be broadly divided into negative predictive and prioritization categories. The ultimate goal of negative predictive cancer models is not to predict specific tumor outcomes in rodents but to use short-term data to determine whether oncogenicity studies would likely be negative or of little value to human health risk assessment (Sistare et al. 2011; Reddy et al. 2010; Cohen 2004, 2010; Boobis et al. 2006; Meek et al. 2014). This type of evaluation would incorporate various data types, including pharmacological activity, genotoxicity, hormonal effects, subacute histopathological effects, and, in some cases, targeted assays related to cell proliferation (Cohen 2004; Morton, Bourcier, and Alden 2013).
A formal strategy based on this concept was submitted in 2013 as a proposal to change the current International Conference on Harmonization S1 guidance on rodent carcinogenicity testing of pharmaceuticals (FDA 2013). Under the proposed changes, data from non-carcinogenicity studies would be submitted as part of a Cancer Assessment Document (CAD) that would justify whether or not a 2-year rat bioassay would affect the overall human cancer risk assessment of a compound. As outlined, these CADs may include specific mechanistic targets as well as data from emerging technologies and alternative test systems (FDA 2013). This evidence would then be used to explain or predict potential carcinogenic pathways affected by the compound and characterize their potential relevance to human cancer risk. In this negative predictive setting, the main uses of proliferation data would be to clarify a potential risk signal (e.g., increased organ weight) or support an MOA of low concern for human cancer risk.
The second modeling strategy applies mainly to environmental chemicals with limited safety data. In this approach, high-throughput screening assays and other short-term models would be used to identify early molecular events potentially associated with cancer risk. Initial data may come from in vitro assays for nuclear receptor or growth factor receptor activity, structure–activity relationships, in silico and tissue culture models, acute in vivo transcriptomic profiles, and other systems designed to profile large numbers of compounds in a short period of time. This information would be used to categorize biological activity, pathway targets, and dose potency in reference to known tumorigens and non-tumorigens, and computational models would be applied to identify risk signals and inform which compounds require additional testing (Kleinstreuer et al. 2013; Meek et al. 2014; Thomas et al. 2013; Gusenleitner et al. 2014). While not clearly defined, short-term proliferation LI data in this prioritization setting would likely serve as a second-tier functional end point to evaluate a potential risk signal (e.g., receptor activation) and establish a dose response. An initial evaluation of human relevance could then be conducted based on the presence or absence of these earlier key events.
A central premise for these prospective strategies is that protecting against requisite early key events in carcinogenesis will protect against the tumor outcome itself. Consider, for example, an agent that has structural alerts and transcriptomic signals for thyroid activity. A short-term rat study shows increased hypertrophy and proliferation LI of follicular epithelial cells, and follow-up evidence indicates inhibition of iodide pump activity, decreased thyroid hormone synthesis, and increased TSH release from the pituitary gland. If no genotoxicity concerns are present, then reference dose estimates would likely be based on these short-term thyroid effects, regardless of whether a thyroid tumor outcome was later observed in a 2-year rat carcinogenicity study. A similar scenario could be constructed for other rodent tumor outcomes with established MOAs/AOPs. In many of these cases, proliferation LIs could serve as the functional end point for dose response estimates, as in traditional MOA evaluations.
There are a number of important issues that need to be addressed to increase the usefulness of these prospective models (Tice et al. 2013). Perhaps the most critical challenge is establishing when an early molecular signal is specific to an adverse biological effect (Simon et al. 2014). For proliferation, many screening assay or genomic signals may not necessarily lead to increased LI, and many responses in LI may not necessarily lead to cancer. Proliferation by itself does not imply carcinogenesis risk and in many cases may represent an expected physiologic or therapeutic response for some targeted pharmaceuticals (e.g., induction of erythroid hyperplasia in bone marrow by erythropoietin-stimulating therapies for anemia). Future models of cancer risk assessment will need to reconcile this balanced accuracy issue, providing adequate sensitivity while still discriminating adverse signals from incidental or adaptive ones. In the near term at least, this will require better integration of data from higher throughput systems, short-term functional end points like proliferation, and traditional morphologic outcomes.
Summary and Conclusions
Cell proliferation data play an important role in the evaluation of tumor outcomes observed in carcinogenicity studies. This application is based on extensive evidence indicating that increased proliferation LIs represent a necessary precursor event for most non-genotoxic carcinogens. Dose thresholds based on LIs (or associated changes) thus provide a way to assess and protect against cancer risk from chemical exposures. The proper interpretation of LI data and use in risk assessment requires an understanding of the different markers, technical variables, and analytical methods. In this article, we have reviewed many of these issues and highlighted considerations for better design of targeted proliferation studies.
As toxicological science moves to more predictive approaches, new roles will emerge for proliferation data as short-term quantitative and functional end points. Future modeling work in this area will enable more accurate risk predictions of carcinogenicity based on short-term bioactivity profiles and better define conditions in which rodent carcinogenicity studies add value to human cancer risk assessment. These efforts should benefit from improved standardization of proliferation LI methods across laboratories, more efficient tools for measuring proliferation LIs, and more explicit criteria for discerning true positive risk signals.
Footnotes
Acknowledgments
We would like to thank reviewers from the Scientific and Regulatory Policy Committee (SRPC) and U.S. EPA for their critical comments on this manuscript and Alan Tennant for imaging support.
Author Contribution
Authors contributed to conception or design (CW, RH, RS, DJ, TN, MO, SC); data acquisition, analysis, or interpretation (CW, SC); drafting the manuscript (CW, RH, RS, SC); and critically revising the manuscript (CW, DJ, TN, MO, SC). All authors gave final approval and agreed to be accountable for all aspects of work in ensuring that questions relating to the accuracy or integrity of any part of the work are appropriately investigated and resolved.
The author(s) declared no potential conflicts of interest with respect to the research, authorship, and/or publication of this article.
The author(s) received no financial support for the research, authorship, and/or publication of this article.
*
This article is a product of a Society of Toxicologic Pathology (STP) Working Group and has been reviewed and approved by the SRPC of the Society. This article does not represent a formal best practice recommendation of the Society but provides key points to consider in designing or interpreting data from regulated safety studies. This article has also been reviewed by the U.S. Environmental Protection Agency (EPA) and approved for publication. Approval does not signify that the contents reflect the views of the agency, and mention of trade names or commercial products does not constitute endorsement or recommendation for use.
Abbreviations
References
Supplementary Material
Please find the following supplemental material available below.
For Open Access articles published under a Creative Commons License, all supplemental material carries the same license as the article it is associated with.
For non-Open Access articles published, all supplemental material carries a non-exclusive license, and permission requests for re-use of supplemental material or any part of supplemental material shall be sent directly to the copyright owner as specified in the copyright notice associated with the article.