
Abstract
In nonclinical toxicity studies, stage-aware evaluation is often expected to assess drug-induced testicular toxicity. Although stage-aware evaluation does not require identification of specific stages, it is important to understand microscopic features of spermatogenic staging. Staging of the spermatogenic cycle in dogs is a challenging and time-consuming process. In this study, we first defined morphologic features for the eight spermatogenic stages in standard histology sections (H&E slides) of dog testes. For image analysis, we defined the key morphologic features of five stages/pooled stage groups (I-II, III-IV, V, VI-VII, and VIII). These criteria were used to develop a deep learning (DL) algorithm for staging of the spermatogenic cycle of control dog testes using whole slide images. In addition, a DL-based nucleus segmentation model was trained to detect and quantify the number of different germ cells, including spermatogonia, spermatocytes, and spermatids. Identification of spermatogenic stages and quantification of germ cell populations were successfully automated by the DL models. Combining these two algorithms provided color-coding visual spermatogenic staging and quantitative information on germ cell populations at specific stages that would facilitate the stage-aware evaluation and detection of changes in germ cell populations in nonclinical toxicity studies.
Introduction
The cyclic process of spermatogenic cell development in seminiferous tubules of testes can be divided into multiple stages. 1 Perturbations in the continuous and cyclic process of spermatogenesis can result in a decrease or abruption of sperm production and possibly infertility. 2 Microscopic examination of the testes is considered the most sensitive method to assess testicular toxicity due to the lack of sensitive and reliable biomarkers. Stage-aware examination of testes has been recommended by the Society of Toxicologic Pathology. 3 Identification of specific stage is not required for stage-aware evaluation, 4 but spermatogenesis is a complex process, and it is challenging to understand morphologic features of dynamic spermatogenic changes. Histological assessment of testicular toxicity requires training and experience to understand stage-appropriate germ cell populations since germ cell degeneration or necrosis can be subtle and stage-specific without obvious inflammatory responses. Furthermore, physiological changes and spontaneous lesions in germ cell populations make it difficult to identify drug-induced changes in germ cell populations. 5 An increase in the sensitivity of testicular assessment can be achieved by stage-aware microscopic evaluation as drug-induced toxicity may be seen in selective populations and types of germ cells in specific stages of seminiferous tubules. 4 In addition, spermatogenic staging and identification of germ cell types are important to elucidate underlying mechanisms of toxicity.
Spermatogenic staging is a challenging and tedious process. This is particularly true for identification of specific spermatogenic stages in dogs due to the greater morphological variability of spermatogenesis and the lack of information on practical canine spermatogenic staging on hematoxylin and eosin (H&E) sections as compared with rodents. Dogs can be more sensitive to some compounds in comparison with other species.6-8 Identification of drug-induced effects on spermatogenesis in the dog testis may be confounded by variable sexual maturity and a high incidence of spontaneous lesions at ages often used in regulatory toxicity studies. 9 Publications on dog spermatogenic staging such as Russell et al. 1 and Soares et al. 10 might not be relevant for evaluating H&E slides because their staging criteria were based on observations by thin plastic sections or electron microscopy, which are not readily available in a standard toxicity study. Here, we provide some practical insight on spermatogenic staging for standard H&E sections in regulatory toxicology studies.
In nonclinical toxicology studies, stage-aware evaluation is currently performed by the study pathologist. Automation facilitates the potentially burdensome and specialized task of stage-aware evaluation of the testes by analyzing stage-specific germ cell quantifications of treated groups against control groups. In addition, it could allow for the detection of slight perturbations in spermatogenesis that might not be apparent with a qualitative assessment alone. Automated quantification of germ cells is objective and useful information for pathologists to confirm their interpretations. With the recent advancements in digital and computational pathology, deep learning (DL)-based image analysis algorithms have been applied to toxicologic pathology data sets. 11 Automated spermatogenic staging has been recently published in mice 12 and rats. 13 However, automation in staging assessment has not been reported for dog spermatogenesis. This may be attributable to the little available information about the practical dog testicular staging and the complexity of staging with less synchronized spermatogenesis as compared with rodent spermatogenesis.
In this study, we have defined the morphologic features associated with different spermatogenic stages in H&E sections of beagle dogs and established modified staging criteria by grouping the eight stages into five staging groups based on morphological similarities that are practical and sufficient to enable DL-based image analysis. To our knowledge, this is the first report of automated testicular staging in control dogs that includes a DL-based nuclear segmentation model for the detection and quantification of germ cells in each stage. By limiting input to the seminiferous tubules at a specific stage, stage-wise germ cell counts can be provided. Also, color-coding seminiferous tubules based on their stages and types of germ cells using DL models can facilitate stage-aware evaluations in toxicity studies.
Materials and Methods
Animals
Purebred beagle dogs (n = 8) were provided by Marshall BioResources USA Inc (North Rose, New York), and they were at least 9 months old at the time of euthanasia. All dogs were sexually mature based on testicular morphology and used as vehicle controls in two unrelated toxicity studies. Animal welfare for this study was in compliance with the USDA Animal Welfare Act. The Guide for the Care and Use of Laboratory Animals, Institute of Laboratory Animal Resources, National Academy Press, Washington, DC was followed. All procedures were approved by AbbVie’s Institutional Animal Care and Use Committee and carried out in American Association for Accreditation of Laboratory Animal Care–accredited facilities.
Histology Slide Preparation and Digitization
Testes from control beagle dogs were fixed in modified Davidson’s fixative overnight. Testes were rinsed (15 minutes) in running tap water and transferred to 10% neutral-buffered formalin. Cross and longitudinal sections were submitted for routine overnight tissue processing. Following processing, the tissues were embedded into paraffin blocks and sectioned at 5 microns. Hematoxylin and eosin staining was completed by an automated stainer. Quality control was conducted by a histotechnician on the glass slides prior to the release for analysis. Digital pathology images were obtained via the 3DHISTECH Pannoramic P250 brightfield slide scanner (Budapest, Hungary). The whole slide images (WSIs) were scanned at 40X magnification. The data consisted of only control testes with low grades of common spontaneous background findings such as hypoplastic tubules or degeneration (DL model performance in background findings is in the “Results” section). The annotation peripherals were a Wacom tablet (Cintiq pro 24″) and a Dell 75″ 4K Interactive Touch Monitor.
In this study, a total of 16 WSIs from eight dogs (right cross-sections and left longitudinal sections of the testes) were used. Four WSIs (approximately 700 seminiferous tubules, 7.7 × 108 µm2 total tubular area) were annotated by a veterinary pathologist (T.K.) for model development. The veterinary pathologist (T.K.) is board-certified and experienced in toxicologic pathology, including preclinical testicular evaluations. The annotated tubules were divided into three separate data sets (training, validation, and test). Considerations in splitting the database into training, validation, and test data set can be found in the litrature.11,14 The validation data set was used to select the best architecture and fine-tune the DL model parameters, such as training magnification, learning rate, and input size. The validation data set was added to the training data set once we finalized the DL model parameters, and the final model was fine-tuned with the larger training data set. Evaluation of the final model was performed on the test data set, and all the performance metrics were provided using the test data set, which was not involved in training at any point. The rest of the WSIs (12 WSIs) were not rigorously annotated but visually confirmed by a veterinary pathologist (T.K.) as acceptable. These additional WSIs were not part of model development and validation, and they were only used for calculating stage frequency and stage-specific germ cell counts by averaging more than six animals with both right and left testes. This approach ensured that the provided quantifications have considered the variabilities between animals and between right and left testes.
Image Analysis Approach
The first task was to define simple and practical staging criteria that can be utilized for annotating stages on H&E sections (Figure 1). The white space (non-tissue) region was excluded from the region of interest (ROI) by a thresholding-based classification method in Visiopharm called “detect region of interest.” This method was followed by two postprocessing steps: “filling the holes” in the tissue label and “outline as ROI.”
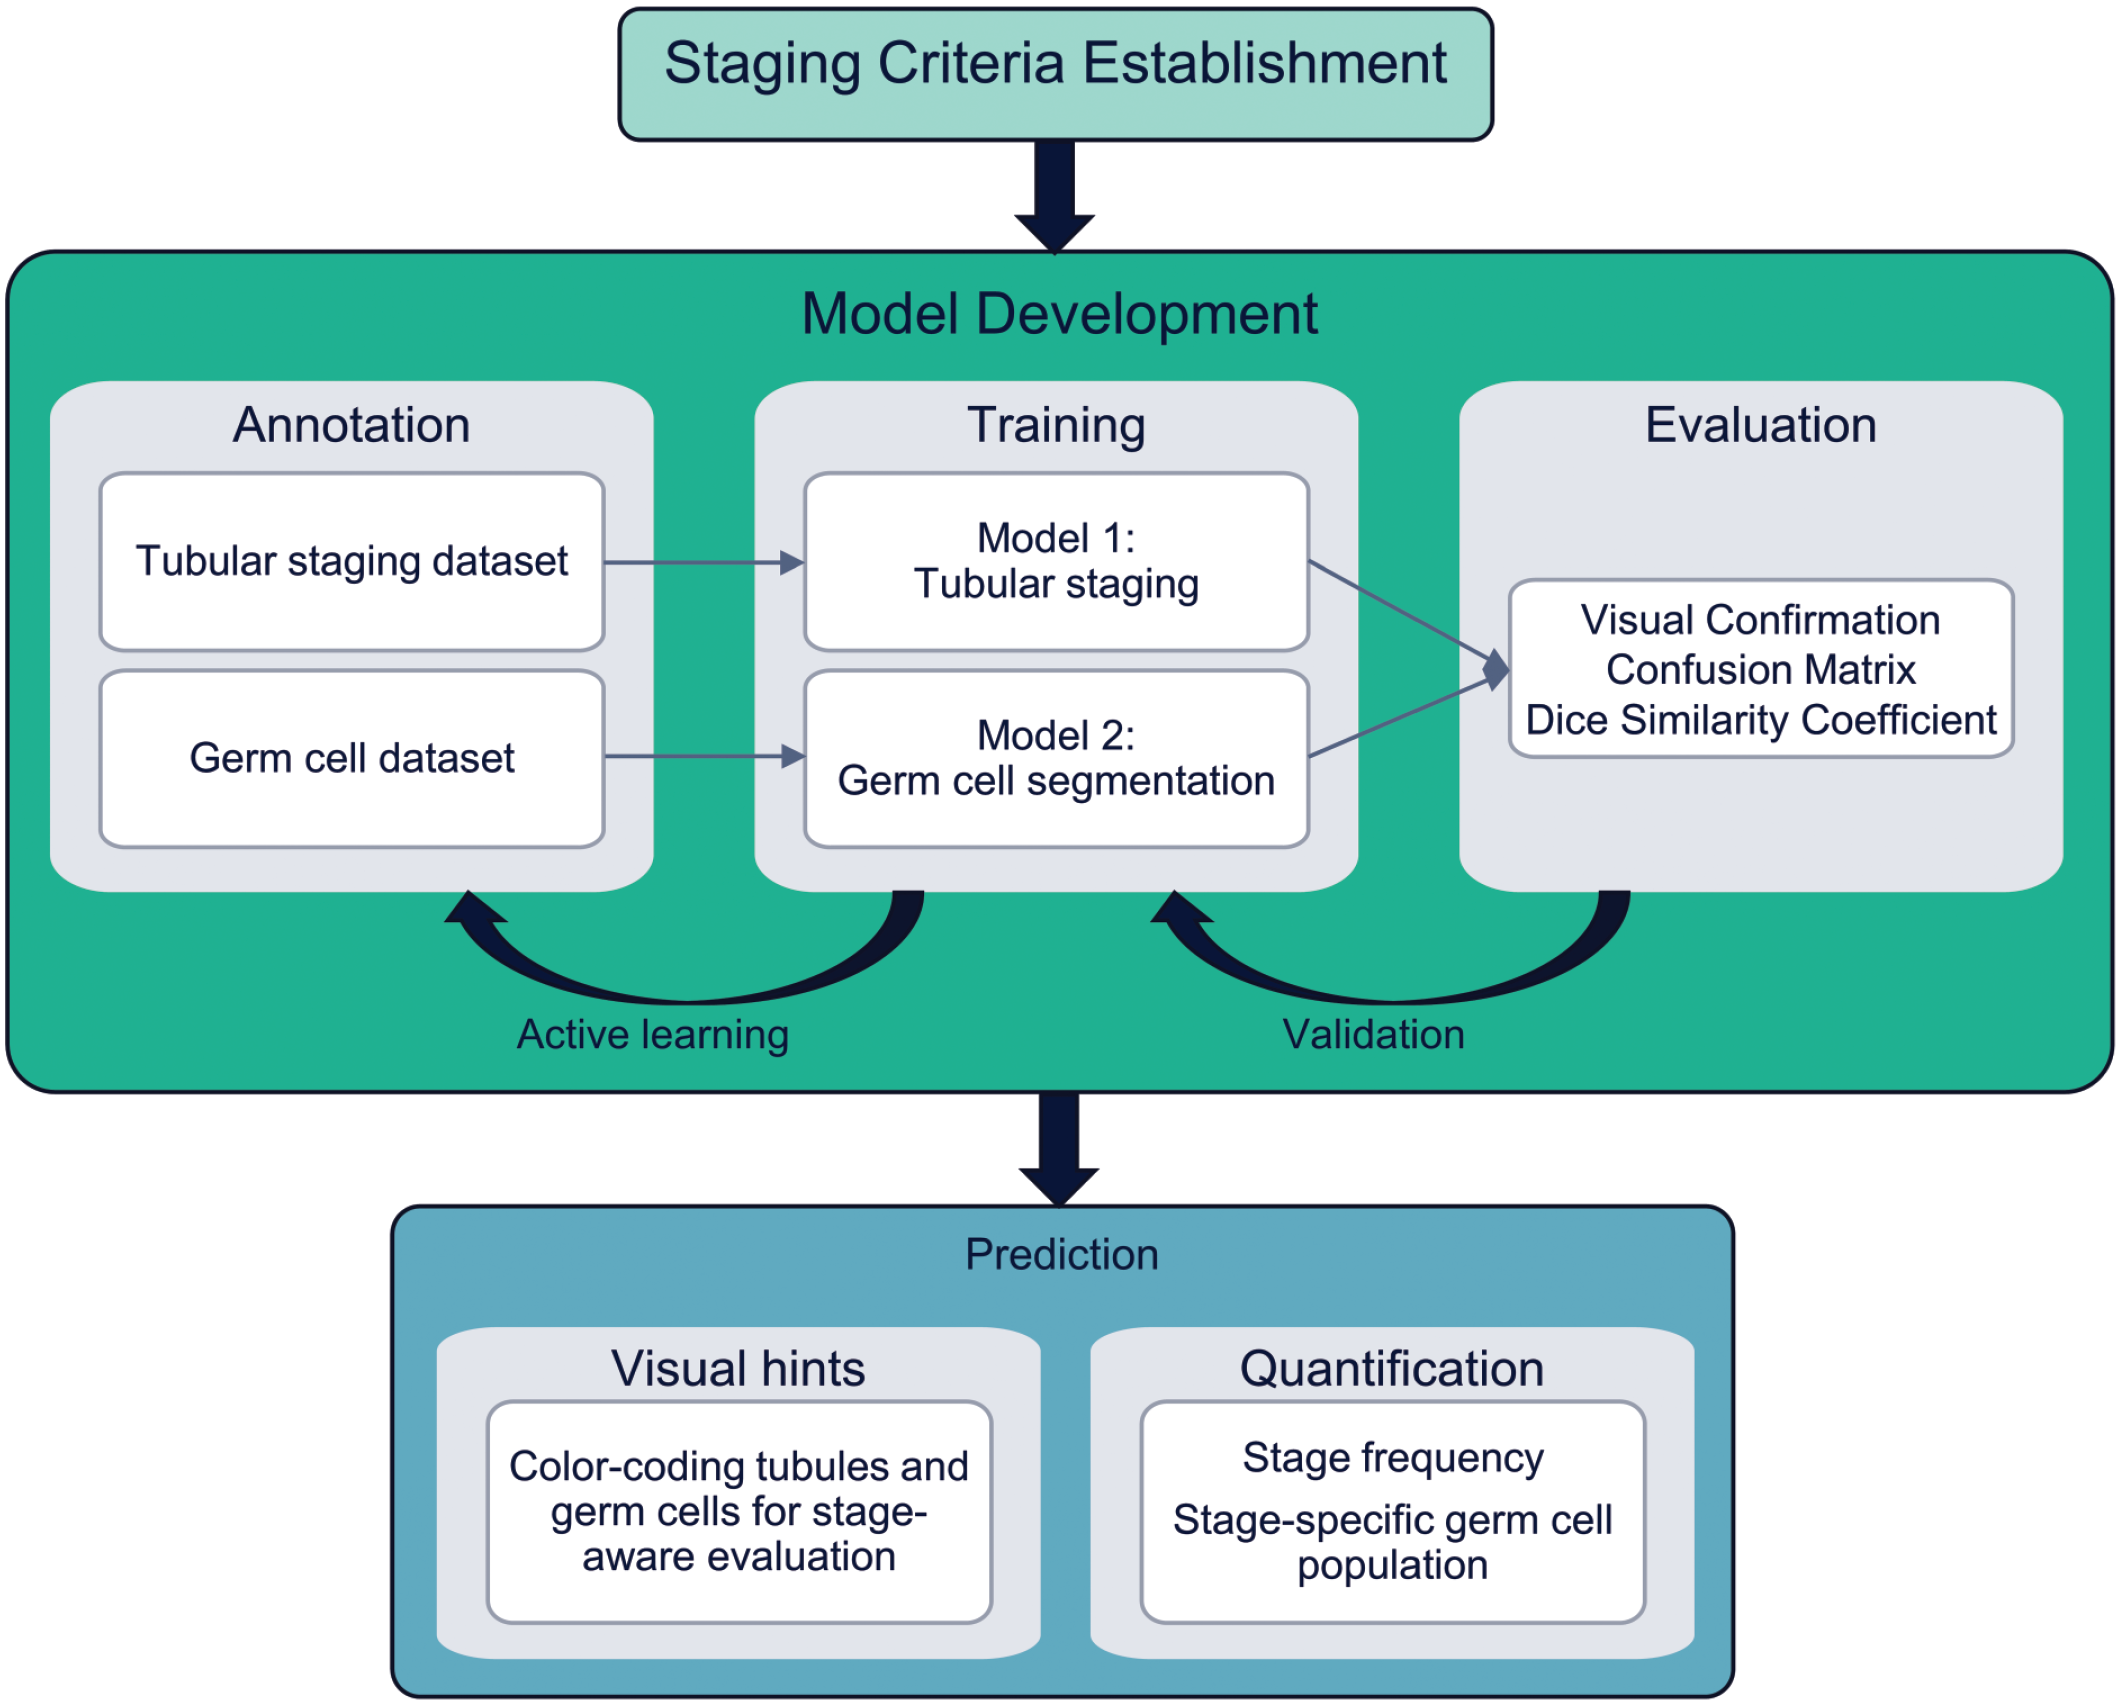
Overview of the entire process used in this study to develop the models. The workflow had three main steps: (1) staging criteria establishment, (2) model development, and (3) model predictions. The established criteria were used to annotate the data sets for tubular staging and germ cells. During model training, an active learning approach was used to query the pathologist to annotate new training data set. The process is iterated to find the model with the best performance evaluated using the validation data set. The model predictions were used to provide visualized spermatogenic staging and quantification of the germ cell populations.
Two DL models were developed and used to predict the tubule stage (model 1) and germ cell identity (model 2). Active learning is an iterative approach that interactively queries the subject matter expert for correcting the segmentation on new training images. Using active learning, the DL models were trained on the least amount of data possible (less annotation time) while maximizing their performance. 15 The models were validated by visual confirmation (T.K.) and objective evaluation as via confusion matrix. Combining the developed staging model and the germ cell segmentation count provided quantifications and visual staging information for pathologists to facilitate and enhance stage-aware evaluation. Steps of the image analysis approach are outlined below. More details on staging criteria for classifying the spermatogenic cycle are provided in the “Results” section.
Annotation
Two data sets were annotated: the tubular staging data set and the germ cell data set. Active learning was initiated by training the DL model with a small amount of hand-annotated data (about 100 tubules). The predicted labels using the preliminary model were then refined by the pathologist (T.K.), and the newly refined annotations were added to the training data set. The new training data set was then used to fine-tune (re-train) the model. This approach was iterated until the performance of the algorithm in the validation data set was not improving by increasing the amount of training data. With the active learning approach and data augmentation (details in the following section), the least amount of data were annotated for developing the DL models with the highest accuracy achievable.
The staging data set for developing model 1 contained around 4700 seminiferous tubules, annotated by a veterinary pathologist (T.K.) using an active learning approach, as described above. Approximately 2700 tubules (3.5 × 108 µm2), 1000 tubules (1.9 × 108 µm2), and 1000 tubules (2.2 × 108 µm2) were used for training, validation, and test, respectively. Tubules were annotated as stages/pooled group stages (I-II, III-IV, V, VI-VII, and VIII). Details on staging criteria are presented in the “Results” section. The nontubular area (including Leydig cells, other cellular components, connective tissue, vessels, and tunica albuginea) was assigned to exclusion class for training. The ground truth for developing model 2 marked the selective germ cells (spermatogonia/preleptotene spermatocytes [SG/PL]), spermatocytes excluding preleptotene spermatocytes [SP], meiotic figures, round spermatids, and elongated spermatids), and it was performed on portions of three WSIs (157 seminiferous tubules with different stages, 2.6 × 107 µm2 tubular area with 134,611 germ cells). For training, validation, and test, 61,012, 33,078, and 40,520 annotated germ cells were used, respectively. Details on the morphologic features of germ cells are provided in the “Results” sections. The active learning approach was also used for germ cell annotation, and other non-germ cell components such as Sertoli cells, tubular lumen, and residual bodies were marked as background for training. Only the tubular area was assigned to the ROI, and the nontubular area, including the interstitium, was excluded from the ROI by model 1.
Training the models
All model development steps (including annotation, training, postprocessing, evaluations, and quantifications) were performed using Visiopharm, version 2020.09. The detailed specifications of the developed DL model are summarized in Table 1. The specifications (e.g., architectures, magnifications, tile size, and other DL model parameters) were chosen based on the accuracy of the classifiers on the validation data set. The DL models were trained on NVIDIA Quadro P6000 with 24 GB of memory.
Tabulated model specifications for implementation in Visiopharm.
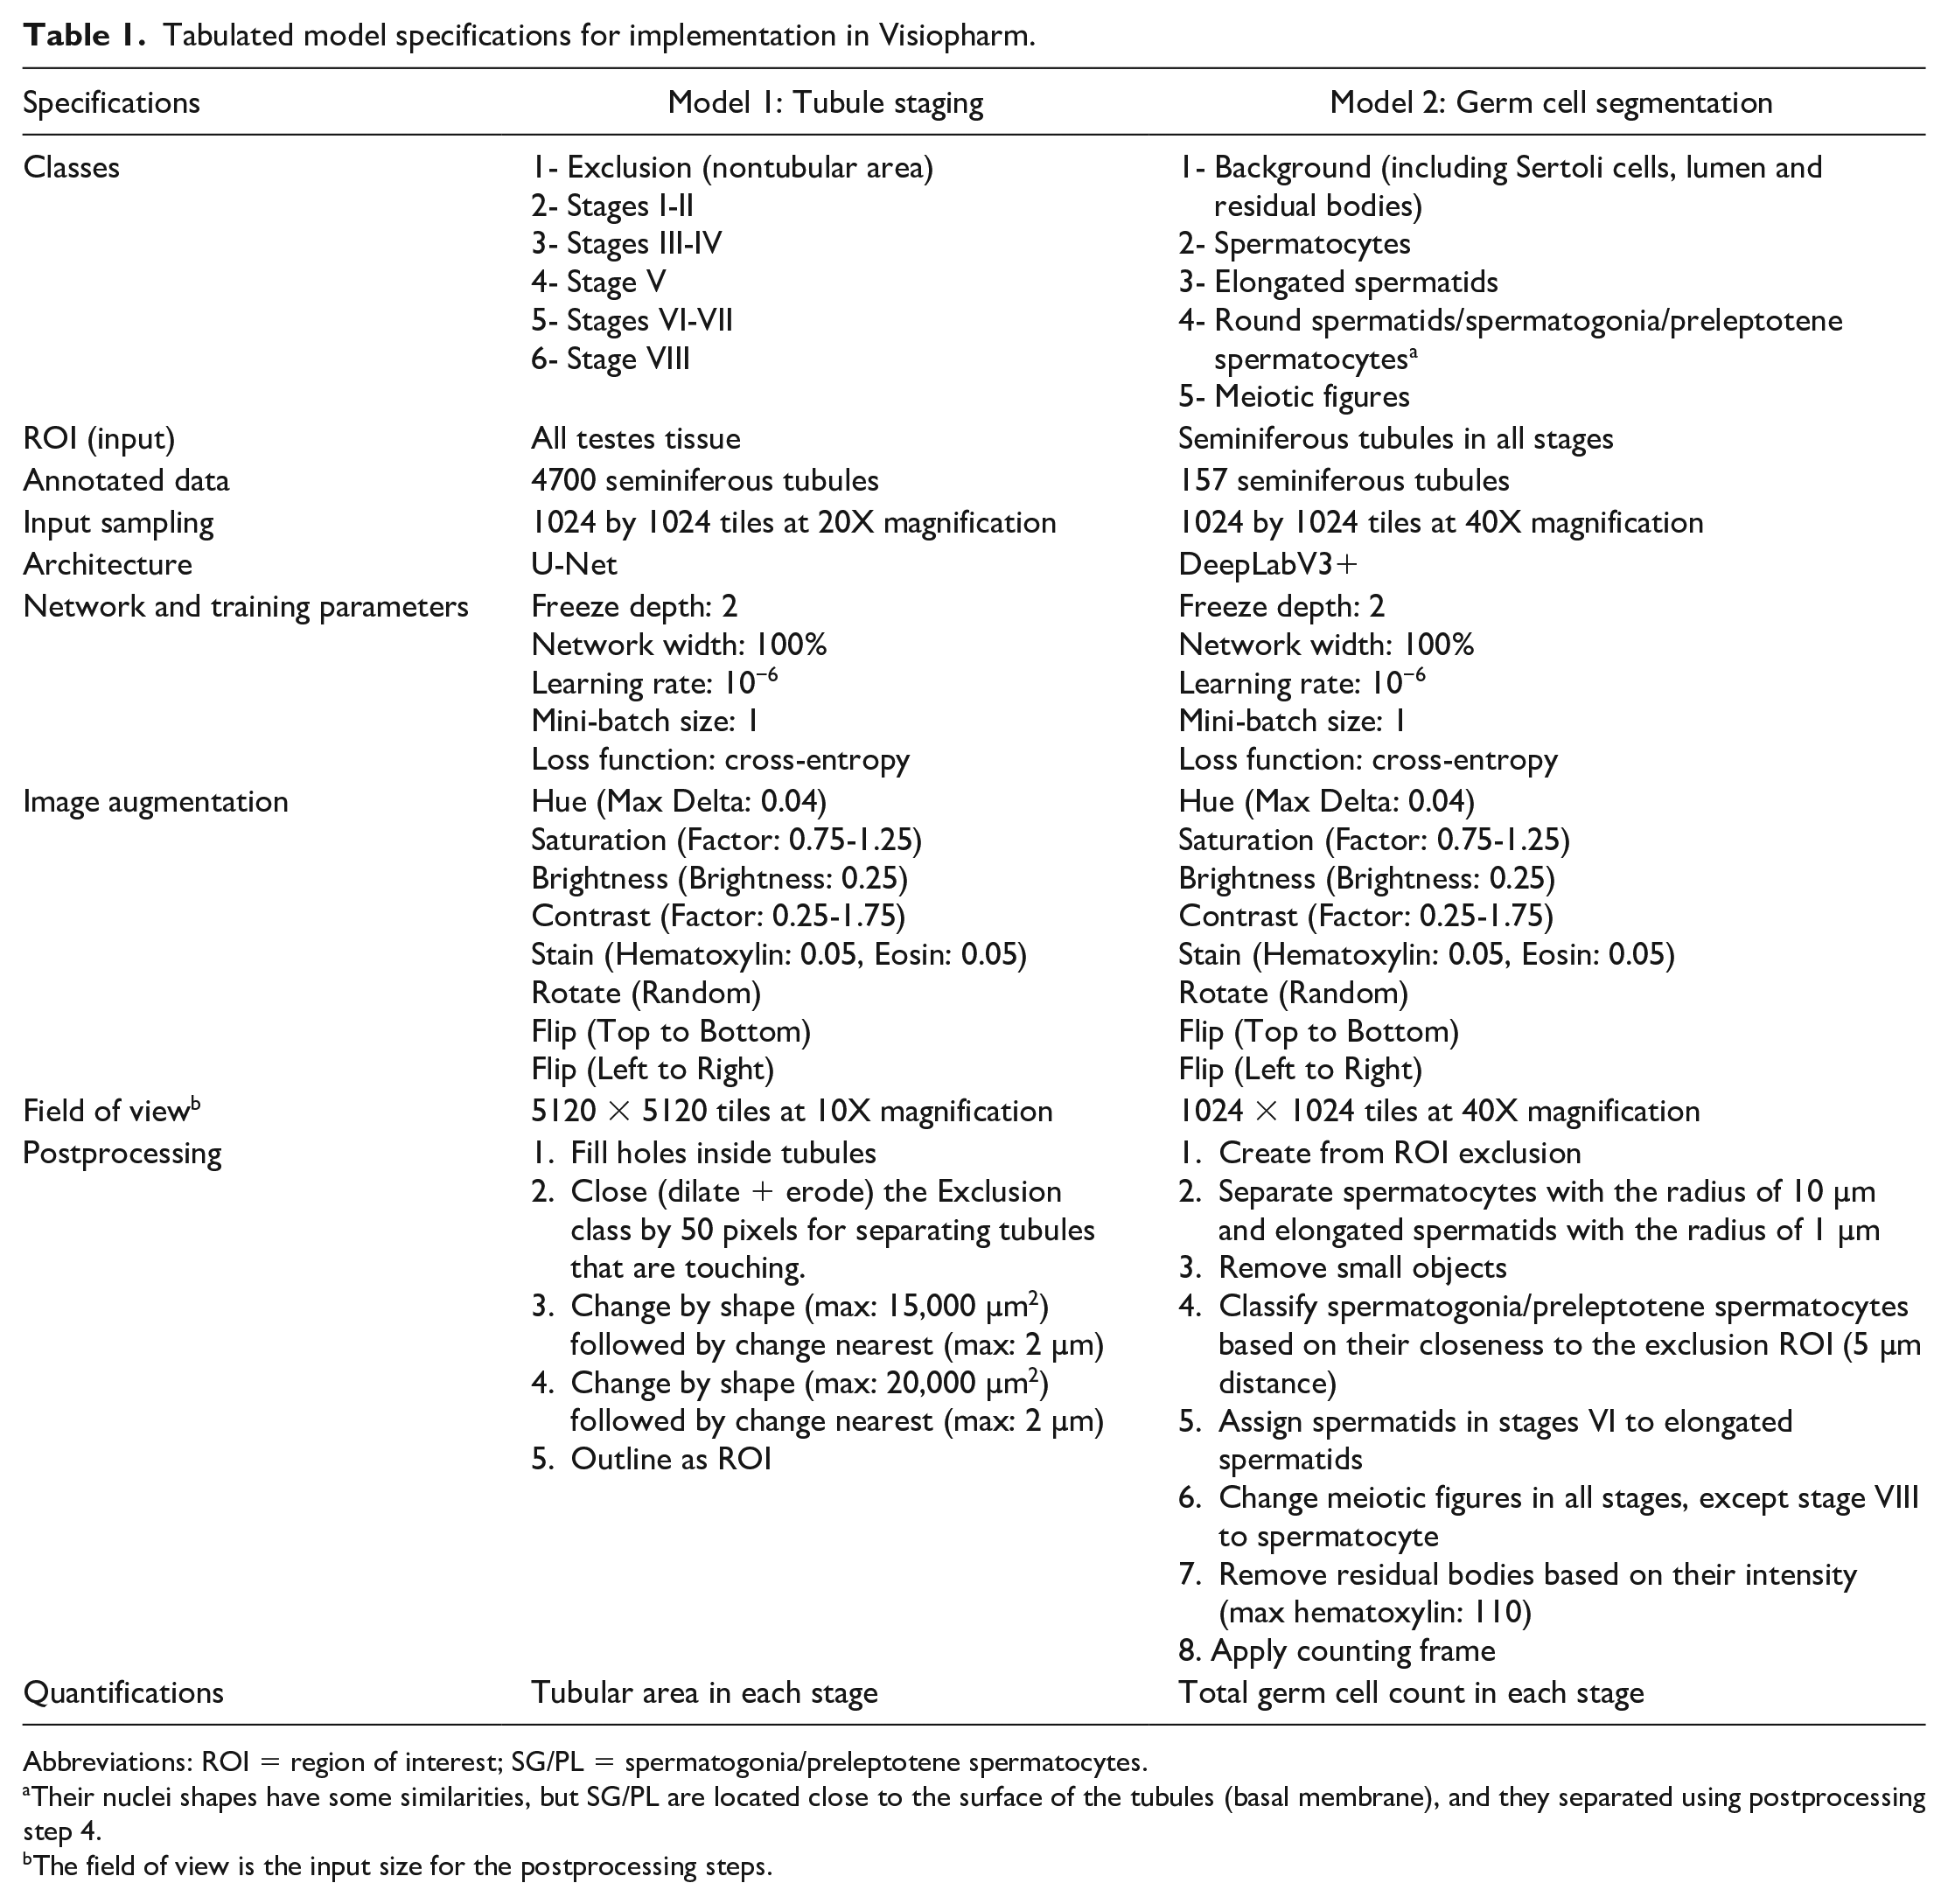
Abbreviations: ROI = region of interest; SG/PL = spermatogonia/preleptotene spermatocytes.
Their nuclei shapes have some similarities, but SG/PL are located close to the surface of the tubules (basal membrane), and they separated using postprocessing step 4.
The field of view is the input size for the postprocessing steps.
For training model 1, a multiclass segmentation model using U-Net architecture 16 was used to define the exact boundary of tubules and classify their stage simultaneously. The input WSI was sampled at 1024 × 1024 tiles at 20X magnification for three channels of RGB (red, green, and blue). For the network parameters, freeze depth was set at 2 (i.e., two of the building blocks in the encoder were frozen), and 100% of network width was used during training. The learning rate was set at 10−6, the mini-batch size was 1, and the loss function was cross-entropy. Geometrical, color image augmentation methods were used (Table 1). The loss for the final model 1 was 0.381 with 500K training iterations. More information about the image analysis/DL terms and concepts used throughout this article and Table 1 can be found in the literature. 14
Model 2 was also a multiclass segmentation model that detects the nuclear boundary and types of germ cells. This model used a DeepLabV3+ architecture. 17 During annotation and training, the SG/PL were grouped with round spermatids due to their comparable round shape and size of nuclei. However, they were distinguished during postprocessing due to their distinct location. The SG/PL are closer to the basal membrane in tubules (see details in the following postprocessing section). Therefore, the final output of model 2 had six classes: background, SG/PL, SP, meiotic figures, round spermatids, and elongated spermatids. The input tiles were sampled at 40X magnification for this model. The rest of the DL model parameters (input sampling, network parameters, training parameters, and data augmentation) for model 2 were the same as model 1. The loss for the final model 2 was 0.016 with 65K training iterations.
Model 1 and model 2 were running in series, that is, the output of model 1 (tubules with different stages) was the input ROI for model 2. During annotation and training of model 2, the tubular areas, regardless of their stage, were used as the ROI. The postprocessing steps have been provided in the Appendix.
Evaluation
Model performance was evaluated using the test data set. Model-generated staging labels were reviewed by the pathologist, and the discrepancies were noted and corrected as separate annotations (ground truth). The ground truth (the pathologist-generated annotations) was then compared with the prediction (automated staging generated by the model) using a confusion matrix. We refer readers to the literature for more detailed information on different performance evaluation methods used in biomedical image analysis.11,18 In short, the confusion matrix is a table for performance evaluation, in which the higher the number in the main diagonal, the higher the performance of the model. Various performance metrics (e.g., sensitivity, precision, and accuracy) can also be generated from the confusion matrix. For ease of reading and understanding of the confusion matrix, in each column, the numbers were normalized to the total ground truth at their class (sum of the column); thus, the confusion matrix presented in this study was based on sensitivity. The most common metrics to evaluate the performance of a segmentation model are sensitivity, precision, dice similarity coefficient (DSC), also known as the F1 score. These metrics can be calculated as follows:
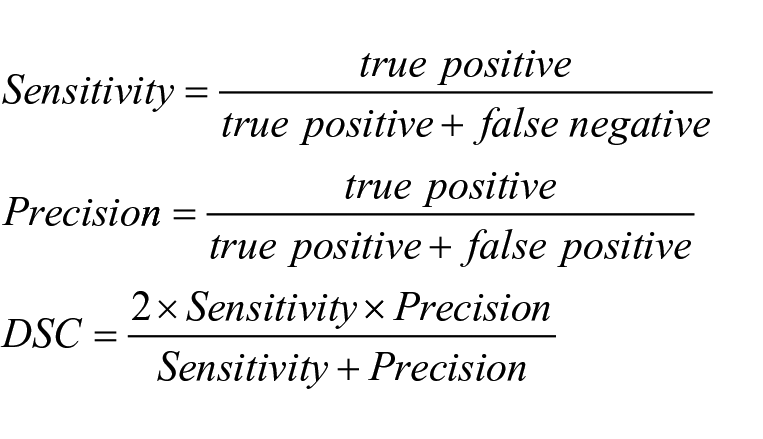
Ground truth is the area/count of pathologist-generated annotations (true positive + false negative), while prediction is the area/count of model-generated annotations (true positive + false positive). True positive marks the overlap between ground truth and prediction. For interpretation of these metrics, given a specific stage A, a high sensitivity score for stage A means that there were low false negatives (tubules from stage A that were not labeled correctly), and a high precision means that there were low false positives (tubules from other stages that were incorrectly labeled as belonging to stage A). DSC accounts for both false positives and false negatives. The performance of the model in the exclusion class of the staging model (model 1) and background class of the germ cell detection model (model 2) was not of our interest, and the high DSC in these classes was not included in the overall DSC calculations. It should also be noted that for the germ cell segmentation task, the counts were more important than the area of individual cells. Therefore, the confusion matrix, sensitivity, precision, and DSC were calculated based on cell counts.
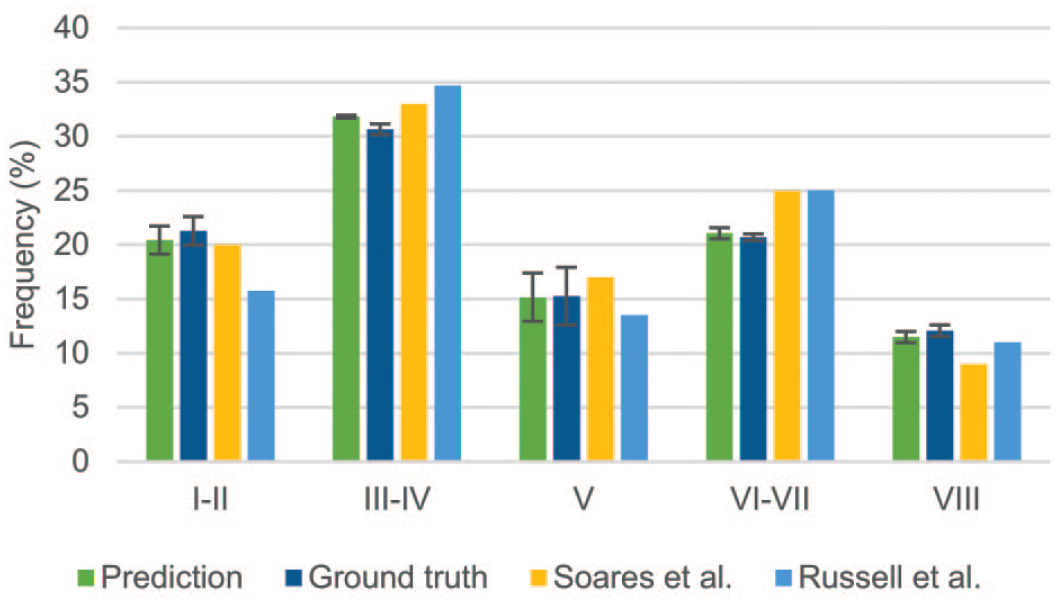
Stage frequency was another metric that we used to identify any major discrepancies in a particular stage between the tubular staging results of the model and ground truth. The stage frequency map was generated by calculating the percentage of tubules in each stage. We used the area of each stage to calculate the frequency rather than tubule count because in dog testes WSIs, (1) the tubular area varies significantly between tubules and (2) multistage tubules induce error in tubule counts. The stage frequency of the model was compared with the ground truth and the expected stage frequency derived from Russell et al. 1 and Soares et al. 10
Results
Spermatogenic Staging in H&E Sections of Dog Testes
Representative photomicrographs of tubules in each stage are illustrated in Figure 2. Figure 3 shows the presence of various germ cell types in different stages of spermatogenic cycle. The timing of germ cell differentiation was not completely synchronized, and some germ cell types may be seen at different stages than the one specified in Figure 3. The following selected key morphologic features and types of germ cells were identified to determine the stages.
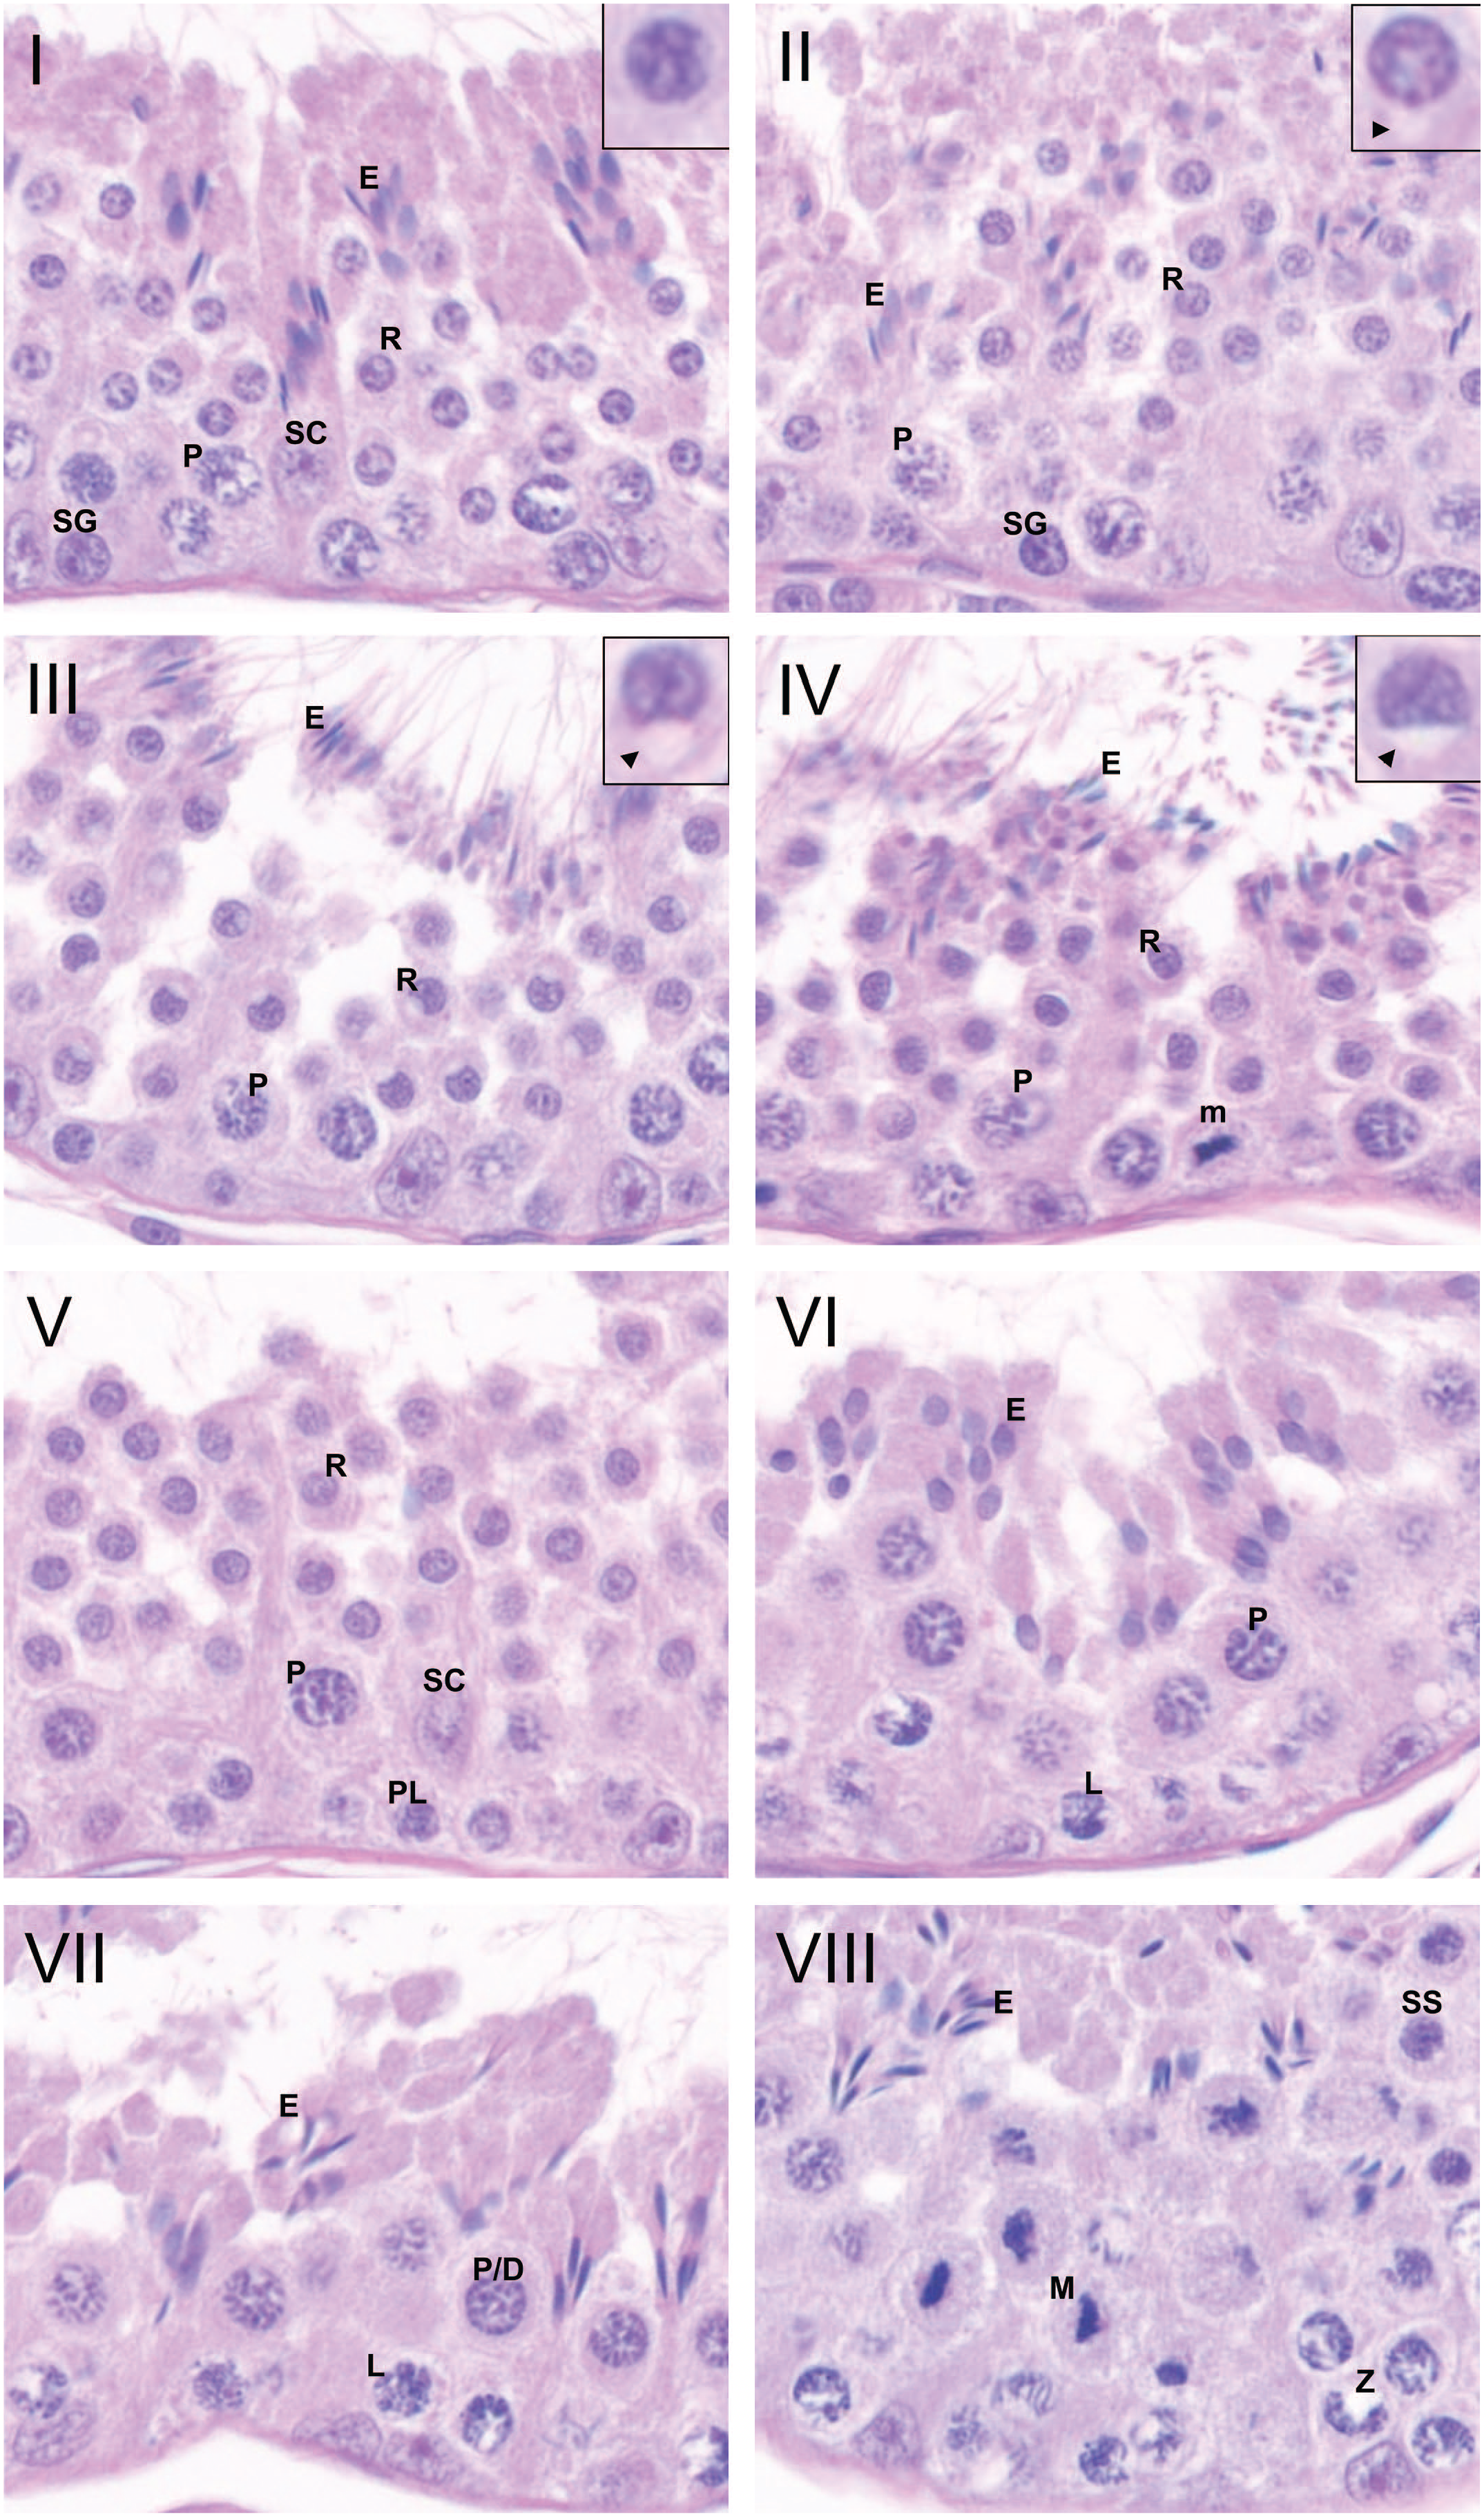
Spermatogenic stages of dog testis. Eight stages I-VIII and different germ cell types were shown: round spermatid (R), elongated spermatid (E), mitosis (m), preleptotene spermatocyte (PL), leptotene spermatocyte (L), zygotene spermatocyte (Z), pachytene spermatocyte (P), pachytene/diplotene spermatocyte (P/D), meiotic figure (m), secondary spermatocyte (SS), spermatogonia (SG), and Sertoli cell (SC). Inserts at high magnification are round spermatids with acrosome as a small unstained vesicle (arrowhead) in stages II, III, and IV. No acrosome was seen in stage I. For image analysis, stages I and II, stages III and IV, and stages VI and VII are grouped due to their morphological similarity of spermatids.
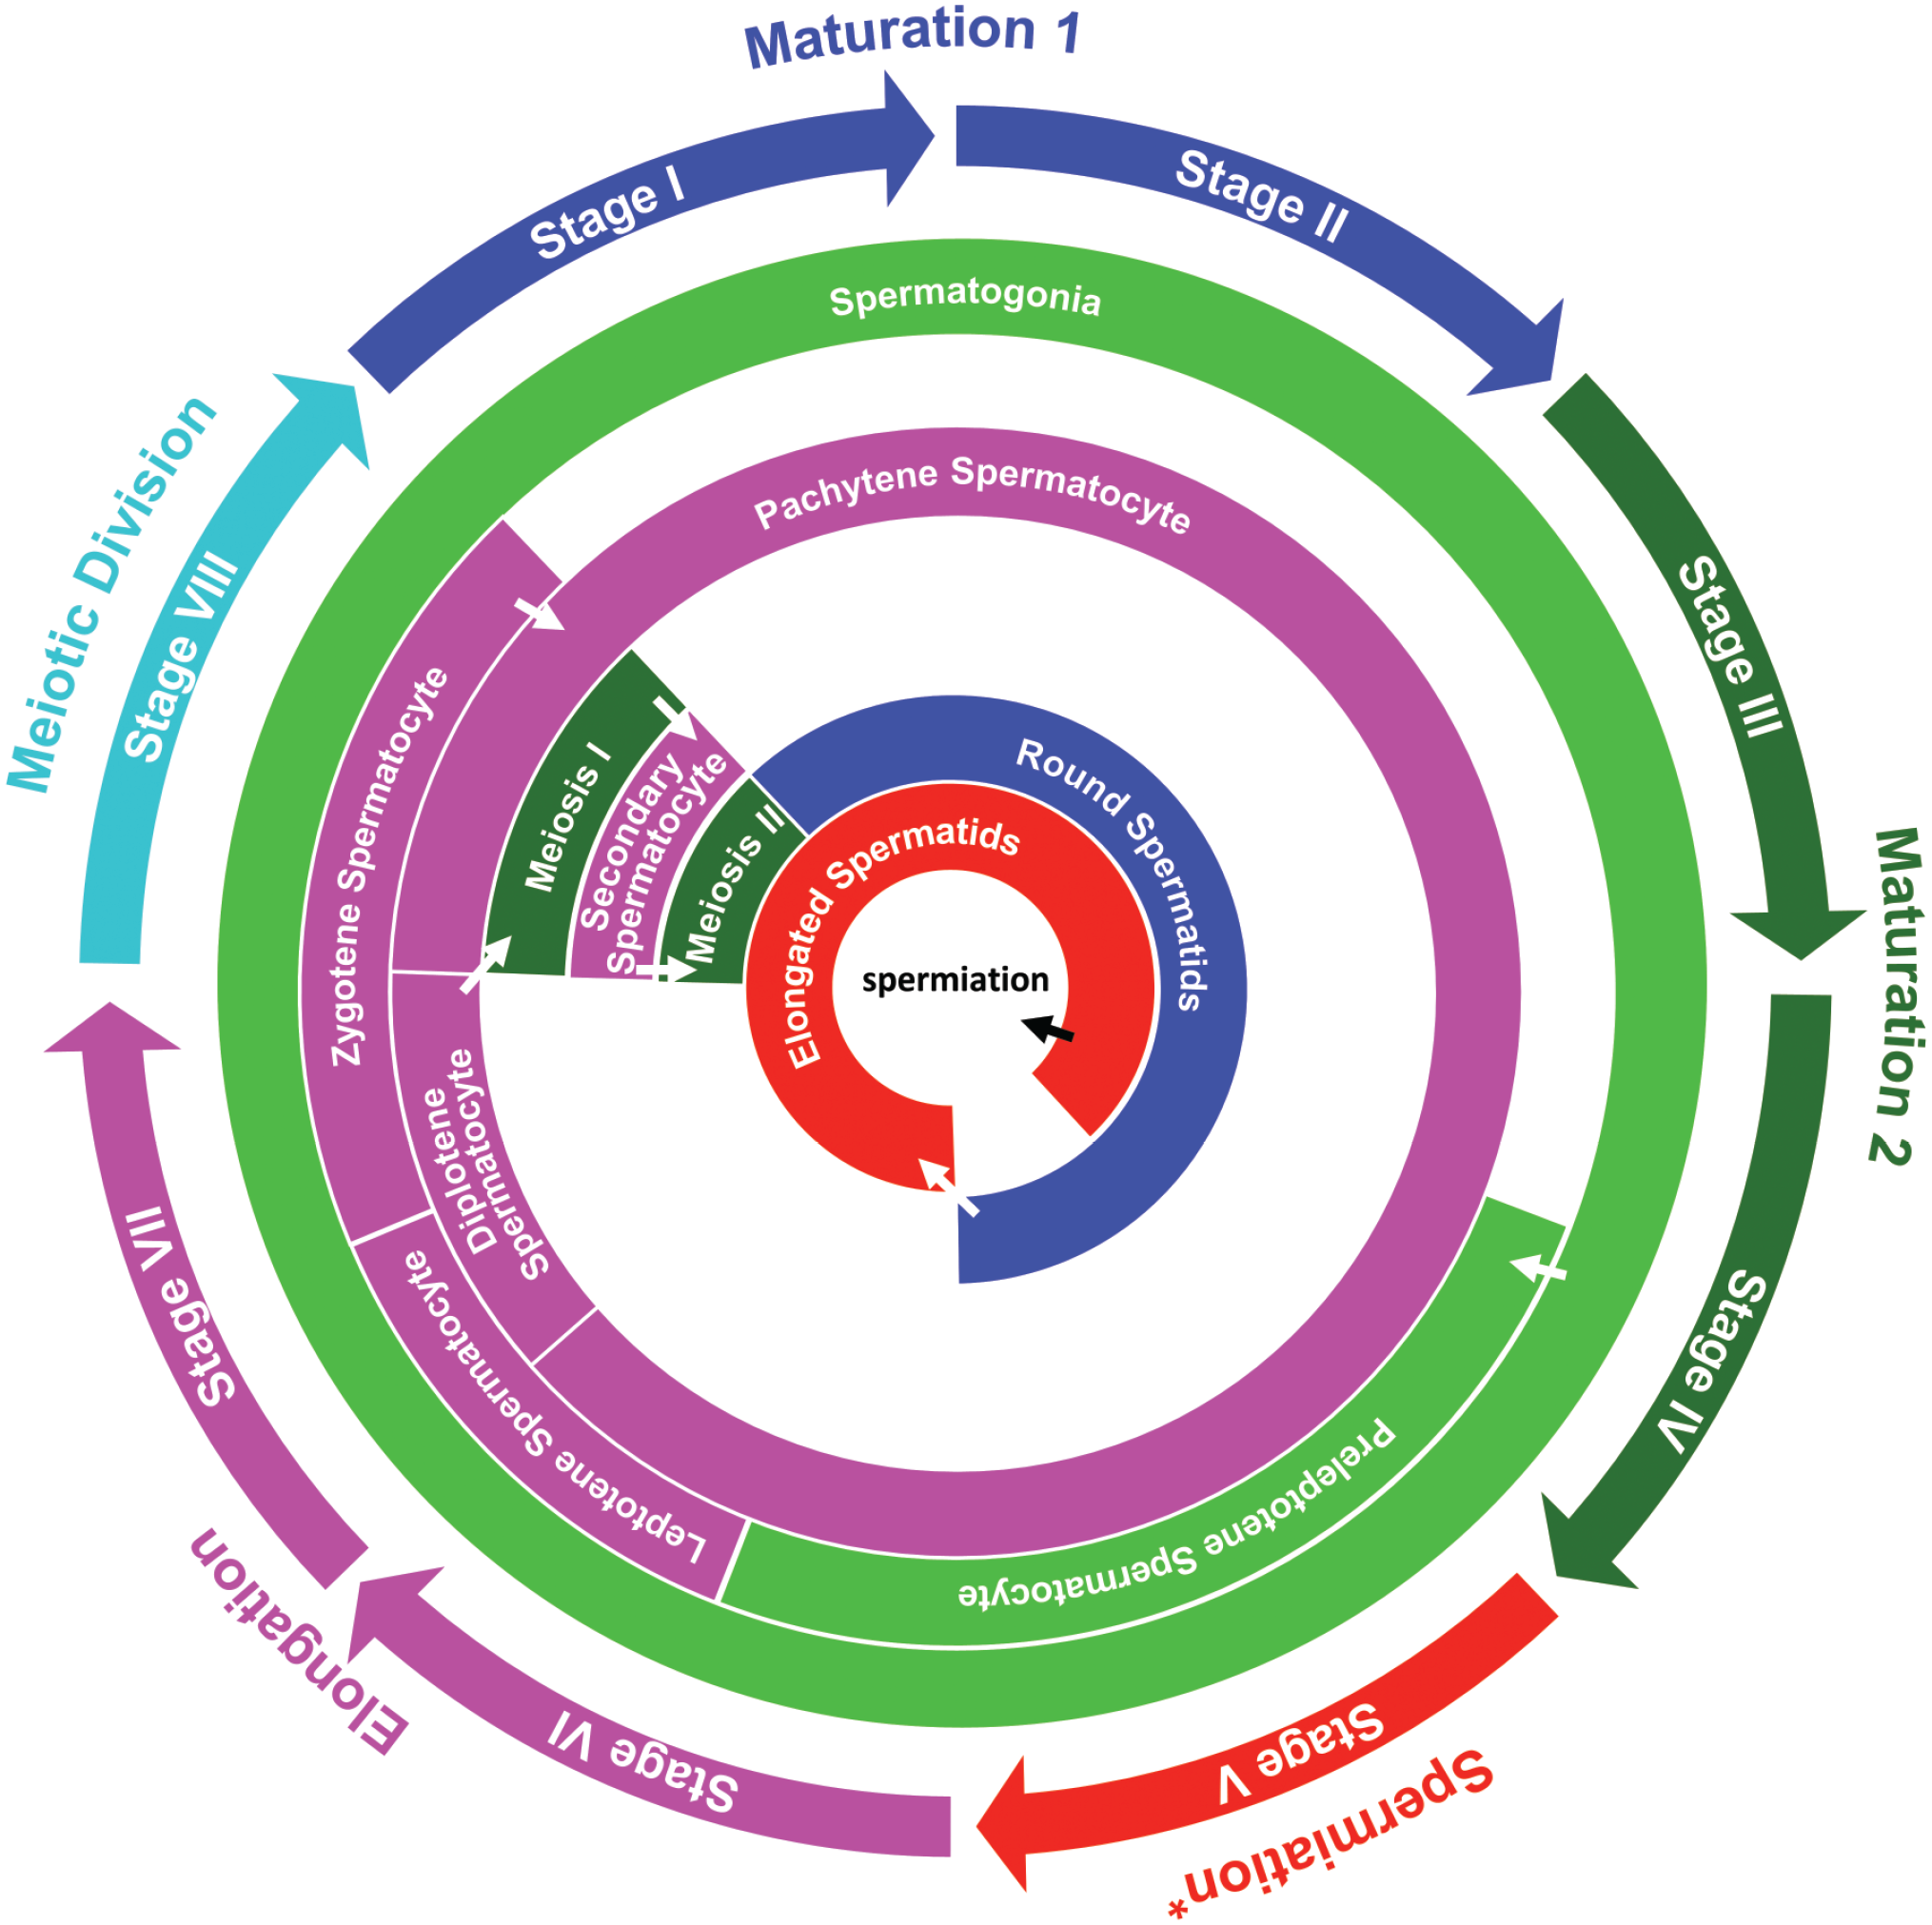
Spermatogenic cycle in dogs. Germ cell types of the seminiferous tubules in dogs were shown in association with stages I through VII. For DL model analysis, stages are grouped to have maturation 1 (stages I-II), maturation 2 (stages III-IV), spermiation (stage V), spermatid elongation (stages VI-VII), and meiotic division (stages VIII). Concentric circles represent different types of germ cells (spermatogonia, spermatocytes, and spermatids) and approximate anatomic location in the tubule. The transition of different germ cells through the cycle is presented using white arrows. The differentiation of the germ cells was extended to the adjacent stages and included common early- and late-observed germ cells.
Stage I
There were two generations of spermatids and one generation of spermatocytes. Elongated spermatids were often grouped near round spermatids. Some elongated spermatids were located closer to Sertoli cells. Round spermatids had no acrosome. Pachytene spermatocytes were observed between the layers of round spermatids and spermatogonia. Spermatogonia were present in the basal layer of tubules and had a small round or oval nucleus with one or more prominent nucleoli and sparse chromatin.
Stage II
A small round acrosome, appearing as an unstained vacuole, was present in the cytoplasm of round spermatids. The acrosome was present adjacent to the nucleus but did not dent the nuclear surface of round spermatids. The cytoplasm of elongated spermatids became more granular. Other morphologic features were similar to stage I.
Stage III
Round spermatids had a small round acrosome with an indented nuclear surface. Elongated spermatids were near the tubular lumen and had residual bodies (small in size and number) in their cytoplasm by the end of this stage.
Stage IV
Acrosomes of the round spermatids became larger and flattened along the nuclear surface. Elongated spermatids were located in the lumen with prominent residual bodies. Partial spermiation was seen in some tubules. Dark oval spermatogonia were observed in the basal layer. Preleptotene spermatocytes were also noticed in the basal layer and had a round nucleus and more granular chromatin. Mitotic figures were seen in the basal layer and considered division from type B spermatogonia to preleptotene spermatocytes.
Stage V
Stage V had only round spermatids and no or few remaining elongated spermatids. Round spermatids had no acrosomes or rarely a thin rim of acrosome around their nucleus. Nuclei of round spermatids were located at the center of their cytoplasm but moved toward the cytoplasmic membrane later during this stage. Preleptotene spermatocytes were more noticeable in the basal layer than in the previous stage. Later during this stage, there was a small number of leptotene spermatocytes in the basal layer, which had a larger round nucleus with increased chromatin as compared with preleptotene spermatocytes.
Stage VI
Elongation and condensation of the spermatid nuclei started in this stage. These features were more pronounced, and elongated spermatids were grouped later during this stage. Leptotene spermatocytes were larger with dark granular nuclei and increased amount of coarse chromatin and were located between the pachytene spermatocytes and basement membrane of tubules.
Stage VII
Nuclei of the elongated spermatids became further elongated and condensed. Leptotene spermatocytes were present between a layer of the pachytene/diplotene spermatocytes and basement membrane of tubules. In the same area, zygotene spermatocytes were also noticed by the end of this stage. These cells had slightly larger nuclei and thick chromatin cords, often with large unstained areas within the nuclei as compared with leptotene spermatocytes.
Stage VIII
Stage VIII was defined by the presence of meiotic figures. Secondary spermatocytes were often seen in the areas adjacent to meiotic figures and had a smaller nucleus than pachytene spermatocytes but were larger than round spermatids. Small numbers of newly formed round spermatids were present in these areas. Elongated spermatids were morphologically similar to the previous stage. There were pachytene and zygotene spermatocytes.
A Step-by-Step Approach for Stage Determination
A decision tree for distinguishing the stages is illustrated in Figure 4. Stages are first divided into two phases based on the number of spermatid generations. The stages with two spermatid generations are further divided into stages I-IV based on the absence of acrosomes (stage I) and the stage-specific morphology of acrosomes (stages II-IV). Stage V has round spermatids with no or few elongated spermatids. Stages VI and VII are identified based on the morphology of elongated spermatids: in stage VI, oval to elongated spermatids; and in stage VII, more advanced elongation and condensation with slender heads of the spermatids. In stage VIII, meiotic figures are present, and elongated spermatids are similar to stage VII.
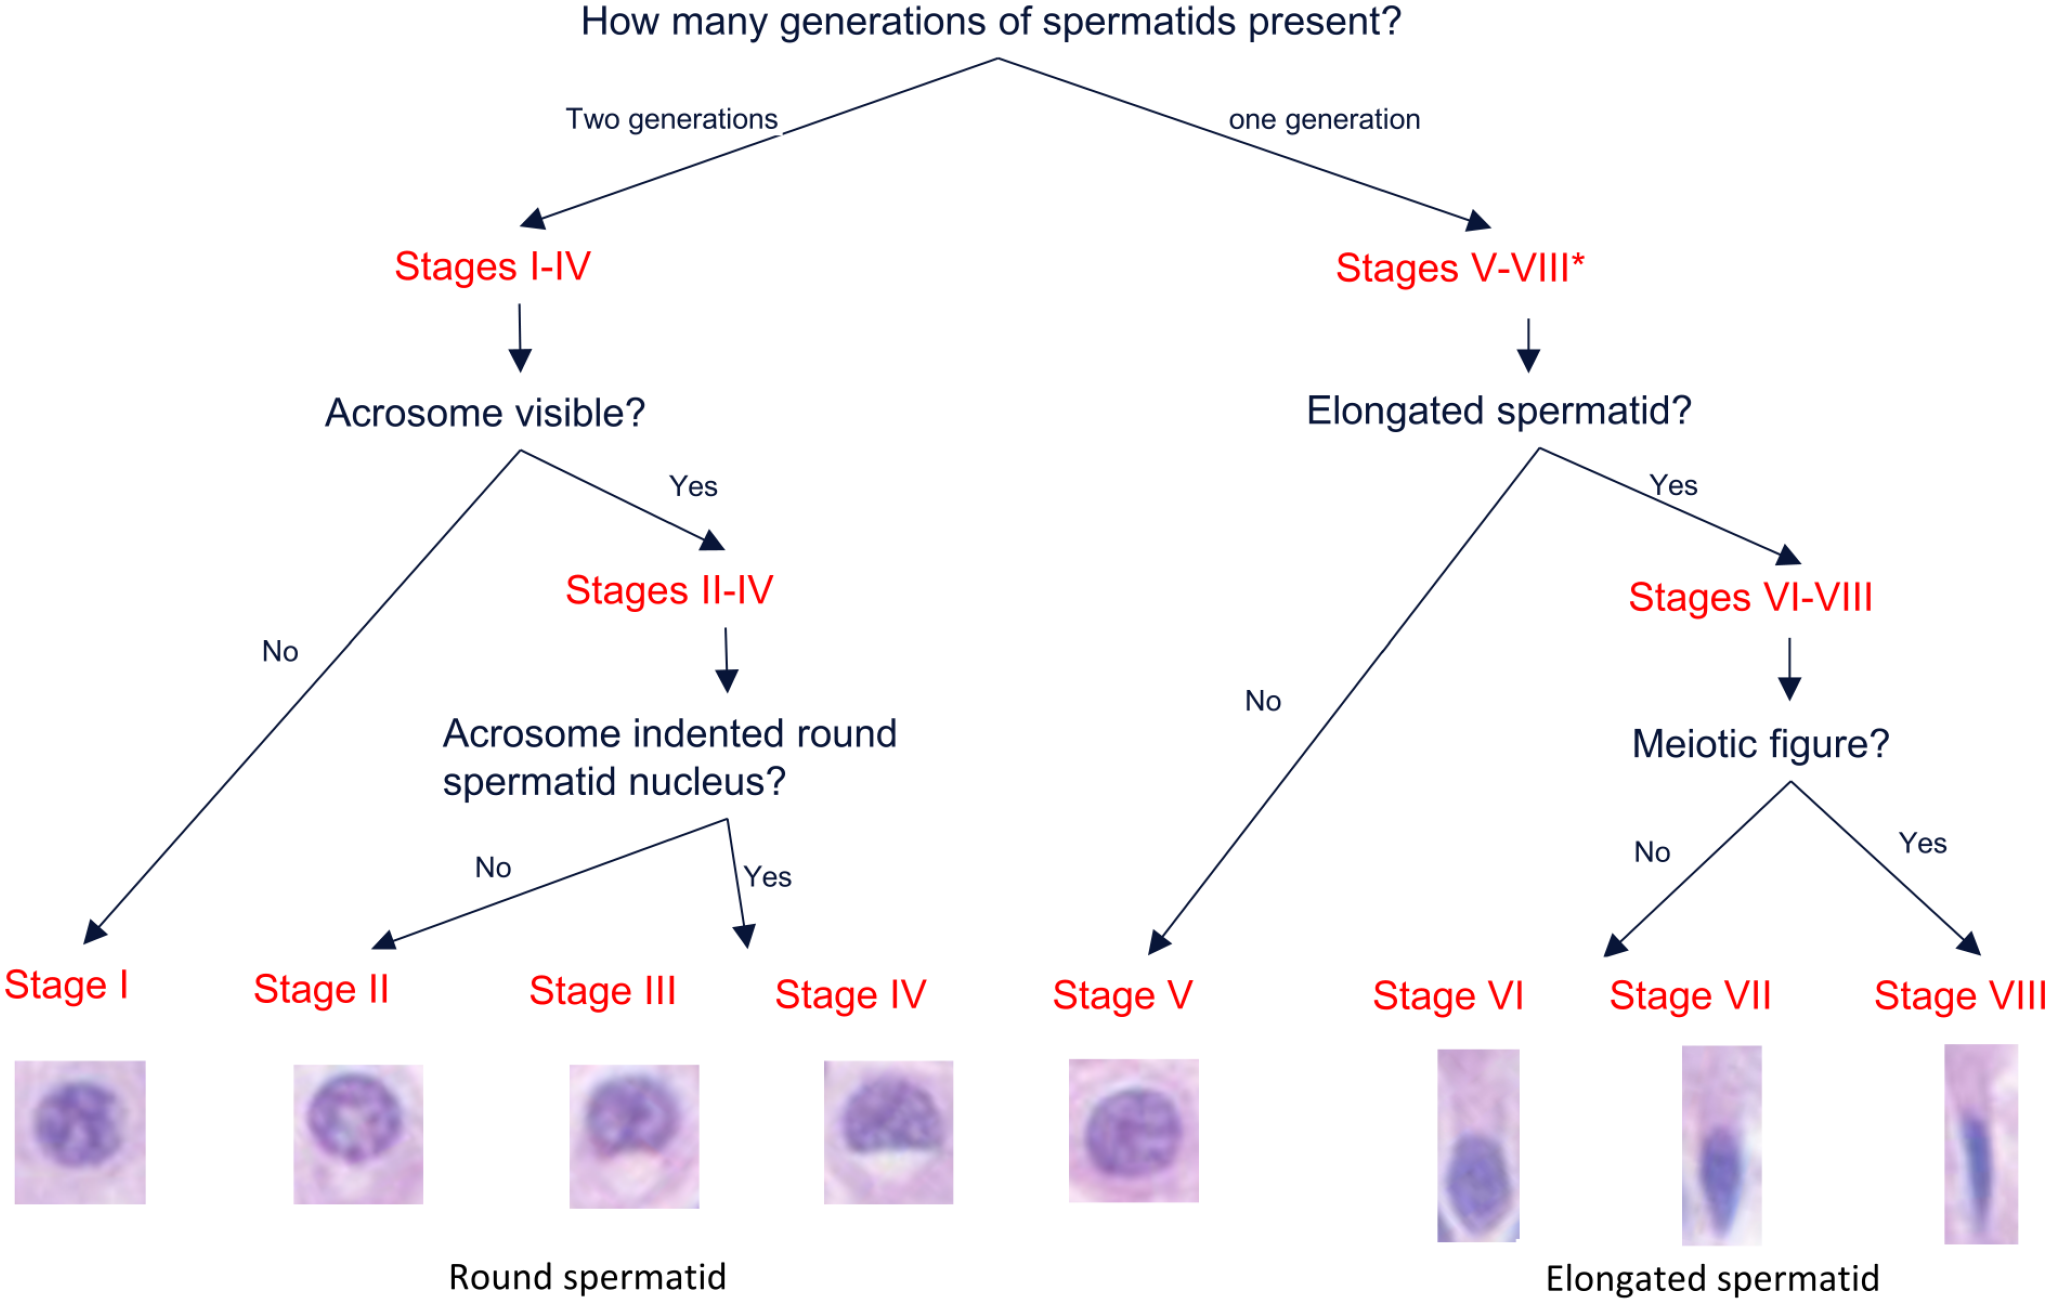
Step-by-step decision tree for the practical staging of spermatogenesis cycle of dogs on H&E sections. First, staging can be determined by generations of spermatids: two generations in stages I-IV versus one generation in stages V-VIII. The stages can be further defined by morphology and location of acrosomes (stages II-IV), elongated spermatids (stages VI-VII), and meiotic figure (stage VIII).
Established Criteria of Spermatogenic Staging for Image Analysis
The criteria of individual stages I to VIII were not practical and amenable to image analysis model development because the tubules from subsequent stages can have similarities. For example, stages I and II had similar morphologic features except for the presence of small cytoplasmic acrosomes in the round spermatids without nuclear indentation in stage II. All germ cells and acrosomes were morphologically similar in stages III and IV, although acrosome morphology is slightly different, and preleptotene spermatocytes started appearing in stage IV. The germ cells in stages VI and VII tubules were also similar, except for the difference mainly in advanced elongation and condensation of the spermatid nuclei, which was a challenging task to distinguish in these two stages. Therefore, based on the mentioned similarities and minor differences, we combined stages I and II (maturation 1), stages III and IV (maturation 2), and stages VI and VII (elongation). Pooling these stages helped us to minimize the effects of variability of germ cell differentiation and multistage tubules.
The established criteria for pooled staging were formulated based on the morphology and location of acrosome and germ cells (Table 2). The criteria for defining stages I-II and stages III-IV were based on mainly morphologic features of acrosome and the location of vesicles. Stages V and VI-VII were defined based on the nuclear morphology of spermatids, and stage VIII was determined by the presence of meiotic figure.
Staging criteria of dog spermatogenesis based on hematoxylin and eosin slides.
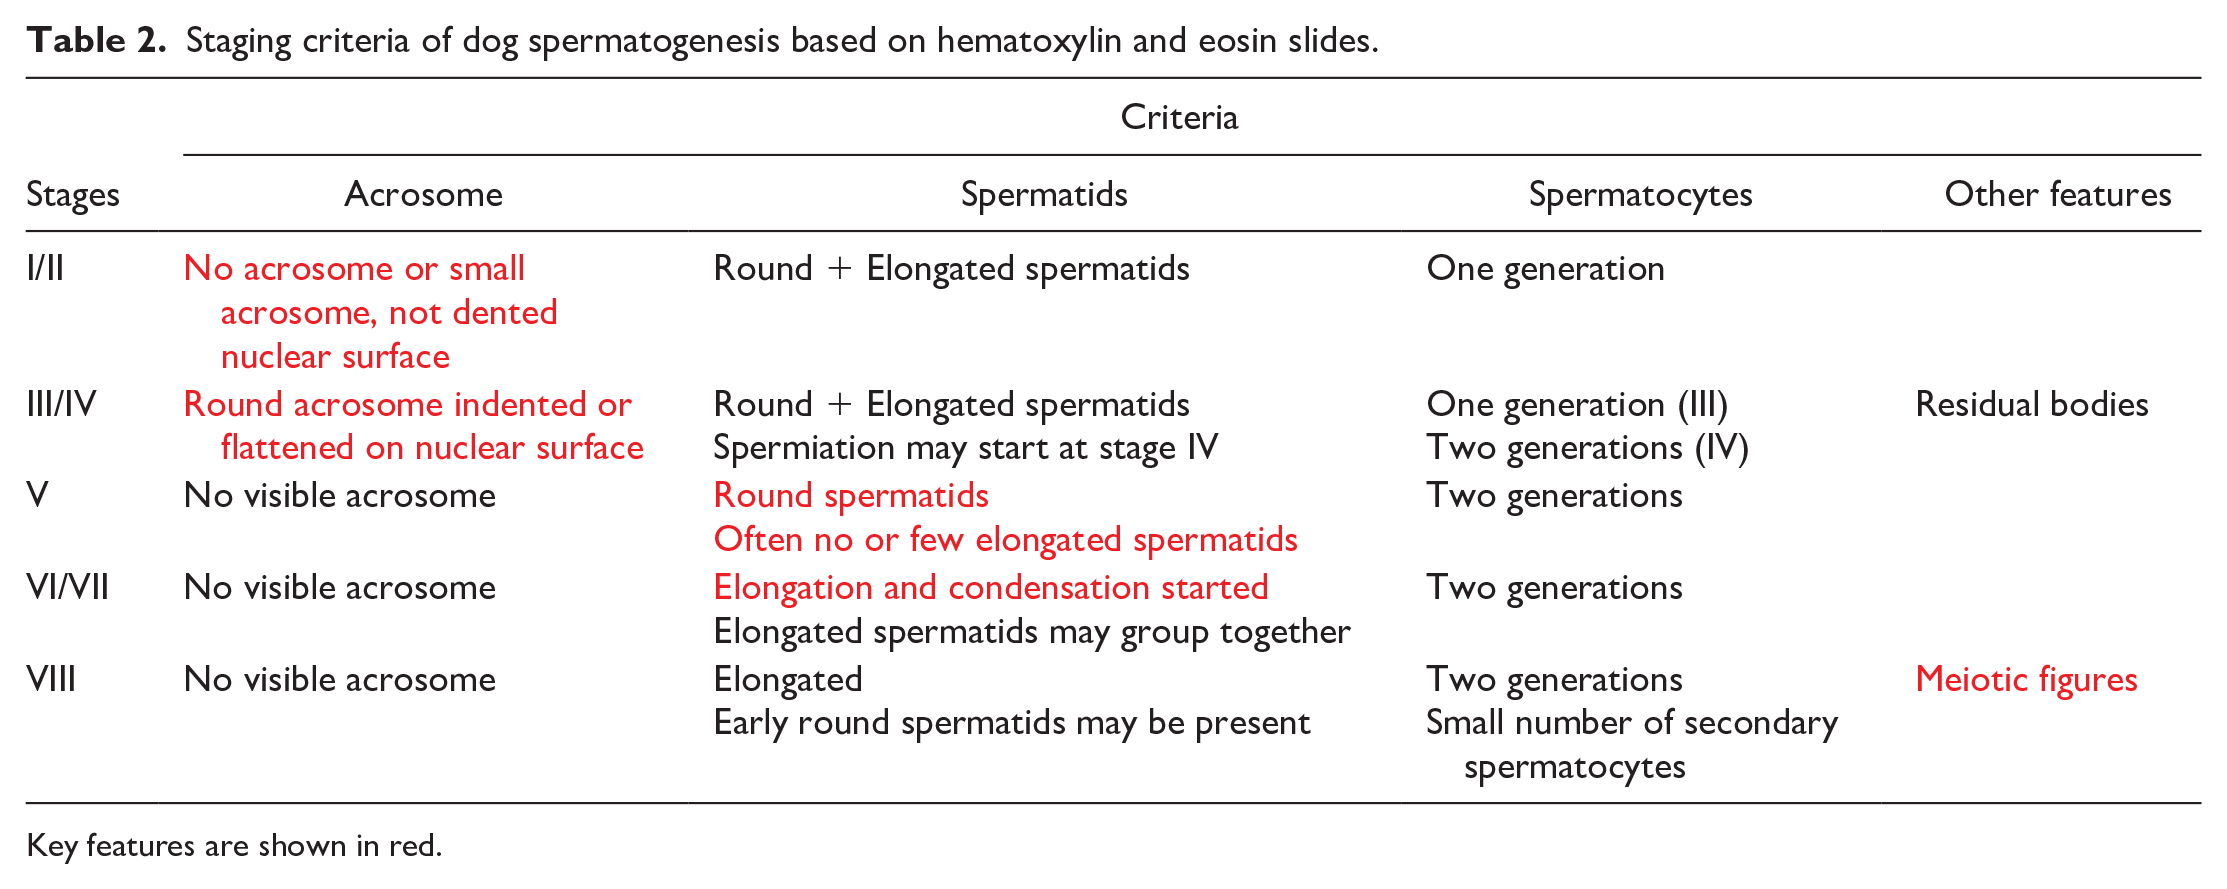
Key features are shown in red.
Automated Staging Using DL
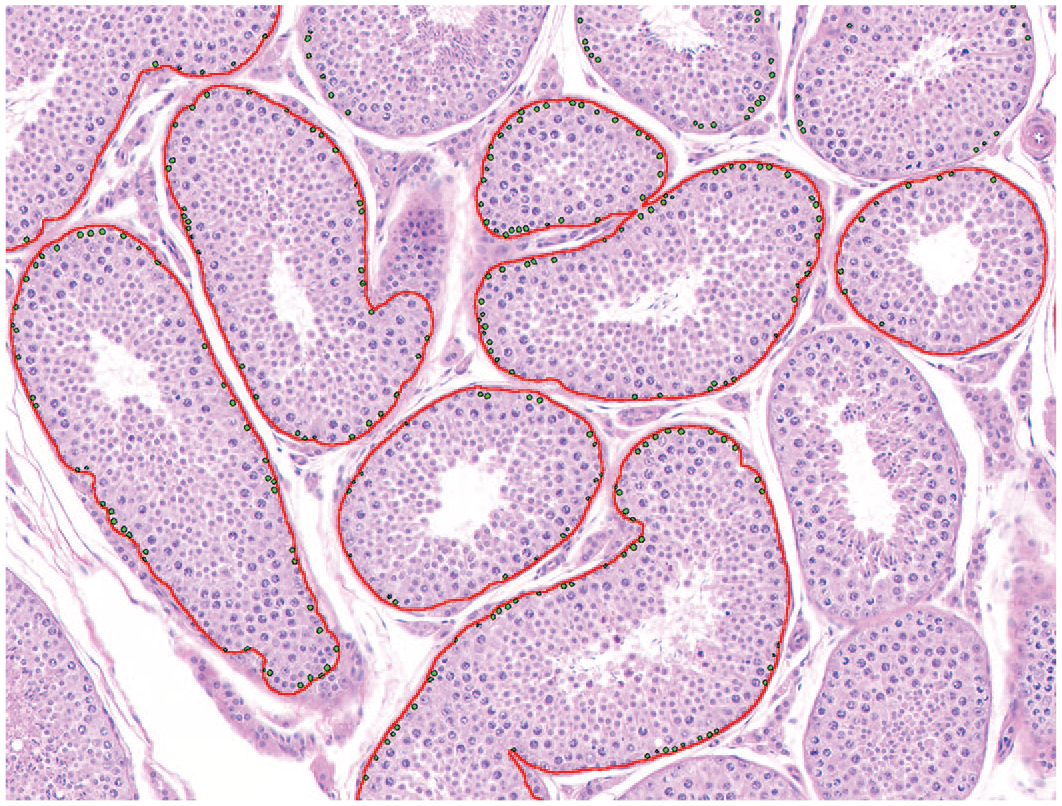
The result of the algorithm on the test data set is shown in Figure 5. The visual pattern and arrangement of the stage distribution in testes were variable among animals, but as seen in Figure 5, the same stage often formed a cluster and was located adjacent to the next stage following the tubular segmental order of the stage progression. The model showed robustness in the tubules that had spontaneous background findings (Figure 6). The hypoplastic tubules (Sertoli cell–only tubules) were truly excluded by the model (Figure 6A). Even though the model can correctly stage the tubules with low-grade hypospermatogenesis, it automatically excluded the tubules that had severe hypospermatogenesis (Figure 6B). This exclusion was considered acceptable as the staging of tubules with severe hypospermatogenesis was not microscopically possible either.
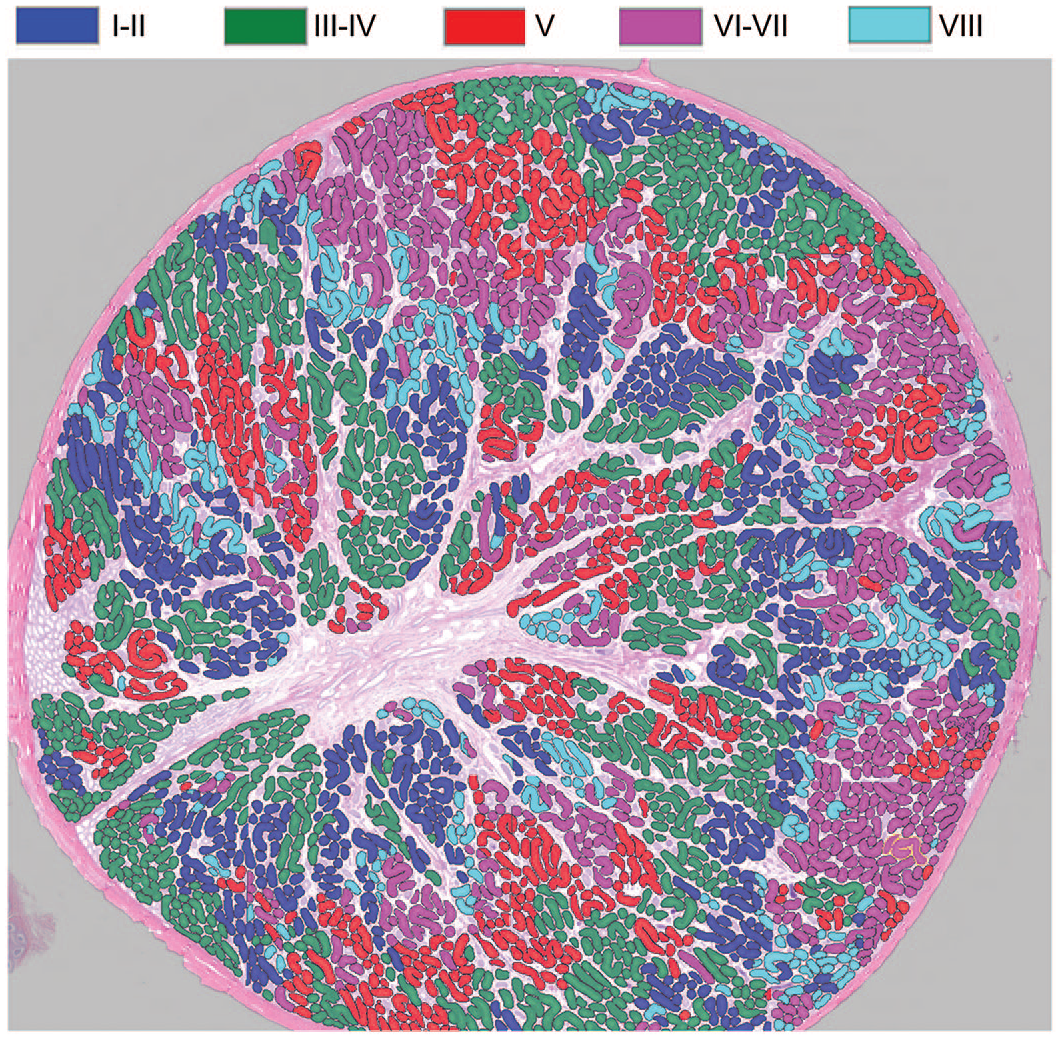
The results of the staging model in a whole left testis tissue. The exclusion class is transparent; thus, the nontubular areas or tubules without color-coding belong to the exclusion class.
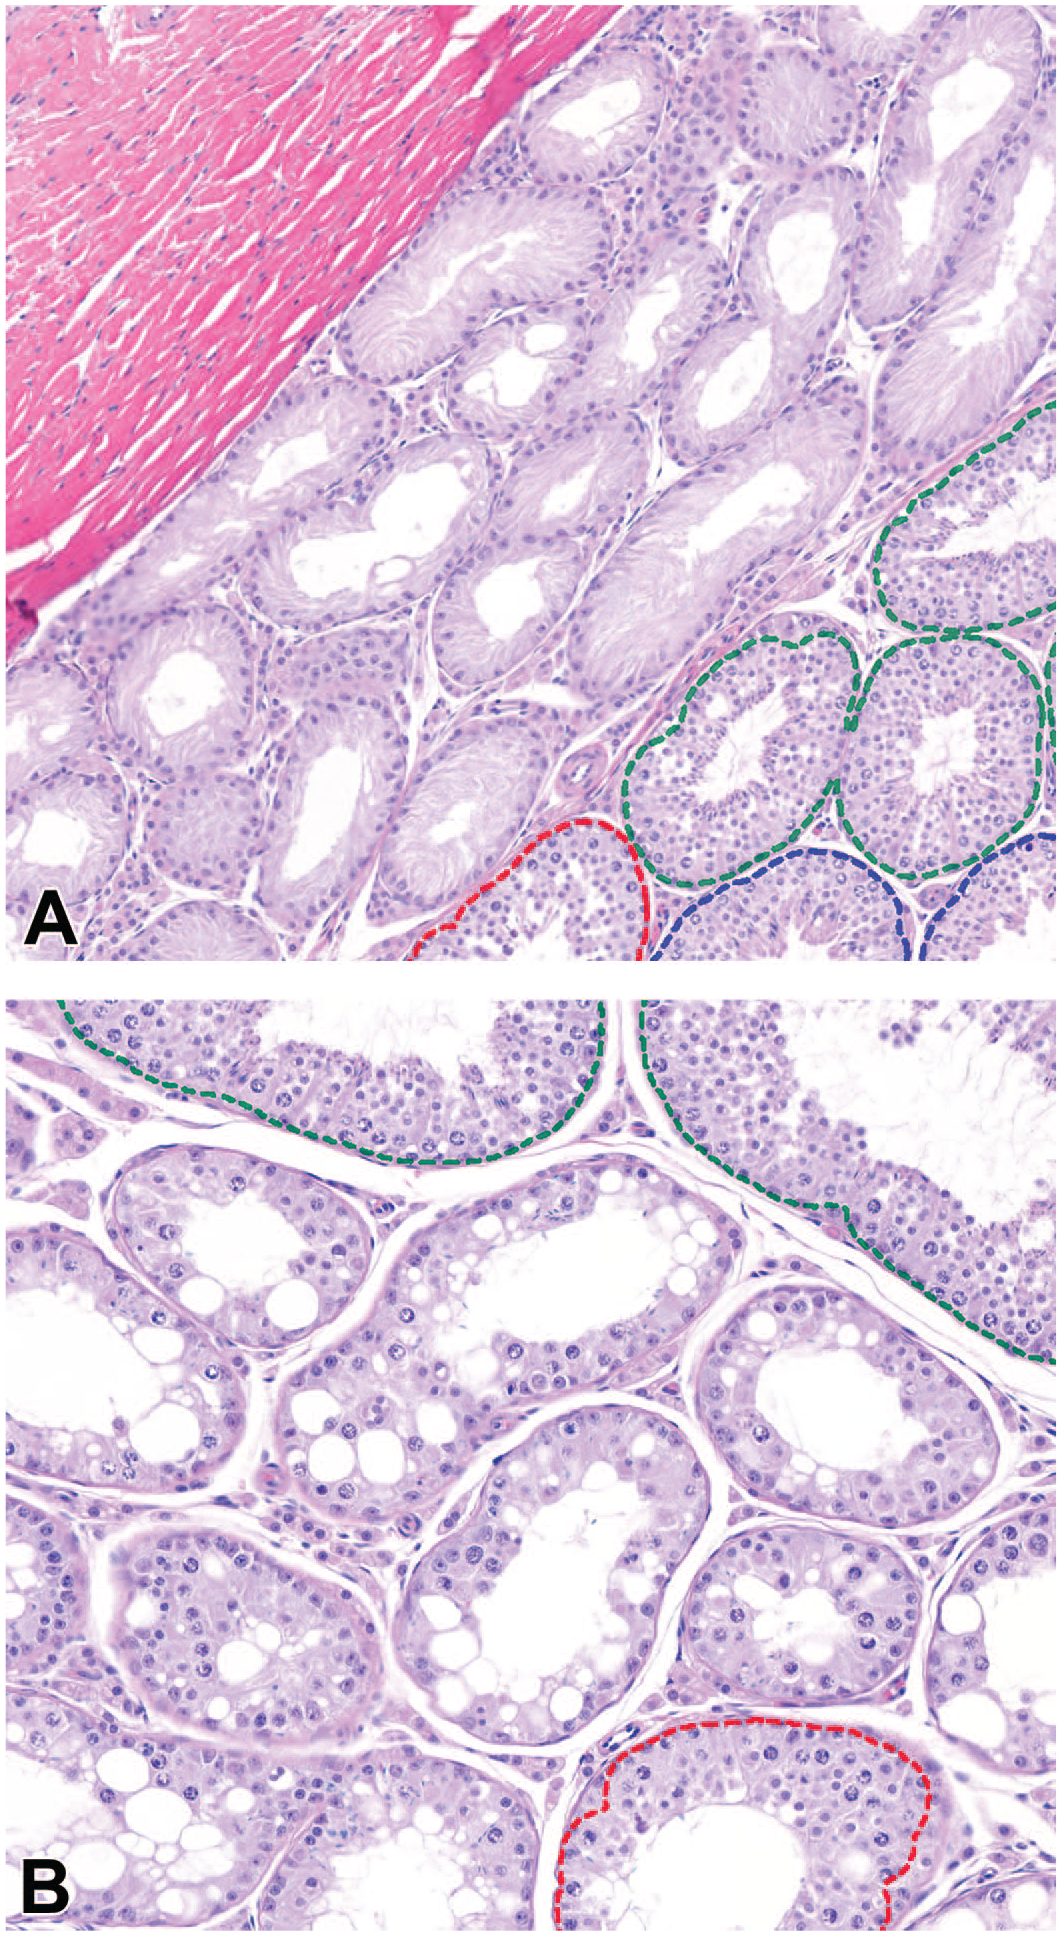
The results of the staging model in (A) hypoplastic and (B) hypospermatogenic tubules. The exclusion class is transparent; thus, the nontubular areas or tubules without color-coding belong to the exclusion class.
In dog testes, there are a large number of longitudinally sectioned tubules, even on cross-sections of testes. These tubules are not round, and they can be in different shapes and sizes. Furthermore, dog testes are less synchronized in comparison with rodents. Therefore, some tubules comprised more than one stage in particular longitudinally sectioned tubules, and we expected the model to segment the multistage tubules accordingly (Figure 7).
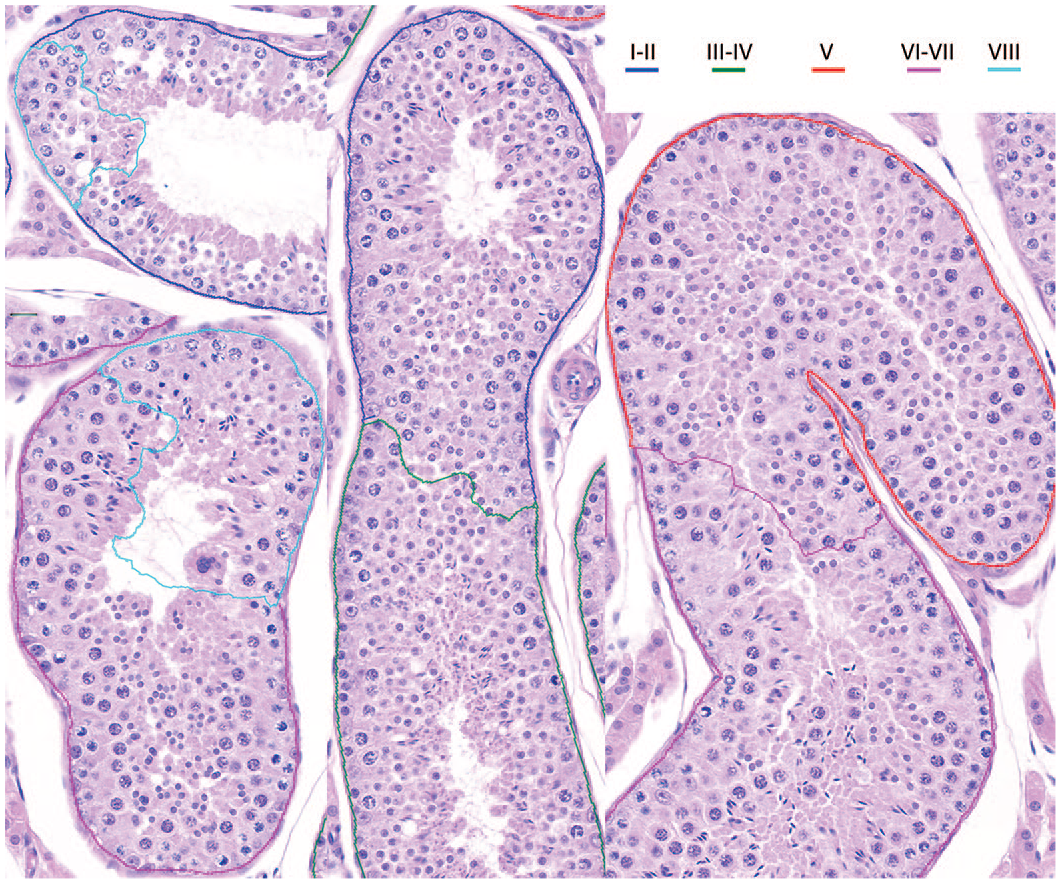
The result of the staging model in examples of multistage tubules.
Evaluation of staging model
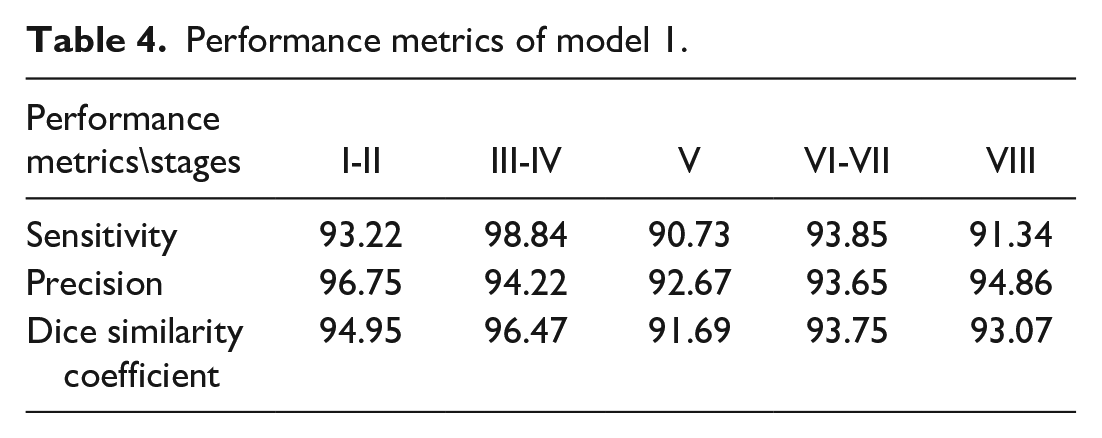
The result of the staging model was visually evaluated and confirmed by the pathologist. To objectively evaluate the model, we generated a confusion matrix for comparing the model-predicted staging results on test data with ground truth (Table 3). The confusion matrix describes the performance of a model in comparison with the ground truth for individual classes. By normalizing each column to the ground truth area, this confusion matrix presents the sensitivity of the model (i.e., what percentage of the ground truth was detected at which class). For instance, 93.2% of tubules, assigned by the pathologist as stages I-II, were correctly detected by the model as stages I-II. However, 4.5% and 2.3% of tubules in stages I-II of ground truth were staged incorrectly by the model as stages III-IV and stage VIII, respectively. Most of the discrepancies lay within a ±1 stage difference. The overall DSC of the model was calculated as 94.39%. Table 4 shows precision, sensitivity, and DSC in percentage for the different stages, suggesting a high accuracy of the model at detecting all stages.
Confusion matrix based on the sensitivity of the staging model (model 1).
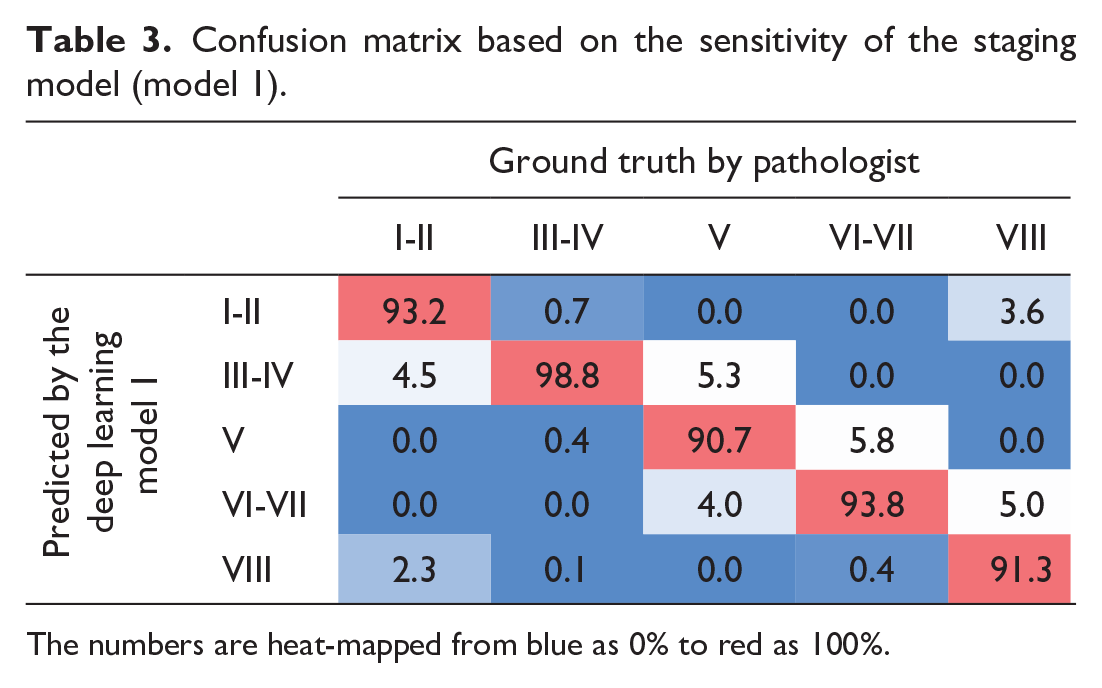
The numbers are heat-mapped from blue as 0% to red as 100%.
Performance metrics of model 1.
The stage frequency map was determined for model-generated annotations and compared with the stage frequency of ground truth (pathologist annotated) and the stage frequency provided in the literature1,10 (Figure 8). There was a high correlation between the ground truth and prediction by the model. There were small differences in staging frequency between our data and literature, especially in stages VI-VII.
Germ Cell Segmentation Model
The result of germ cell segmentation is shown in Figure 9. The annotation and color-coding of different germ cells and alongside the stages of the tubule provided a good visual tool for stage-aware evaluation of the germ cells without using higher magnification (Figure 9). For example, stages I-V normally have numerous round spermatids (dark blue round cells in Figure 9). Any reduction of those cells can be assessed in stages I-V and exclude stages VI-VIII, where no round spermatids are normally present. Pathologists can also visualize and focus on spermatogonia and preleptotene spermatocytes (SG/PL) in stage V to evaluate the stage V–specific change in the number of these cells located in the basal layer (Figure 10).
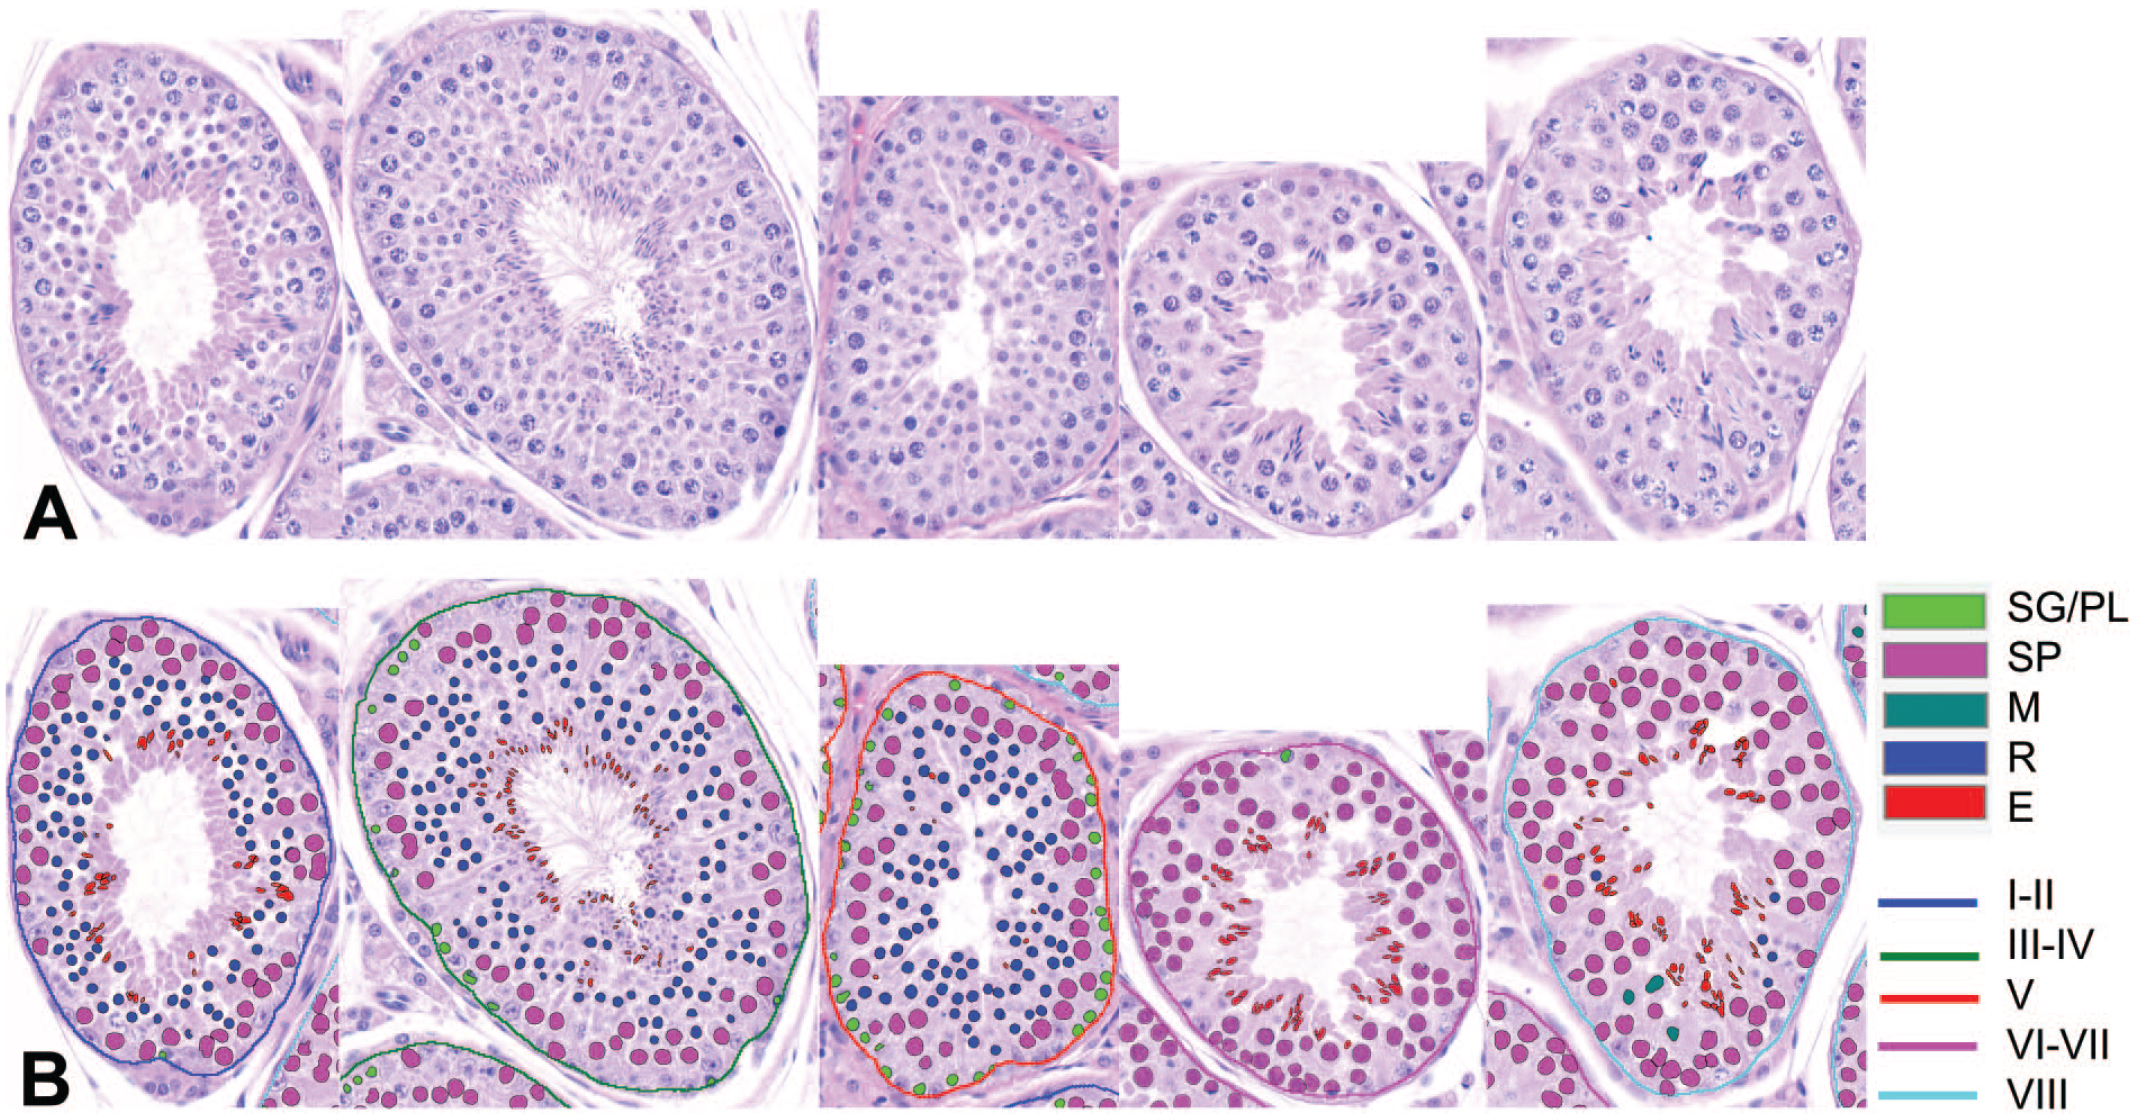
Representative photomicrographs of seminiferous tubules in different stages (A) and the results of automated staging and germ cell segmentation (B). Sertoli cells, lumen, and residual bodies are without color-coding and belong to the background class. E indicates elongated spermatids; M, meiotic figures; R, round spermatids; SG/PL, spermatogonia/preleptotene spermatocytes; SP, spermatocytes excluding preleptotene and spermatocytes.
Emphasizing stage V–only tubules (red region of interest) and spermatogonia/preleptotene spermatocytes (green label) for facilitating stage-aware evaluation.
Evaluation of germ cell segmentation model
The segmentations for all types of germ cells were reviewed, and the annotation of elongated spermatids, round spermatids, spermatocytes, meiotic figures, and SG/PL was confirmed by the pathologist. Confusion matrix (Table 5) showed that the performance of the model was high in detecting all germ cells, and the model had little to no confusion between the classes. The overall DSC of the model was calculated as 96.75%. Table 6 shows precision, sensitivity, and DSC in percentage for different germ cells indicating a high accuracy of the model at detecting all germ cells. Detection of meiotic figures had low precision and DSC in comparison with other classes, but this did not affect the overall performance of the model.
Confusion matrix based on the sensitivity of the germ cell segmentation model (model 2). The numbers are heat-mapped from blue as 0% to red as 100%.
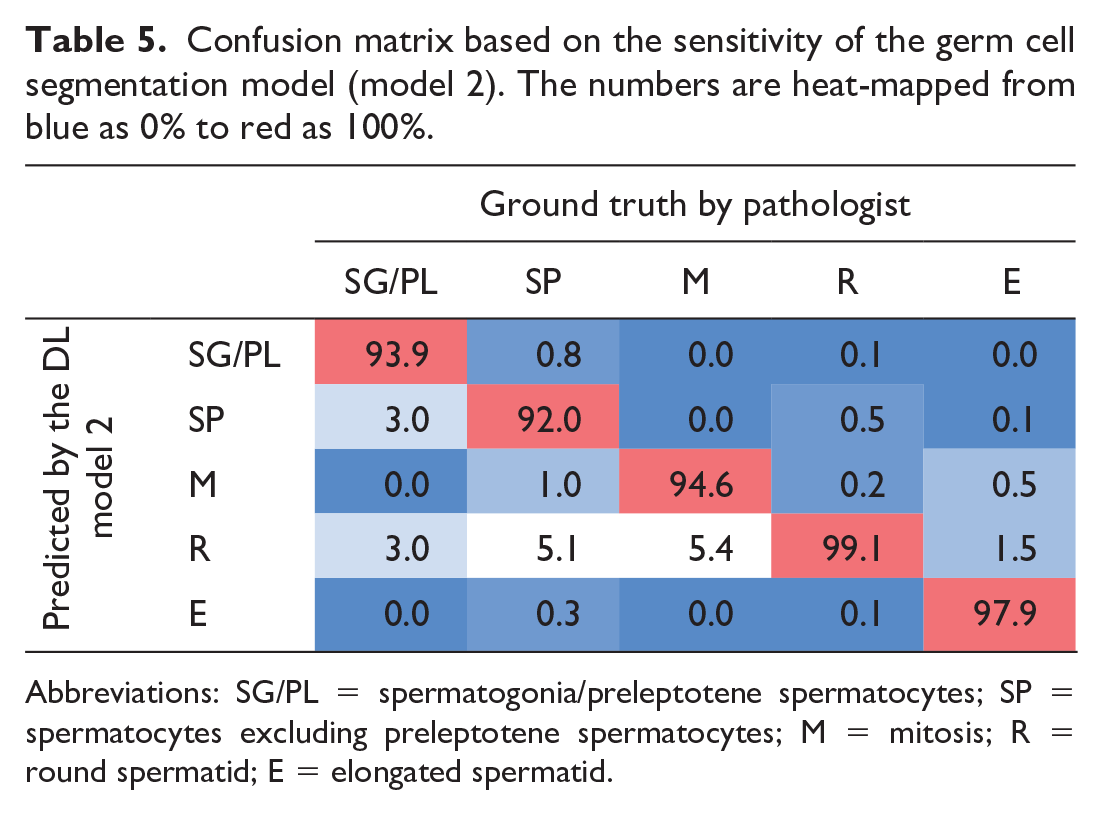
Abbreviations: SG/PL = spermatogonia/preleptotene spermatocytes; SP = spermatocytes excluding preleptotene spermatocytes; M = mitosis; R = round spermatid; E = elongated spermatid.
Performance metrics of model 2.
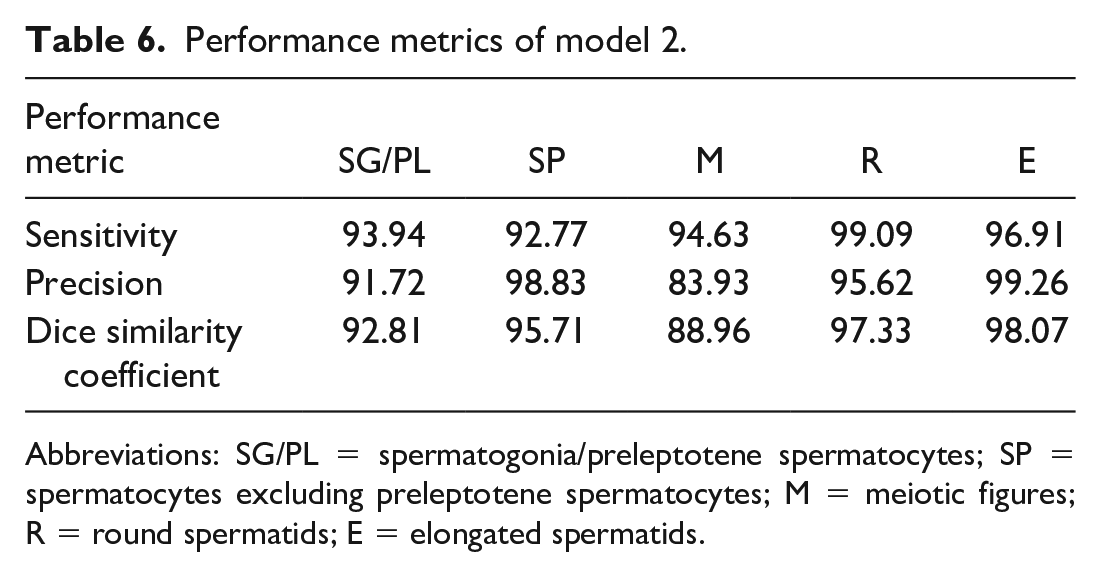
Abbreviations: SG/PL = spermatogonia/preleptotene spermatocytes; SP = spermatocytes excluding preleptotene spermatocytes; M = meiotic figures; R = round spermatids; E = elongated spermatids.
Germ cell quantifications
Germ cells were quantified in different stages (Figure 11). Round spermatids were largely present in stages I-V. A small number of early round spermatids may be seen in stage VIII. These are newly formed round spermatids from spermatocytes by meiotic divisions via secondary spermatocytes. Some secondary spermatocytes were indistinguishable from early round spermatids by the DL model. While stage VIII was defined by the presence of meiotic figure, the count of round spermatids in this stage included a small number of both round spermatids (0.2%, Table 5) and secondary spermatocytes (0.1%, Table 6). The meiotic figures and early round spermatids were often seen in the same areas in stage VIII. The number of elongated spermatids became the lowest in stage V (89.3% lower than stages III-IV). Partial spermiation started as early as stage IV and completed by stage V. The reduction of elongated spermatids was due to spermiation in these stages. The number of SG/PL was at the highest in stage V (228% higher than the average number of SG/PL seen in other stages) because the number of preleptotene spermatocytes was significantly increased in stage V. The highest number of spermatocytes was seen in stages VI-VII (64% higher than the average number of spermatocytes seen in other stages), where there were two generations of spermatocytes, including pachytene spermatocytes and leptotene/zygotene spermatocytes.
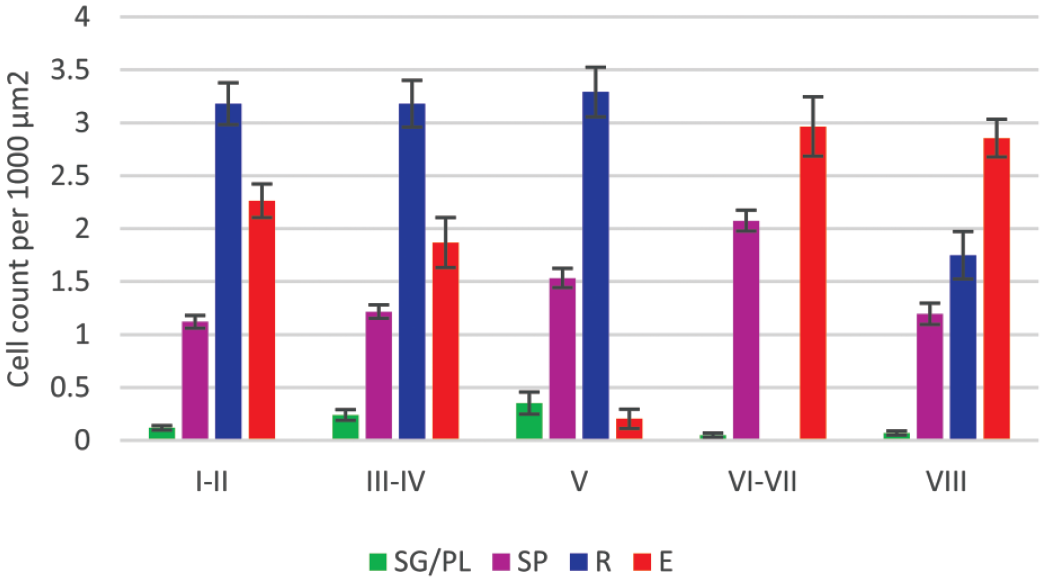
The stage-specific germ cell quantifications. E indicates elongated spermatids; M, meiotic figures; R, round spermatids; SG/PL, spermatogonia/preleptotene spermatocytes; SP, spermatocytes excluding preleptotene and secondary spermatocytes.
Discussion
We demonstrated practical, descriptive staging of the spermatogenesis cycle in dogs using standard H&E slides. We defined five staging groups by combining stages I and II, stages III and IV, and stages VI and VII for the purpose of DL model because of mainly the similarity of spermatid morphology in these stages on H&E slides. The established criteria were used to develop the models for staging and germ cell detection: model 1—multiclass segmentation of tubular area with each stage/pooled stages as a class and the nontubular area as the exclusion class and model 2—multiclass segmentation of germ cells with each cell type as a class and a background class. We used active learning to develop the DL models. There can be other approaches to tackle the labor-intensive challenge of annotating a large amount of data, 11 but we found active learning and data augmentation are common and easy to implement in DL model development.
Morphology of the Spermatogenic Cycle and Model Performance
One of our objectives was to provide practical staging information for toxicologic pathologists using standard H&E sections, and it was not possible to define precise start and end points of each stage and subtypes of spermatogonia (type A, intermediate, and type B) using standard H&E slides. Morphologic features of the spermatogenesis cycle in dogs were previously published.1,10 As discussed later, two publications showed slight differences mainly in timing and/or appearance of acrosomes, elongated spermatids, residual bodies, and spermiation. The definition and morphology of each stage in the current study were more in agreement with Soares et al. 10 compared with Russell et al. 1 In early stages II-IV, acrosomes were visible as small unstained vacuoles in round spermatids in standard H&E sections. The acrosome morphology is important in defining early stages. Thin plastic sections were often used to achieve a higher resolution.1,10 To our knowledge, this is the first dog study to demonstrate the utility of acrosome morphology for staging on standard H&E sections. Although presence and morphology of acrosomes can be variable within the same stage, the acrosome is a good guide to define the early stages. Acrosomes started to be visible in stage II and are present in the cytoplasm of round spermatids. However, it can be difficult to see the acrosomes in stage II on thick sections or suboptimal H&E slides because acrosomes are small without nuclear indentation in step 2 round spermatids. Similar to our observations, Soares et al. described that the acrosomes remained round and indented on the nuclear surface of the round spermatids in stage III. However, Russell et al. reported that stage II is the earliest that the acrosomal vesicle indented the nuclear surface. They also described that stage III began with the acrosome vesicle in juxtaposition with the nuclear surface of the round spermatid and ended before the acrosomal vesicle started to flatten on the nucleus. On the contrary, in their diagram of “stages of the cycle,” nuclear indentation was not apparent in stage III, and the acrosomal vesicles has not flattened yet in stage IV, which might be more similar to stage II and stage III, respectively, as described by Soares et al.
Rodent spermatogenesis is synchronized, and the staging is well-established in many publications in mice1,19,20 and rats.1,2,13,21 In contrast, nonrodent animals such as nonhuman primates may have multiple stages in a single seminiferous tubule. 22 Although we can find two or more stages within the same tubules, especially longitudinal sections in dogs. Therefore, it is inevitable to see longitudinal tubules with multiple stages in any plane of testis sections in dogs compared to rodents. In our criteria establishment, when there were multiple stages within the same tubule, the most dominant stage was chosen, or multiple stages were annotated when equal amounts of different stages were present in the tubule. For implementing this in the DL model, a postprocessing step (see model 1 postprocessing steps 3 and 4 in “Methods” section) was used to ensure the classification of the stage based on the dominance and still segmenting the multistage longitudinal tubules with large areas in multiple stages. Combining stages in criteria establishment decreased the number of multistage tubules. The exact boundary of different stages in multistage longitudinal tubules was sometimes unclear (Figure 7), which contributed to the minor false detections in the staging by DL model (overall DSC = 94.39%). In general, the developed model had a high accuracy in determining the stages of the tubules. The sensitivity ≥90.73%, precision ≥92.67%, and DSC ≥91.69% of the model were high for all individual stages/grouped stages (Table 4). The minor error in the staging model was mainly in ±1 stage difference (Table 3). In the spermatogenic cycle, the development of germ cell morphologic features is continuous. Therefore, some tubules can be found transitioning between stages, and assigning a stage to these tubules can be subjective. For example, the transition of stage IV to stage V was not discrete, which affected the performance of the DL model. Stage V could also be identified as stages VI-VII or vice versa because sometimes, steps 5, 6, and 7 spermatids co-existed in the same tubule. Therefore, there would be no clear boundary for stages V, VI, and VII in these multistage tubules (Figure 7). However, as we combined stages VI and VII, such multistage tubules became uncommon. Another challenge in developing a DL model for dog testicular staging was that some parts of the tubules have similar morphologic features in different stages. For instance, stage VIII (DSC = 93.07%) is only identified by the presence of meiotic figures, and the rest of the tubule may look like either stage I or stage VI.
Computerized staging by Creasy et al. 13 in rats and Xu et al. 12 in mice started with a similar approach of defining practical staging criteria before model development. Creasy et al. grouped the 14 stages in rats to have 10 stages/pooled stages, and Xu et al. defined early, mid, and late stages with further dividing the mid-stages to have VI, VII-mid VIII, and late VIII. In both publications, DL-based segmentation models with U-Net architecture played a key role. Creasy et al. used the developed DL models as feature extractors for a decision tree–based classification model for staging, while the stage-specific germ cell quantifications have not been reported in the paper. Focusing on single-stage tubules using a cross-section is reasonable in rats and can be done by removing longitudinal tubules from the data sets. 13 However, with the presence of a high number of longitudinal tubules in dog testes regardless of the section planes, our model had to perform the staging on multistage longitudinal tubules as well as single-stage tubules (Figure 7).
The frequency of each spermatogenic stage was reported in dogs in literature.1,10 Russell et al. 1 counted 755 tubules from one dog, and Soares et al. 10 showed similar stage frequency based on at least 250 tubules per animal for five beagle dogs. For calculating the stage frequency generated by the DL model (prediction in Figure 8), we used all the tubular area of 16 WSIs from eight animals (approximately 20,000 tubules), which was a much larger sample size compared with the published data. In addition, we calculated the frequency by the area rather than the total number of tubules because each tubule can be of various sizes and have multiple stages. Therefore, the frequency of each stage by counting the limited number of tubules may not be representative of a whole testis. We noticed a lower frequency (<5% difference) of stages VI-VII in our data compared with the other publications.
Stages VI and VII were previously defined by the nuclear morphology of spermatids based on the ratio of the shortest axis to the longest axis at 1: 1.3 (stage VI: <1.3 and stage VII: >1.3) 1 or 1:3 (stage VI: <3 and stage VII: ≥3). 10 Interestingly, these authors with different criteria for the ratios showed similar frequencies of stages VI and VII. In our measurement (data not shown), the nucleus of the spermatid with the ratio of 1:1.3 has nearly round nuclear appearance, and the ratio of 1:3 might be more practical to distinguish step 6 spermatids from step 7 spermatids based on H&E slides. Differences between tubules in late-stage V and early-stage VI were not clearly distinct. In late-stage V, most of the elongated spermatids were already released, and stage V looked similar to early-stage VI due to having a single generation of spermatids and sometimes the presence of steps 5 and 6 spermatids within the same tubule. This note was contrary to Russell et al., 1 describing tubules in stage V with many remaining elongated spermatids (step 12 spermatids) in the lumen. In rats, many elongated spermatids are still present in the lumen of tubules in stage VIII, whereas there are no or a few remaining elongated spermatids in stage V in dogs. Our observations were consistent with Soares et al., 10 showing that only round spermatids are present in stage V in dogs. Spermiation started in stage IV in some tubules. In early-stage V, nuclei of round spermatids were centrally located in the cytoplasm. However, later in stage V, the nucleus of the spermatid moved toward the cytoplasmic membrane, and the nuclear location in respect to its cytoplasm was eccentric, which is similar to stage VI. In stage VI, the spermatid nuclei started to elongate. Step 6 spermatids can be distinguished from step 5 spermatids by their ovoid to elongated shape and condensed nucleus. All the spermatids found in stage VI were called elongated spermatids (see model 2 postprocessing step 5 in “Methods” section), although early step 6 spermatids have ovoid nuclei. This clear criterion helped the DL model to distinguish those subtle differences with a very low confusion between round and elongated spermatid detection (Table 5). Only 1.5% of elongated spermatids were falsely called round spermatids mainly due to cross-sections of the nuclei, and 0.1% of round spermatids were falsely called elongated spermatids.
Russell et al. 1 stated that residual bodies were formed in elongated spermatids in stage IV. However, Soares et al. found the residual bodies were in stage III. 10 In our observations, a small number and size of residual bodies started to be seen as early as stage III and became more pronounced in stage IV. For image analysis, stages III and IV were grouped together, and this difference did not affect the performance of automated spermatogenic staging. Residual bodies can be similar to elongated spermatids in size and location but different in tinctorial appearance and often smaller in size. The residual bodies were labeled as background during annotation, and any false detection of residual bodies as elongated spermatids was changed to the background based on their darker staining (see model 2 postprocessing step 7 in “Methods” section). The small residual bodies (area <2 µm2) were removed from elongated spermatids in step 3 of the pos-processing in model 2. The DL model has shown high-performance metrics in elongated spermatids (DSC = 98.07%, Table 6) with the least confusion with residual bodies (stages III-IV in Figure 9). It should be noted that model 2 postprocessing step 2 helped separate the elongated spermatid clusters; however, in rare cases, separating them was impossible, imparting a negligible error in elongated spermatid counts. Thinner sections might help to achieve a higher resolution with more clear boundaries on elongated spermatids.
The DL model detected SG/PL by defining them as cells with their nuclei similar to round spermatids in size and morphology but located near the basement membrane. The model had a high performance in detecting SG/PL (DSC = 92.81%, Table 6), and only 0.1% of round spermatids were confused with SG/PL (Table 5). Leptotene, zygotene, and pachytene spermatocytes and Sertoli cells were not confused with SG/PL as those cells have larger nuclei, and/or their nuclei are located slightly away from the basal membrane. The model detected the highest number of SG/PL in stages IV and V (Figure 11) because the preleptotene spermatocytes were mostly present at these stages. Due to the fact that Sertoli cell morphology can be hard to distinguish in H&E sections, they were not annotated and removed by the model (part of the background class). Distinguishing preleptotene spermatocytes from early leptotene spermatocytes is sometimes challenging on H&E sections. This might have contributed to the false detection of 3% of SG/PL as other types of spermatocytes (Table 5).
Spermatocytes were mostly pachytene spermatocytes, but leptotene, zygotene, diplotene, and secondary spermatocytes were also included in the detection by the DL model. The model had high performance in spermatocyte detection (DSC = 95.71, Table 6). The DL model readily detected pachytene spermatocytes due to their distinct morphological features. However, some secondary spermatocytes (5.1%, Table 5) were falsely detected as round spermatids because of the similarity of secondary spermatocytes to round spermatids. In our staging criteria for DL model development, stage VIII is only recognized by the presence of meiotic figures, which is the most commonly used criteria by pathologists. During this stage, diplotene spermatocytes undergo meiotic division to become round spermatids via secondary spermatocytes. Some secondary spermatocytes were indistinguishable by the DL model and counted as round spermatids. To date, no quantitative histological analysis of round spermatids was published in dogs, but newly formed round spermatids were frequent in stage VIII. The number of newly formed round spermatids and secondary spermatocytes was relatively high, as seen in our germ cell quantification (Figure 11). In dogs, meiotic figures might be present during the proliferation of round spermatids longer than was previously thought. This observation is consistent with the publication by Soares et al. 10
In model performance (Table 6), meiotic figures showed a high sensitivity (94.63%) but low precision (83.93%). This means that even though the model was good at detecting meiotic figures, there were a few false detections of other cell types as meiotic figures. Most of these false positives in meiotic figures happened on the rare occasions that the model predicted secondary spermatocytes and early round spermatids as meiotic figures. In rare cases, zygotene spermatocytes were also confused with meiotic figures by the DL model. We remedied this false detection by changing the meiotic figures in tubules that are not in stage VIII to spermatocytes (see postprocessing step 6 in “Methods” section).
Hypoplasia and hypospermatogenesis are common incidental testicular findings in young beagle dogs. 5 The DL model for staging was able to exclude tubules with hypoplasia and hypospermatogenesis at high grades of severities. In addition, the DL model performed staging accurately when there was minimal to mild hypospermatogenesis.
Application of Automated Staging and Germ Cell Detection
Our DL models for spermatogenic staging and germ cell segmentation were only trained and tested on control dogs, and the performance of DL models in treated animals has yet to be reported. This is similar to other published papers providing computerized spermatogenic staging in control rats 13 and mice. 12 However, we are currently working on studying the treated animals using our DL models (data not shown) and the automated staging and detection of germ cell types in control dogs can be applied to treated animals in a toxicity study unless the morphologic changes are too severe to identify stages. The stage-aware evaluation may not be necessary or possible for detecting testicular toxicity with overt changes. The automated spermatogenic staging is beneficial for pathologists to perform the stage-aware evaluation of testicular toxicity since the overlay of color-coded stages and germ cells can be seen even at low magnification. The overlays can be more practical in the evaluation of subtle changes such as minimal germ cell depletion, and in such cases, stage-specific quantification of germ cells may provide valuable information to pathologists. It becomes particularly important in short-term toxicity studies where testicular changes can be present only in certain germ cell types and stages. Reduced testosterone in the testes is known to induce stage-specific germ cell changes, including loss of pachytene spermatocytes and round spermatids in stages VII, VIII, and XVI and spermatid retention in stages VIII/IX in rats. 23 Stage-specific germ cell changes were also observed in dogs as loss of preleptotene spermatocytes in stage V tubules in animals given an antimitotic agent. 24 As an example, given the color-coded annotations of selected stage V and SG/PL (Figure 10), pathologists can focus on such a preselected color-coded germ cell and stage for further evaluation without looking for the stage of interest at high magnification. SG/PL are difficult to assess in dogs due to variable numbers and difficulty to identify these cells. If the total number of germ cells was counted without specifying the selected stage, loss of preleptotene spermatocytes could be undetectable by the quantitative analysis because the majority of the germ cells may not be affected in other stages in short-term toxicity studies. Furthermore, released elongated spermatids in most stage V tubules and partially released elongated spermatids in some stage IV tubules can be confused with a drug-induced reduction in germ cells if the number of elongated spermatids is assessed without the knowledge of the stage. Color-coding of the stages and germ cells is fully automated with minimal manual intervention and is beneficial for pathologists to perform the stage-aware evaluation of the testes. Stages and the patterns of germ cells are readily visible by color-coding; thus, a missing germ cell population is easily recognizable even at a lower magnification.
Pooled stages I-II, III-IV, and VI-VII were applied to the DL model because (1) the morphology of spermatids was similar in these stages, (2) the continuity of spermatogenic cycle can make the staging difficult for some tubules that are in between stages, and (3) the multistage tubules can be minimized by pooling these stages. However, combining these stages can still identify key stage-specific events of maturation (stage I/II and III/IV), spermiation (stage V), elongation of spermatids (stage VI/VII), and meiotic division (stage VIII). Germ cells are observed in specific stages often more than one stage (see Figure 3), and these combined stages are useful for quantification of stage-specific germ cell population as demonstrated in the results of germ cell quantification (Figures 11). For example, round spermatids are present in stages I-V, and preleptotene spermatocytes are mainly observed in stage V. Therefore, our DL models, trained on combined staging system, can quantify the germ cell subpopulations present in specific stages. Preleptotene spermatocytes are major population of segmented SG/PL in stage V. Quantification of SG/PL in stage V can reflect the number of preleptotene spermatocytes, which is important in the testicular toxicity as discussed previously in the current study.
In conclusion, we characterized each stage of the seminiferous tubular spermatogenesis cycle using standard H&E slides, which is helpful for pathologists performing stage-aware evaluations of dog testes in toxicity studies. We demonstrated that the staging process can be automated by the DL model with high accuracy (overall DSC = 94.39%), thereby reducing the pathologist’s work while maintaining high sensitivity. Once the H&E slides are scanned, the image analysis can run in the background with little involvement of manual work. In addition, the quantitative data on stage-specific germ cell populations might provide decision support to pathologists assessing testicular toxicity, in conjunction with the evaluation of standard H&E slides.
Footnotes
Appendix
A series of image processing–based steps were used for the postprocessing of our staging model (model 1):
Although the input for the DL staging model (model 1) was used at 20X magnification, the postprocessing steps were performed at 10X magnification. Lower magnification for postprocessing lessens the algorithm run time, while the DL model can use a higher magnification as needed. Furthermore, the larger field of view during postprocessing can decrease the number of tubules that fall into the undetermined category, as explained above in step 3 for being on the edge of the tile.
The germ cell segmentation model (model 2) also used a series of postprocessing steps:
We have used the morphological image-processing algorithms, 25 such as fill holes, dilation, erosion, changing by shape, or change nearest. They take the classified labels by the DL model as the input. Changing the objects’ label based on its size was performed by “change by shape” postprocessing step. “Change by ROI” is an image-processing step that considers the relationship between the ROIs outlined by model 1 (tubular stages) and the labels created by model 2 (germ cells). Therefore, it uses both the ROIs and the labels as the input and changes a specific label in a specific ROI. The inputs for “change by intensity” are both the labels from DL model and the intensity of pixels in the original image. It changes the objects that have an average intensity higher or lower than a threshold. All postprocessing steps were implemented in Visiopharm using the parameters outlined in Table 2.
The rationale for postprocessing steps 3-7 is provided in the “Discussion” section. The magnification for postprocessing steps of model 2 was at 40X, which was the same as the magnification of input images for the DL model. The high magnification ensured the high resolution for the boundary of smaller cells, particularly elongated spermatids.
Acknowledgements
The authors would like to thank Justin Vidal of Charles River Laboratories for consultation and reviewing the manuscript. We also thank Bhupinder Bawa, Magali Guffroy, Lauren Himmel, and Erik Hagendorn of AbbVie for their support of the research and review of the manuscript. We appreciate AbbVie histology scientists generating histology materials and scanning the slides.
Declaration of Conflicting Interests
The author(s) declared the following potential conflicts of interest with respect to the research, authorship, and/or publication of this article: The authors are employees of AbbVie and may own AbbVie stocks.
Funding
The author(s) disclosed receipt of the following financial support for the research, authorship, and/or publication of this article: AbbVie sponsored and funded the study; contributed to the design; participated in the collection, analysis, and interpretation of data, and in writing, reviewing, and approval of the final publication.