
Abstract
Integrating clinical pathology data with anatomic pathology data is a common practice when reporting findings in the context of nonclinical toxicity studies and aids in understanding and communicating the nonclinical safety profile of test articles in development. Appropriate pathology data integration requires knowledge of analyte and tissue biology, species differences, methods of specimen acquisition and analysis, study procedures, and an understanding of the potential causes and effects of a variety of pathophysiologic processes. Neglecting these factors can lead to inappropriate data integration or a missed opportunity to enhance understanding and communication of observed changes. In such cases, nonclinical safety information relevant to human safety risk assessment may be misrepresented or misunderstood. This “Points to Consider” manuscript presents general concepts regarding pathology data integration in nonclinical studies, considerations for avoiding potential oversights and errors in data integration, and focused discussion on topics relevant to data integration for several key organ systems including liver, kidney, and cardiovascular system.
Keywords
This “Points to Consider” article is a product of a joint working group of the Scientific and Regulatory Policy Committee (SRPC) of the Society of Toxicologic Pathology (STP) and the Regulatory Affairs Committee (RAC) of the American Society for Veterinary Clinical Pathology (ASVCP). It has been reviewed and approved by the SRPC and Executive Committee of the STP and reviewed by the RAC and general membership and Executive Board of the ASVCP, but it does not represent a formal Best Practice recommendation of either scientific Society; rather, it is intended to provide key “Points to Consider” in designing nonclinical studies or interpreting data from toxicity and safety studies intended to support regulatory submissions. The points expressed in this document are those of the authors and do not reflect views or policies of the employing institutions. Readers of Toxicologic Pathology and Veterinary Clinical Pathology are encouraged to send their thoughts on these articles or ideas for new topics to the Editor. This article has been reviewed and endorsed by the European Society of Toxicologic Pathology (ESTP) and the British Society of Toxicologic Pathology (BSTP)
Introduction
Clinical pathology (CP) and anatomic pathology (AP) data are collected as part of the standard in-life and terminal assessments in nonclinical (preclinical) toxicity studies. These endpoints provide information on potential safety issues in humans and/or animals associated with new drugs and other molecules in development (chemical entities and biologics, xenobiotics, vaccines, industrial chemicals, pesticides, and others; hereafter referred to as test articles). Ideally, interpretation of the CP and AP data sets is performed by qualified personnel (e.g., preferably by board-certified clinical and anatomic pathologists), based initially on the extent of study data/interpretations available at the time. As additional data become available (e.g., toxicokinetics and clinical observations), the interpretation of CP, AP, and other relevant data can then be revised as appropriate before being submitted to the appropriate regulatory authorities as part of a comprehensive safety assessment report. As part of this process, it is preferable to integrate the interpretation of the pathology data with other study data to the extent possible.1-4 This integrative approach ultimately provides a more complete understanding of the toxicity profile of the test article, particularly regarding adverse effects and impact on human safety risk assessment, and results in improved communication to project development teams, regulatory agencies, and clinicians.
Pathology data, including both CP and AP, are closely interconnected endpoints that reflect different aspects of the same pathophysiologic processes. Consequently, integrated review of these data allows for comprehensive interpretation of potential test article–related changes, or the lack thereof, with important advantages over interpreting each data set in isolation. An integrated approach enables grouping of changes of similar mechanism or within an organ system. In contrast, presenting a litany of observations with limited or no interpretation of their importance, causality, or inter-relationship may obscure key mechanistic associations. For example, identification of a change in a serum biomarker that reflects cellular injury in a particular tissue can generally be explained when coupled with a histopathologic change of degeneration/necrosis in that tissue. Conversely, histopathology changes may also be interpreted in the context of CP changes that can influence formation or characteristics of a lesion (eg, a paucity of leukocytes within a septic focus in an animal with profound leukopenia). An additional advantage of the integrative approach is the potential identification of noninvasive biomarkers (eg, analytes in serum, plasma, or urine) that may be valuable for clinical monitoring of a potential safety issue, assuming the toxicity and biomarker response are anticipated to be translatable to humans. Examples may include urinary renal injury biomarkers or cardiac troponins, which are discussed in more detail in subsequent sections.
Importantly, CP and AP data relationships are influenced by a variety of factors, including but not limited to intrinsic inter-relationships between tissues and body fluids, differing sensitivities and specificities of various endpoints for identifying pathologic processes, and the influence of study design variables (such as the timing of sample collection). The interaction of these factors on an individual study basis and even in individual animals contributes to a high degree of agreement between CP and AP observations in some cases but not in others, highlighting one of the predominant challenges for the toxicologic pathologist in pathology data integration. To navigate these challenges and for effective data integration and human safety risk assessment and mitigation to occur, pathologists and other scientists involved in study data interpretation must understand pathophysiologic and analytical factors relevant to the data and must have the opportunity to communicate with each other to form a cohesive narrative of the relevant findings. Neglecting these factors may result in integration of findings that are unrelated or a failure to identify a relationship that provides a mechanistic understanding of an observed toxicity.
To highlight key considerations relevant to the integration of CP and AP data and to address some of the challenges encountered in this process, a joint working group of the Society of Toxicologic Pathology’s Scientific and Regulatory Policy Committee and the American Society for Veterinary Clinical Pathology’s Regulatory Affairs Committee was formed. The working group consisted of anatomic and clinical pathologists employed in the biopharmaceutical industry and in contract research organizations. This “Points to Consider” manuscript authored by the working group highlights the relationships among CP, AP, and other study data that are routinely integrated during the reporting process and discusses practical considerations for communication among pathologists that may facilitate data integration. General concepts regarding pathology data integration are presented, along with focused discussions of data integration concepts pertinent to key organ systems. In addition, strategies for recognizing and avoiding potential oversights and errors in data integration that may lead to incomplete, unclear, or invalid conclusions are discussed. This content will be of value to toxicologists, regulatory scientists, pathologists, and others who are involved in the conduct and reporting of nonclinical studies and their implications for human risk assessment.
Scope of Data Commonly Included in Pathology Integration
Standard nonclinical toxicity study designs generally include the assessment of a core set of CP (hematology, coagulation, clinical chemistry, and urinalysis test data) and AP endpoints (organ weights, gross pathology, and histopathology data), summarized in Table 1. These endpoints may vary based on a variety of factors including class of the test article (eg, small molecule versus vaccine), specific objectives of the study, and stage of nonclinical or clinical development, among others. Additional pathology endpoints that may be encountered on a case-by-case basis include specialized blood or urine biomarkers (e.g., serum cardiac troponins and renal injury biomarkers, respectively), immunohistochemistry, and electron microscopy. In the context of CP and AP data integration, it is most common to integrate CP endpoints with other CP endpoints (e.g., associating acute phase serum/plasma protein changes with an inflammatory leukogram) and with histopathology (e.g., interpreting blood cell counts in the context of bone marrow histopathology findings or hepatobiliary enzymes in the context of liver histopathology findings). The CP data may also be integrated with macroscopic pathology data (e.g., gastric luminal fluid distension and changes in serum electrolytes). Other nonstandard but commonly measured endpoints, including cytokines and immunophenotyping, are closely related to routine CP data but are often reported separately when analyzed. The interpretation of these endpoints may be integrated with CP and AP data in CP and AP contributing scientist reports (CSRs) when appropriate, or they may be interpreted in a separate CSR and integrated with pathology and other study data in the integrated main study report.
Standard clinical pathology and anatomic pathology endpoints in nonclinical general toxicity study designs.
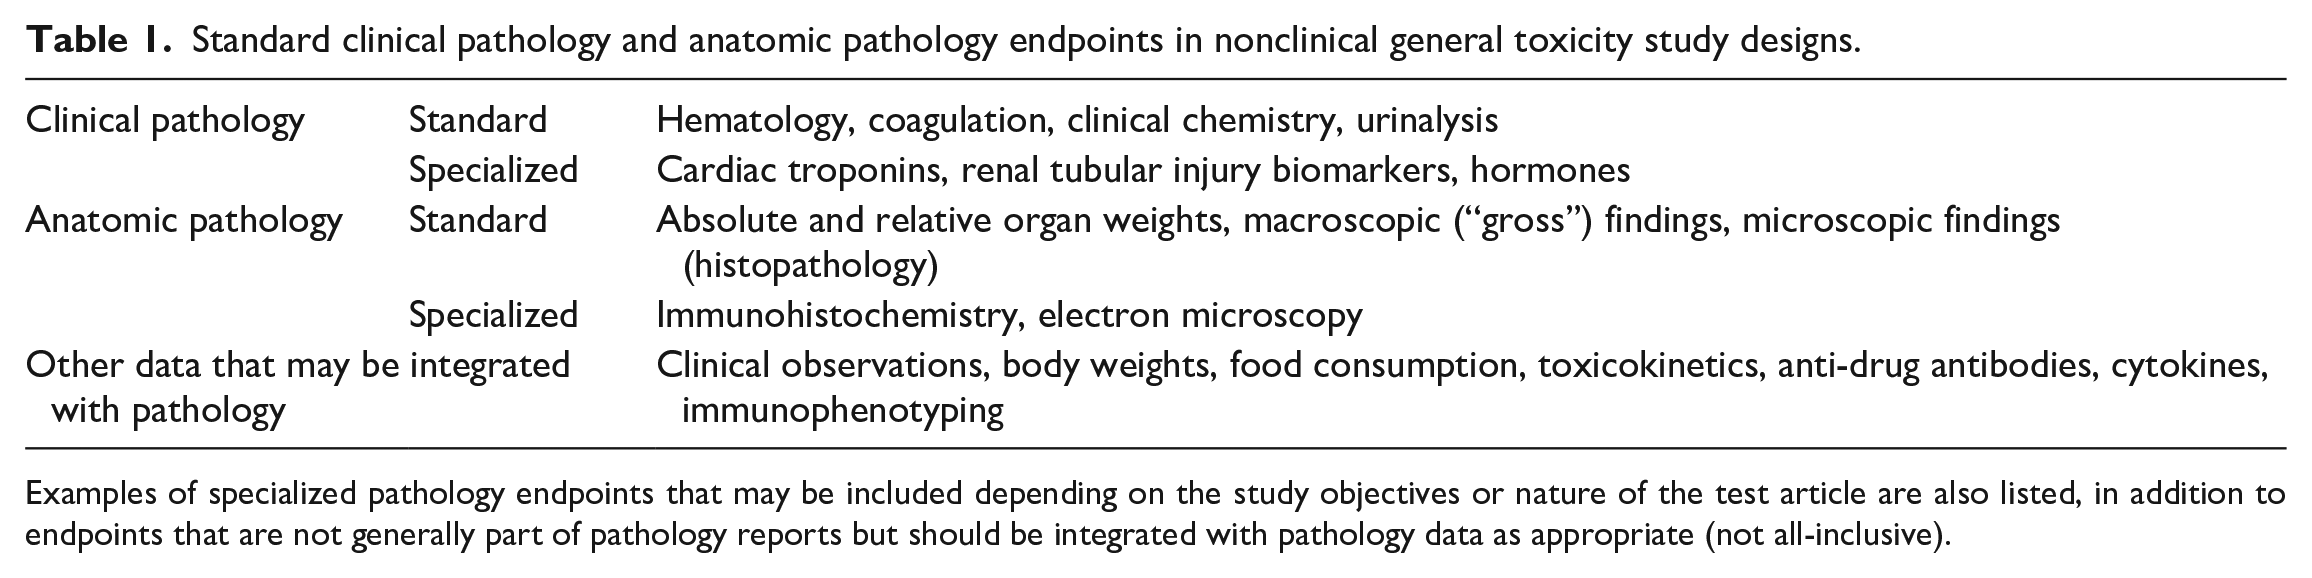
Examples of specialized pathology endpoints that may be included depending on the study objectives or nature of the test article are also listed, in addition to endpoints that are not generally part of pathology reports but should be integrated with pathology data as appropriate (not all-inclusive).
While the integration of pathology data is the focus of this manuscript, it is the responsibility of the pathologists and other scientists to also evaluate potential relationships between pathology data and other (nonpathology) study data, including body weights, food consumption, clinical observations, toxicokinetics, antidrug antibody (ADA) data, and other data as appropriate. For example, clinical observations of frequent vomiting and diarrhea in a dog oral gavage study provide a plausible explanation for CP changes consistent with dehydration and electrolyte alterations. Similarly, in the case of unexpected attenuation of a pharmacodynamic or toxicologic effect, and/or histopathologic changes suggestive of immune complex–related tissue injury, assessment of toxicokinetic and ADA data for evidence of clearing and/or neutralizing antibodies may contribute to a weight of evidence interpretation involving the immunogenic nature of the test article. Such considerations both within and outside the pathology discipline are essential to establishing appropriate data integration and overall interpretation of findings in the context of the study.
Pathologist Communication and Reporting Considerations
Sound interpretation and integration of pathology data rely not only on the respective clinical and anatomic pathologists to effectively evaluate and summarize all relevant study data but also on the opportunity for pathologists to engage in productive communication regarding the interpretation of these data. 3 The CP and AP report contributions should be clear and concise and, to the extent possible, should integrate study results, explain any test article–related effects (on-target, off-target, and secondary effects), differentiate test article effects from effects related to the particular animal model or background/procedure-related findings (if applicable), elucidate possible pathophysiologic relationships, and identify potential adverse effects.1,4 However, some variation in approach and style can be expected among reports from different individuals and organizations.1,4 Furthermore, the study design and study data may also influence the format of the CP, AP, and overall toxicology reports on a case-by-case basis (e.g. based on the presence or absence of a control group, poor tolerability or high proportion of early decedents, etc.), and consistency of format among individual reports will likely enhance the reader’s understanding of the study results.
In good laboratory practice (GLP)-compliant studies, separate CP and AP CSRs are generated unless one individual scientist is responsible for both the CP and AP phases of the study. The CP CSR provides all pertinent information related to CP data evaluation (methodological information may be abbreviated with a reference to the study protocol), the tabulated individual and summary data, and interpretation of these data, and the same is true of AP information in the AP CSR.1,4 Communicating CP and AP interpretations within separate CSRs can provide some logistical advantages (e.g., scheduling reporting timelines and addressing report revisions). However, this approach can also result in potentially conflicting interpretations or misalignment of overall conclusions if there is limited or no communication among pathologists. Consequently, the clinical pathologist and anatomic pathologist must ensure that both interpretations are aligned, including confirming alignment following edits to either draft prior to signing the reports. Some institutions may prefer to discuss relationships among CP and AP in only one of these CSRs (ie, the CP report or AP report), which may limit the possibility of inconsistent interpretations among reports, although pathologist communication remains a critical step in ensuring accurate data integration.
In some non-GLP studies, an integrated pathology report combining both CP and AP results may be authored and signed by both the clinical and anatomic pathologist. 4 Potential advantages of the integrated report approach in this context include facilitating dialogue among the pathologists regarding pathophysiology and appropriate data integration, and the presentation of all integrated pathology data in a single location may provide a more cohesive interpretation for the reader, particularly for changes or processes considered to be adverse. 4 In some cases, integration of CP data, AP data, and other study data may occur only at the level of the integrated main study report. However, it is critical that the study pathologists and other contributing scientists be actively involved in this process to provide appropriate subject matter expertise to the study director regarding potential associations among data sets. In particular, an end-of-study data review/data integration meeting is an excellent forum for the study director, pathologists, and other study scientists to discuss key findings and their relationships, and to develop a more holistic understanding of the study results. Such discussion also provides an opportunity for the study director to gather feedback from the relevant study subject matter experts that aids in setting the study No Adverse Effect Level (NOAEL) and/or identifying dose levels associated with severe toxicity for determination of the Highest Non-Severely Toxic Dose (HNSTD) or Severely Toxic Dose in 10% of Animals (STD 10), when applicable.
Factors to Consider for Integrating CP and AP Data
General Concepts
There are numerous, often complex and intertwined, factors that must be considered during pathology data integration to reach accurate conclusions regarding test article–related changes and their potential interrelationships. Data integration must be approached thoughtfully and judiciously, as overzealous attempts to consolidate pathology changes under a single mechanism to “make everything fit” can lead to inaccurate associations that may not be scientifically justified. Conversely, an overly strict approach in evaluating the concordance of CP and AP findings on an individual animal basis may cause one to dismiss an actual relationship among endpoints or lose sight of the overall pathophysiologic process (further discussed below). Furthermore, it is imperative that clinical and anatomic pathologists seek to differentiate and communicate changes that are primary effects (on-target or off-target) from those that are secondary (e.g., changes related to physiologic stress, clinical condition, or a physiologic response to a primary effect) and focus the narrative on an integrated discussion of primary findings that have the greatest impact on assessment of human safety risk. Even when making scientifically justified associations among data sets, a list of all potentially associated changes without interpretation or prioritization of toxicologic/physiologic relevance is not recommended. The absence of this context can obscure the most important findings and cause project teams and regulators to misdirect focus to changes that are downstream of the primary process.
A discussion of all CP and AP endpoints is beyond the scope of this manuscript. However, illustrative examples of general concepts are presented, including focused discussions on concepts pertinent to key organ systems including liver, kidney, and heart/cardiovascular system.
Recognizing and understanding biologic variability
Biologic variability of a single analyte or panel of CP analytes should be considered when reviewing and integrating pathology data. In healthy animals, many CP values have a wide physiologic range of values as their concentrations are not homeostatically regulated. However, others are maintained within a narrow range, and even seemingly minor perturbations may result in systemic effects and/or death. Importantly, while small increases or decreases in tightly regulated parameters such as electrolytes (e.g., potassium, chloride, sodium, ionized calcium, and bicarbonate) may result in altered homeostasis, they generally lack associated histopathologic changes. For example, a large decrease in serum potassium may be associated with muscle weakness, whereas an increase in potassium could result in cardiac arrhythmia, neither of which consistently have an associated histopathologic finding (depending on the mechanism of the change). The circulating concentrations of many other analytes are not intrinsically regulated, and even a large change does not impact health directly but rather serves as an indicator of an underlying process. Example of these analytes include serum hepatocellular or hepatobiliary enzymes (e.g., alanine aminotransferase [ALT], aspartate aminotransferase [AST], alkaline phosphatase [ALP] and/or gamma glutamyltransferase [GGT]), and structural proteins such as cardiac or skeletal troponin. Alterations in these analytes may indicate a tissue response to insult or injury and/or often have associated histopathology findings. However, one must approach the interpretation carefully as small changes in these analytes in the absence of a histopathology change may simply reflect biologic or procedure-related variation and not a test article–related pathophysiologic change. 5
Understanding the dynamics and time course of endpoints measured in peripheral blood and body fluids
Knowledge of the circulating half-lives or cellular lifespan of commonly assessed CP endpoints is critical in understanding the time course of observed changes and applying this information to appropriately identify potential relationships between CP and AP data. For example, skeletal muscle injury commonly produces increased serum creatine kinase (CK) and AST activities and skeletal troponin I concentration. If blood is sampled 3 to 4 days after the injury, increased AST may be the only change present because CK and troponin each have a much shorter half-life than AST.6-8 The time required to return to baseline values also depends on the relative severity of the tissue injury and, consequently, the extent of release of intracellular biomarkers from damaged cells. Such relationships can be important for integration with AP data in that a histopathology finding in skeletal muscle (e.g., degeneration/necrosis) may lack an associated serum enzyme change if the injury was transient and is recovering (e.g., evidence of regeneration). Likewise, acute bone marrow toxicity is not expected to cause instantaneous decreases in red blood cell (RBC) mass given the relatively long lifespan of RBCs (e.g., approximately 1.5-2 months in rodents and 3-4 months in large animal species). 5 However, it will generally be associated with more immediate decreases in absolute reticulocyte and neutrophil counts, given their shorter lifespans and faster turnover. If the duration of the toxic insult is brief, RBC mass may be unaffected or only minimally affected. However, if the toxic insult is prolonged or there are other concurrent toxic effects, continued inhibition of hematopoiesis eventually results in a decrease in RBC mass and the recovery of the bone marrow effect will generally precede the recovery of peripheral RBC mass due to the time required to produce sufficient numbers of mature cells.
It is also important to recognize that analyte half-lives and cellular lifespans often vary among species, which may dramatically impact the time course of observed changes. For example, decreased erythropoiesis is generally associated with earlier changes in RBC mass in rats relative to dogs or monkeys because rodent RBCs have shorter circulating lifespans.9-11 Furthermore, in rodents, a markedly decreased absolute reticulocyte count is often the best early evidence of direct bone marrow toxicity because of the normally relatively high absolute reticulocyte counts and high rate of reticulocyte synthesis in these species, in contrast to dogs and monkeys that have much lower baseline reticulocyte counts. 5 Conversely, a markedly decreased absolute neutrophil count may be the best early evidence of direct bone marrow toxicity in dogs and monkeys, given the relatively higher baseline neutrophil counts compared to rodents. Following bone marrow injury, the timing of histopathology assessment relative to the initiating injury must be considered, as this will impact the histopathologic appearance of bone marrow at a given time point. One must also recognize the potential subjectivity and variability of bone marrow cellularity assessment via histopathology, and complete interpretation of hematopoiesis should encompass hematology data and histopathologic examination of bone marrow and extramedullary hematopoietic tissues (e.g., spleen). 5 Consequently, recovery of the bone marrow following a toxic insult is best assessed by serial hematology evaluation in combination with the histopathologic appearance of bone marrow and extramedullary hematopoietic tissues (See Example #2). Cytologic examination of bone marrow is also pursued in some cases to further characterize changes in hematopoiesis but rarely adds value in the authors’ experience if limited to determination of myeloid: erythroid ratios without assessment of maturation progression and overall interpretation in light of hematology data.
Recognizing the impact of preanalytical variables
As discussed in numerous publications, control of preanalytical variables in a well-designed study is of critical importance in differentiating procedure-related changes from test article–related changes, and avoiding the occurrence of procedure-related intergroup differences (block effects) that may confound interpretation or appear as a test article–related effect.12-16 Common preanalytical variables that may have a notable impact on CP data include lack of standardization of blood collection, inconsistent fasting status, and variability in handling/restraint (frequency, duration, or type). For AP, tissue processing artifact, fasting status, or autolysis due to delayed tissue collection may increase variability and confound interpretation. Furthermore, interobserver subjectivity may influence variability of gross pathology data. When these factors are not well-controlled, intergroup differences may emerge that can appear as test article–related changes but in fact are unrelated to test article administration. 16 With careful attention to experimental design and investigation of study records, such effects can often be traced back to the inciting cause and correctly identified as a preanalytical or process-related effect with ultimately no impact on overall study data interpretation or the nonclinical safety profile of the test article. However, sometimes this assessment can be challenging or the potential preanalytical effect may be overlooked. For example, increases in AST and ALT activities associated with handling or restraint procedures are particularly common in nonhuman primates, 17 but could be inaccurately attributed to liver injury if the potential procedure-related muscle effect is not recognized or confirmed by an increased CK activity. If an unrelated histopathologic change in the liver is also observed in the study (e.g., hepatocellular hypertrophy), the aminotransferase increases could be incorrectly attributed to the unrelated and adaptive histopathologic change and incorrectly conclude that there is hepatocellular injury.
Data concordance at the individual animal level
Although it is ideal for histopathologic and CP findings to have a 1:1 relationship for presence and relative severity at the individual animal level, this is not always the case, particularly in rodent studies. Consequently, it is not appropriate to dismiss a potential association solely based on the absence of an AP/CP relationship for each individual animal. Several reports have discussed lack of association between liver enzymes and liver histopathology findings, as well as the lack of a 1:1 relationship between histopathology and CP signals in laboratory animal studies.18,19 In addition, it is important to consider other variables that may impact the concordance of AP and CP findings, including differences in circulating half-lives of tissue injury markers relative to the timing of tissue collection for histopathology, differences in systemic exposure within a dose group, and differences in the biologic response to a given test article/dose level among individuals. Furthermore, focal or localized organ changes may not always be included in the individual tissue section(s) examined microscopically. These and other factors can contribute to the lack of a 1:1 relationship between test article–related AP and CP effects and necessitate some flexibility in assessing data concordance at the individual animal level. Overall, when a 1:1 relationship for every animal is not present, a weight-of-evidence assessment can be made encompassing overall strength of the data concordance, biologic plausibility of the pathophysiologic relationship among potentially associated findings, and potential impact of other study data.
Relative magnitudes of change and biologic plausibility
One must exercise caution in associating AP and CP findings if the magnitude and nature of the signals are discordant. For many CP and biomarker endpoints, there is generally a direct relationship between the magnitude of CP signals and the severity of the histopathologic effects; however, some CP endpoints may be more sensitive in detecting tissue injury than histopathologic examination. These and other factors emphasize the importance of discussion of the relative severity or magnitude of CP and AP changes between clinical and anatomic pathologists during integrated pathology reporting discussions. In addition, the pathophysiologic process responsible for histopathologic changes and the potential relationship of that process to CP endpoints must be considered when integrating data that may on the surface appear to be potentially related. Integral to this assessment is an understanding of the relationship between CP analytes/biomarkers to various tissues (including their diagnostic sensitivities and specificities), the expected time course of changes following tissue perturbations (discussed further below), and any relevant species differences in the analyte biology or tissue response. As discussed earlier, not every histopathologic change in the liver is directly associated with mildly increased ALT and AST activities. Multifocal mononuclear cell infiltration in the liver is generally not expected to result in increased ALT and AST activities and/or increased proinflammatory endpoints (e.g., acute phase proteins and cytokines); however, the increased enzyme activities and leukocyte infiltration may be inaccurately linked in the absence of overt hepatocellular injury (e.g., degeneration/necrosis) if nonlethal, reversible mechanisms of ALT and AST release are not considered.
Timing of data collection
Another common challenge associated with CP and AP data integration arises when serial CP data are collected throughout the course of a study and integrated with AP data collected at the completion of the study, as is common in many nonclinical toxicity study designs. All individual CP endpoints have unique timing and kinetic signatures and different responses to various types of injury. It is therefore critical to understand and consider these individual characteristics as well as organ/tissue distribution (as applicable) during CP data interpretation, and even more so when considering the relationship between AP and CP findings (or the lack thereof). In most cases, CP samples are collected at the end of the study at or immediately before euthanasia/necropsy, which minimizes the potential for discrepancy of effects seen in AP and CP endpoints related to differences in the timing of sample collections. However, transient changes in CP parameters occurring early in a study may be difficult to associate with histopathologic or macroscopic changes evaluated days, weeks, or months later. In these cases, several factors must be considered including the potential pathophysiologic relationship between the observed changes, the chronicity of the histopathologic and/or macroscopic changes, and the half-lives of the relevant analytes. For example, if a moderate acute phase response is observed shortly after the initial dose of a biologic test article in a 28-day study but is diminished or absent after subsequent doses, the presence of mild inflammation at the administration site at necropsy may not be associated with that initial transient CP change. In contrast, multiorgan inflammation with systemic cytokine increases would be more likely to be associated with an acute phase response detected at the time of necropsy. For studies in which the final CP blood/urine collections occur at a time that differs significantly from the last dose administration and/or from the end-of-study necropsy date (e.g., several days to weeks), AP and CP findings may not have strong concordance due to differences in the kinetics of the CP change compared to the time course of the histopathologic change.
Given the relatively short circulating half-lives of many biomarkers of pathophysiologic processes such as tissue injury (e.g., cardiac troponins) or inflammation/immunomodulation (e.g., C-reactive protein, cytokines), one must be attentive to using appropriate sampling time points for the analytes of interest to maximize the likelihood of observing associated changes in CP and AP data. Identification of a histopathologic change with no preceding changes in related CP endpoints may raise questions as to the ability to monitor patients for early tissue injury, when in fact the relevant data may not have been collected at time points appropriate to make an association. Of particular relevance to this issue are cytokines, which not only have very short half-lives and circulating concentrations that may be undetectable in health but also represent a generally acute effect that is not typically associated with histopathologic changes that are more chronic in duration. 20
Integration of exposure and ADA data
It is always important to consider both test article exposure and the presence of ADAs when deciding if any given change in CP or AP endpoints is test article–related. Likewise, any association between AP and CP data should also be determined in consideration of these factors. If a change in a CP endpoint and/or AP finding (e.g., organ weight change or histopathologic finding) is observed in the absence of systemic test article exposure (e.g., following ADA-mediated test article clearance), it is less likely that they are test article–related. However, in such circumstances, the integration of CP and AP data may still add value, for example, in constructing a weight-of-evidence interpretation that the changes may be related to immunogenicity and not a direct pharmacologic effect.
Pathology observations for which an associated change in other data may not be expected
It is common for CP changes to occur without associated AP findings. Systemic changes such as electrolyte or serum protein changes secondary to altered hydration status frequently occur without AP changes. Alterations in the concentrations of serum lipids, glucose, and minerals (calcium and phosphorus) are often present without any AP findings and may reflect cellular/tissue functional alterations not associated with morphologic changes at the light microscopic level. In addition, CP evidence of nonspecific inflammatory responses including increased C-reactive protein concentrations and/or altered white blood cell counts may occur in the absence of detectable inflammation in tissue sections, as is sometimes observed in studies with test articles that directly influence cytokine production by immune cells. Changes in CP parameters potentially associated with tissue injury (e.g., increased serum enzyme activities, structural proteins such as troponins, or urinary renal injury biomarkers; discussed in subsequent sections) may also occur in the absence of associated histopathology findings for various reasons. In such cases, stating that an associated histopathology finding was not observed is a common approach, and demonstrates the use of an integrated approach even when an association among study endpoints cannot be made.
There are several tissues for which AP changes are not expected to have an associated change in routine CP analytes based on the lack of a sensitive or tissue-specific biomarker in the CP data routinely collected. Specifically, histopathology findings pertaining to the special senses (eye, ear, and olfactory) as well as the nervous and reproductive systems typically do not result in changes in routine CP endpoints. For the lymphoid system, the relationship of AP data to CP data (e.g., peripheral blood lymphocyte counts) may not be apparent and can be unreliable as peripheral blood lymphocyte counts can be affected by several factors including test article–related changes in lymphocyte trafficking, stress, or excitement.5,21 In addition, minimal focal lesions in organs such as the liver or muscle may not have concomitant CP changes even though CP injury biomarkers for these organs are routinely assessed.
Specific histopathologic alterations such as atrophy generally do not have routine CP analyte changes associated with them (e.g., atrophy of salivary glands or adnexa). In such cases, and particularly if the histopathology change is considered adverse, the absence of an appropriate biomarker may impact the clinical development of the test article depending on the relative biological importance of the tissue/organ in the patient population (e.g., exocrine pancreatic vs. adipose tissue atrophy). However, in the case of adipose tissue atrophy, it is critical to explain the association of the atrophy with the mechanism for the change if possible (e.g., adipose atrophy attributed to undernutrition vs. intended pharmacologic activity of the test article).
Data Integration Concepts Pertinent to Key Organ Systems
Hepatobiliary System
Hepatobiliary biomarker changes may or may not be associated with morphologic changes and vice versa
Morphologic changes in the liver can occur in the presence or absence of an associated clinical chemistry finding because of species differences in liver biology, hepatobiliary marker characteristics (e.g., circulating half-life), timing of sample collection relative to onset or duration of injury and other factors. For example, although ALT is the most common hepatocellular injury marker used in safety assessment, the circulating half-life of ALT differs between species, where ALT circulates for ≥45 to 60 hours in nonrodents, and approximately 6 to 8 hours in rats and mice. 22 Owing to the shorter half-life in rats and mice, morphologic evidence of hepatocellular injury may not be associated with ALT increases in rodents compared with dogs and monkeys. Furthermore, the lobular localization of necrosis can influence the magnitude of ALT increase. For instance, ALT is primarily expressed within the periportal region, thus periportal necrosis is typically associated with larger ALT increases than centrilobular necrosis. 23 Increases in ALT can also appear disproportionately large or small relative to liver histopathology changes in nonclinical studies. For example, drug-induced hepatocellular single-cell necrosis can be associated with significantly larger ALT increases than zonal or even submassive necrosis due to reduced hepatic parenchyma and/or timing of sample collection relative to onset of injury. 23 In contrast, glutamate dehydrogenase (GLDH), another hepatocellular leakage enzyme, primarily expressed in centrilobular hepatocytes, with a larger dynamic range and longer (approximately 24-hour) circulating half-life in rodents can detect hepatocellular necrosis before or even in the absence of a change in ALT activity.
Liver histopathology changes are often heterogeneous, representing diverse pathophysiologic mechanisms that can range from mild changes such as cytoplasmic lipid or glycogen accumulation, to inflammation, or to degenerative changes and necrosis. Increased severity of liver injury often progresses to an increase in the number, complexity, and diversity of morphologic diagnoses, making it difficult to associate clinical chemistry changes with specific morphologic findings. It is relatively common for regulatory scientists to link changes in hepatobiliary markers in nonclinical studies with any liver histopathologic change identified in that study, regardless of biological plausibility or known or defined association. For example, since the liver is involved in metabolic functions such as energy, protein, and lipid metabolism, histopathologic changes such as steatosis or hepatocellular vacuolation and cytoplasmic rarefaction are often integrated with changes in clinical chemistry parameters, particularly serum triglycerides and cholesterol. These opportunistic “associations” may or may not reflect true pathophysiologic relationships, as demonstrated in a large meta-analysis of the relationship between liver histopathology findings and traditional hepatobiliary markers in rats. 23 In this study, more than 3,200 rats were given 182 test articles including classic hepatotoxicants, drugs with known hepatotoxic liability and nonhepatotoxicants. Receiver operating characteristic (ROC) analysis demonstrated clear associations between manifestations of hepatocellular injury such as necrosis or degeneration with increases in ALT and AST activities as well as with total bilirubin and bile acid concentrations, consistent with the inter-relationship between structural hepatocellular injury (necrosis or degeneration) and functional impairment (increased bilirubin or bile acids). Increases in ALT activity without histopathologic evidence of hepatocellular injury can also occur in association with increases in total bilirubin and/or bile acid concentrations, consistent with the role of impaired biliary excretion as both a cause and consequence of liver injury and may be associated with increases in cholestatic enzymes depending on the species. 23
The large size of this data set enabled a second ROC analysis to be performed to assess the relationship between histopathologic changes other than hepatocellular necrosis or degeneration and hepatobiliary marker changes. For the second analysis, all rats in treatment groups given test articles that caused necrosis were excluded from the ROC analysis regardless of whether or not there was histopathologic evidence of hepatocellular necrosis or degeneration in the individual rats (n = 138 test articles, 2,500 rats). Importantly, this analysis demonstrated that hepatocellular hypertrophy (a common manifestation of hepatic drug metabolizing enzyme [DME] induction) is not associated with increases in ALT in the absence of hepatocellular injury (hepatocellular degeneration or necrosis). Also, in the absence of hepatocellular degeneration or necrosis, there was also no relationship between hepatocellular changes such as steatosis, hepatocellular vacuolation, cytoplasmic rarefaction, or inflammation with increases in markers of hepatocellular injury such as ALT, AST, and total bilirubin or bile acids. Thus, these data indicate that absent structural (necrosis or degeneration) or functional (cholestatic) manifestations of liver injury, ALT increases generally do not result from morphologic changes such as hypertrophy, steatosis, cytoplasmic rarefaction, or inflammation. Furthermore, this analysis also demonstrated that there was no relationship between steatosis and changes in serum triglyceride or cholesterol concentrations.
If there is no appropriate histopathologic change associated with an increase in ALT, then the magnitude of ALT increase, presence of dose-response, changes in other CP parameters, and toxicokinetics must be considered when determining relationship to test article or identifying potential hepatotoxicity. For example, handling of animals can cause modest increases in ALT and AST activities (generally up to 2- to 3.5-fold baseline values) in monkeys depending on the length and method of restraint. 17 Similarly, the manner of handling in mice can cause increases in ALT activity, with more than three-fold higher increases in ALT activity in mice picked up by the body than in those picked up by the tail. 24 In general, primary liver injury is typically indicated by larger increases in serum ALT than AST activity because the liver parenchyma has substantially more ALT than AST, in contrast with muscle which has proportionally more AST than ALT. 25 Small, statistically significant increases in ALT activities can appear to be test article–related in nonclinical studies, requiring understanding of the biological variability of ALT for that test species. Serum ALT activity increases, in the absence of histopathologic findings or other clinical chemistry changes indicative of liver injury should be assessed in parallel with AST activity and should be of a sufficient magnitude relative to concurrent control values to exclude causes such as biological variability or procedural effects to be attributed to liver injury.
Species differences must also be considered when interpreting liver biomarker data or integrating liver histopathology changes with changes in structural injury markers including ALT or GLDH for hepatocellular injury, ALP or GGT for biliary epithelial injury, or functional markers such as bilirubin or bile acids. Serum ALP circulates as various tissue and species-specific isoenzymes; however, total serum ALP activity is typically measured in toxicity studies. In rodents, ALP is not a useful marker of biliary injury or cholestasis because the intestinal isoenzyme is the main source of serum ALP activity. Gamma glutamyltransferase is also a poor indicator of cholestasis in rodents because of low baseline activity in serum due to low hepatic GGT activity and a short circulating half-life of as little as 30 minutes.26-28 In rats, morphologic manifestations of biliary injury such as biliary hyperplasia that is not associated with degenerative changes in bile ducts or hepatocytes are generally not associated with changes in ALP or GGT activity. 23 In contrast, the circulating half-lives of the intestinal isoenzymes of ALP in dogs and monkeys are extremely short; thus, in mature animals without bone disease, ALP increases are generally interpreted to be of biliary origin. Histopathologic findings for cholestasis in dogs and monkeys include canalicular bile plugs or ductular bile pigment; however, rats typically do not show canalicular or ductular bile pigment accumulation. In the authors’ experience, histopathologic findings suggestive of cholestasis in rats can include mixed (granulocytic and mononuclear) portal infiltrates and Kupffer cell changes (nonheme pigmentation, hypertrophy, and/or hyperplasia) as morphologic changes associated with biochemical changes, most notably increased total bilirubin.
Induction of phase I DME is relatively common in nonclinical safety assessment. The classic histopathologic manifestation of hepatic DME induction is hepatocellular hypertrophy, particularly in the centrilobular region. 29 Older studies of hepatic microsomal enzyme inducers including glucocorticoids, phenobarbital, peroxisome proliferators, or ethanol in rats and dogs suggested that hepatic DME induction was the cause of increases in ALT activities in liver and/or serum, generally with larger activities of ALT, GGT, or ALP in the liver parenchyma than in serum. 30 However, many of these compounds caused histopathologic changes including hepatocellular cytoplasmic rarefaction/glycogen accumulation, single-cell necrosis, peroxisome proliferation, and cholestasis in addition to hepatocellular hypertrophy. As described above, ordinary hepatocellular hypertrophy alone is not a cause of increased ALT activity in serum. For example, in rats given known hepatic DME inducers where microsomal DME induction was confirmed by hepatic cytochrome P450 mRNA expression (17 compounds given to 254 male Sprague–Dawley rats), induction of phase I metabolizing enzymes was associated with increased liver weights and hepatocellular hypertrophy; however, serum ALT activity was only increased in the rats that were given drugs that caused hepatocellular necrosis and/or cholestasis. 30 Likewise, studies of dexamethasone, a potent glucocorticoid and inducer of cytochrome P450 3A (CYP3A) yielded increases in serum ALT. 31 However, the increased ALT activity was associated with hepatocellular single-cell necrosis in addition to pharmacologically mediated cytoplasmic glycogen accumulation since ALT is a gluconeogenic enzyme.30,31
Although hepatic DME is not a cause of increased serum ALT in the absence of hepatocellular degeneration/necrosis or cholestasis, induction of hepatic DME can be associated with increases in ALP or GGT activity in rats and dogs. 30 For example, dogs given anticonvulsants such as phenobarbital or phenytoin which are known to induce hepatic DME commonly have increases in hepatic and serum ALP activities. In contrast, rats given phenobarbital or ethanol may develop increases in liver and potentially serum GGT activities. However, increases in serum GGT due to DME induction in rats is uncommon because of the short circulating half-life of GGT in rodents. 30
Xenobiotically mediated effects on phase II biotransformation reactions and hepatic transporters can also cause changes in hepatobiliary markers. For example, inhibition of hepatocellular uridine diphosphate glucuronosyltransferases (e.g., UGT1A1) or organic anion transporting polypeptides (e.g., OATP1B1) can lead to increases in unconjugated bilirubin, whereas inhibition of the bile salt export pump (BSEP), a canalicular efflux transporter and well-recognized risk factor for cholestatic drug-induced liver injury (DILI), can lead to increases in bile acids with hepatocellular bile salt accumulation and liver injury. While total bilirubin concentrations are typically measured in toxicity studies, large increases in the absence of increased bilirubin turnover (e.g., hemolysis) or cholestasis can occur due to UGT1A1 inhibition and may warrant measurement of bilirubin subfractions (conjugated and unconjugated bilirubin) or in vitro profiling. While in vitro screens for BSEP inhibition are common in nonclinical drug development, species differences in bile acid biology limit translatability of animal data for human safety risk assessment. 32
In summary, changes in markers of hepatobiliary injury or function must be evaluated in the context of histopathology and other study data including CP and pharmacokinetics. Integration of hepatobiliary marker changes with histopathology findings requires in-depth understanding of marker biology, species differences, and the pathophysiology of liver histopathology changes.
Kidney
It has long been recognized that the conventional serum markers creatinine (sCr) and urea nitrogen (UN), have relatively poor sensitivity and lack specificity for renal injury or functional compromise. Nevertheless, they remain the most utilized noninvasive markers of renal injury and their measurement in nonclinical studies is expected by regulatory agencies. While both are used as surrogates for glomerular filtration rate (GFR), the gold standard measure of renal function, sCr is considered more specific than UN. This is because creatinine is produced from the breakdown of muscle phosphocreatine at a relatively constant rate, is essentially unaltered during passage along the nephron and is relatively unaffected by diets typically fed in a laboratory animal setting. In contrast, UN is a product of protein catabolism and is thus readily influenced by diet and extrarenal factors including starvation or tissue injury. Furthermore, urea readily diffuses across membranes, passively equilibrating across tissues depending on hydration status, and in renal tubules, based on renal perfusion and urine flow. Importantly, neither sCr or UN concentration are increased above reference comparators in humans or animals until 50% to 70% of renal function is lost.33,34 Smaller or earlier effects on renal function may be detectable in some cases based on comparison of SCr and UN to concurrent control or baseline data in nonclinical studies, although such minor changes in these analytes may also be difficult to distinguish from biologic or analytical variability.
Although decreased renal function might be expected to precede structural injury, the kidney has a large functional reserve that can lead to a delayed increase in sCr following renal injury. For example, glucosuria in normoglycemic individuals or loss of renal concentrating ability can indicate early renal functional compromise prior to overt structural injury. However, evaluation of renal concentrating ability is often confounded by contamination of urine samples by spillage/leakage of drinking water in standard toxicology studies. As with markers of decreased renal function, increases in renal injury markers in urine generally precede increases in sCr and UN, thus urinalysis is an important component of renal safety assessment and requires a sample of adequate quality (e.g., collected using methods designed to limit contamination with food or fecal material).
Measurement of urine constituents can provide insight on the localization of renal injury. The proximal tubule (PT) is the most common site of renal injury because of its major role in modifying the glomerular filtrate, limited antioxidant capacity, and high rate of endo- and xenobiotic metabolism, and most of the urinary structural injury markers reflect PT injury. Constitutively expressed traditional PT injury markers including urinary albumin, total protein, and N-acetyl-β-D-glucosaminidase (NAG) are well conserved and readily measured across species. Several novel renal proteins with specificity for defined nephron segments or general renal injury have increasingly been implemented in nonclinical and clinical studies. 34 One of the most prominent of these renal injury biomarkers is kidney injury molecule-1 (KIM-1), an inducible protein upregulated in the PT in response to renal injury that can be measured in rodents, nonhuman primates and humans, but currently not in minipigs. 35 Other inducible markers of general renal injury include lipocalin-2 (also known as neutrophil gelatinase-associated lipocalin [NGAL]), a transport protein originally identified in neutrophil-specific granules that is upregulated in many epithelia including liver in response to injury or inflammation; clusterin, an antiapoptotic protein produced by all nucleated cells and upregulated throughout the nephron; and osteopontin, an extracellular matrix protein that is primarily upregulated in the distal nephron. 36 A distal nephron-specific marker uniquely present in the rat is renal papillary antigen-1 (RPA-1), a constitutive high molecular weight glycoprotein that is released with collecting duct injury.37,38
Many of these markers have been evaluated in meta-analyses conducted by consortia of industry, academic and/or regulatory scientists. These studies have demonstrated diagnostic utility for renal injury in several species across a wide range of test articles, most commonly using classical nephrotoxicants with severe nephrotoxic manifestations or, to a lesser extent, development compounds.36,39-44 It should be noted that estimates of the diagnostic utility in some of these studies may overstate marker performance in the nonclinical drug development setting due to spectrum bias, as the extent of renal injury typically seen in nonclinical toxicity studies is often less than what is observed with classical nephrotoxicants that cause severe nephrotoxic injury. In addition, these markers were evaluated in the context of acute kidney injury and in general do not reflect the structural changes found in chronic renal injury. 45 Despite these caveats, the use of these diverse renal injury markers can provide both mechanistic and morphologic insight on drug-induced renal injury. For example, in an investigative juvenile rat nephrotoxicity study (Case Example #1), these novel markers helped to characterize the time course and localization of renal lesions observed and to inform the clinical monitoring strategy.
Urine composition can be extremely variable because, unlike blood and serum, the specimen reflects the cumulative pathophysiologic effects on the kidney and other urogenital tissues during the period of urine accumulation in the bladder and over the defined collection period. In addition, urine volume and composition are less tightly regulated than blood constituents which circulate within the more defined and regulated vascular space. Despite the use of timed collections and normalization of urine analytes to either urine creatinine concentration or urine collection time period, urine parameter values can vary as much as two to four-fold within healthy individuals. Therefore, urinary analyte changes must be of sufficiently large magnitude to be considered meaningful and outside of the normal range of biological variability. It is incumbent upon study contributors, regulatory scientists, and other reviewers to consider the context of change for both novel and traditional urinalysis parameters relative to changes in other study endpoints including serum clinical chemistry, changes in analogous or associated urine analytes, histopathology, and in-life findings when interpreting urinalysis data.
In summary, while the traditional markers sCr and UN continue to be standard endpoints for assessment of renal injury despite relatively low sensitivity and specificity, a variety of urinary biomarkers can be measured in several laboratory animal species that may confer added sensitivity and localization of renal injury. Changes in these markers should be evaluated in the context of expected intra-animal biologic variability, presence or absence of associated changes in related urinary or serum markers, and histopathologic changes reflecting renal injury (e.g., tubule degeneration/necrosis and glomerular findings) when making a weight-of-evidence assessment of renal toxicity.
Heart/Cardiovascular System
The heart and cardiovascular system generally respond to injury in a limited number of ways. These responses, sometimes called cardiac failure modes, are a topic of study by the Health and Environmental Sciences Institute (HESI) Cardiac Safety Committee and include changes in function (e.g., vasoreactivity, inotropy, and action potential) and structure (e.g., valvular injury/proliferation; cardiomyocyte injury [degeneration/necrosis]; and endothelial injury and altered hemostasis). 46 Several of these cardiac failure modes (e.g., changes in vasoreactivity, inotropy and action potential) have no characteristic macroscopic or histopathologic morphologic alterations or changes in routine CP parameters that might be integrated in a nonclinical toxicity study. However, due to the close interdependence between structure and function in the heart, functional perturbations can cause structural changes (e.g., vascular injury with potently vasoactive compounds, arterial medial hypertrophy with chronic hypertension) and vice versa (e.g., significant cardiomyocyte/myocardial injury triggering contractile dysfunction or arrhythmia). 47 The following sections provide further detail regarding AP and CP associations of the structural, functional, and hemodynamic changes of the cardiovascular system.
Cardiomyocyte Degeneration/Necrosis
Cardiac troponins (cTns)
The cardiac troponins (cTnI and cTnT) are globular proteins present in the cytoplasm and sarcomere of cardiac myocytes which function to regulate muscle contraction. 6 The cTns are released into circulation following injury to the cardiomyocyte resulting in degeneration or necrosis. Cardiac troponin release may occur in reversible or nonreversible cardiomyocyte injury. 48 The distribution of cTn within the cardiac myocyte influences release kinetics following cardiomyocyte injury. 6 Most of the cTn is present in the sarcomere and only 3% to 8% is found in the cytoplasm. The cytoplasmic cTn pool is released rapidly at first (peaking within hours), followed by release of the sarcomere pool, which requires degradation of the sarcomere and can last for days but varies depending on the size and reperfusion of the lesion. 6
Serum or plasma cardiac troponins are specific and sensitive markers for myocardial injury and are considered by clinicians to be the “gold standard” circulating biomarkers for detecting acute cardiomyocyte degeneration and/or necrosis in humans.49-51 In preclinical species, cTns exhibit the same sensitivity and specificity characteristics as in the clinical setting; however, there are key differences in the application of this biomarker.
In contrast to human clinical medicine in which postmortem evaluation is often not pursued, most animals used in routine toxicity testing studies undergo complete necropsy at study termination with histopathologic review of numerous organs and tissues. In these preclinical toxicity studies, histopathology provides an additional tool for identification of injury to the heart.49,52,53 In routine toxicity studies, the standard practice of evaluating a limited number of heart sections limits overall sensitivity, as only a fraction of the heart is examined histologically. Cardiac troponins are a sensitive indicator of cardiac injury in preclinical species, but they are subject to considerable procedure-related, interspecies, and inter/intra animal variability in preclinical species.54-59 Furthermore, due to the kinetics of cTn release with an early peak and subsequent plateau and their relatively short circulating half-life,6,7 histopathologic changes can be temporally distant from peak concentrations or detectable changes in cTn concentrations. Given the relative insensitivity of histopathology changes, the inherent variability in cTn concentrations from preclinical species, and the fact that these changes may not be concurrent, several factors should be considered when integrating cTn concentrations with histopathology changes.
The chronicity of the histopathologic lesion should be reasonably consistent with the kinetics of the cTn change. Increased cTn concentration proximal to necropsy should be associated with histopathologic evidence of “early” or acute myocardial changes in at least some animals.
Chronic myocardial histopathology changes (ie, fibrosis) are unlikely to have concurrent cTn changes but might be associated with an earlier cTn signal.
Owing to the focal nature of some histopathologic changes, not every cTn increase will have an associated histopathologic change on an individual animal basis. Even if the findings are not concurrent within the same animal, a general association can be made between cTn increases and compatible histopathology changes if both are present within the same group.
The cytoplasmic pool (~5%) of cardiac troponin within a cardiac myocyte is readily released into the blood. Therefore, transient or minimal increases in cTn concentration may occur and often have no associated macroscopic or histopathologic change. In addition, some experimental procedures such as oral gavage, chair restraint, phlebotomy, and intravenous and intramuscular injections may cause transient minimal to slight increases in cTn concentrations in rats and nonhuman primates (NHPs).55-57 In contrast, a consistent/robust cTn signal can still indicate myocardial injury even in absence of an associated histopathologic change, as it may be viewed as an early indicator of a continuum of cardiomyocyte injury that could be accompanied by histopathologic changes at a higher dose or after a longer period of dosing.
Alterations that result in injury to the sarcomere (~95% of cTn pool of cardiac troponin) usually result in slower release of larger amounts of cTn over time and are often accompanied by a histopathologic change of cardiac myocyte degeneration/necrosis.
Creatine kinase
Total CK activity and isozyme electrophoresis were used to detect cardiomyocyte degeneration and/or necrosis in laboratory animals prior to development of the biomarker cTn. Creatine kinase has peak activity within 6 to 12 hours following cardiac injury, has a half-life of ~2 to 4 hours, and activity returns to baseline quickly after cessation of cardiac injury.60,61 Creatine kinase is a dimeric enzyme composed of muscle and brain subunits. The enzyme has four isoenzymes with tissue-specific origin: CK-1 [BB] (brain), CK-2 [MB] (cardiac muscle/skeletal muscle), CK-3 [MM] (skeletal muscle/cardiac muscle), and CK-Mt (mitochondria-numerous tissues).8,62,63 Associating increases in total CK activity and/or CK-2 activity with histopathologic lesions in the heart of laboratory animals following a single cardiac injury may be a challenge due to the short half-life of the enzyme. Depending on study design, timing of phlebotomy, and the timing of evaluation of cardiac histopathology in animals in the study, CK activity may rise and fall prior to histopathologic evaluation of the heart. For this reason, the time and expense of electrophoresis, and the potential artifactual release of CK from skeletal muscles injured during poor phlebotomy technique, CK activity is used sparingly in many toxicity studies to detect and monitor cardiomyocyte degeneration/necrosis.
Aspartate aminotransferase
Aspartate aminotransferase is found in numerous tissues including heart, skeletal muscle, liver, and erythrocytes in laboratory animal species.8,28,62 Major sources of the enzyme in serum are liver and skeletal muscle. The half-life of the enzyme is usually 12 to 24 hours. Peak AST activity usually occurs 24 to 48 hours after injury. Minimally to slightly increased AST activity may occur in cases of cardiomyocyte degeneration/necrosis in some laboratory animals. In these cases, an increase in AST activity is often accompanied by increases in cardiac troponin I or T concentrations, CK activity, and/or lactate dehydrogenase (LDH) activity. Given the lack of tissue specificity in cases of AST release into the serum, pathologists must also evaluate animals for evidence of concurrent liver and/or skeletal muscle injury and not automatically attribute small increases in AST activity to cardiac injury.
Lactate dehydrogenase
Measurement of total LDH activity coupled with isozyme electrophoresis was used previously to monitor heart injury in some laboratory animals in toxicity testing. As assays for cTnI in animals have become more available and their use has increased, LDH activity is used less frequently to detect and monitor heart injury in regulatory studies, although it is still often used in investigative studies. Lactate dehydrogenase is a tetrameric enzyme composed of heart (H) or muscle (M) subunits. Although all tissues may contain some LDH activity, the main sources of LDH activity in serum arise from liver, skeletal muscle and erythrocytes. LDH1, composed of four H subunits, is the primary isozyme found in cardiac muscle and kidney. Peak LDH activity occurs 48 to 72 hours following tissue injury.8,62,63 In cases of on-going, slight to marked cardiomyocyte degeneration and/or necrosis, slight to moderate increases in LDH activity may occur concurrent with increases in cTn, and CK and/or AST activities. As LDH lacks tissue specificity, investigators are cautioned not to attribute increased LDH activity to cardiac injury without examination of LDH isozymes or other supportive clinical chemistry parameters. There is moderate variation in LDH isozyme distribution among species.28,63 Time, cost, lack of widespread availability of LDH isozyme electrophoresis, and serum/plasma hemolysis limit the use of LDH activity in detection of cardiac injury.
Fatty acid binding protein (Fabp3)
The protein Fabp3 is located in the cytoplasm of cardiac myocytes and increases in the serum of laboratory animals following cardiac injury in a kinetic pattern similar to cTn. 64 Increases in the serum protein occur ~30 minutes to 2 hours following cardiac injury. 65 Some studies suggest Fabp3 may be a more sensitive indicator of cardiomyocyte degeneration/necrosis than cTn.66,67 However, Fabp3 is not cardiac-specific in origin. The protein also increases in serum with injury to skeletal muscle, liver, kidney, and brain.68-73 Therefore, increases in the concentration Fabp3 should be evaluated in association with other cardiac injury markers and results of histopathologic evaluation of the heart and other tissue sources.
Myosin light chain 3
Myosin light chain 3 (Myl3) has been used to evaluate cardiac and skeletal muscle injury in rat toxicity studies.64,74 The biomarker is an isoform (23-kDa) of a subunit of myosin and is located in slow-twitch skeletal muscle and in the cardiac ventricles. Serum concentrations of this biomarker increase more slowly after cardiac injury, and concentrations remain elevated much longer in comparison to cTn. 75 Sprague–Dawley rats treated with isoproterenol had cardiomyocyte degeneration/necrosis and increased Myl3 concentrations at 4, 24, and 48 hours postinjury. 74 However, Myl3 is not considered a specific marker for cardiac injury.
Endothelial Injury and Altered Hemostasis
Endothelial cell activation and/or injury may occur due to a variety of xenobiotics, trauma, metabolic disturbances, inflammatory disease, and infectious agents. The histopathologic appearance of endothelial cell activation and injury within the heart and vessels may vary markedly depending on the mechanism of injury and maturation of lesion development. Activated endothelial cells may appear relatively normal or they may be recognized as swollen endothelial cells with large round nuclei that protrude into the vascular lumen. Injured degenerate endothelial cells may be shrunken with pyknotic nuclei. Upon electron microscopic examination, enlarged fenestra separating endothelial cells may be detected. In some cases, injury to the vascular intima may be evident as denuded basement membranes with free endothelium or endothelial cell fragments in the vascular lumen and infiltration of mixed populations of inflammatory cells into the vascular intima and media. 76
Vascular injury markers are usually categorized as endothelial cell activation markers, endothelial cell adhesion markers and acute phase inflammatory reactants.77-79 Although there are numerous markers in these categories, only a few of them have shown promise in rats. 78 Angiopoietin-2, endothelin-1, and vascular endothelial growth factor were modestly increased in serum approximately 1 to 3 days after endothelial cell injury due to phosphodiesterase 3 inhibitor (PDE3i) administration in rats. E-selectin decreased after endothelial cell injury in this model. Inflammatory biomarkers such as nitric oxide, α-1-acid glycoprotein, NGAL, and tissue inhibitor of metalloproteinase-1 increased markedly in concentration within approximately 4 hours after endothelial injury. 78
The development of prothrombotic states has been the focus of the study by the Cardiovascular Biomarkers Working Group of the HESI Cardiac Safety Committee. The working group used healthy Wistar rats treated with endotoxin and obese Zucker diabetic fatty rats fed low- or high-fat diets to evaluate changes in potential biomarkers of a hypercoagulable state.80,81 Within 4 hours of endotoxin administration, hemostatic imbalance in rats treated with endotoxin was characterized by increased D-dimers, plasminogen activator inhibitor-1, and soluble intercellular adhesion molecule-1. Prolongation of the activated partial thromboplastin time (but not the prothrombin time) occurred at 8 and 24 hours and platelet counts were severely decreased within 24 hours. Increased concentrations of procoagulant extracellular vesicles that expressed platelet membrane markers and endothelial cell markers also occurred. There were no direct morphologic or clinical changes associated with these important hemostatic changes. Zucker diabetic fatty rats fed a high-fat diet for a prolonged period of time had increased concentrations of fibrinogen, plasminogen activator inhibitor-1, and von Willebrand factor, and increased thrombin generation compared to rats fed a low-fat diet, but no significant differences in prothrombin time or activated partial thromboplastin time, platelet counts, D-dimers, or antithrombin concentrations. There were no histopathologic vascular lesions noted in the model. Results of these studies demonstrate that numerous hemostatic changes indicating creation of a hypercoagulable state may occur in the absence of morphologic evidence of heart or vascular injury.
Formation of thrombi within tissues may vary in morphologic appearance from small platelet and/or fibrin thrombi in organs of microcirculation such as the lungs, kidneys, and spleen to overt thrombosis of major vessels within a particular organ (distal aorta, renal artery or vein, femoral vein). Numerous hemostatic changes such as consumption of platelets and erythrocytes, decreased plasminogen and fibrinogen, increased thrombin generation, increased fibrin degradation products (FDPs) including D-dimers, and characteristic changes in thromboelastography may occur. Integration of histopathologic lesions and changes in tests of hemostasis is challenging and dependent upon numerous factors:
Frequency of thrombosis and distribution of lesions compared to number of histologic sections examined.
Time of blood sampling for determination of changes in hemostatic tests.
Kinetic changes in thrombus itself (formation and growth vs fibrinolysis).
In reality, the association of CP changes indicative of development of prothrombotic conditions or thrombosis (decreased antithrombin activity, fibrinogen concentration; thrombocytopenia; and/or increased thrombin generation, thrombin-antithrombin complexes, and D-dimers) and presence of thrombi in histologic sections is infrequent at best, as discussed in the examples above.
Hypofunction of the hemostatic system may be characterized by hemorrhage. Association of multifocal hemorrhages in heart and/or vessels in numerous organs with prolongation of the prothrombin time, activated partial thromboplastin time and/or decreases in fibrinogen concentration may occur during disseminated intravascular coagulation. Association of macroscopic findings of petechial and ecchymotic hemorrhages in capillaries with thrombocytopenia may occur with immune-mediated thrombocytopenia and various drug-induced platelet function disorders.
Valvular Injury/Proliferation
Natriuretic peptides
Atrial natriuretic peptide (ANP) and brain natriuretic peptide (BNP) are hormones produced by the cardiac atrium and cardiac ventricle, respectively, in response to stretch, typically from volume expansion or pressure overload in the myocardium. 60 In response to myocardial stretch (volume overload), ANP and BNP decrease intravascular volume through natriuresis and diuresis.82,83 Atrial natriuretic peptide and BNP are released from their respective pro hormones by proteolytic cleavage of the N-terminal resulting in equimolar amounts of active hormone and N-terminal peptides.83,84 The active hormones have shorter half-lives and are eliminated through receptor-mediated clearance or proteolytic clearance, whereas the N-terminal peptides are cleared primarily by glomerular filtration. 83
As the natriuretic peptides are circulating markers for hemodynamic changes, they may be accompanied by a wide spectrum of associated findings. Heart weight increases and changes in in-life parameters (for example, blood pressure and heart rate increases) may be more consistent than histopathologic changes.85-88 Associated histopathologic changes in the myocardium might be due to an enlarged ventricular wall cross-section 85 or there may be no histopathologic change. 86
In summary, responses of the cardiovascular system to injury include changes in function and structure. Structural changes of cardiomyocyte injury, valvular injury/proliferation and/or endothelial injury, or altered hemostasis can have AP or CP findings.
Case Examples
The following case examples are intended to highlight practical application of concepts related to CP and AP data integration in nonclinical studies. All procedures described that were performed on animals were in accordance with regulations and established guidelines and were reviewed and approved by an Institutional Animal Care and Use Committee.
Example 1: Investigative Nephrotoxicity Study in Juvenile Rats
An investigative study was conducted in juvenile rats to characterize the age-related sensitivity and associated urinary biomarker changes for renal injury that were previously identified in a definitive juvenile rat toxicity study. Male Crl:CD(SD) rats (n = 10/group) were given vehicle or test article by oral gavage once daily for 1 week at consecutive intervals starting at postnatal day (PND) 7 (PND 7-13, PND 14-21, PND 22-27, and PND 28-35). An additional cohort was dosed continuously from PND 7 to 35. Doses used for the preweaning and postweaning periods were adjusted to maintain consistent systemic exposure throughout the study. All groups were euthanized the day after the dose period ended, and kidney histopathology, limited clinical chemistry (urea and creatinine concentrations), and urinalysis data (including RPA-1, NGAL, clusterin, osteopontin, KIM-1, albumin, NAG, total protein, glucose, and creatinine) were evaluated.
The primary histopathologic finding (degeneration of medullary profiles of predominantly collecting ducts [CDs] and distal tubules) was associated with mineral deposition and neutrophilic inflammation, as well as retrograde dilation and cyst formation in the more proximal cortical and medullary tubules (Table 2). In pups dosed during the preweaning period (from PND 7-13 or PND 14-21) or pups dosed continually from PND 7 to 35, test article administration caused an obstructive nephropathy that primarily involved distal nephron segments within the medulla due to tubular mineral deposition. In contrast, an obstructive nephropathy was not observed in pups dosed postweaning (between PND 22 to 27 or PND 28 to 35). Cortical changes were mild and limited to tubular dilation and cyst formation, consistent with the obstructive nephropathy pathogenesis. These renal histopathology changes were essentially limited to pups dosed during the preweaning period, consistent with an age-related sensitivity for development of the nephrotoxic injury.
Light microscopic kidney changes from an investigative study in juvenile male Crl: CD (SD) rats.
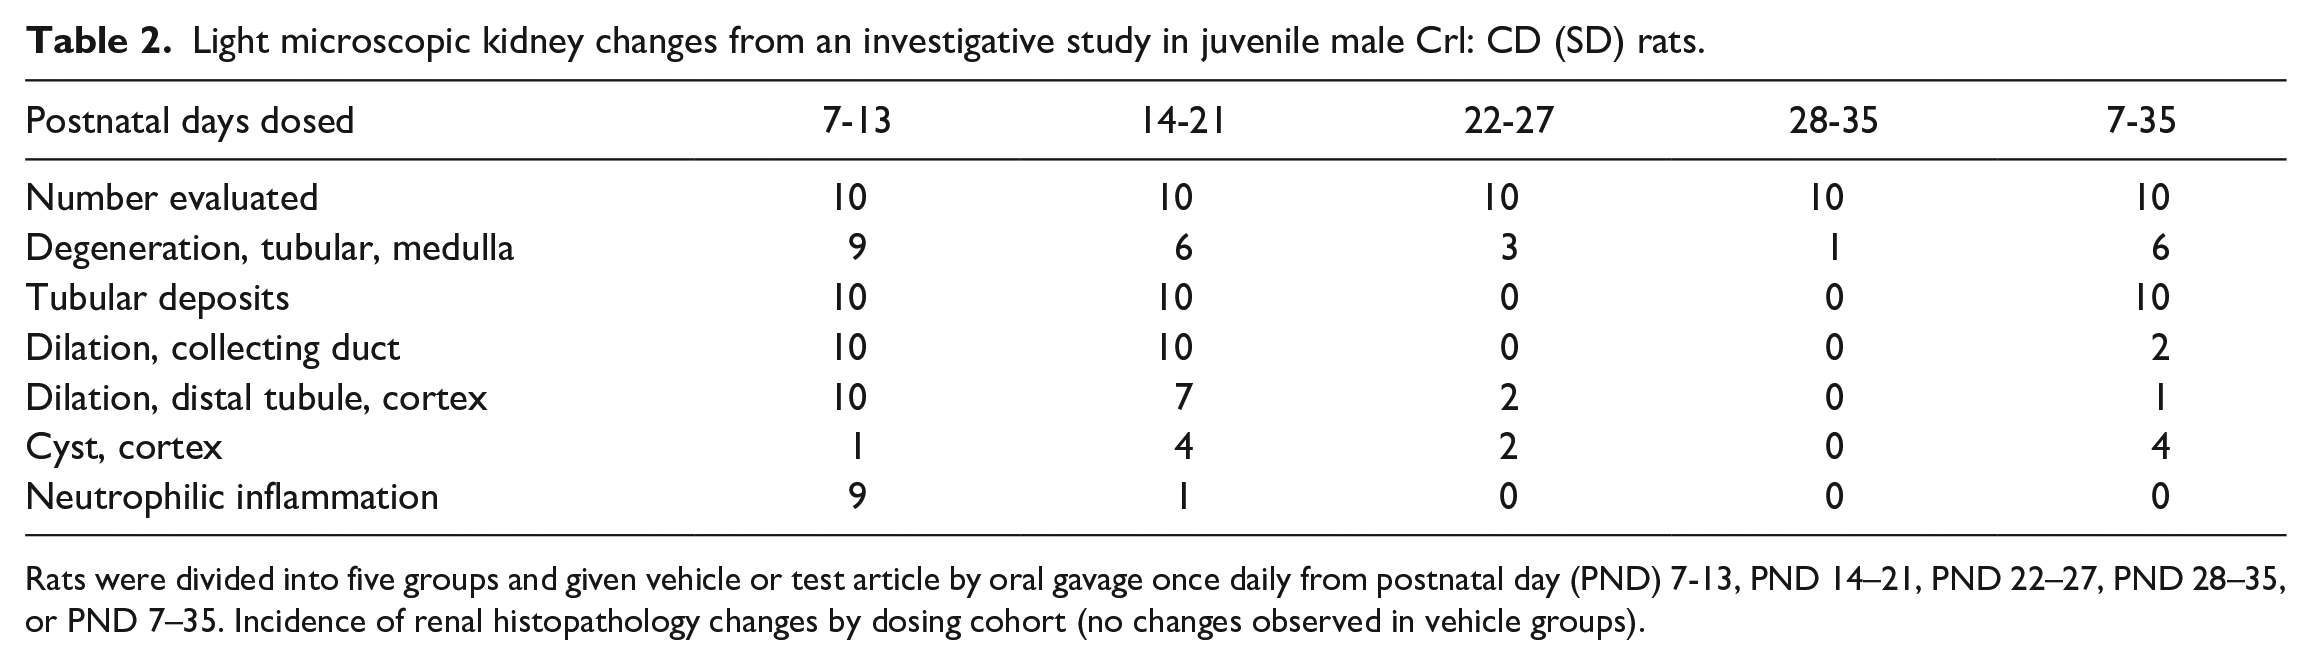
Rats were divided into five groups and given vehicle or test article by oral gavage once daily from postnatal day (PND) 7-13, PND 14–21, PND 22–27, PND 28–35, or PND 7–35. Incidence of renal histopathology changes by dosing cohort (no changes observed in vehicle groups).
Histopathology findings and associated biomarker changes are summarized in Figure 1A-D. Urinary biomarker changes paralleled renal histopathologic changes and were reflected in the scatterplots of urinary RPA-1, clusterin and NGAL (as fold change relative to control mean), which are color coded to show the severity of degeneration of medullary tubules for each animal.
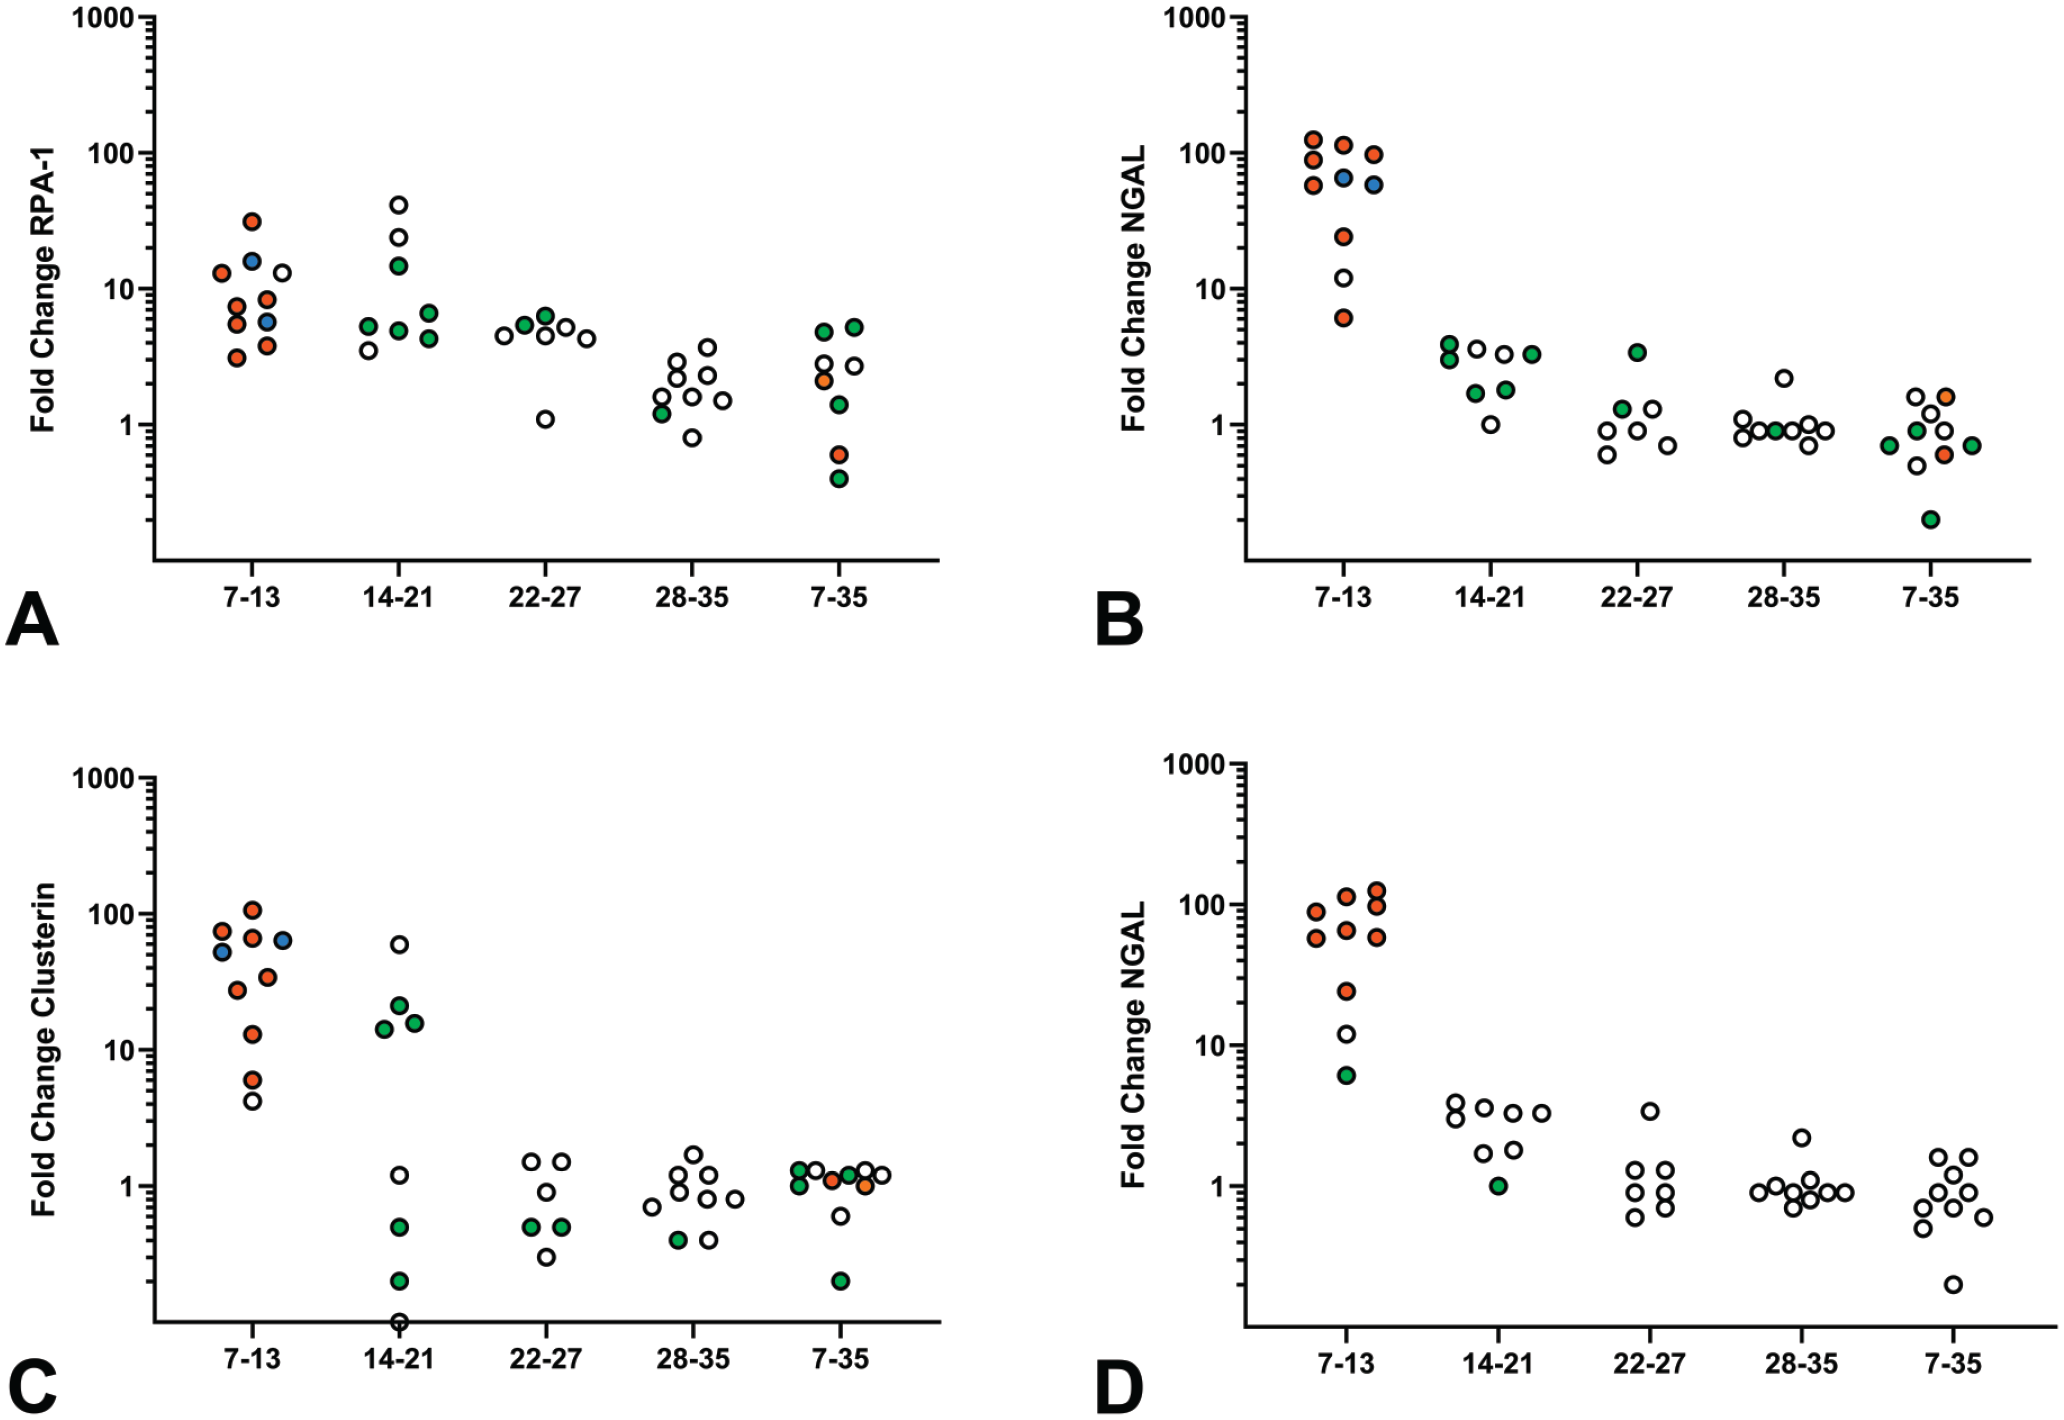
Fold change in selected urinary biomarker concentrations relative to the control group mean after each dosing interval. Each circle represents the fold change in biomarker concentration for an individual animal, with the severity grade of the histopathology finding indicated by the coloration of the circle as follows: no abnormality detected indicated by an open circle, minimal severity by green, mild severity by orange, and moderate severity by blue. Figure A-C indicate changes in urinary concentrations of RPA-1, clusterin and NGAL associated with medullary tubular degeneration; Figure D indicates changes in urinary NGAL with neutrophilic inflammation. NGAL indicates neutrophil gelatinase-associated lipocalin; RPA-1, renal papillary antigen-1.
While KIM-1, albumin, NAG, total protein, and glucose are markers of proximal tubular injury, the most common site of nephrotoxic injury, clusterin and NGAL are inducible markers of general renal injury, and RPA-1 is induced with collecting duct injury in the rat. The largest urinary biomarker changes were increases in RPA-1 (up to 11-fold concurrent control mean), clusterin (up to 45-fold control), and NGAL (up to 65-fold control). Changes in these three biomarkers occurred during the earliest treatment periods when medullary tubular degeneration was most prevalent and of greatest severity. Although several animals in the first two treatment periods lacked histopathologic evidence of degeneration in medullary tubules (indicated by open circles), these animals did have tubular mineral deposition and dilation (other indications of retrograde nephropathy). In contrast, the PT injury markers NAG, KIM-1, and albumin were minimally increased (less than three-fold compared to control) at the first time point only, consistent with the minor secondary effects on the proximal nephron (data not shown).
Urinary NGAL increases in this study were potentially related to neutrophilic inflammation associated with the tubular mineral deposits, as NGAL is known to be induced by inflammation.36,42 However, NGAL was also increased in the rats with medullary tubular degeneration without inflammation, consistent with the role of NGAL as an inducible stress protein (Figure 1C and D). As NGAL induction primarily occurs in the distal nephron, 89 the increases in urinary NGAL in this study were interpreted to reflect both distal tubular injury and inflammation.
In summary, retrograde obstructive nephropathy-associated injury to the distal nephron in these juvenile rats caused increases in inducible markers of general renal injury, particularly of the distal nephron. These effects exceeded the minimal increases in proximal tubular injury markers that occurred secondary to the retrograde tubular injury in the distal nephron. These data demonstrate the utility of using segment-specific renal injury biomarkers to localize and noninvasively characterize the time course of renal injury.
Example 2: Bone Marrow Time Course Study in Rats
An investigational study in rats was designed to assess the time course of hematologic toxicity associated with a small molecule test article for an oncology indication. Male Crl:CD(SD) rats (approximately 10 weeks of age at the initiation of dosing) were administered control article (saline) or the test article via once daily oral gavage for a period of 7, 14, or 28 days. Five male rats per group were allocated for each dosing duration. Approximately 24 hours after the last dose administered (ie, Days 8, 15, and 29), animals were euthanized via isoflurane inhalation and exsanguination, and blood for hematology assessment was collected from the vena cava while the animals were under deep and unrecoverable anesthesia. Necropsy was performed and select tissues were collected for histopathology. A recovery cohort (5 males per group) was also dosed for 28 days and euthanized on Day 57 following a 29-day recovery period.
Hematology changes in the cohort dosed for 7 days (Table 3) included decreases in reticulocyte, neutrophil, and monocyte counts, as well as a smaller decrease in platelet counts. Neutrophil and monocyte counts after 14 days of dosing were decreased at relatively similar magnitudes to those of the 7-day cohort; however, the magnitude of decrease in platelets was larger in the 14-day cohort. Additional changes at this time point included a moderate decrease in RBC mass and a minimal decrease in lymphocytes. The hematology changes at the end of the full 28-day dosing period were generally similar to those after 14 days of dosing, except for greater severity of the decreases in platelet counts and RBC mass.
Hematology data from investigational rat study.
Data are represented as the group mean (standard deviation). Rats were dosed with saline or a small molecule test article for 7, 14, or 28 days (5 males per group per time point) and a terminal hematology sample was collected at necropsy on Days 8, 15, or 29, respectively. An additional 5 males administered saline or test article for 28 days were euthanized on Day 57 following a 29-day recovery period. Comparative inferential statistical analysis was not planned or performed.
Abbreviation: RBC, red blood cell.
Histopathology changes (Table 4) consisted of a decrease in bone marrow cellularity that was of low incidence and severity after 7 days of dosing (2 of 5 animals; minimal to mild), but was subsequently observed in all animals at moderate to marked severity after longer dosing durations (14 and 28 days). In addition, extramedullary hematopoiesis was observed in the spleen in most or all animals after 14 and 28 days of dosing, consistent with a response to the decrease in peripheral cell counts that is commonly observed in rodents.
Histopathology data from investigational rat study.
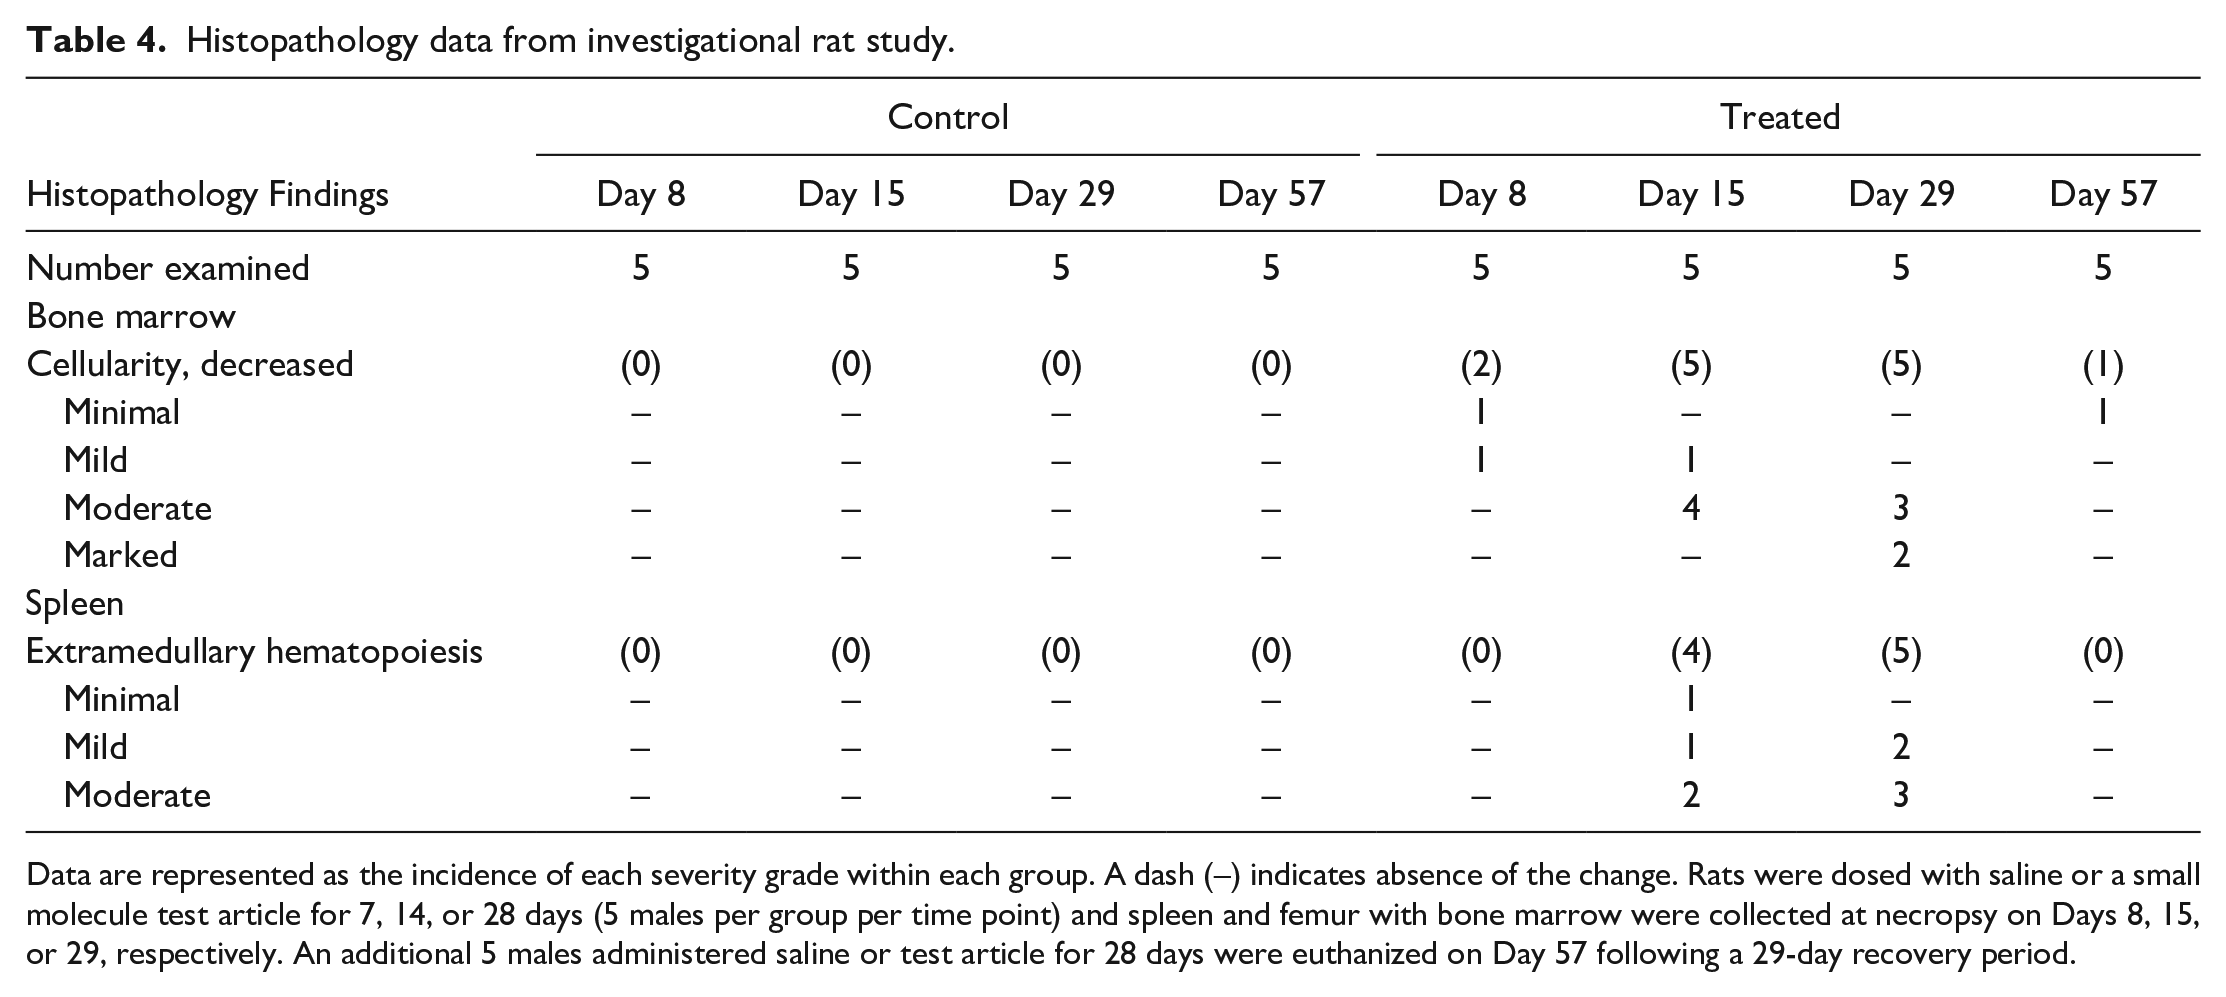
Data are represented as the incidence of each severity grade within each group. A dash (–) indicates absence of the change. Rats were dosed with saline or a small molecule test article for 7, 14, or 28 days (5 males per group per time point) and spleen and femur with bone marrow were collected at necropsy on Days 8, 15, or 29, respectively. An additional 5 males administered saline or test article for 28 days were euthanized on Day 57 following a 29-day recovery period.
Following a 28-day recovery period, the leukocyte, reticulocyte, platelet, and RBC counts approximated or nearly approximated concurrent control values. The changes in bone marrow and spleen histopathology also exhibited reversibility, with only a minimal decrease in bone marrow cellularity observed in one of five animals at this time point.
The concordance in CP and AP data sets relevant to hematopoiesis in this example was influenced by the time of collection. Hematology changes consistent with decreased hematopoiesis occurred early in the study (after 7 days of dosing), while histopathologic changes in the bone marrow were of comparatively lower incidence and severity at that time point. This limited degree of concordance may cause confusion when approaching the integration of these data sets. Such discrepancies may occur with a shorter duration of exposure and/or with hematopoietic effects of low severity as circulating peripheral blood cell populations that have short circulating lifespans (e.g., reticulocytes and neutrophils) may decrease with no discernable histopathologic change in bone marrow cellularity. With longer dosing durations, continuing or progressive decreases in peripheral cell counts were associated with greater incidence and severity of decreased histologic bone marrow cellularity. In addition, the observed splenic extramedullary hematopoiesis at later time points was consistent with an expected response to decreased peripheral cell counts (most notably decreased RBC mass) as is commonly observed in the rat relative to other species, and represented an important component of the overall hematologic profile. There was good concordance at the end of the recovery period, with all CP and AP endpoints exhibiting evidence of reversibility.
Conclusion
The interpretation and communication of CP and AP data in nonclinical toxicology studies are enhanced when care is taken to identify and describe pathophysiologic relationships among these data sets and to integrate observed changes with other study data. This approach produces a cohesive narrative in the study report, and provides greater clarity to stakeholders (project teams, clinicians, regulators, etc.) regarding the potential mechanisms and impact of the study findings. To approach pathology data integration successfully, pathologists must consider a number of factors that may impact data interpretation and data concordance. These factors include biologic variability of pathology data, the impact of preanalytical variables and pharmacokinetic data, and the relationship between CP endpoint kinetics and the chronicity, severity, and type of tissue change at the light microscopic level. Furthermore, scrutiny of the relative magnitudes/severity of changes in potentially related endpoints, biologic plausibility of a relationship among these endpoints, and a comprehensive understanding of organ-specific tissue morphology and biomarker responses are critical in discriminating between a true biologic relationship and changes that are, in fact, unrelated. Careful consideration of these factors by pathologists and other investigators will maximize the value of the data collected and result in the most robust and scientifically accurate study conclusions, in support of human risk assessment.
Footnotes
Acknowledgements
This article has been simultaneously co-published with Veterinary Clinical Pathology. The articles are identical except for minor stylistic and spelling differences in keeping with each journal’s style. Either citation can be used when citing this article.
Declaration of Conflicting Interests
The author(s) declared no potential conflicts of interest with respect to the research, authorship, and/or publication of this article.
Funding
The author(s) received no financial support for the research, authorship, and/or publication of this article.