
Abstract
Convolutional neural networks (CNNs) have been recognized as valuable tools for rapid quantitative analysis of morphological changes in toxicologic histopathology. We have assessed the performance of CNN-based (Halo-AI) mitotic figure detection in hepatocytes in comparison with detection by pathologists. In addition, we compared with Ki-67 and 5-bromodesoxyuridin (BrdU) immunohistochemistry labeling indices (LIs) obtained by image analysis. Tissues were from an exploratory toxicity study with a glycogen synthase kinase-3 (GSK-3) inhibitor. Our investigations revealed that (1) the CNN achieved similarly accurate but faster results than pathologists, (2) results of mitotic figure detection were comparable to Ki-67 and BrdU LIs, and (3) data from different methods were only moderately correlated. The latter is likely related to differences in the cell cycle component captured by each method. This highlights the importance of considering the differences of the available methods upon selection. Also, the pharmacology of our test item acting as a GSK-3 inhibitor potentially reduced the correlation. We conclude that hepatocyte cell proliferation assessment by CNNs can have several advantages when compared with the current gold standard: it relieves the pathologist of tedious routine tasks and contributes to standardization of results; the CNN algorithm can be shared and iteratively improved; it can be performed on routine histological slides; it does not require an additional animal experiment and in this way can contribute to animal welfare according to the 3R principles.
Keywords
Introduction
In 2012, the field of computer vision was revolutionized by convolutional neural networks (CNNs). 1 Two main factors contributed to this breakthrough. First, the ImageNet was available—a very large, annotated image data set with associated image recognition competition. 2 Second, the AlexNet (the first CNN approach to win the ImageNet image classification challenge) showed how to apply various tricks that ultimately optimized the CNN learning process, such as training on graphics processing units. 1 Since then, the technology of CNNs rapidly evolved into very powerful image processing algorithms. Now, select CNNs appear to have superior image classification capabilities compared with humans 3 in cases where large amount of training data is available. CNNs are a specific architecture of feed-forward artificial deep neural networks. 4 In general, machine learning algorithms, such as deep learning, are frequently summarized under the umbrella term artificial intelligence (AI). In histopathology, AI is now enabling the automation of tasks that were previously an exclusive domain of human experts. In addition, new or more precise measurements from tissue are now feasible by AI. The number of examples is rapidly growing 5 and encompasses prostate and breast cancer diagnosis, 6 tumor characterization or6,7 classification in breast cancer, 8 mast cell tumor grading in veterinary medicine, 9 or pathologist-like scoring of model animal tissue.9,10 Specifically, mitotic figure quantification in hematoxylin and eosin (H&E)-stained tissue is an example of a labor-intensive task where CNNs can help to standardize and automate an important readout. Therefore, this task was addressed early on.7,11
The recently started BIGPICTURE initiative 12 bears the potential of further accelerating AI in histopathology as ImageNet did for the field of AI in computer vision in general. Particularly because BIGPICTURE is expected to provide an unprecedented amount of histopathological data, which is the “fuel” for tailored AI algorithms.
In toxicology, published applications of AI are limited to date. Examples include the detection of proliferative lesions 13 as well as the identification and differentiation of normal, aberrant, and degenerate mitotic figures induced by Eg5 inhibition in a transitional cell carcinoma model in rats 10 and staging of tubules in rat testes. 9 One major restriction in GxP-relevant areas is regulatory acceptance of digital pathology in general 14 and of AI applications specifically.15,16 However, AI can be readily used as a tool to facilitate pathologists’ decisions and help illustrate and quantify subjective histopathology results.
In this work, we address the AI-based automation of histopathological readouts in toxicology by applying CNNs to identify and quantify elevated mitotic indices (MIs) in rat liver induced by a drug candidate. The induction of liver tumors is a common outcome in 2-year rodent carcinogenicity bioassays.17,18 Identification of the mode of action that resulted in tumor induction is crucial in the human risk assessment of such outcomes, 19 and assessment of cell proliferation is often an important component of this approach.20,21 The impact of these results may thus require not only semiquantitative but also quantitative analysis of MI, which mostly relies on nonstandardized immunohistochemical and image analysis techniques. 22
The material used in our study is from a toxicity study with a glycogen synthase kinase-3 (GSK-3) inhibitor. GSK-3 plays an important role in cell division as it regulates the transition from G1 to S phase by affecting cyclin D expression via β-catenin. 23 Its role is phosphorylation of cytoplasmic β-catenin, which makes it a target for ubiquitination and degradation. This prevents its location into the nucleus, where it would promote cell proliferation by inducing transcription of cyclin D and c-MYC. Thus, inhibition of GSK-3 would be expected to promote cell proliferation. In addition, GSK-3 plays a role in microtubule dynamics and spindle morphology, and its inhibition may result in chromosomal misalignment. 24 GSK-3 function also is important for a proper mitotic checkpoint, as evidenced by the relive of spindle toxin-induced mitotic arrest by GSK-3 inhibition. 25 Indeed, GSK-3 inhibitor–treated cells showed a decreased MI in the presence of taxol when compared with controls. 25
5-Bromodesoxyuridin (BrdU) has been established as a sensitive, precise, and standardizable marker for cell proliferation.19,22 However, it requires a separate, experimental step and animal experiment, which is labor intensive and time consuming. 22 As the use of BrdU is relatively resource intensive and requires prospective planning, alternative methods like immunohistochemical detection of Ki-67 and of proliferating cell nuclear antigen (PCNA) may be preferred in certain conditions. But even the use of Ki-67 or PCNA as proliferation markers requires additional steps in the laboratory.
Here, we compare the two classical approaches, Ki-67 and BrdU immunohistochemistry (IHC) staining, with AI-based detection of mitoses for quantifying hepatocellular proliferation in rat liver from a routine toxicology study. For the AI-based detection in H&E-stained tissue, we used a commercial software with trainable tissue segmentation. In addition, we compared the performance of AI in detection of mitoses with that of two experienced pathologists. We quantified the differences of an AI-based mitotic figure detection in terms of time required for pathologists, accuracy of an AI system in comparison with established methods, as well as future applicability and scalability of an AI system once trained.
Material and Methods
The animal experiment was conducted in an AAALAC (Association for Assessment and Accreditation of Laboratory Animal Care International) accredited laboratory in full accordance with German animal welfare legislation and Boehringer Ingelheim principles for animal use.
Groups of seven male Crl:WI(Han) rats were treated by daily oral gavage with either vehicle (hydroxyxethyl cellulose, Ashland, Germany) or dose levels of 3, 10, or 30 mg/kg of a GSK-3 inhibitor (BI 11855, Boehringer Ingelheim, Germany) for 4 consecutive days. At arrival, animals were aged 7 to 8 weeks and weighed 150 to 200 g. They were housed under standard specific-pathogen-free conditions and received pelleted laboratory diet (Kliba, Switzerland) and municipal tap water (Stadtwerke Biberach) ad libitum. Osmotic minipumps (Alzet 2 ML, Charles River, Germany) were filled with a solution of 20 mg BrdU per milliliter physiologic saline and implanted subcutaneously under isoflurane anesthesia on the first day of dosing. Four hours after the last dose, all animals were euthanized by exsanguination under ketamine/xylazine anesthesia. Liver samples were fixed in 4% neutral buffered formaldehyde solution and processed to paraffin blocks.
Four-micrometer-thick serial sections were produced and mounted on adhesive glass slides; one slide per animal was stained with H&E. The subsequent slides were used for immunohistochemical demonstration of Ki-67 (monoclonal rabbit anti-human Ki-67 antibody, clone SP6; DCS Diagnostics, Germany) and BrdU (mouse anti-BrdU, clone IIB5; BioGenex, San Ramon, California). For IHC, standard antigen retrieval methods and avidin-biotin signal enhancement with peroxidase label were applied. Diaminobenzidine was used as chromogen and Mayer’s hematoxylin for counterstaining of nuclei. Stained slides were dehydrated and mounted with glass cover slips. Details of the immunohistochemical staining procedure can be found in the Supplemental Material.
H&E-stained slides and IHC slides were scanned at 40× and a resolution of 0.23 µm/pixel using a Hamamatsu Nano Zoomer S360. Images were generated by NZ Acquire software and stored in the proprietary ndpi format. Slide identification followed a predefined naming convention and was based on a human-readable, slide-specific numbering system. This format easily allowed subsequent processing of results. From each dose group and controls, 2 animals were selected to serve as a training set, 2 animals for validation, and 3 animals as test set, respectively (Figure 1).
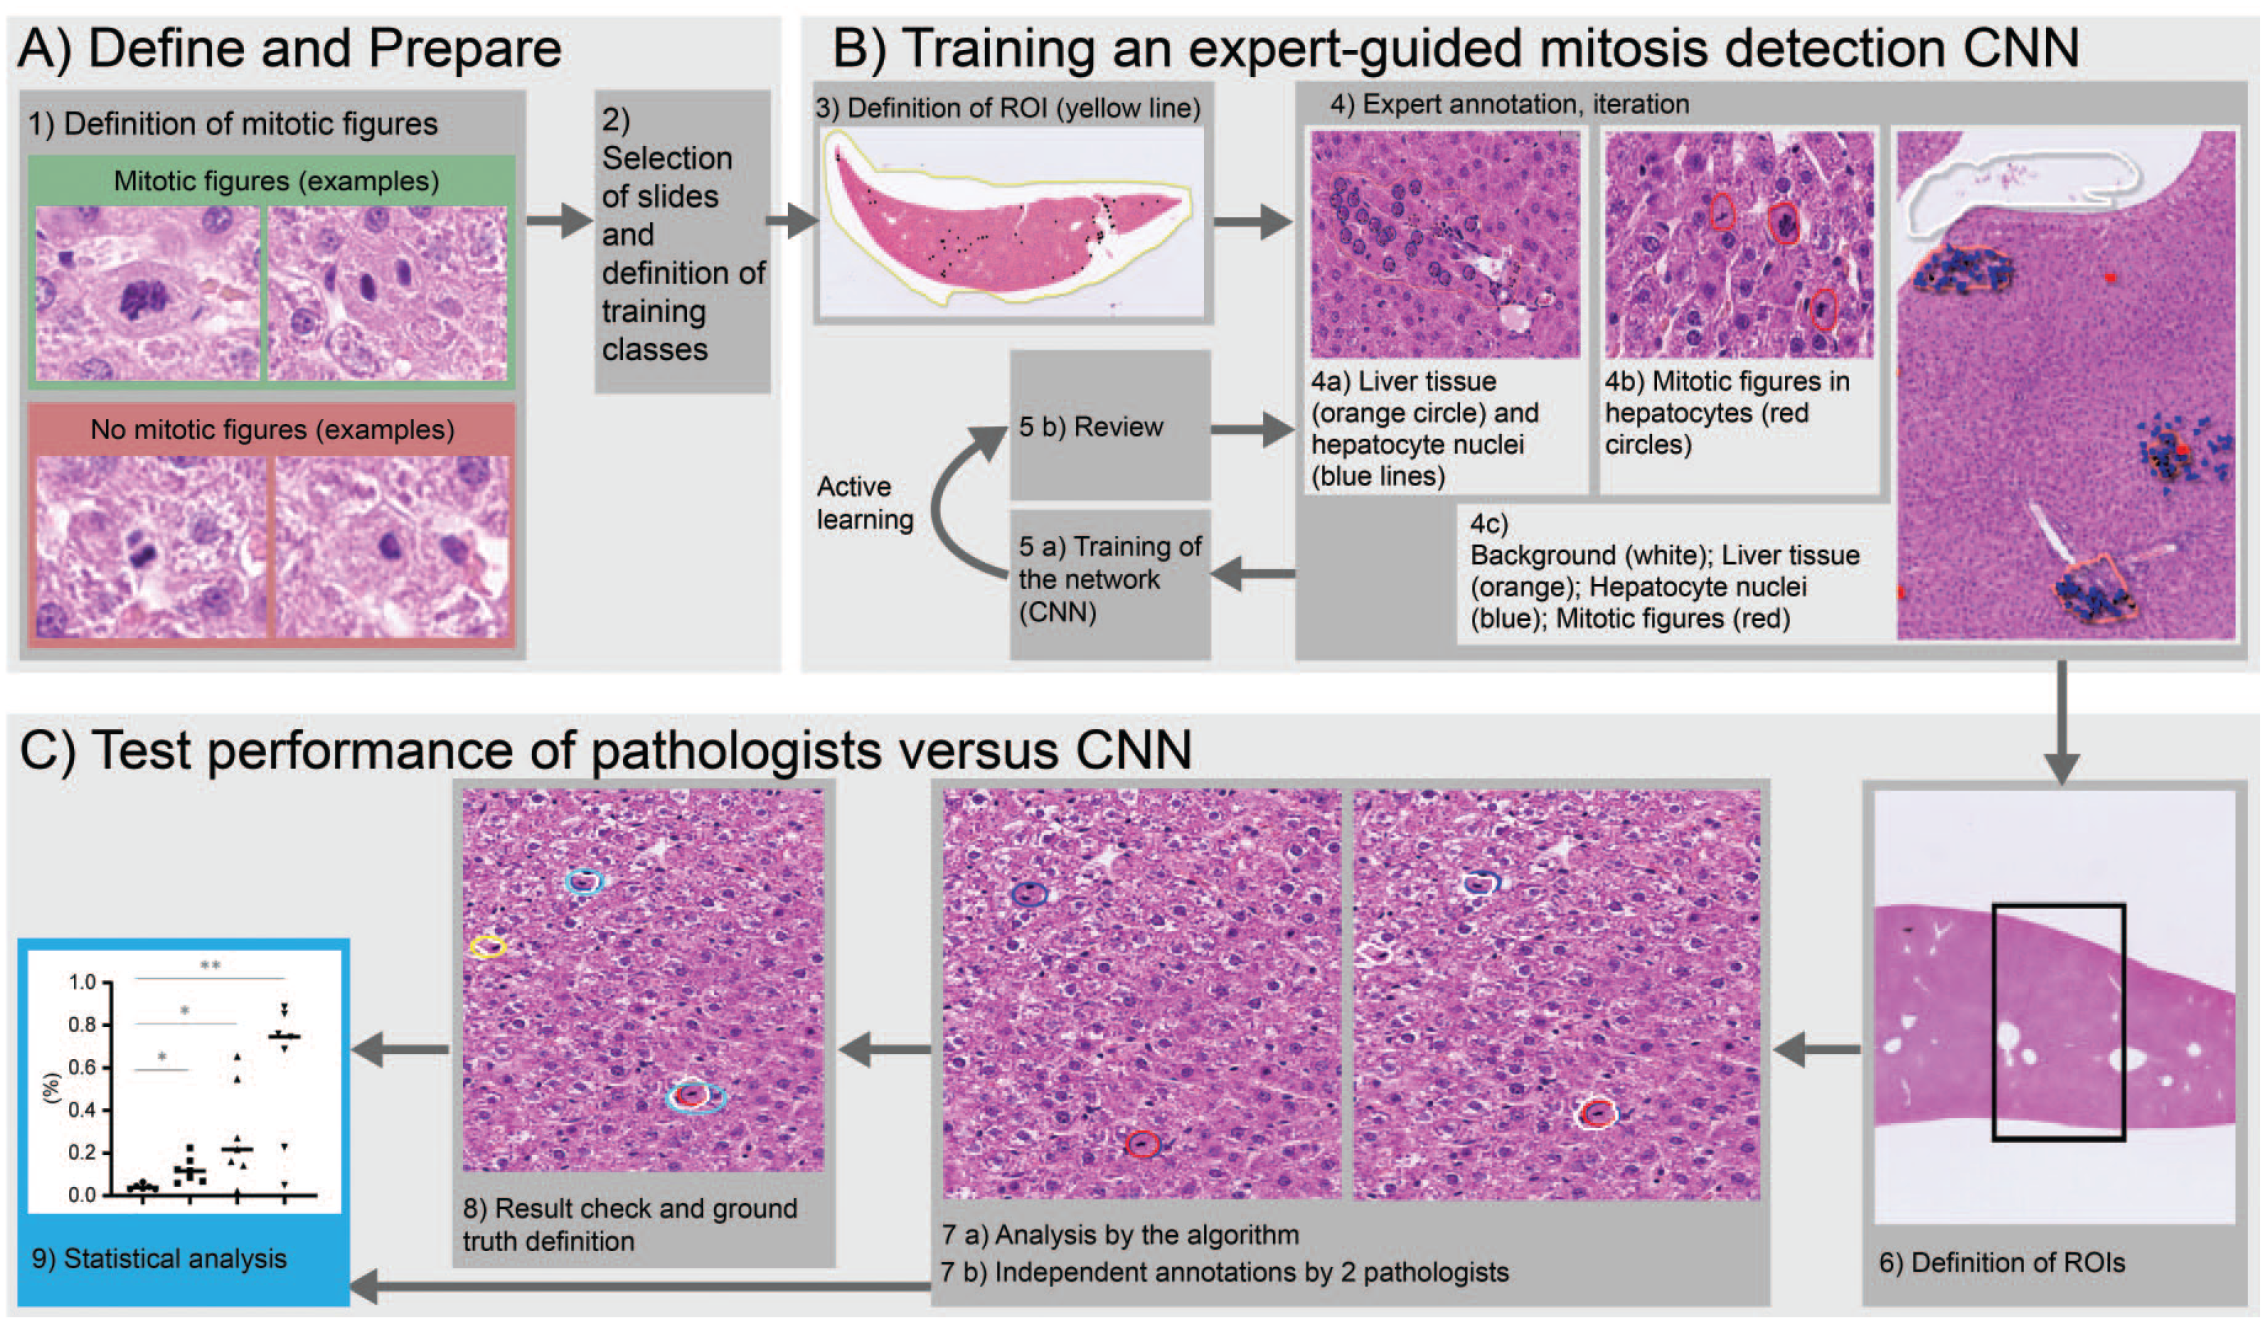
Overview of the workflow to train and evaluate a CNN-based mitotic figure segmentation approach for H&E-stained liver tissue. (A) First (1), a consensus for mitotic figures was defined. Second (2), slides for training and testing were defined, as well as the procedure to train the CNN (i.e., number and types of classes). (B) Subsequently, the CNN was trained by an expert pathologist within a defined region of interest (ROI, 3, yellow). Four classes (4a-c) were annotated: (4a) orange: liver tissue; (4a) blue: hepatocyte nuclei; (4b) red: hepatocyte mitotic figures; and (4c) white: background class. Subsequent repeats of training, CNN application, and review of results allowed a continuous improvement of the CNN following the “active learning” approach, i.e. by focusing on the most challenging areas, active learning allowed to use the time of the pathologist for training most efficiently. (C) The performance of the CNN was compared with two pathologists. Mitotic figures were counted in predefined ROIs (6), by the CNN (white, 7a) and two pathologists (red and blue, 7b). All mitotic figures were reviewed by the two pathologists and a consensus GT of mitotic figures was defined (8) followed by comparison of the individual and CNN results with the GT and a statistical evaluation (9). CNN indicates convolutional neural networks; GT, ground truth; H&E, hematoxylin and eosin.
BrdU-stained and Ki-67-stained samples were analyzed for positive nuclei using the digital pathology software Halo 3.2 (Indicalabs, Albuquerque, New Mexico). For detection of BrdU- and Ki-67-positive cells, the Halo CytoNuclear IHC module was applied. Briefly, colors were manually tuned for optimal color deconvolution of nuclear and positive IHC stain. Cells were segmented by visually tuning segmentation parameters and positive cells identified by positive stain above a threshold. The threshold was manually optimized to recognize most positive cells while not responding to the majority of negative cells and cells in controls.
For detection of mitotic figures in H&E-stained slides, Halo with the HALO-AI plugin (Indicalabs, Albuquerque, New Mexico) was used. The DenseNet CNN was used to segment the tissue. A preparatory step for training the CNN for mitotic figure detection in H&E slides was the morphological definition of relevant structures: A catalog of mitotic figures and structures not considered to represent mitotic figures was prepared and aligned with a panel of six experienced pathologists. This catalog was used for reference purposes for training of the CNN. Hepatocyte nuclei were considered as such only if a nuclear membrane was unequivocally visible. This excluded purely tangential nuclear profiles. Based on these conventions, the tissue segmentation CNN was trained on H&E-stained slides in an iterative active learning fashion, i.e. repeated training, and evaluation cycles by an expert pathologist (P1). Four classes were defined and segmented: hepatocyte nuclei, hepatocyte mitotic figures, liver tissue (excluding hepatocyte nuclei, hepatocyte mitotic figures, and large blood vessels), and background (lumen of large blood vessels and glass slide without liver tissue; see Figure 1) on the training set slides. With the use of the class “liver tissue,” we intended to train the contrast between mitotic figures and hepatocyte nuclei on the one side and cytoplasmic details like clumps of rough endoplasmic reticulum on the other. Furthermore, it was intended to enable the distinction between mitoses of hepatocytes and mitoses of other cells.
Details of the slide selection and training process are described in the Supplemental Material.
The performance of the trained CNN was assessed by analyzing regions of interest (ROIs) on the test set (i.e., not used for CNN training). The ROIs were rectangular and randomly placed over areas of the slides that included both subcapsular and central tissue areas. The time to analyze these ROIs by the CNN was measured by the difference of end and start time of running the algorithm in Halo.
To compare the mitotic figure detection of the CNN with human experts, two veterinary pathologists (P1 and P2) analyzed the test slides. The pathologists independently annotated mitotic figures in the ROIs using the software Halo and according to the previously defined criteria (see above).
To compare the analysis time for pathologists and CNN, both pathologists P1 and P2 also measured the time required for annotation of each ROI. The start time was defined by opening of the first image in Halo; the end time was defined by finalizing last annotation. Additional time, such as loading the software or organizing the slides, was not included in the analysis.
After analysis, both pathologists also reviewed their combined annotations of mitotic figures within the ROIs and formed a consensus ground truth (GT).
Statistical analysis of correlation and group differences was performed using the software GraphPad Prism 9 (GraphPad Software, San Diego, California). For correlation analysis between two variables, Pearson’s correlation coefficient r was computed. For the test of significant differences between two groups, Welch’s two-tailed t test was applied.
Results and Discussion
Figure 1 shows an overview of our approach to train and evaluate a CNN-based mitotic figure segmentation for H&E-stained liver tissue. First, a consensus definition for mitotic figures was defined by the participating pathologists (Figure 1A, 1). Clear cases of mitotic figures were defined as follows: absence of a clearly visible nuclear membrane, morphological nuclear changes consistent with prometaphase, metaphase, anaphase, and telophase. Features like hypereosinophilia of the cytoplasm or chromatin condensation were not considered to be reliable indicators of mitotic figure as stand-alone criteria. Subsequently, the CNN to perform the segmentation was trained by an expert pathologist (P1) (Figure 1B, 3). Using a graphical user interface, which allowed browsing and annotation, the pathologist annotated four classes (Figure 1B, 4) in the whole slide scans of H&E-stained liver tissue: (1) liver tissue, (2) hepatocyte nuclei, and (3) hepatocyte mitotic figures based on the previous definition (Figure 1B). (4) A background class ensured that glass and artifacts were not analyzed. The class hepatocyte nuclei allowed counting of all nonmitotic hepatocyte nuclei (in the interphase or in the resting phase) in the liver tissue nI, which in combination with the number of mitotic cells nM allowed the calculation of the MI as nM/(nM + nI).
After an annotation session by the expert pathologist, the CNN was trained with these annotations and subsequently applied to segment the tissue into the four classes of the training set of slides. The pathologist reviewed the resulting segmentation and now actively focused on the annotation of areas where the current CNN had false hits, e.g., certain mitotic figures, which the CNN not yet identified. This iterative approach follows the “active learning” paradigm in machine learning, 26 where a teacher (the pathologist) can train a deep learning system (the CNN) in a fixed amount of time with highest efficiency by focusing particularly on the most challenging cases (i.e., cases close to the decision boundary between classes). These annotation, train, and review iterations were repeated several times (Figure 1B, 5a and 5b) until all visible cases were correctly segmented and only cases remained which were also ambiguous for human experts, i.e. the level of inherent ambiguity of the sample was reached.
Once a sufficiently good CNN was obtained (i.e., the training pathologist verified the CNN-identified classes correctly in several validation slides), the system performance was evaluated and compared with the GT (Figure 1C). For this purpose, randomly selected and variably sized ROIs including subcapsular and central tissue areas were defined on a test set of liver slides not used for training. It consisted of 2 animals from each group. The size of the ROIs (Figure 1C, 6) allowed for an exhaustive mitotic figure detection by the pathologists. Mitotic figures in the ROIs were subsequently identified by the CNN (Figure 1C, 7a) and two pathologists independently (P1 and P2, Figure 1C, 7b). After the independent analysis, the GT was defined by the two pathologists (Figure 1C, 8). For this purpose, the pathologists analyzed all mitotic figures identified by one or both pathologists and/or the CNN within the ROIs and reached a consensus set by reviewing all of them together. This compensated for differences in detected mitotic figures by pathologists due to a different interpretation of consensus mitotic figures (false positives, false negatives), or due to the simple fact that humans may miss visual items (false negatives) or may differ in the interpretation of predefined criteria. Figure 2A shows an example ROI with mitotic figure identifications by the pathologists P1 and P2 as well as the GT consensus mitotic figures. In a few cases, e.g. the lower mitotic figure of center left, identifications from P1 and P2 differed (P1: not marked, P2: marked). A review and discussion resulted in incorporation of this mitotic figure into the GT. Figure 2B shows the comparison of the number of detected mitoses for P1, P2, and the CNN to the GT. P1, P2, and the CNN were correlated with the GT (r² = 0.93 CNN − GT, r² = 0.99 P1 − GT, r² = 0.99 P2 − GT), but yielded different slopes compared to the GT. Hence, each “analyzer” (P1, P2, and CNN) had its own sensitivity, or “detection characteristic.” The CNN yielded slightly higher mitotic counts than the GT, by also detecting a few cases which were not in the GT (e.g., borderline mitotic figures which were not considered as such after pathologist review for the GT). P2 followed the GT quite close and P1 was more conservative and counted fewer mitotic figures.
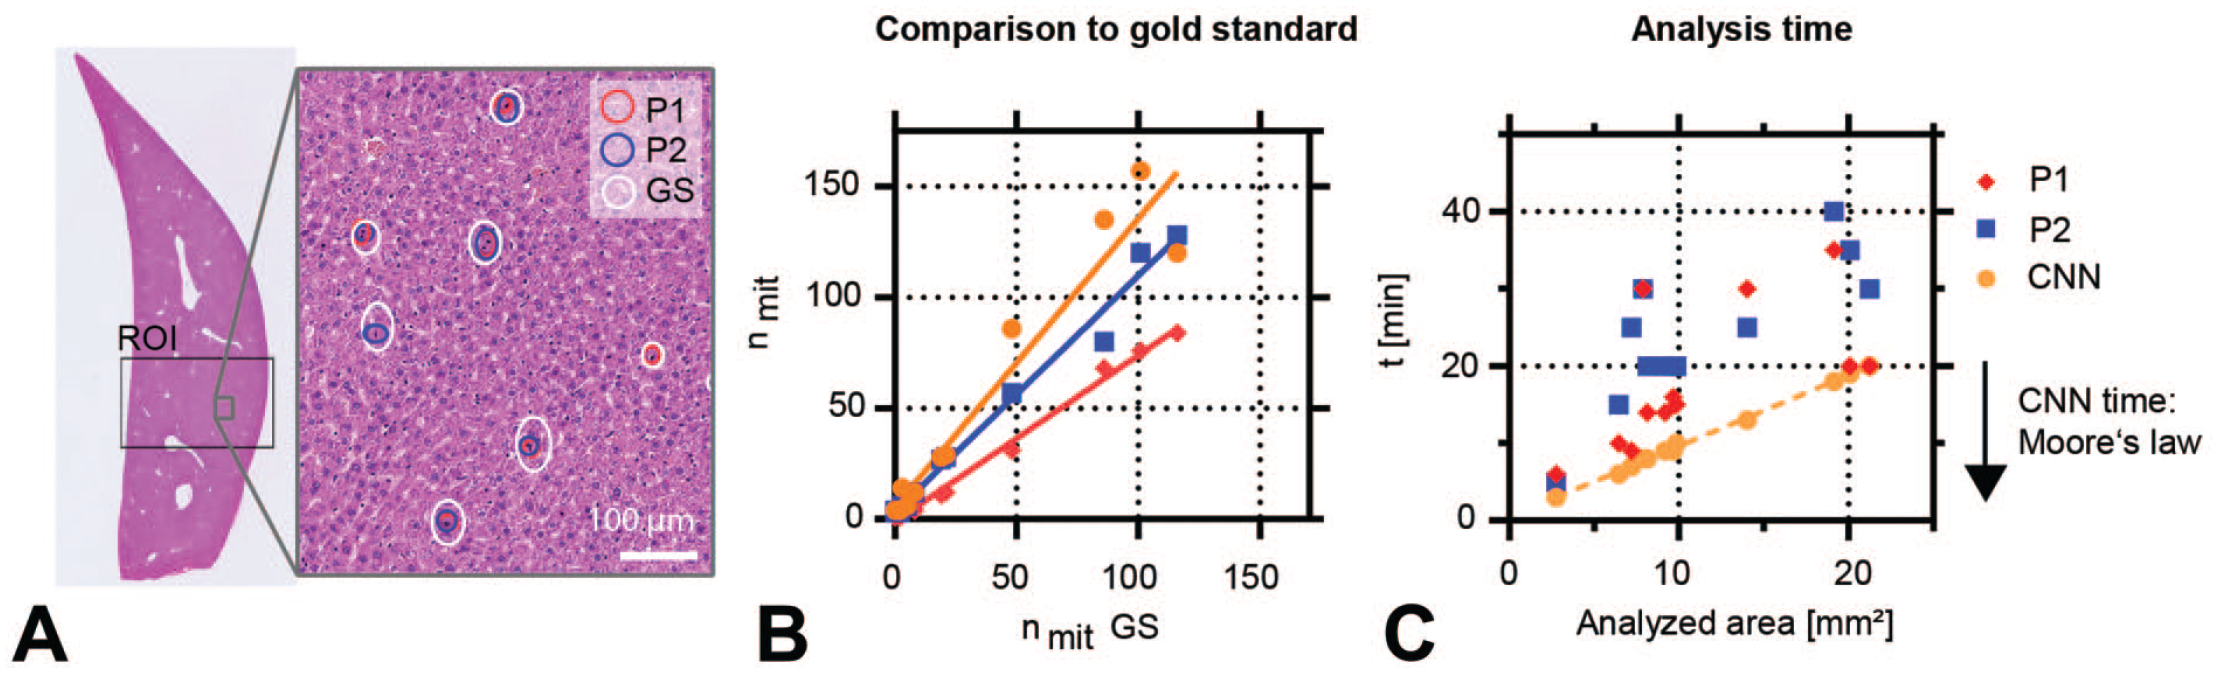
Comparison of mitoses detections and analysis time for two pathologists and the CNN algorithm within a region of interest (ROI). (A) Example mitotic figure identifications by pathologists P1 (red) and P2 (blue) and the GT (white) consensus mitotic figures within the ROI. (B) Comparison of number of detected mitoses for P1, P2, and the CNN to the GT. (C) Comparison of analysis time within the ROI vs the area of the ROI: CNN analysis time was approximately two times faster than the pathologists. In the future, this difference in speed will further increase due to accelerating speed of computers (Moore’s law). CNN indicates convolutional neural networks; GT, ground truth.
Notably, by repeating the “active learning” iterations shown in Figure 1B and described above, the CNN performance can be tuned as desired (e.g., correct for the slightly higher detection rates compared to GT). Hence, all “analyzers” (P1, P2, and CNN) exhibit a different detection characteristic, and application of a trained and calibrated CNN in a fixed state is helpful for standardization of such a task and thus will allow for a better comparison of experimental results. In contrast to human experts, a CNN will score identically on different days (no intra-observer variability). However, a human expert in the loop is required to verify results, retrain if required and analyze and interpret results. We trained the CNN on slides from one study only. We expect that application to slides from another study (in particular another animal strain or laboratory procedures) may require training iterations before an accuracy similar to that in our study can be achieved.
We next compared the time required to analyze vs the ROI area in square millimeter. As shown in Figure 2C, the analysis time of the CNN (on a Nvidia GTX 1080 graphics card) was approximately two times faster than the pathologists and had a near perfect correlation with the analysis area, since the CNN analyzes the area patch by patch. For the pathologists P1 and P2, a correlation is visible; however, the scatter is higher. Humans can ignore background areas, take short breaks, get interrupted, or have fluctuating identification performance over time. A CNN, however, can run steadily 24/7. In the next years, the CNN analysis time will gradually diminish as computers get faster and faster. This is based on the empirical observation of Intel’s Gordon Moore, coined as “Moore’s Law,” 27 that the electronical circuit density doubles every two years, which holds true since 1965 until today (circuit density is approximately proportional to computational speed, which therefore increases exponentially).
After training and evaluation of the CNN, we compared the quantification of cell proliferation by AI-assisted mitosis detection to BrdU and Ki-67 labeling indices (LIs) determined for the same tissues as shown in Figure 3. First, we determined the BrdU and Ki-67 LIs from IHC-stained slides of the 4-day study with the GSK-3 inhibitor BI 11855. The BrdU LI represents the current gold standard for quantification of cell proliferation, while Ki-67 28 represents another established marker of cell proliferation that can be applied also on archival paraffin material. A semiquantitative histopathological evaluation by the study pathologist and within the context of the study showed a dose-dependent increase in positively labeled (BrdU, Ki-67) cell nuclei in the mid and high dose. Figure 4A shows that this previous result could be reproduced with all three methods. In each case, the group mean LIs or MIs, respectively, showed a dose-related increase. 24
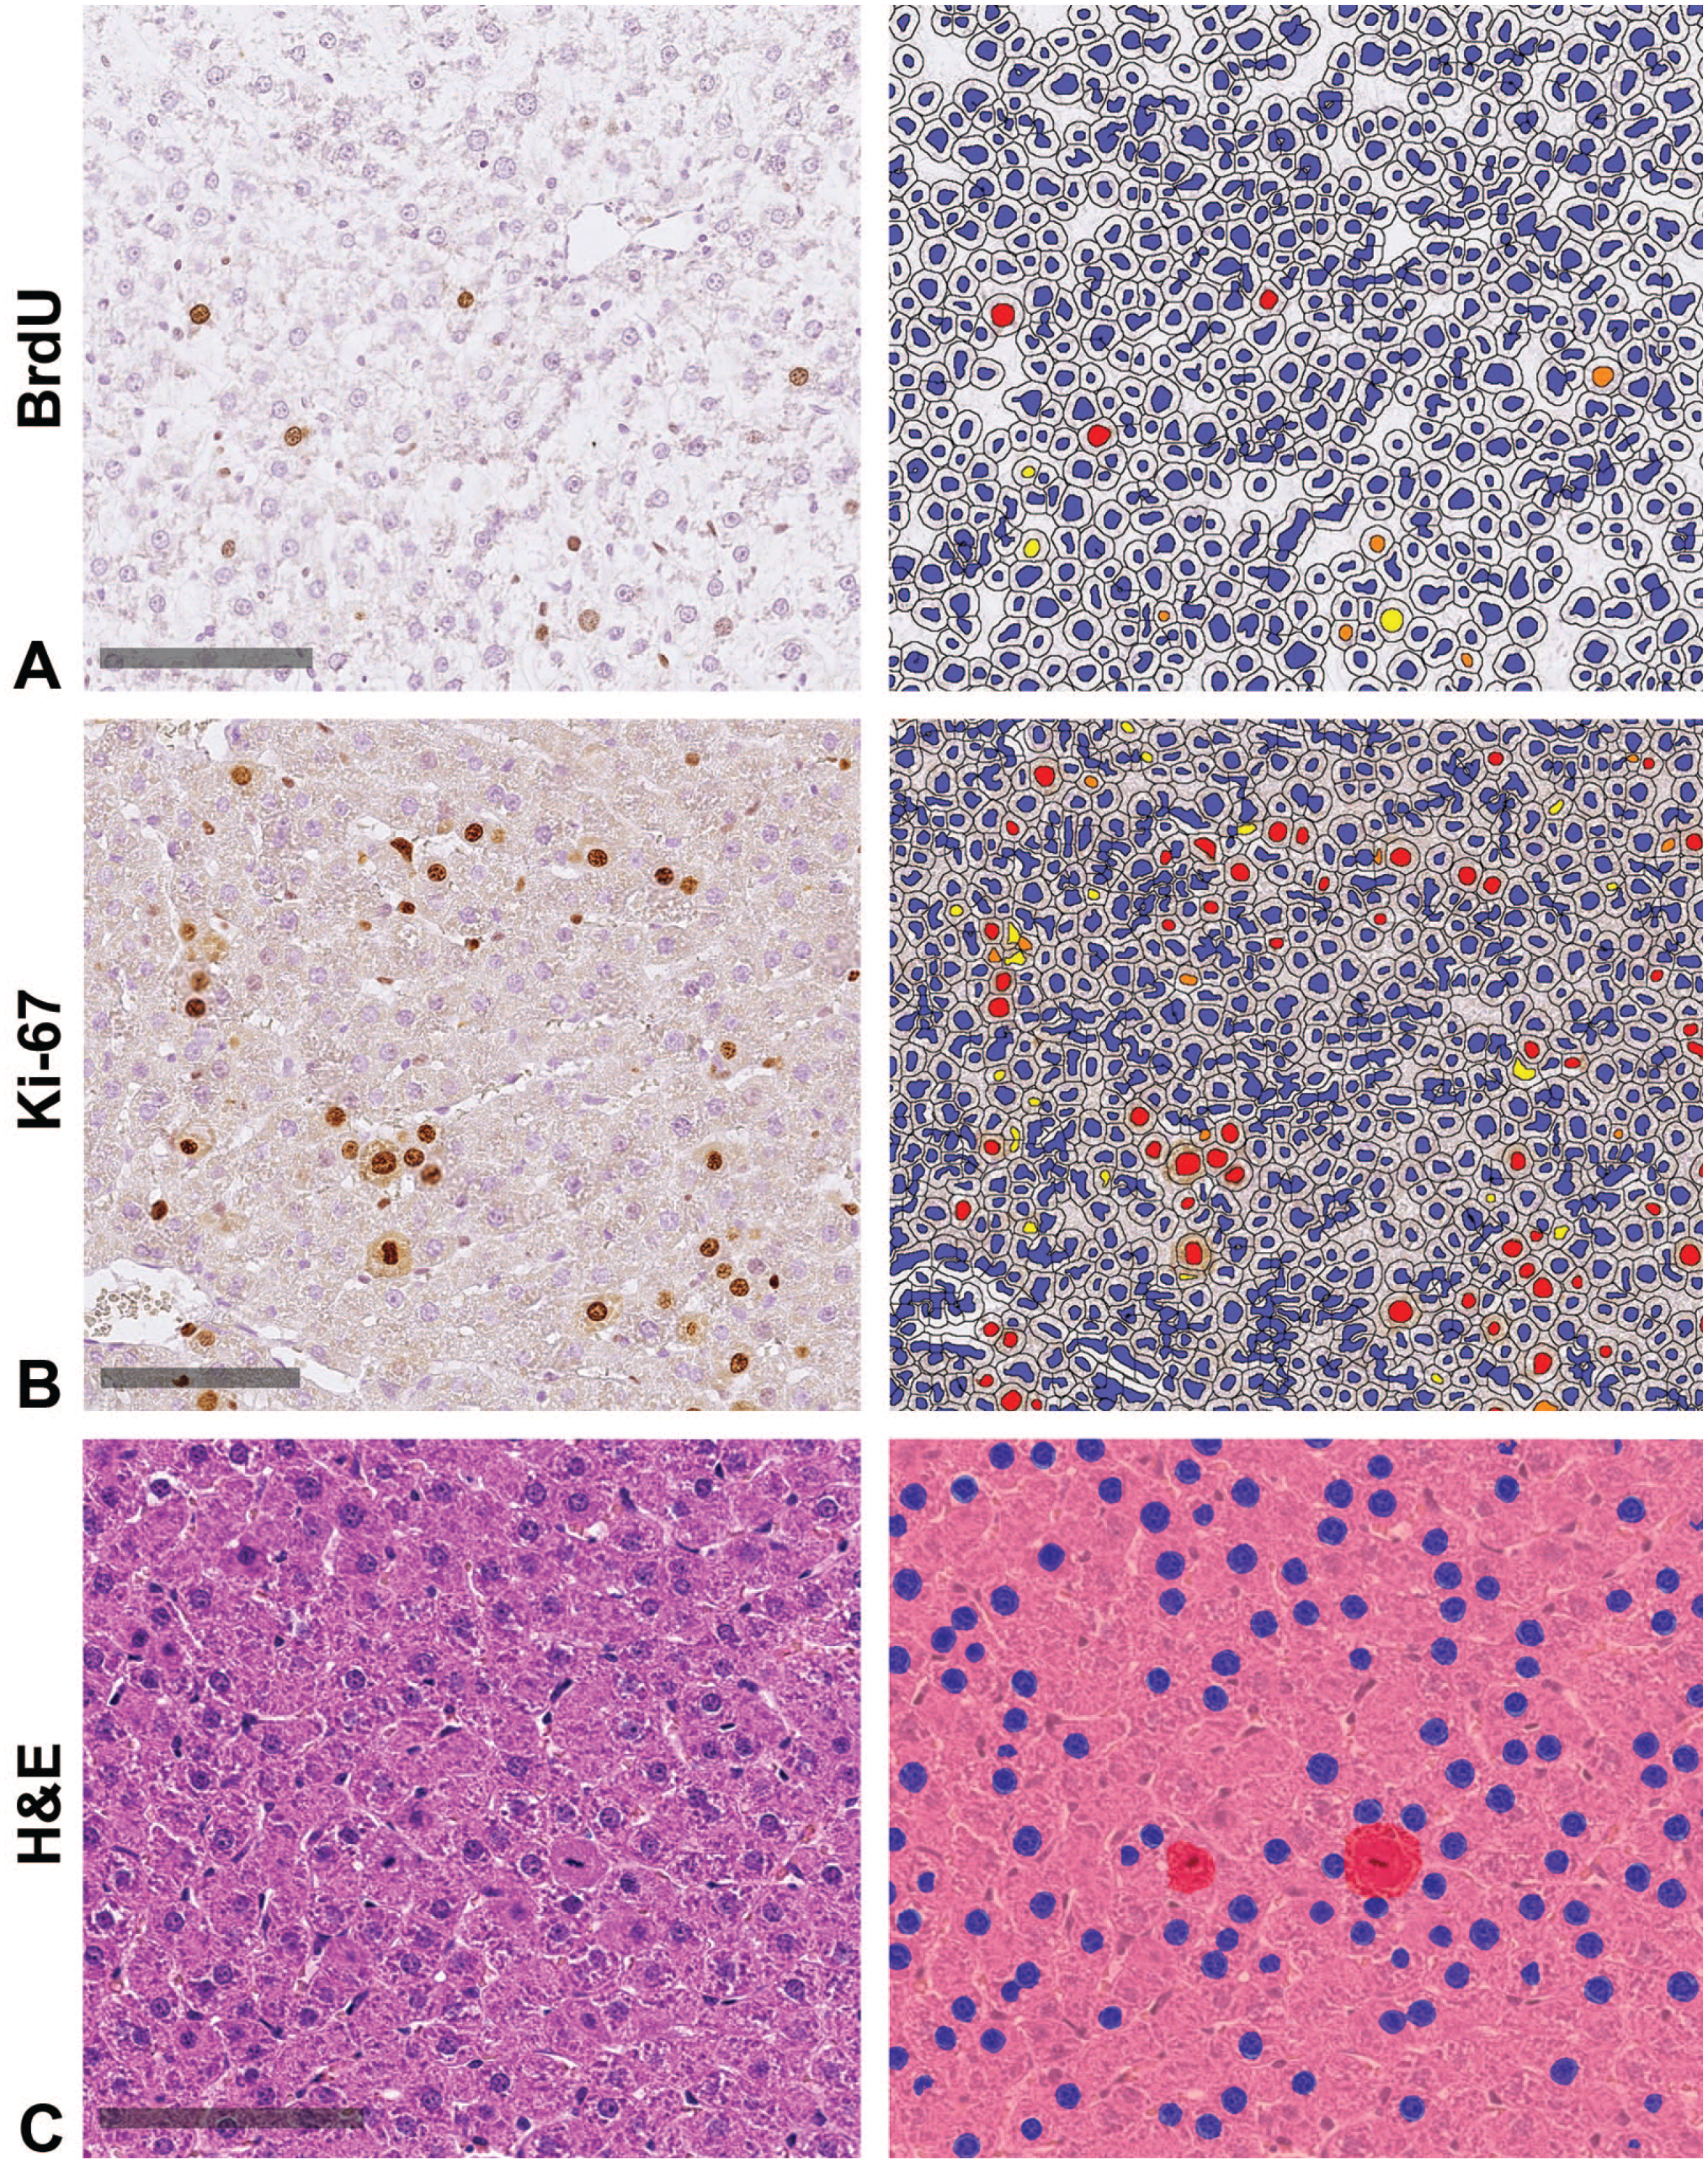
CNN detection of immunohistochemical signaling and mitotic figures in H&E-stained slide. (A) BrdU staining with positive nuclei displaying a brown signal (left) and signal detection (red) by the Halo CytoNuclear IHC module (right). (B) Ki-67 staining with positive nuclei displaying a brown signal (left) and signal detection (red) by the Halo CytoNuclear IHC module (right). (C) H&E staining with visible mitotic figures (left) and signal detection (red) by the trained CNN (right). IHC-negative nuclei and nonmitotic nuclei detected by the CNN are marked in blue; IHC-positive nuclei or mitotic figures detected by the CNN are marked in red, orange, and yellow. Scale bars 100 µm. CNN indicates convolutional neural networks; H&E, hematoxylin and eosin; IHC, immunohistochemistry.
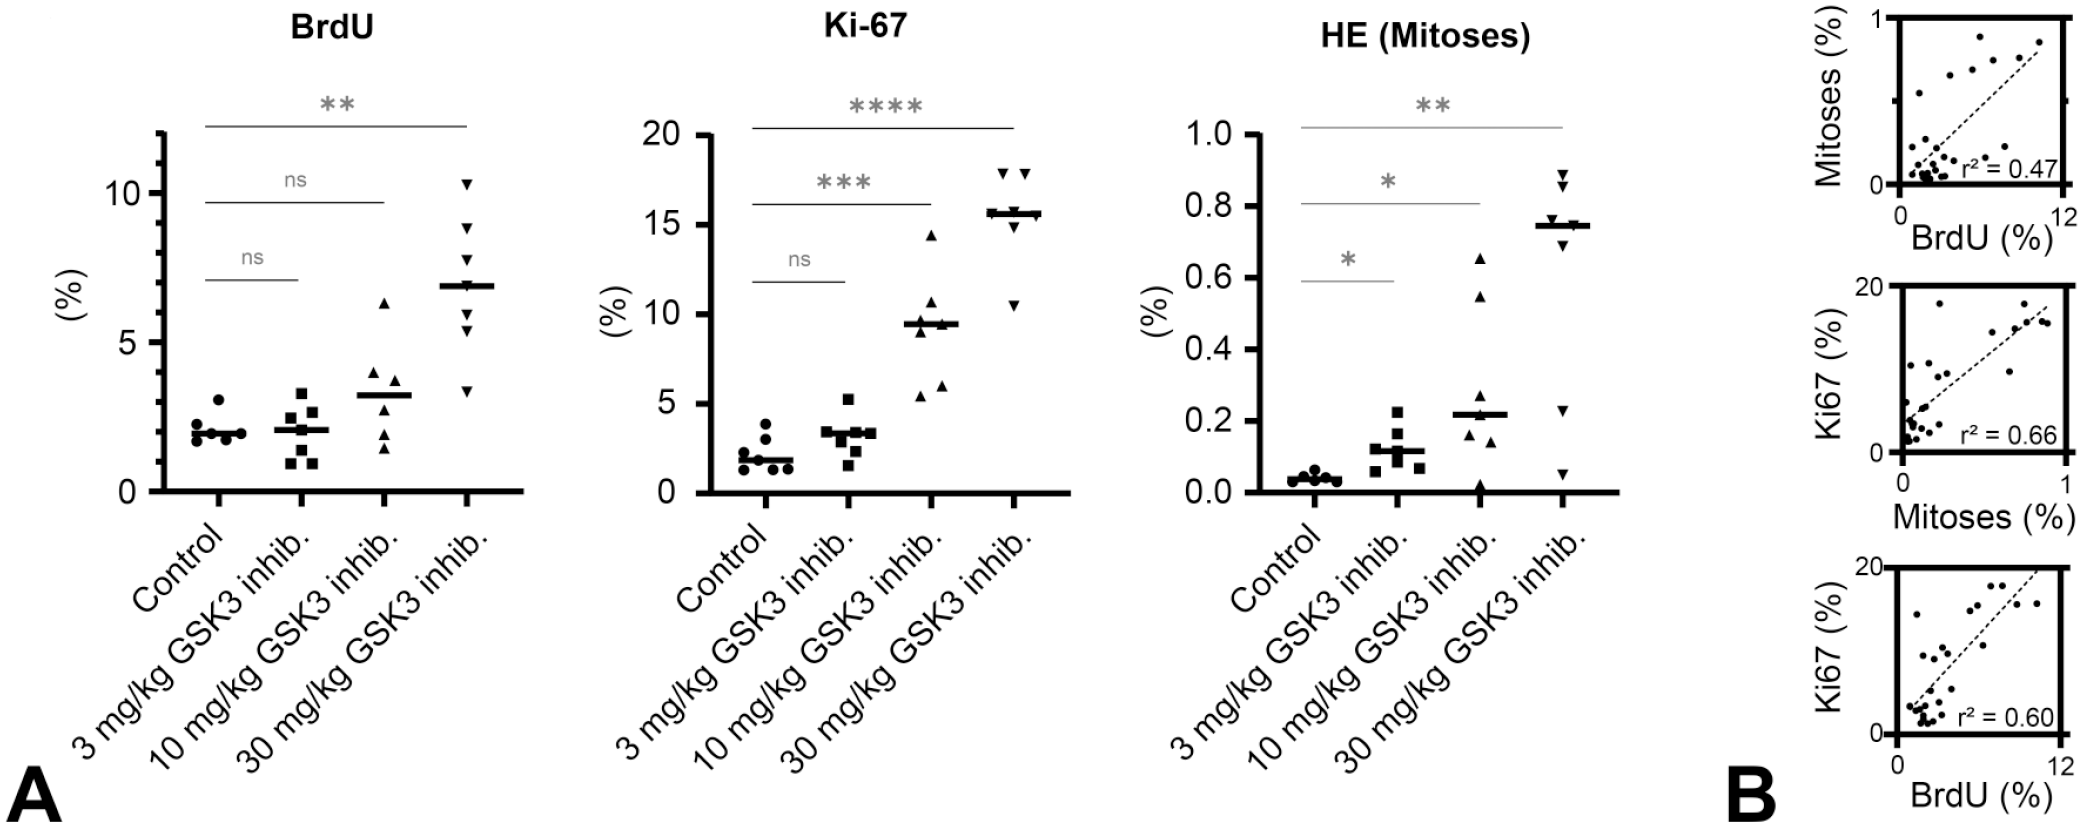
Comparison of different methods of quantifying cell proliferation. (A) BrdU LIs, Ki-67 LIs, and H&E-based MIs determined by the CNN. The BrdU LIs and Ki-67 LIs of the low dose are not significantly increased compared with control, and only the highest (BrdU) or two highest doses (Ki-67) increased the LIs significantly. The CNN-based mitotic figure detection in H&E-stained slides revealed a dose-dependent increase of MIs at all dose levels. (B) The results of the three methods show a clear, but in terms of r² only moderate correlation (Pearson’s r² of 0.47-0.66). CNN indicates convolutional neural networks; H&E, hematoxylin and eosin; LIs, labeling indices; MIs, mitotic indices.
For the gold standard BrdU, differences in LIs of the low and mid dose to the control group were statistically not significant (P > .05). Only the highest dose of 30 mg/kg resulted in a significant difference (P = .0012). For Ki-67, already the mid and again the high dose resulted in significant differences (P = .005 for 10 mg/kg and P < .0001 for 30 mg/kg). The CNN-based detection of mitoses in H&E-stained slides resulted in significant differences of the MIs for all groups compared with the vehicle control (P = .0112 for 3 mg/kg, P = .0292 for 10 mg/kg, and P = .0039 for 30 mg/kg). Thus, in this study, H&E-based mitotic figure detection by the CNN was as sensitive in detecting a test item-related effect on cell division as the classic Ki-67 and BrdU LIs, probably even more sensitive. However, this superiority of CNN-based mitosis detection needs to be cautiously interpreted with regard to quantification of cell proliferation:
The three methods quantify different end points of cell division activity which lead to different values of MIs and LIs. Ki-67 yielded the highest percentage of positive cells, BrdU was in the middle, and H&E-based mitoses detections using the trained CNN yielded the lowest absolute counts. This is reflecting differences on how the three methods detect the biological processes of cell division during the cell cycle. H&E-based mitotic figure detections capture morphologically distinct mitotic figures. BrdU is incorporated into the DNA during the S phase and subsequently creates a signal. 22 It remains in the DNA also when cells leave the S phase and will be transferred to daughter cells with each cell division. This may explain the higher BrdU LIs when compared with the MIs. Furthermore, BrdU may be incorporated during DNA repair independent of cell division. Also, the dependency of BrdU LIs on the duration of BrdU exposure needs to be considered. A longer exposure of more than 4 days will result in higher LIs, and shorter duration will reduce the LIs. For cell proliferation assessment in liver, a BrdU exposure of 3 to 7 days has been recommended, 22 indicating that changes of that parameter may not substantially increase the ability of this method to detect intergroup differences in LIs. Ki-67 is activated during G1, S, and M phases of the cell cycle, which explains the high signal. Differences in the underlying cell cycle phases, captured by each method, are also highlighted by the correlation coefficients of the three methods (Figure 4B). All methods are correlated, but only to a moderate degree as indicated by Pearson’s r² of 0.47 to 0.66.
Literature data showed that GSK-3 inhibition may increase cell proliferation. 25 This is in line with our observation of an increased LI and MI of hepatocytes induced by our GSK-3 inhibitor BI 11855. Previous studies also demonstrated that GSK-3 inhibitors may induce chromosome misalignment and delayed mitotic entry and exit. 29 This may have contributed to the higher sensitivity to detect an effect of BI 11855 on cell division by CNN-based mitosis detection when compared with BrdU LIs or Ki-67 LIs. It exemplifies that the method to be applied for the assessment of cell proliferation needs to be cautiously selected, and that this selection should be done in awareness of potential interaction of the test item with the cell cycle.
The different zones of the liver lobule exhibit differences in proliferative behavior with the highest proliferation usually occurring in the periportal areas. 30 Taking this difference into account, a zonal (lobule-dependent) approach in cell proliferation assessment of the liver has been suggested. 31 This approach may enable the detection of slight changes of proliferation in certain subpopulations of hepatocytes. It would be the consequential next step to further develop our trained CNN by implementing the detection of centrilobular and periportal areas.
Conclusion
The results of this study highlight the potential of AI to automate routine tasks in digital pathology that until recently were only possible for biomedical experts (e.g., pathologists). In cases such as the H&E-based determination of MIs, these tasks have not been feasible on an industry scale because they would cost too much time of these in-demand experts.
We have shown that AI-based mitotic figure detection using H&E-stained tissue slides yields results comparable to those of a trained pathologist. Differences in the sensitivity of BrdU LI, Ki-67 LI, and CNN-based detection of mitoses were interpreted as potentially related to the pharmacology of BI 11855 targeting GSK-3. We conclude that method selection for the assessment of cell proliferation should be conducted in consideration of potential test item-related effects on specific steps of cell division. In the future, and with regard to the liver, a prior segmentation of the liver tissue (periportal, midzonal, or centrilobular) and an analysis per such segment may help to further improve the accuracy of these readouts.
As discussed recently, 32 AI-based analysis of histopathological features has several inherent advantages, which will help these systems to succeed in automating many routine tasks in toxicologic pathology.
First, trained AI models can be continuously improved and shared. Regular supervision by human experts and retraining will enable AI models coping with broader morphological, stain and scanner variations. This will lead to optimized AI models for certain tasks, and thus the potential to be shared within or across organizations.
Second, AI systems can run tirelessly and allow pathologists to spend more time on more complex overarching tasks, e.g. detailed histopathological evaluation of less common findings, or analyzing the scientific context of a study instead of performing time-consuming quantification tasks.
Finally, CNN-supported assessment of cell proliferation by determination of MIs can be performed on routine histological slides. It does not require an additional animal experiment, as it would be the case when using BrdU LIs. Thus, application of CNNs in toxicologic pathology will contribute to animal welfare according to the 3R principles.
In future, pathologists will closely interact with AI tools, and AI tools may take over laborious work. In the light of narrow timelines in pharmaceutical industry, this will ultimately help to improve efficiency of drug development and contribute to the reduction of animal use.
Supplemental Material
sj-docx-1-tpx-10.1177_01926233221083500 – Supplemental material for Quantification of Hepatocellular Mitoses in a Toxicological Study in Rats Using a Convolutional Neural Network
Supplemental material, sj-docx-1-tpx-10.1177_01926233221083500 for Quantification of Hepatocellular Mitoses in a Toxicological Study in Rats Using a Convolutional Neural Network by Fabian Heinemann, Charlotte Lempp, Florian Colbatzky, Ulrich Deschl and Thomas Nolte in Toxicologic Pathology
Footnotes
Acknowledgements
We acknowledge Anja Krämer for conducting the immunohistochemistry and Arno Kalkuhl for design of the in vivo study.
Declaration of Conflicting Interests
The author(s) declared the following potential conflicts of interest with respect to the research, authorship, and/or publication of this article: The authors are employed by Boehringer Ingelheim Pharma GmbH & Co. KG, the organization that sponsored the work reported here.
Funding
The author(s) received no financial support for the research, authorship, and/or publication of this article.
Supplemental Material
Supplemental material is available in the online version of the article.
References
Supplementary Material
Please find the following supplemental material available below.
For Open Access articles published under a Creative Commons License, all supplemental material carries the same license as the article it is associated with.
For non-Open Access articles published, all supplemental material carries a non-exclusive license, and permission requests for re-use of supplemental material or any part of supplemental material shall be sent directly to the copyright owner as specified in the copyright notice associated with the article.