
Abstract
In Tg-rasH2 carcinogenicity mouse models, a positive control group is treated with a carcinogen such as urethane or N-nitroso-N-methylurea to test study validity based on the presence of the expected proliferative lesions in the transgenic mice. We hypothesized that artificial intelligence–based deep learning (DL) could provide decision support for the toxicologic pathologist by screening for the proliferative changes, verifying the expected pattern for the positive control groups. Whole slide images (WSIs) of the lungs, thymus, and stomach from positive control groups were used for supervised training of a convolutional neural network (CNN). A single pathologist annotated WSIs of normal and abnormal tissue regions for training the CNN-based supervised classifier using INHAND criteria. The algorithm was evaluated using a subset of tissue regions that were not used for training and then additional tissues were evaluated blindly by 2 independent pathologists. A binary output (proliferative classes present or not) from the pathologists was compared to that of the CNN classifier. The CNN model grouped proliferative lesion positive and negative animals at high concordance with the pathologists. This process simulated a workflow for review of these studies, whereby a DL algorithm could provide decision support for the pathologists in a nonclinical study.
Keywords
Introduction
Deep learning (DL), a subset of machine learning, employs artificial intelligence (AI) using convolutional neural network (CNN) and is emerging as an ideally suited method for diagnostic and toxicologic pathology. 1 By providing supervised training of classification models, medical and veterinary pathologists can use AI technology to improve workflows, simplify and quantify output, and discover novel patterns within data. 2 Although AI is not new, significant improvements in hardware, software, and supportive infrastructure have resulted in a digital pathology renaissance, whereby the cost, speed, and user-friendliness of AI have made this technology accessible to the practicing toxicologic pathologist. 1,3
Efforts to reduce research and development costs within the medical and agrichemical industries have been a high-priority focus and resulted in substantial organic growth in the contract research organization industry. 4 In 2019, toxicologic pathologists at Charles River Laboratories (CRL) examined approximately 4 million tissues placed on glass microscopic slides in Discovery and Safety Assessment research, supporting medical and agrochemical companies.
The workflow for examining tissues on glass slides using a light microscope is well established but not efficient for the toxicologic pathologist. For examination purposes, sections from tissues are placed onto glass slides; retrieved singly from boxes, flats, or trays; and examined individually. From the author’s experience, the time implications directly related to sample management (sample retrieval and handling, microscope setup and orientation, and sample storage and archiving) have a notable impact on the efficiencies of sample evaluation and work processes. Also, direct comparison or blinded reviews using the conventional microscope are cumbersome and time-consuming. Finally, a large proportion of tissues examined by a pathologist are normal or only have background changes expected for the animal model. A well-designed digital pathology and AI methodology that support improved workflows and provide diagnostic decision support for the toxicologic pathologist could facilitate their evaluation of the 100s of tissues they examine daily. 5 The CNN applications within digital pathology systems have found success in clinical arenas whereby previous studies 6 have reported the potential for pathologists to exclude 65% to 75% of slides while retaining 100% sensitivity. These evidenced benefits strengthen the appeal of CNN integration in the pathology workflow.
With these opportunities for an expedited workflow in mind, we investigated the potential of applying DL-based decision support in the conduct of Tg-rasH2 mouse carcinogenicity studies. 7 These resource-heavy studies are completed near the end of the development cycle and are generally on the critical path timeline to registration. For these studies, approximately 10,000 tissues are collected and examined microscopically over a 6- to 10-week period, the diagnostic evaluation is often peer reviewed by a similarly trained pathologist, and the estimated person-hours for the anatomic pathology portion alone range from 400 to 600 hours.
Each study includes a positive control group that consists of Tg-rasH2 heterozygous mice treated with a known carcinogen, either N-nitroso-N-methylurea (NMU) or urethane. These carcinogens produce a consistent display of proliferative changes in the Tg-rasH2 mouse: thymic and multicentric lymphomas, stomach and skin squamous cell papilloma and carcinomas for NMU and lung hyperplasia, adenoma, and carcinoma for urethane. 8,9 The anatomic pathologist examines the tissues from this group to verify that the expected pattern of microscopic findings is observed in the Tg-rasH2 mouse.
We hypothesized that a digital pathology and DL-based support workflow could be developed to provide decision support for the toxicologic pathologist during the analysis and reporting phases of the positive control groups used in Tg-rasH2 studies. In our study, we designed CNN algorithms that detected proliferative lesions in select target organs of Tg-rasH2 mice treated with either NMU or urethane. Supervised training resulted in an algorithm that was tuned for sensitivity and produced a visual, binary output that alerted the pathologist as to whether the expected NMU or urethane proliferative changes in the target tissues were present. Qualification experiments comparing the performance of the CNN algorithm with 2 pathologists were highly correlative. These data suggested that this digital pathology and DL workflow could provide decision support and improved efficiency for the pathologist evaluating these types of toxicology studies.
Methods
Urethane (Ethyl Carbamate) and NMU
Urethane was purchased from Sigma-Aldrich and was stored at room temperature in the dark. N-nitroso-N-methylurea was purchased from Spectrum Chemical Manufacturing Corporation (lot no. 2HH0073) and stored at 5 °C. The dosing formulations were prepared on positive control dosing days and stored in a room at 18 °C to 24 °C, protected from light, until use. The NMU was formulated in citrate-buffered saline (pH 4.5) and urethane was formulated once in 0.9% sodium chloride for injection (USP). Positive control substance dosing formulations were prepared at appropriate concentrations to meet the dose-level requirement. All residual dosing formulations were retained and diluted 10-fold with 1 N NaOH; this solution was kept in a fume hood overnight and then discarded. Analysis of positive control substance formulations was not performed.
Animals
CByB6F1-Tg(HRAS)2Jic hemizygous [rasH2] mice were received from Taconic Biosciences, Inc, Rensselaer, New York. The knock-in Tg element (human prototype c-Ha-ras gene with its own promoter/enhancer) is injected into C57BL/6 BALB/c F2 zygotes, which are crossed back to C57BL/6J forming C57BL/6JJicTg(HRAS)2Jic. The CByB6F1-Tg(HRAS)2Jic (+ hemizygous c-Ha-ras) is the offspring from a cross of the C57BL/6JJic-Tg(HRAS)2Jic hemizygous male mice with the BALB/cByJJic female mice. The animals were acclimated for approximately 2 weeks before placing them on study. Animals were verified to be free of illness prior to use and were approximately 8 weeks old and weighed between 17.9 and 27.9 g at the initiation of dosing. Each mouse was genotyped by Taconic to verify the presence of the transgene before being placed on the study.
Animals were housed in solid-bottom cages containing appropriate bedding equipped with an automatic watering valve. On arrival, animals were group-housed (2-3 animals of the same sex) for 2 days. Thereafter, male animals were individually housed, and females in groups of 2 to 3 per cage. Each cage was labeled with a color-coded cage card indicating study number, group number, cage number, dosage level, animal number(s), and sex. Cages were arranged on racks in group order. Where possible, control group animals were housed on a separate rack from the test substance-treated animals. Animals were maintained in accordance with the Guide for the Care and Use of Laboratory Animals. 10 The American Association for Accreditation of Laboratory Animal Care International accredits the animal facilities at Charles River Ashland and Mattawan. The site institutional animal care and use committees approved all animal protocols.
The animal rooms had target temperatures of 68 °F to 78 °F (20 °C-26 °C) with a relative target humidity of 30% to 70% and a 12-hour light/12-hour dark cycle, except when interrupted for designated procedures. Ten or more air changes per hour with 100% fresh air (no air recirculation) were maintained in the animal room.
PMI Nutrition International, LLC Certified Rodent Lab Diet 5002 meal was provided ad libitum throughout the study. Animals were not fasted overnight prior to blood collection for clinical pathology evaluations and before necropsy. The feed was analyzed by the supplier for nutritional components and environmental contaminants. The results of the analysis were provided by the supplier and filed at the testing facility. There were no known contaminants in the feed that would interfere with the objectives of the study.
Municipal tap water after treatment by reverse osmosis and ultraviolet irradiation was freely available to each animal via an automatic watering system, including during inhalation exposure periods. Water bottles were provided if required. A periodic analysis of the water was performed, and the results were filed at the testing facility. There were no known contaminants in the water that could interfere with the outcome of the study.
Experimental Design
Slide preparation
The positive control was administered once to animals (15/sex) by intraperitoneal injection during the first week of the study for NMU (75 mg/kg: 10 mL/kg dose volume, 7.5 mg/mL dose concentration) or to animals (10/sex) 3 times on study day (SD) 1, 3, and 5 for urethane (1000 mg/kg, 500 mg/kg, and 500 mg/kg: 10 mL/kg dose volume). During the entirety of the in-life phase of the study, mice were evaluated for clinical observations, moribundity and mortality, body weight, and food consumption. Animals were euthanized at week 12 (urethane) or week 26 (NMU) unless euthanized early for humane reasons. At necropsy, protocol-required tissues were collected from all animals, fixed in 10% neutral-buffered formalin, and processed using standard histologic methods. Tissue sections (4-5 μm) were placed onto glass slides and stained with hematoxylin and eosin (H&E) and cover slipped. After drying, 170 slides were digitally scanned using a Leica AT2 scanner at a ×20 magnification. Whole slide images (WSIs) were inspected in eSlide Manager (Leica) for quality and rescanned if necessary. Whole slide images were uploaded to the Patholytix Study Browser (Deciphex Ltd) for AI model development. A subset of the studies was used for training and validating the CNN model results: 43 WSI slides for urethane study (lung only) and 127 slides were used from NMU study (lung, thymus, and stomach). The CNN models were developed for each organ independently.
For the urethane study, WSIs were reviewed by a pathology working group composed of board-certified veterinary pathologists for establishing diagnostic criteria for proliferative lung lesions (hyperplasia, adenoma, and carcinoma). While the training pathologist used INHAND criteria to establish the ground truth, a consensus working group was used to verify borderline lung hyperplasia and adenoma cases, which ensured a ground truth for the metadata that would be more consistent for model training purposes. 11 For the NMU study, INHAND criteria were also used for ground truth. 12,13 A single board-certified veterinary pathologist established the tissue classes and annotated all WSIs using the Patholytix Study Browser for both the urethane and NMU studies (Figure 1).
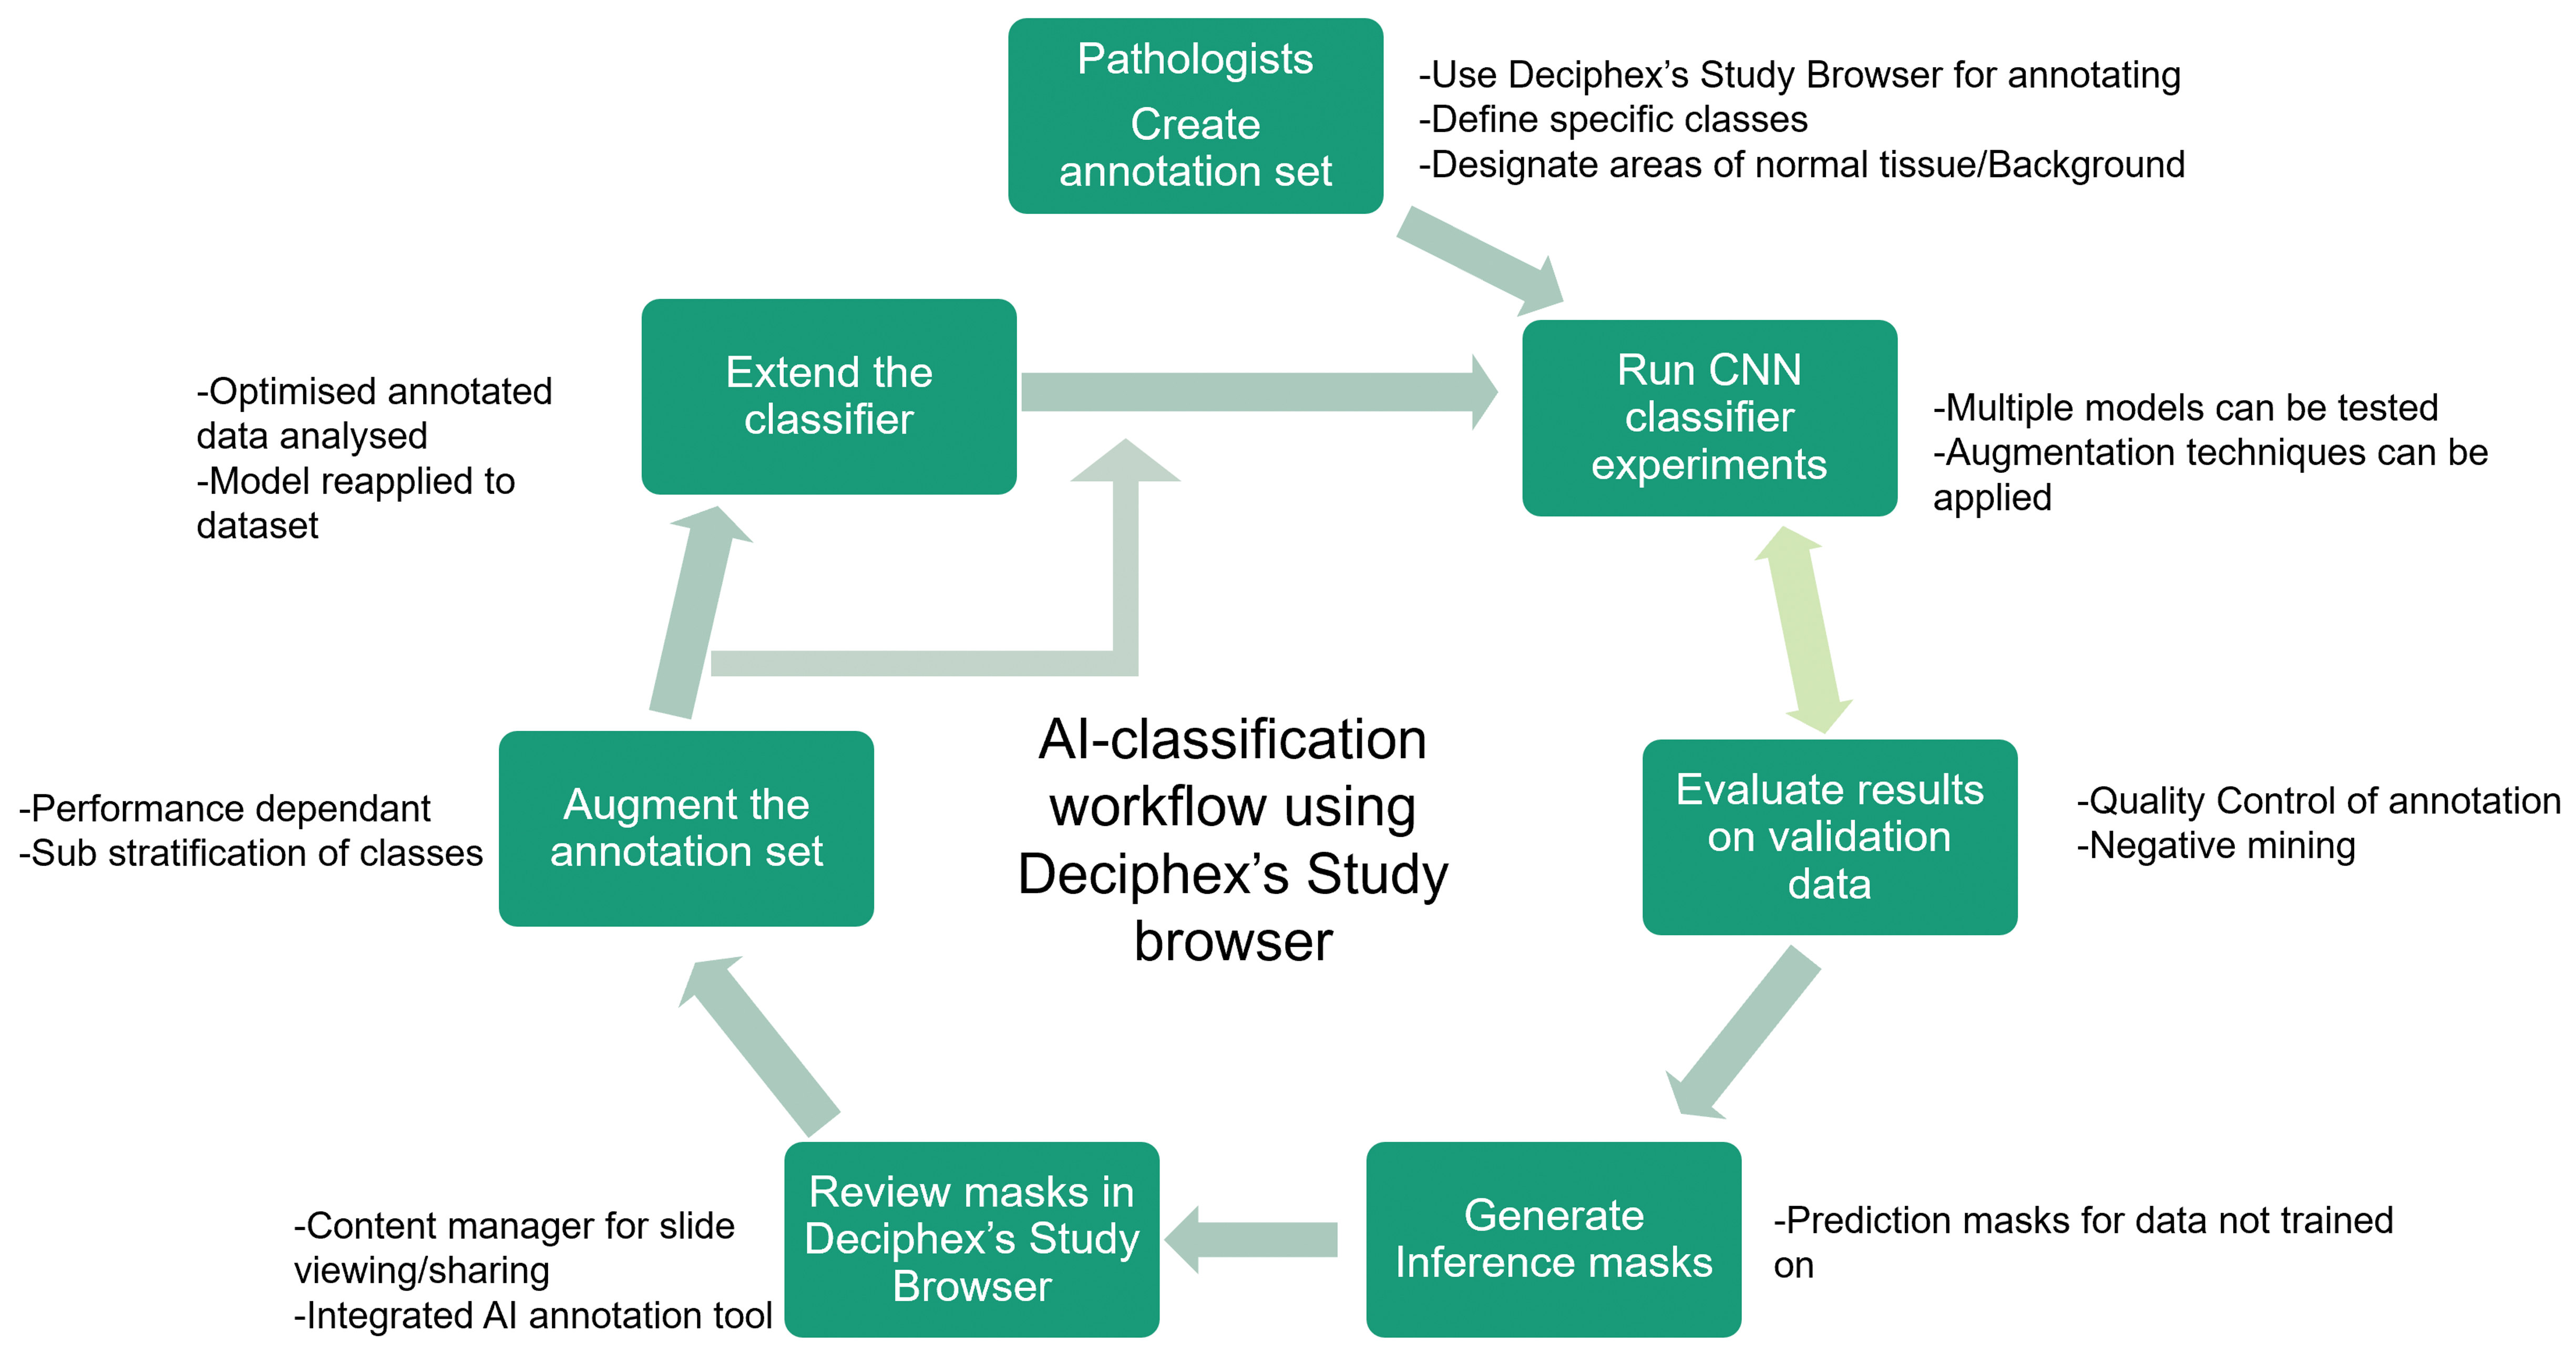
Digital Pathology workflow schematic illustrating process steps for the pathologist and application of AI models. First, the data need to be uploaded for annotations and classes of interest to be defined from both normal and lesion categories. Then the pixel-level annotations are created for each class, and a model is trained on the data. In the next step, the masks are generated on validation data and on the selected slides that are used for validation. The results are reviewed by the pathologists, and annotations are updated using approaches such as negative mining. The steps are repeated until the results are satisfactory to the user. The qualification of the CNN classifier is performed after the workflow is complete. AI indicates artificial intelligence; CNN, convolutional neural network.
Annotation of WSIs
In order to train supervised CNN classifiers to identify classes of interest (normal tissue, carcinoma, etc), examples of each class had to be annotated. When considering the selection of slides for training, the pathologist used annotations that would demonstrate the breadth of microscopic characteristics (as defined by INHAND and/or the pathology working group) and the variability that can be observed for each class. Other tissue characteristics were also included that the pathologist thought would advance the algorithms’ ability to differentiate between the different classes (artefacts due to sectioning, processing; normal histology that could confuse the CNN classifiers). Annotations using the Patholytix Study Browser took between a few seconds to a minute per annotation. In the experiments, pixel annotations were used at ×10 (1 mpp) and ×2.5 (4 mpp) magnification layers. One annotation set per tissue was created at ×10 magnification, and for the stomach tissue, an additional set of ×2.5 magnification annotations were added to provide greater context for capturing features of the papilloma class (Figure 2).
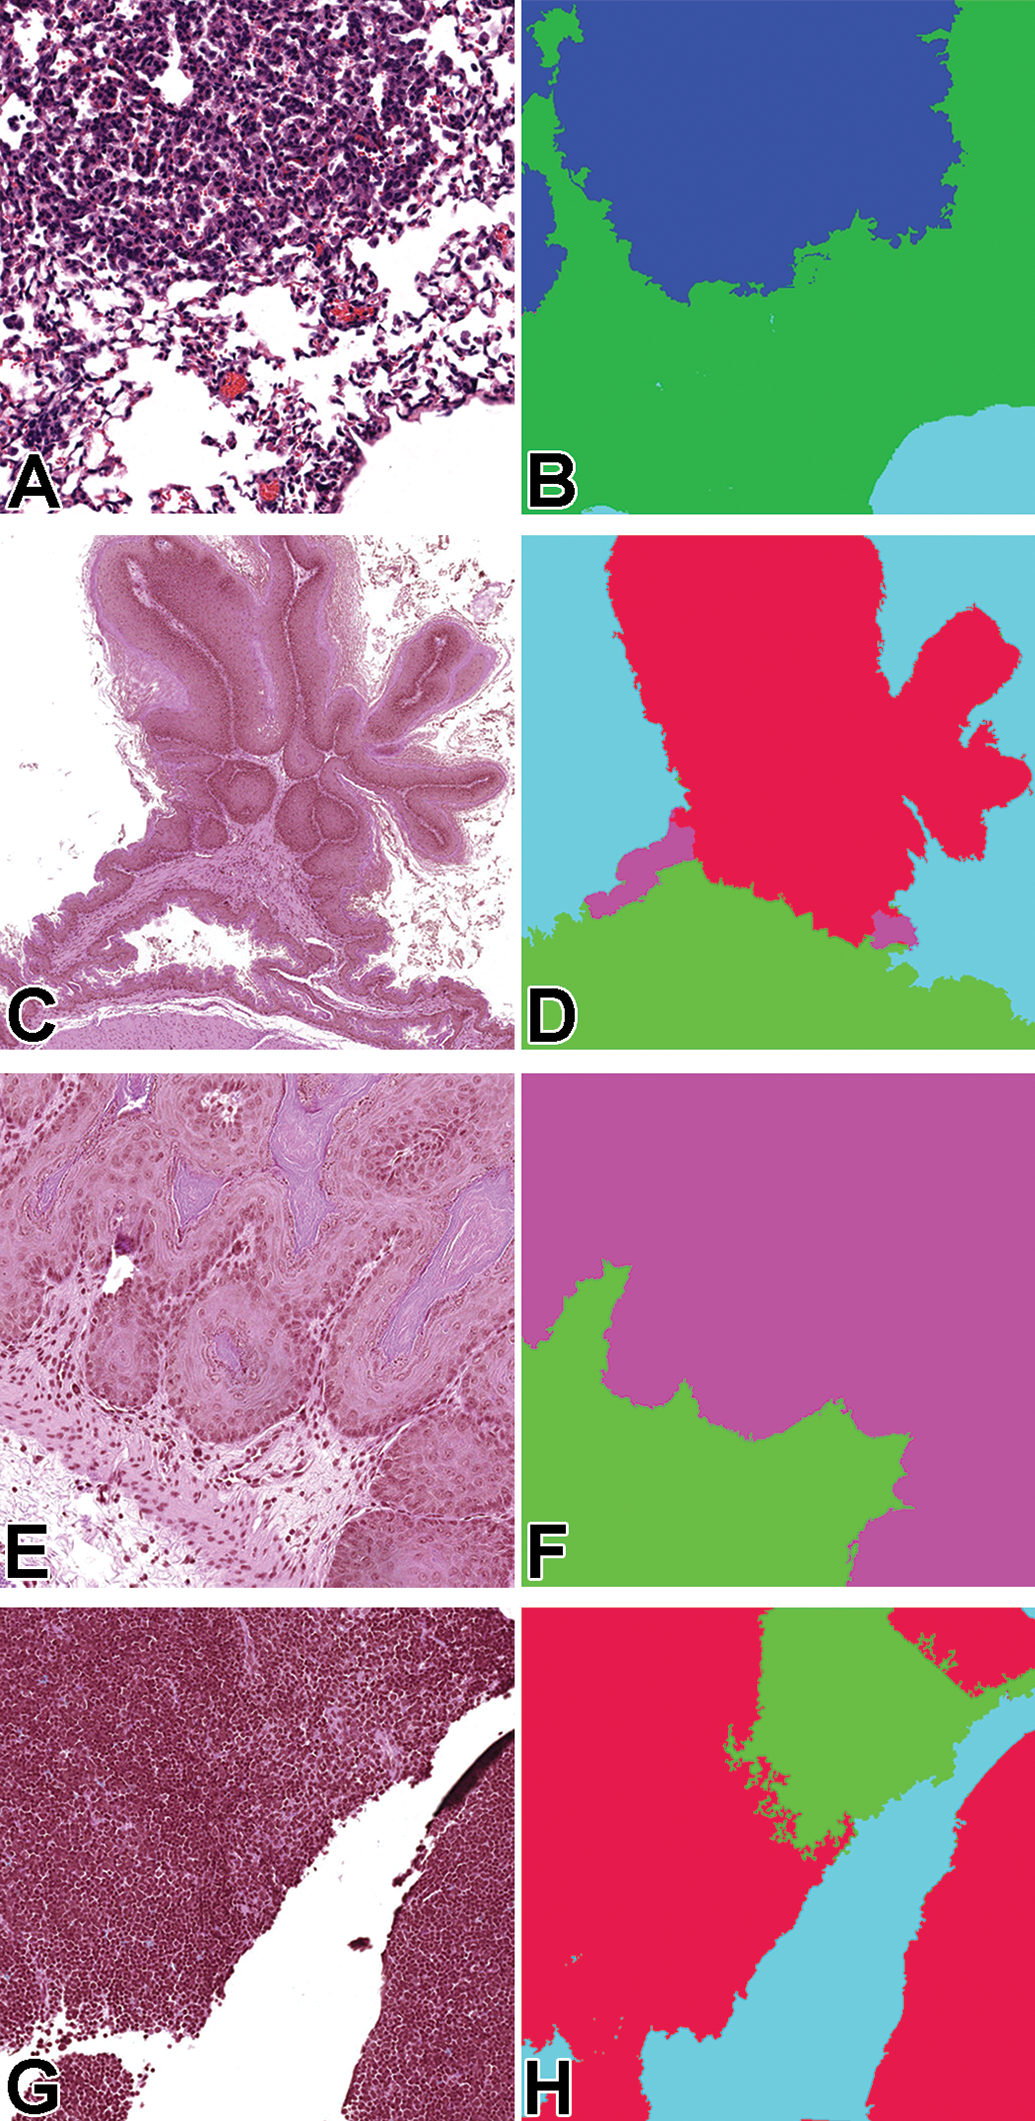
Lung (A, B): original magnification ×10 tissue (left) and mask (right tile images (0.5 mm × 0.5 mm area; 512 × 512 pixels; stomach (C, D): original magnification ×2.5 tissue (left) and mask (right) tile images (2 mm × 2 mm area; 512 × 512 pixels); stomach (E, F): ×10 tissue (left) and mask (right) tile images (0.5 mm × 0.5 mm area; 512 × 512 pixels); thymus (G, H): original magnification ×10 tissue (left) and mask (right) tile images (0.5 mm × 0.5 mm area; 512 × 512 pixels. The colors in the mask correspond to the different lesion classes: green = normal tissue; blue/purple = hyperplasia; red (stomach) = papilloma/squamous cell carcinoma; red (thymus) = lymphoma
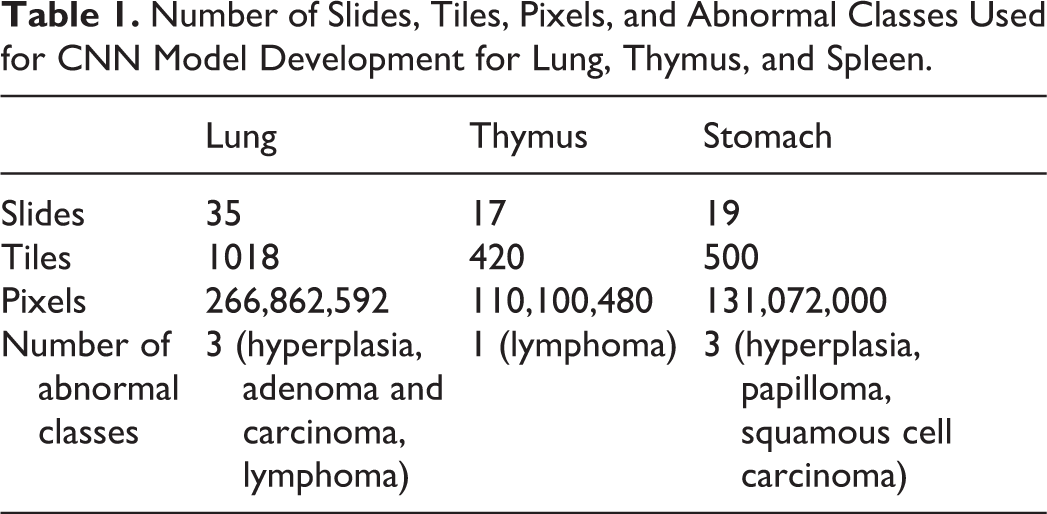
For the lung, the classes “carcinoma” and “adenoma” were combined because there were not enough examples of carcinoma (n = 2) to adequately train the classifier. The same was done at ×2.5 in the stomach for papilloma and squamous cell carcinoma, the latter only having a single example. This did not interfere with the intended use of the algorithm (identify proliferative changes) while providing more tiles for the combined class. The lesion classes, number of slides, number of tiles annotated in all slides combined, and number of pixels annotated for each training data set are listed in Table 1. A tile is a 512 × 512 pixel region at the specified magnification layer. At ×10 magnification, this would represent a 0.5 mm × 0.5 mm area of tissue, while at ×2.5, it would represent a 2 mm × 2 mm area.
Number of Slides, Tiles, Pixels, and Abnormal Classes Used for CNN Model Development for Lung, Thymus, and Spleen.
The WSI annotations were completed using a 2K computer monitor (Asus) and standard mouse within the Patholytix Study Browser, which allows the user to delineate specific features of tissue and label them as distinct classes down to pixel-level designation. The number of annotations per section varied based on the objective of balancing normal and abnormal tissue data for the training set. Two annotation approaches were used: a tile-based annotation where all pixels within a tile were labeled or partial-field annotations where only selected pixels were labeled (Figure 3). For each method, pixels of a given image were labeled (ie, segmentation) with a corresponding class (ie, normal tissue, hyperplasia, adenoma, etc) that was identified by the training pathologist. The output of segmentation was a high-resolution image the same size as the input image in which each pixel was designated as a particular class.
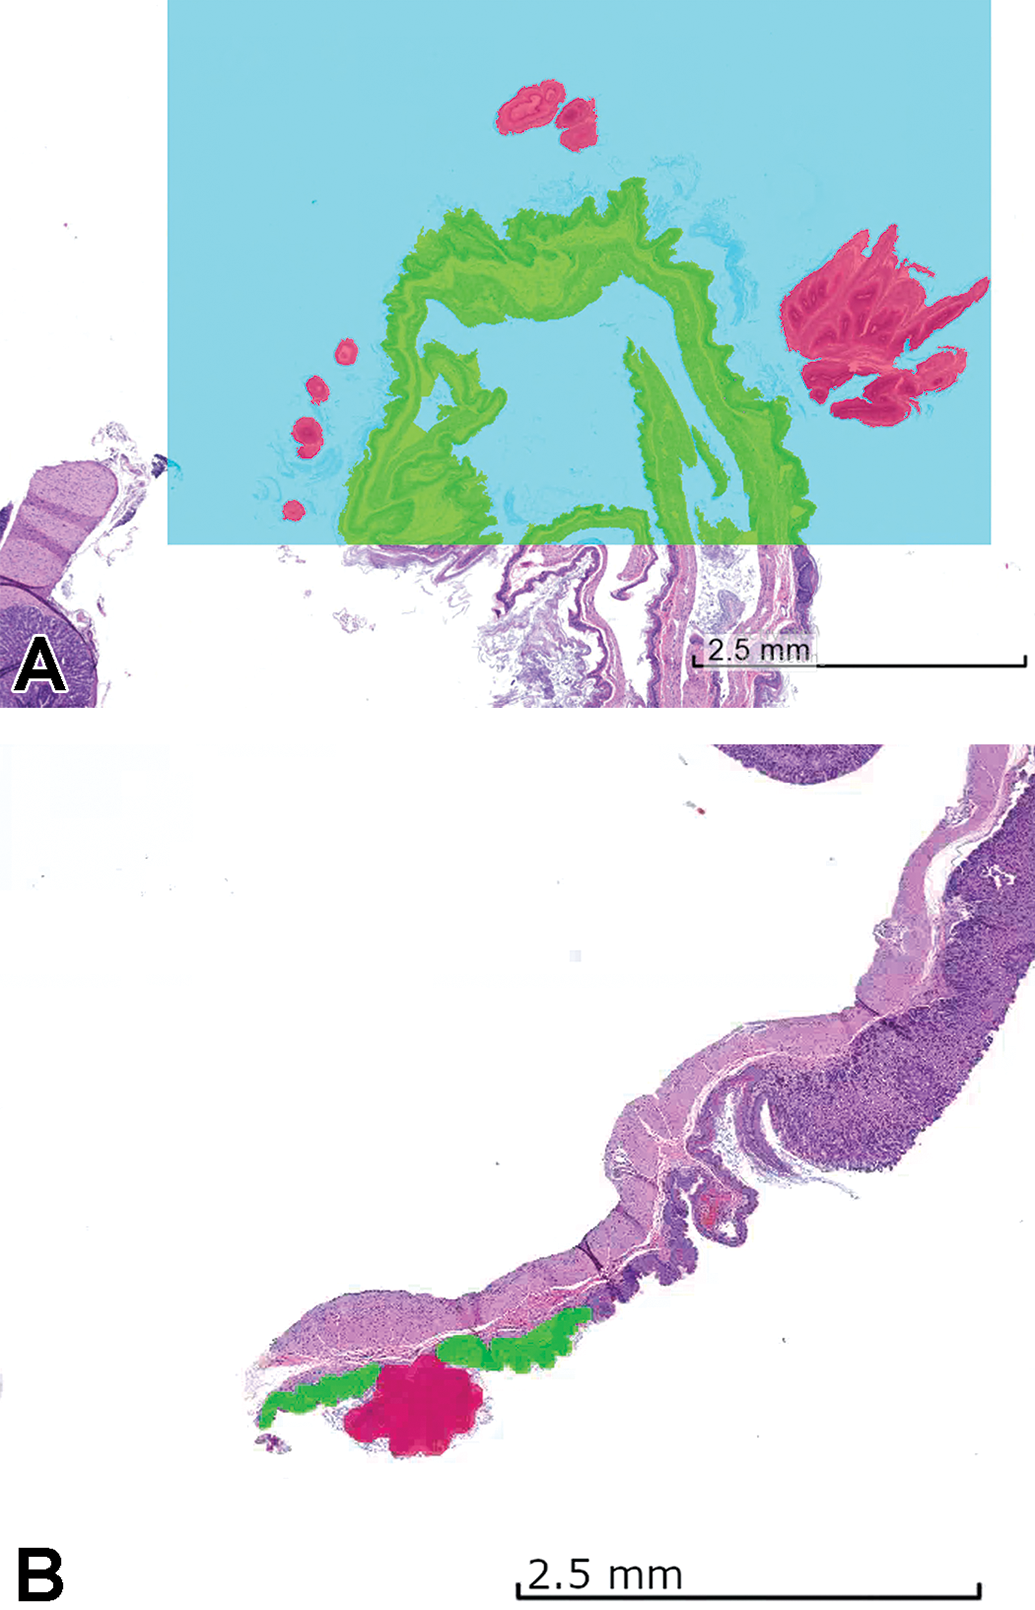
Examples of tile-based (A) and partial-field (B) annotations. The partial-field annotation is preferred where there are regions with ambiguous class membership present to allow to annotate only the regions that are uncertain. Green = normal tissue, blue = background, red = papilloma.
Model development
There were several publicly available CNN segmentation models for use through the Patholytix AI system (Deciphex Ltd). These were Base8, 14 FCN8, FCN16, 15 Inception, 16 InceptionV3, 17 ResNet50, 18 Xception, 19 DeepLabV3Plus, 20 SegNet, 21 and EfficientNet. 22 In preliminary work, it was determined that Inception, ResNet50, and EfficientNet performed better than the other models across the data sets (data not shown). These 3 models were used for all CNN model experiments. The CNN models used in these experiments were based on the U-Net architecture. 23 The Inception module evaluates the image using multiple smaller convolutional filters with different receptive fields. This allows for improved capturing of local variability, while drastically reducing the computational requirements of the network. ResNet is a family of CNN models introducing shortcut connections between convolutional blocks that allow deeper networks to be trained while maintaining less complexity than shallower models. In our experiments, we used ResNet-50 that consists of 50 layers of convolutional blocks. The EfficientNet family of models more efficiently scales the width, depth, and number of convolutional filters in a baseline CNN model, resulting in higher performance and faster inference times. In our experiments, we used EfficientNet-b0, which is the smallest of all the networks.
For all experiments, the encoder networks were initialized with pretrained ImageNet 24 weights, whereas the decoders were initialized randomly using methods described previously. 25 Focal loss 26 was used as the training loss function. For partially annotated tiles, the unlabeled pixels were ignored and the Adam optimizer was applied with a learning rate of 0.001, a β1 of .9 and a β2 of .999. All models were trained for 50 epochs. For training the models, the annotated tiles were split into 3 sets: training (70%), test (15%), and validation (15%). The CNN models directly used the training annotations to update its weights (ie, parameters used within the layers of the model to segment the WSI tiles). The test set was incorporated into the training stage with the purpose of determining when the model stopped learning (ie, when additional training provided insignificant improvements in performance on the test set). The validation set was a separate data set not used during the training phase on which the final model performance was evaluated.
To improve model training, data augmentation was performed on the training set. 27,28 Augmentation increases the diversity of images in the data set by applying spatial and color transformations to the images before the model uses them. In the experiments, 3 types of augmentation techniques were tested for their ability to improve learning 29 —“Geometric”: Images are horizontally and/or vertically flipped; “Color”: Temperature of the images are changed; and “Elastic deformation”: Images are stretched/compressed randomly. Color and geometric augmentation was also applied to randomly selected tiles at a data-preprocessing step before each epoch. Elastic deformation is applied to the replicated tiles with randomly chosen magnitudes to allow the model to generalize better on the data that are not used for training. During the iterative process, masks were generated on full WSIs that were annotated, and after reviewing each round of masks, false negatives and false positives were evaluated by the training pathologist to guide the creation of new annotations or the editing of previous ones (negative and positive mining). 30 By doing so, the pathologist refined the training of the model using an iterative process that targets to correct or add more annotations where there was confusion between different classes.
Analysis of classifier results
The performance of the models was measured with 3 metrics: precision, sensitivity (recall), and F1 score. 31 The F1 score was chosen as the primary metric as it is commonly used for evaluating image segmentation models, especially within the medical domain. The F1 score is equivalent to the dice coefficient and is often referred to as this in the literature. 32 It measures the intersection of the ground truth and prediction relative to the total of the 2. It can also be constructed as the harmonic mean between precision and sensitivity, giving a single metric for which model performance can be evaluated. As F1 score does not include true negatives in its calculation, it is not biased by the large overrepresentation of normal tissue in these types of data sets.
The metrics were calculated at a pixel level for each lesion class in the annotation set (see Table 1 for a list of classes). Evaluation was also performed on a combined lesion versus tissue class (binary decision; ie, is a lesion class present or not). The binary class allows one to assess the models’ performance for the intended use of decision support (abnormality detection task) and ignores confusion between lesion classes. The pixels annotated as background (white slide area around the tissue) were excluded, as segmentation between background and tissue was very good in general (always above 95%), and this focuses the results on the task of detecting lesions within an organ tissue. Based on visual review and feedback from pathologists, an F1 score threshold of 0.7 was considered acceptable for performance of any classifier for the intended use, though classifiers with lower F1 scores often still highlighted the abnormal tissue areas and may have utility for the pathologist for decision support (Figure 4).
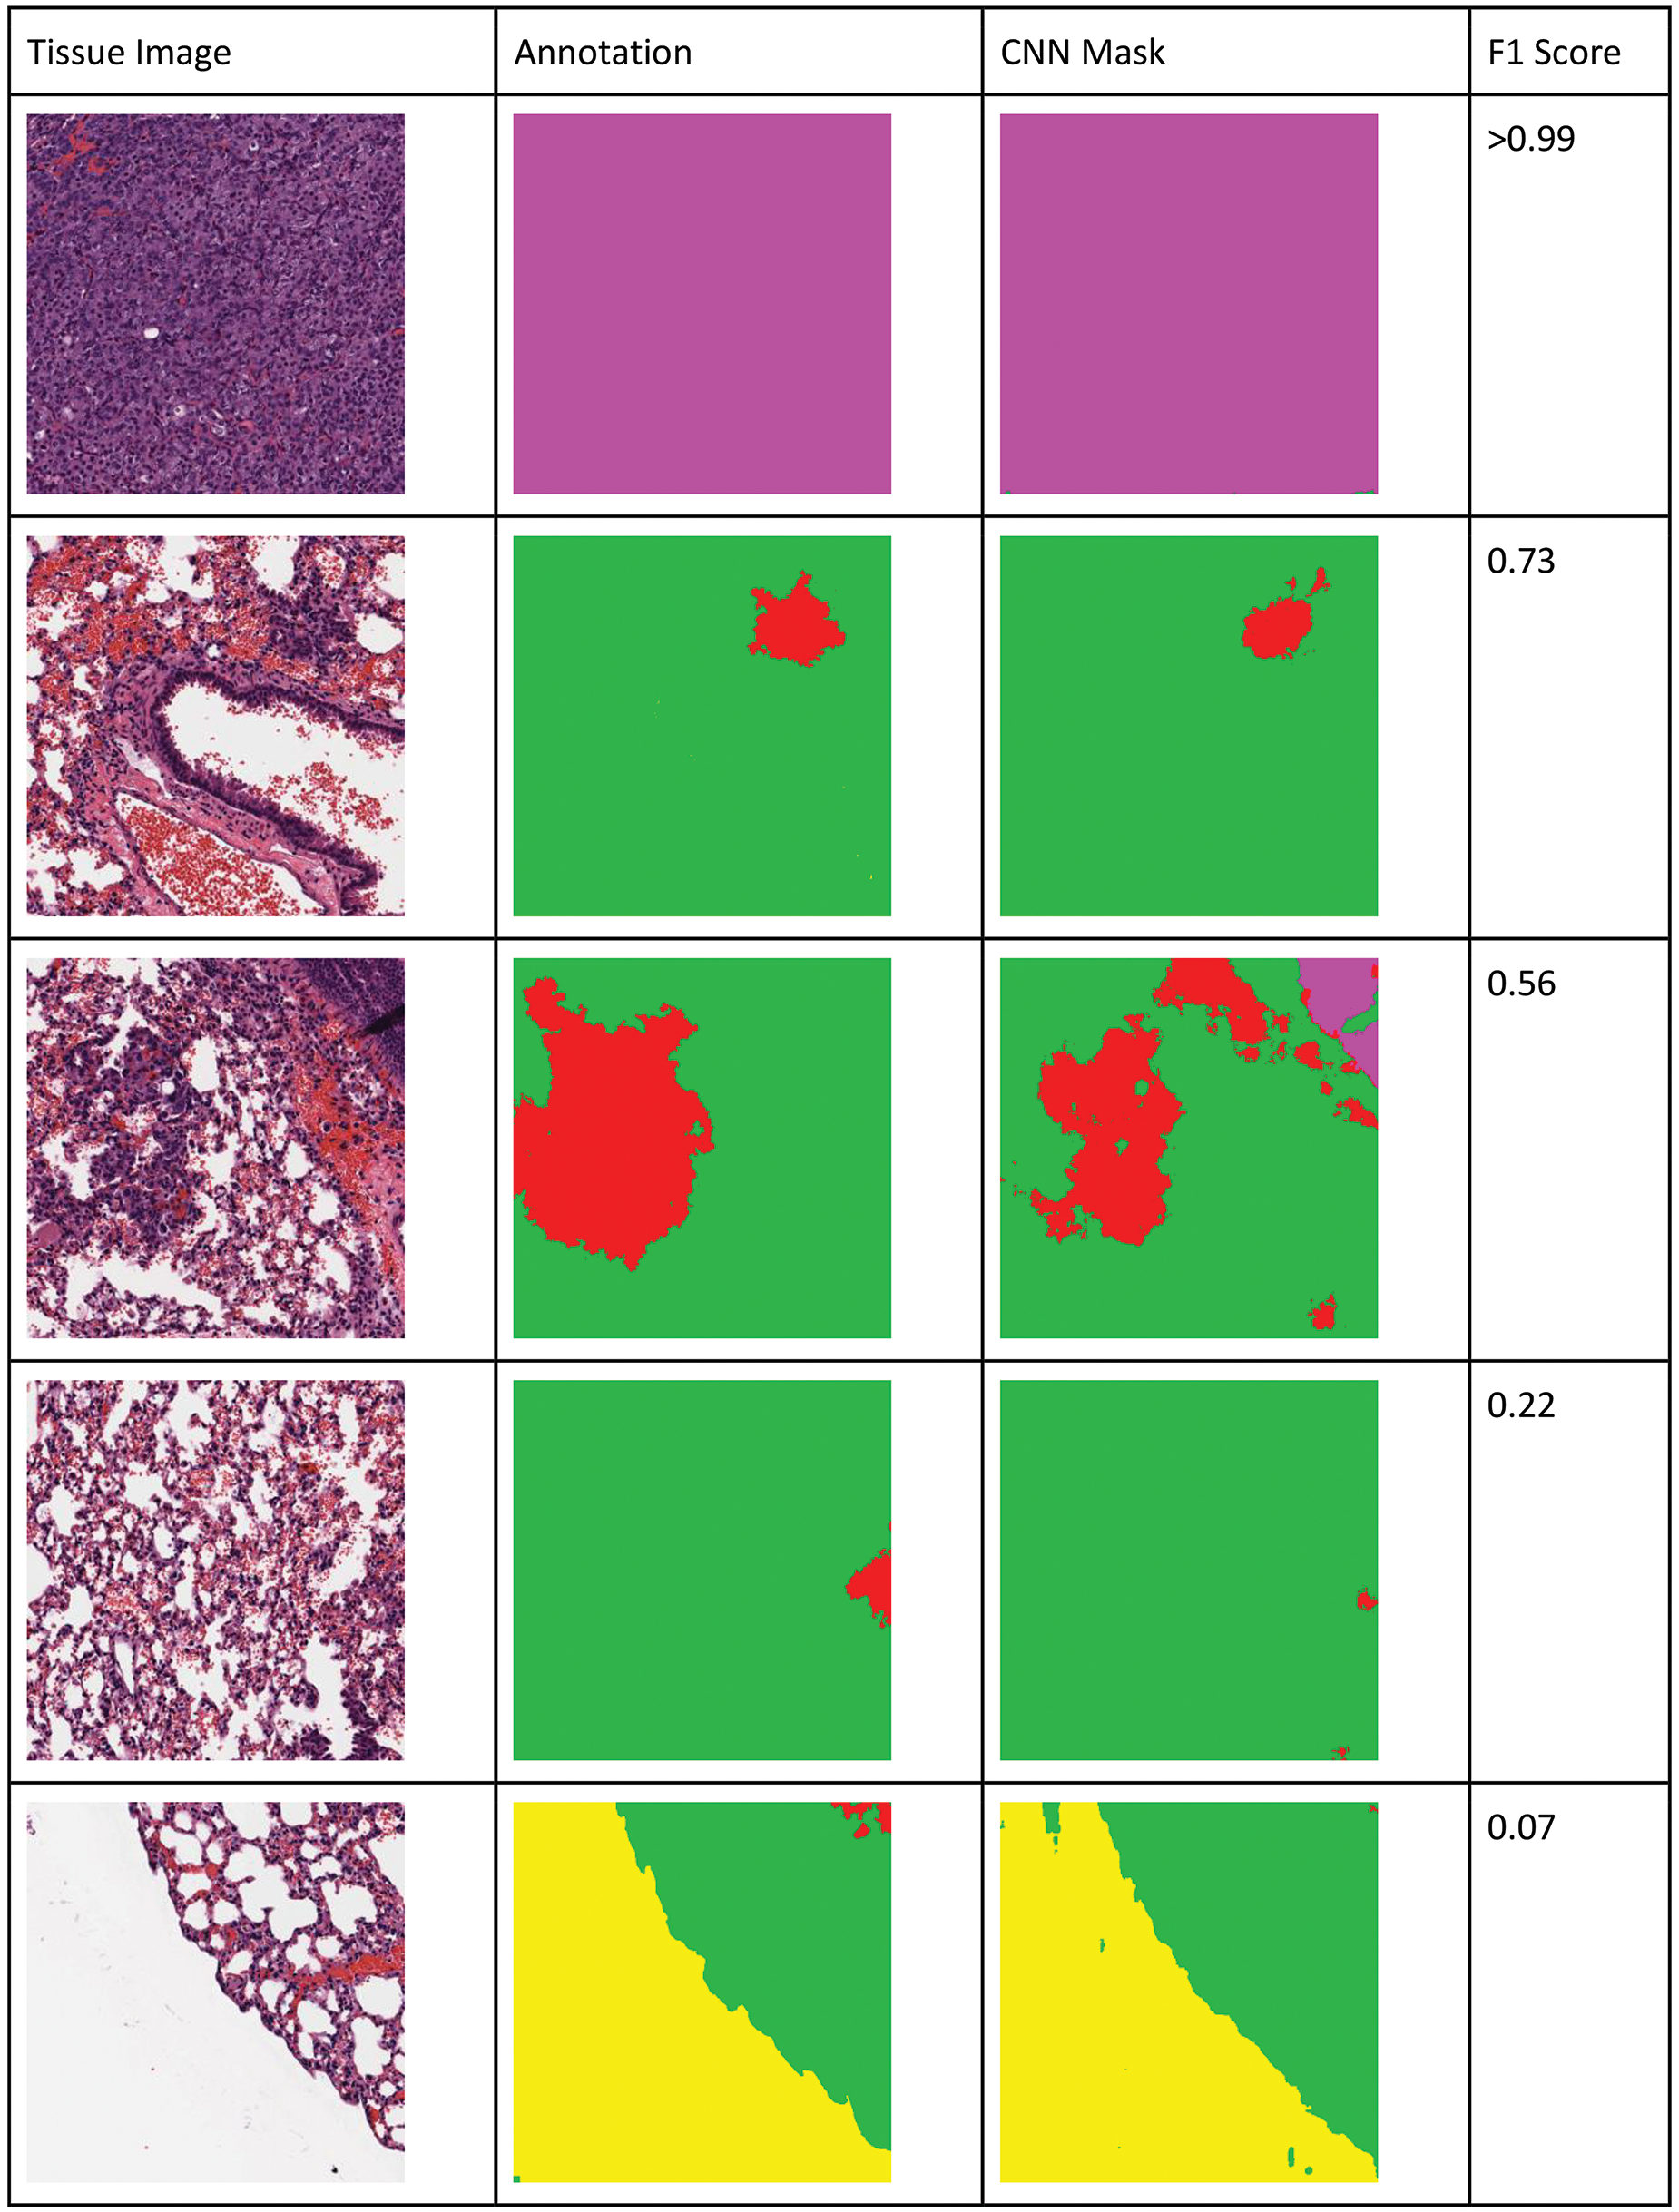
Visualization of binary pixel-level F1 scores for lung tissue. An F1 score of 0.7 and above is considered acceptable. Low F1 score represents less overlap or also be caused by the normal annotated tissue being highlighted as lesion as can be seen in the last example. Colors in the mask (right column) and annotation images (center column) correspond to different classes in the native images (left column): yellow = background, green = normal tissue, red = hyperplasia, magenta = adenoma/carcinoma. F scores for A = >0.99, B = 0.70, C = 0.56, D = 0.22, and E = 0.07.
Qualification of the classifier
In addition to the pixel-level evaluation of the classifier results, in qualification testing for the decision support intended use, the best classifier results were compared to the evaluation of the presence of the lesion classes at the slide level by 2 pathologists. These pathologists (pathologists 1 and 2) were not involved in training the CNN classifier and were blinded to both the animal-treatment group and the CNN classifier results. Pathologists 1 and 2 evaluated 30 lung (8 normal; 22 abnormal), 11 stomach (1 normal; 10 abnormal), and 15 thymus (9 normal; 6 abnormal) WSI (Supplemental table 1). The set of slides were scanned using an identical scanner (Leica AT2) and at the same magnification (×20). The pathologists were asked to determine whether 1 or more of the required lesion classes (Table 1) were present in the WSI using their standard computer workstations and eSlide Manager (Leica), a WSI visualization program. The pathologists’ assessment was compared to the output of the CNN classifier on that slide. If both the CNN classifier and pathologist identified one of the required classes, then it was treated as a match. If 1 or more of the proliferative classes were detected only by a pathologist, it was treated as a miss. Portions of sagittal sections of airways occasionally identified as “hyperplasia” by the CNN output were not considered “false positives” because of their clear identification by the pathologist as technical artifacts. When there was disagreement between the pathologists, the original study pathologist’s diagnosis was used to break the “tie” for comparison with the CNN output.
Results
Quantitative Evaluation of the Model Classification Results
Comparison of the models was performed on combined lesion (binary) classification versus tissue as well as on each lesion class individually. The binary results show the classifiers’ ability to satisfy the intended use of this algorithm, namely the identification of specific proliferative lesion classes without specification of a particular lesion class. Individual lesion detection results provide us with information about more challenging classes and whether there is a cross-lesion detection in the binary results.
We employed a variety of standard metrics to evaluate and compare the results from different classifiers. Table 2 shows the F1 scores for the best-performing example of each model for the lung lesion classification task. The analysis of the lung using the various models indicated that EfficientNet outperformed all other models in correctly identifying each individual lesion class. Overall, for the binary determination of lesion tissue, it achieved an F1 score of 0.93. EfficientNet performed the best for all classes, except for hyperplasia, which was 0.004 lower than the F1 score of the ResNet50 model. For the stomach, when trained using annotations created at ×10 magnification (Table 3), individual lesions F1 scores were below the 0.7 threshold, but the binary output was very good (F1 > 0.9). By switching to a ×2.5 magnification for training and combining papilloma and squamous cell carcinoma classes (Table 4), F1 scores for hyperplasia and the combined class between papilloma and squamous cell carcinoma were >0.7. The binary determination F1 score was comparable to what was observed at ×10. The thymus data set had only a single lesion class “lymphoma,” which was identified with an F1 score of 0.9 (Table 5).
F1 Scores for Lung Lesion Classification Using Inception, ResNet50, and EfficientNet on Lesion and Tissue (Binary), Adenoma/Carcinoma, Lymphoma, and Hyperplasia.a
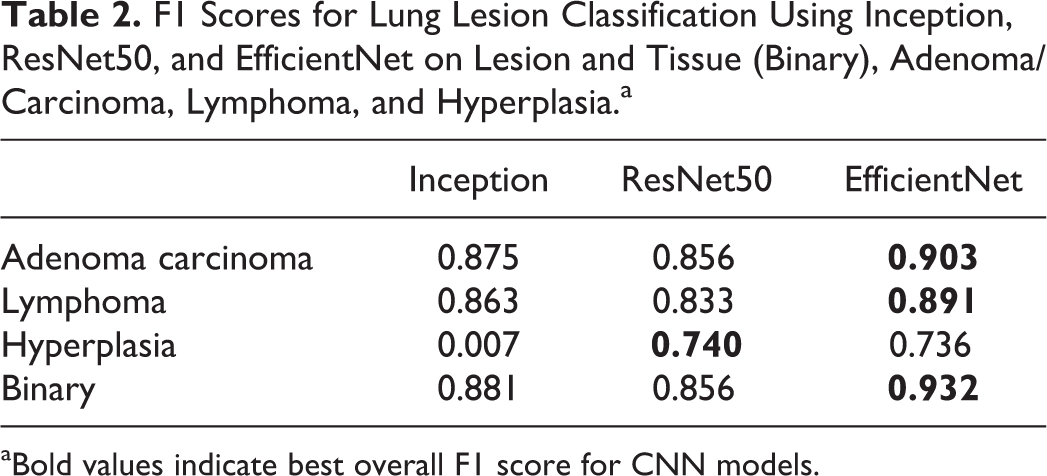
aBold values indicate best overall F1 score for CNN models.
F1 Scores for Stomach (Original Magnification ×10) Classification Using Inception, ResNet50, and EfficientNet on Lesion and Tissue (Binary), Lymphoma, Hyperplasia, Papilloma, and Squamous Cell Carcinoma.a
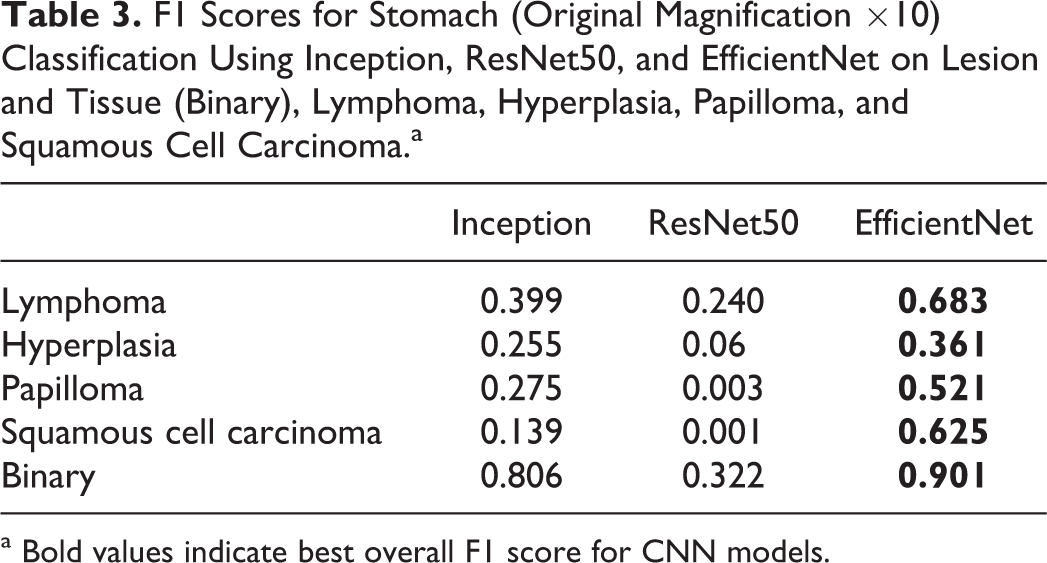
a Bold values indicate best overall F1 score for CNN models.
F1 Scores for Stomach (Original Magnification ×2.5) Classification Using Inception, ResNet50, and EfficientNet on Lesion and Tissue (Binary), Hyperplasia, Papilloma, and Squamous Cell Carcinoma.a
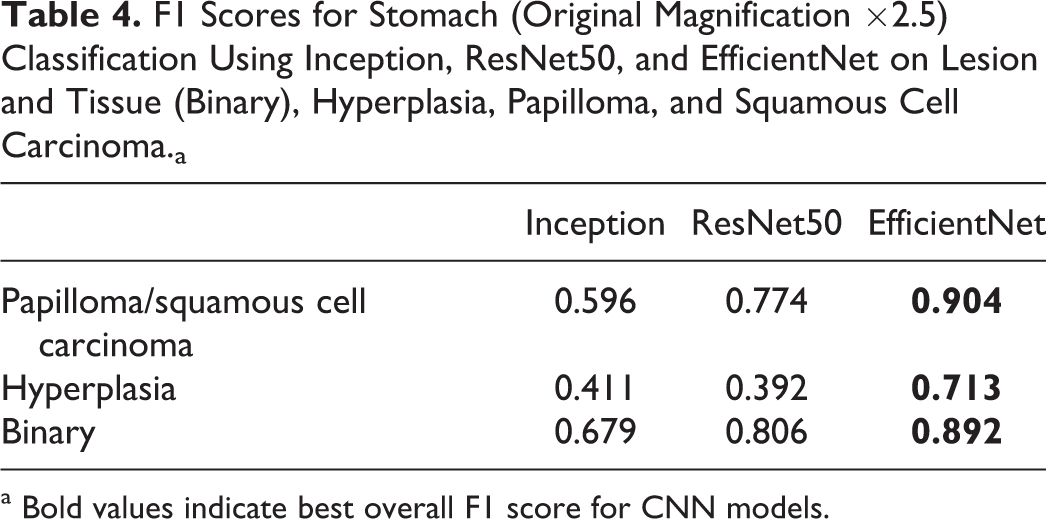
a Bold values indicate best overall F1 score for CNN models.
F1 Scores for Thymus Using Inception, ResNet50, and EfficientNet on Lesion and Tissue (Binary), and Lymphoma Alone.a
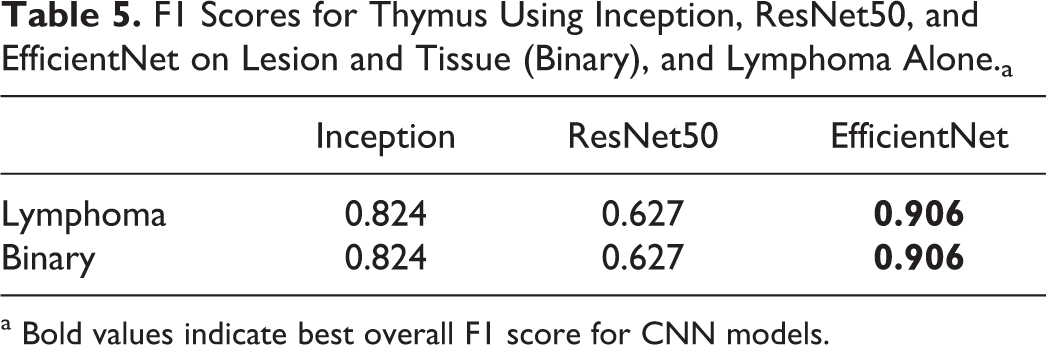
a Bold values indicate best overall F1 score for CNN models.
Qualification and Concordance Testing: Lung, Thymus, Stomach
Two pathologists (A.S. and B.D.) evaluated lung, thymus, and stomach sections from the same studies but not those used for algorithm training or testing (Supplementary table 1). Overall, based on the qualification criteria defined for this study, there was 100% concordance between the predicted model and the pathologists as to the binary question at hand, the presence or not of 1 or more of the proliferative classes. However, there were some discrepancies between pathologists 1 and 2. For lung slide number 5514, pathologist 1 reported “no” and pathologist 2 reported “focal hyperplasia or atelectasis.” Neither the study pathologist nor the CNN model identified hyperplasia (atelectasis not recorded by the study pathologist and was not a lesion class for the CNN model). Therefore, result for slide 5514 between the pathologists and the CNN model was considered a match. For thymus slides 5006 and 5013, pathologist 1 reported “no” and pathologist 2 reported “yes, increased cellularity.” Increased cellularity was not one of the CNN-trained classes and the CNN model predicted “no”; therefore, concordance was confirmed. Finally, for thymus slides 5510 and 5512, pathologist 1 reported “yes” (lymphoma) and pathologist 2 reported “no.” For these cases, the original diagnosis of the study pathologist was “multicentric lymphoma” and the CNN model predicted “lymphoma”; therefore, concordance was confirmed (Figure 5). Both cases were difficult, as there was concurrent lymphoid necrosis and depletion (identified by pathologist 2) mixed with a lymphoblastic cell population (lymphoma). This demonstrates the potential value of DL-based “decision support” in a toxicologic pathologist’s workflow. For these 2 animals, there was a discordant outcome (one pathologist agreeing with the computer and one not), which would likely stimulate review by a larger group of peers or possibly additional diagnostics such as immunohistochemistry.
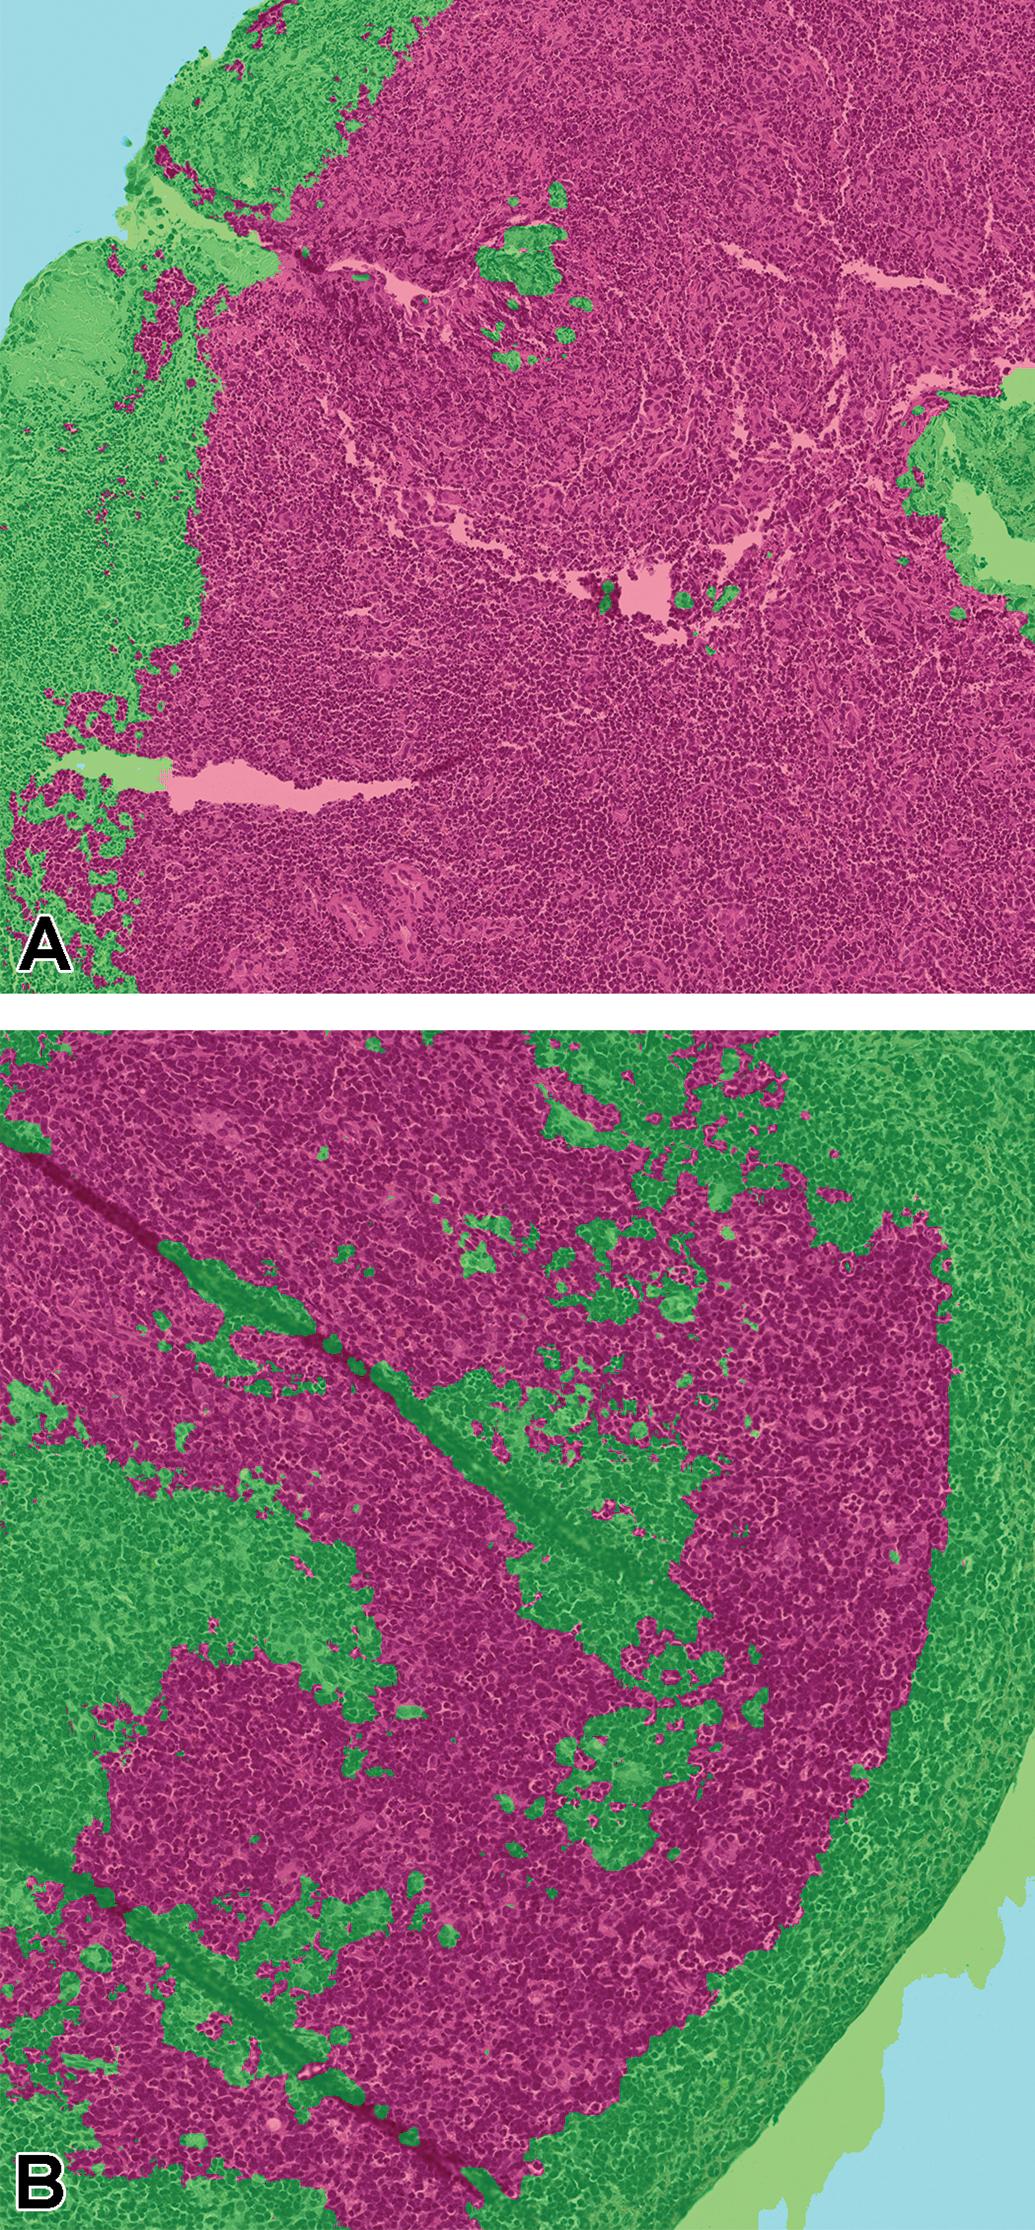
Thymus from animals #5510 (A) and #5512 (B) identified as proliferative class positive (red = lymphoma) by the convolutional neural network model but with discordant opinions by pathologist 1 (lymphoma) and pathologist 2 (no lymphoma). The original study pathologist diagnosed multicentric lymphoma.
Discussion
Herein, we describe the development of a digital pathology and AI DL-driven workflow using CNN-based algorithms with the goal of providing a decision support tool to the toxicologic pathologist for evaluating the positive control groups used in Tg-rasH2 carcinogenicity studies. The combination of an enhanced digital pathology workflow and tissue masks generated from the EfficientNet model resulted in a highly visual augmentation of the data that the pathologist could use in support of their microscopic assessment. The optimized CNN model when evaluated on a pixel-level basis met the thresholds defined (F1 scores above 0.7) by the pathologist who trained the CNN model and the binary CNN output on a test set of WSI was highly concordant with 2 independent pathologists. These types of decision support tools using CNN-based algorithms and a well-designed digital pathology workflow have the potential to drive efficiency for the bench toxicologic pathologist as part of nGLP and GLP safety assessment studies.
In CNN model development, the number of annotations and tissue sections necessary for effective supervised training varies based on several factors, including the proportion of normal tissue versus the abnormality of interest (ie, distribution of classes). Differences in class proportions can be problematic for effective CNN model. 33 In this work, a comparably small number of annotations (313-1018 tiles per organ) and tissue sections (17-35 per organ) were used, and the proportion of lesion pixels in each annotation set varied from 3.5% (stomach lesions at ×2.5 magnification) to 25% (thymus lymphoma at ×10 magnification). To adjust for this imbalance of the training data set, a class-balancing approach was used. 33 In class balancing, tiles with less represented classes are replicated to even out the distribution. In the experiments described, class balancing resulted in up to 10-fold increases in data set size for the less frequent classes.
The extent of morphologic differences between the different tissues and other preanalytical or analytical variability for the tissue in the animal model used also has an impact on the quality of classification results. 34 These variables were controlled by using equivalent trimming, processing, and H&E staining procedures for all studies as well as the same scanner for producing the WSIs. In these initial experiments, we did not test the generalizability of the CNN classifiers in different laboratories. If performance is not consistent, the supervised training set can be expanded to achieve class balance and heterogeneity using content from additional studies. Even if performance across laboratories is very good initially, it is a good practice to schedule regular retraining of CNN models that would allow addition of the new data from different sources, once those data become available to the organization. After enough retraining, a decision can be made to qualify and release a new version of the CNN algorithm.
Tissue artifacts were a challenge for these studies. Several animals died prior to scheduled euthanasia and had autolysis in target tissues. Tangential sections of the stomach mucosa and large lung airways had a similar appearance to hyperplastic changes in the same tissues. These types of artifacts commonly occur in toxicology studies. Excluding them from the CNN training data would detriment the algorithm’s performance within the context of a carcinogenicity study where unscheduled deaths and sectioning artifacts are frequent. Therefore, a breadth of training material and annotations were used for these tangential section artifacts as well as from well-preserved and autolytic samples. The so-called negative mining, where the pathologist used additional annotations to correct predictive false positives, was especially effective for the tangential section artifact issue (ie, tangential areas marked as hyperplasia by the computer are annotated as “normal” by the pathologist). Because the proliferative changes were strikingly dissimilar to the control, whether autolytic or not, merely providing enough autolytic and nonautolytic annotations was sufficient in the supervised training for this model. However, it is important to point out that if the intended use of the algorithm required the CNN algorithm to differentiate between less obvious morphologic differences in the lesions, the preanalytic artifact associated with autolysis as well as other artifacts could be a formidable challenge to AI development. 34
Early in CNN model development, the computer underperformed in distinguishing lung hyperplasia and adenoma and stomach hyperplasia and papilloma classes. For the lung model, larger areas of bronchioalveolar hyperplasia and smaller adenomas proved challenging because of the continuum present for hyperplasia and adenoma in the lung and was the reason a broader working group was incorporated to develop a more generalizable ground truth. 11 By using negative mining and additional annotations that better defined the threshold between these classes, the pathologist effectively improved the F1 scores (Table 2).
Poor lesion context at ×10 was the root cause for the low F1 scores of CNN model for stomach hyperplasia and papilloma classes. At the ×10 magnification, most of the context of the papilloma (eg, overall shape and white space around the papilloma) was lost and the model could not distinguish it from hyperplasia. By changing the training magnification to ×2.5, the pathologist could generate supervised training tiles that included the distinct shape of the papilloma in its entirety and F1 scores improved. For both the lung and the stomach, merging lesion classes into a single class was necessary because the number of examples of the malignant class (carcinoma) were low (1 or 2) in the training set. Doing this further improved the CNN model ability to detect both classes. F1 scores increased 0.57 to 0.90, which translated into a 90% correct classification of the combined lesion pixels (Tables 3 and 4).
For the thymus and lung lymphoma class, it was anticipated that differentiating malignant and normal lymphocytes could be problematic during CNN model development. In our experience, a good rule of thumb is that if it is difficult for a trained pathologist to classify, then it will also be for a CNN and will require more annotations and samples in a training set. The pathologists used partial-field annotations to differentiate normal and neoplastic lymphocyte population, providing a richer training set for the computer. Lymphomas in NMU-treated mice are lymphoblastic and morphologically unique compared to normal thymic lymphocytes and lung bronchus-associated lymphoid tissue, which also helped in training. Although thymus F1 scores were high and the CNN model output aligned with the study pathologist’s diagnosis (Table 5 and Supplemental table 1), there was disagreement between pathologists 1 and 2 for 2 of the thymus lymphoma cases. In both the cases, the CNN model identified these cases as “lymphoma,” which would have provided decision support for a consensus activity between these 2 pathologists.
The goal of “proliferative lesion detection” was modest for the study. A more challenging decision support paradigm for a toxicologic pathologist could have included additional CNN model end points such as “recommended diagnosis” or “severity or frequency (number)” rather than only the binary output of this algorithm (specific proliferative lesion class is present or not). The pixel-level F1 scores (>0.7) for the lung, stomach, and thymus proliferative classes indicated that the CNN models would likely be useful for pathologist decision support with regard to a specific diagnosis (Tables 3, 5, and 6). This needs to be evaluated by extending the concordance testing to compare the “diagnosis” of each tissue proliferative change by the pathologist with the CNN model. Another further possible refinement is the inclusion of a CNN model object counter that enumerates the number of each proliferative class for the pathologist. This more comprehensive model then would first indicate a “positive” or “negative” animal, provide diagnostic recommendations for each target tissue, and finally, present to the pathologist a “count” for the individual lesions within the target tissues.
Digital pathology and CNN-based decision support will only bring value to bench toxicologic pathology if it improves the workflow for the toxicologic pathologists. Based on the performance of the CNN algorithm for this study, there is clear potential for improved workflow efficiency. Using internal CRL metrics (unpublished data), the light microscopic workflow beginning at slide removal from the slide box to light microscopic assessment, data recording, and refiling the slide is approximately 90 seconds/tissue for a rodent evaluation. In a single-slide assessment of the 3 key target organs (stomach, lung, and thymus) from 30 TgRas-H2 animals (15/sex), 90 slides would need to be reviewed on the light microscope. In an end-to-end manual workflow, the total time for a pathologist to complete this activity based on CRL metrics is approximately 135 minutes. Using this digital pathology workflow and the CNN model, the masks were produced automatically after scanning and WSI upload for the pathologist whereby the pathologist could toggle between the standard digital view of the tissue section and an overlay of the masks on the section (Figure 6). Review of the entire group simultaneously using high-resolution thumbnail-sized images allowed rapid screening of the entire study (Figure 7). More time-use studies are necessary to evaluate the potential impact of this CNN-based decision support tool on study assessment, but considering that the masks can be viewed and expected phenotype can be confirmed in seconds, significant efficiencies appear possible.
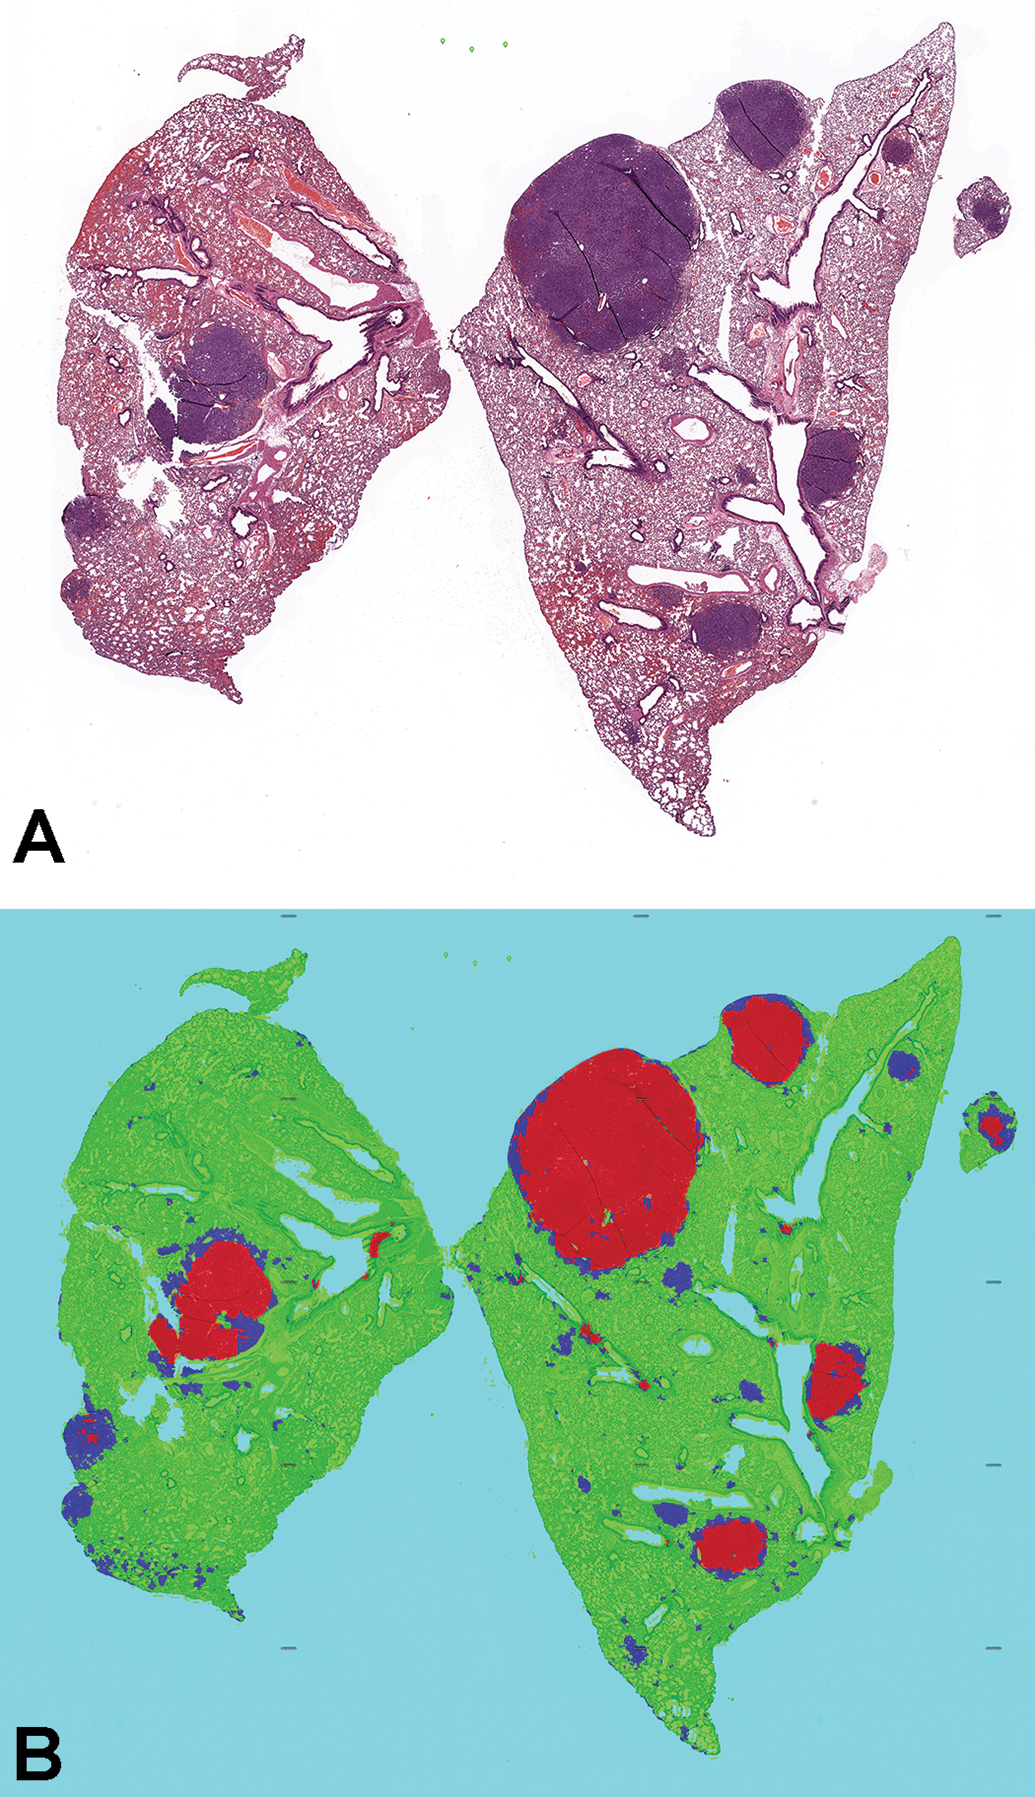
Visual map of lung proliferative lesion masks produced by EfficientNet. A, Masks are turned off to allow the pathologist to examine morphology in hematoxylin and eosin whole slide images. B, Masks are turned on for decision support in the identification of hyperplasia (blue) and adenoma/carcinoma (red).
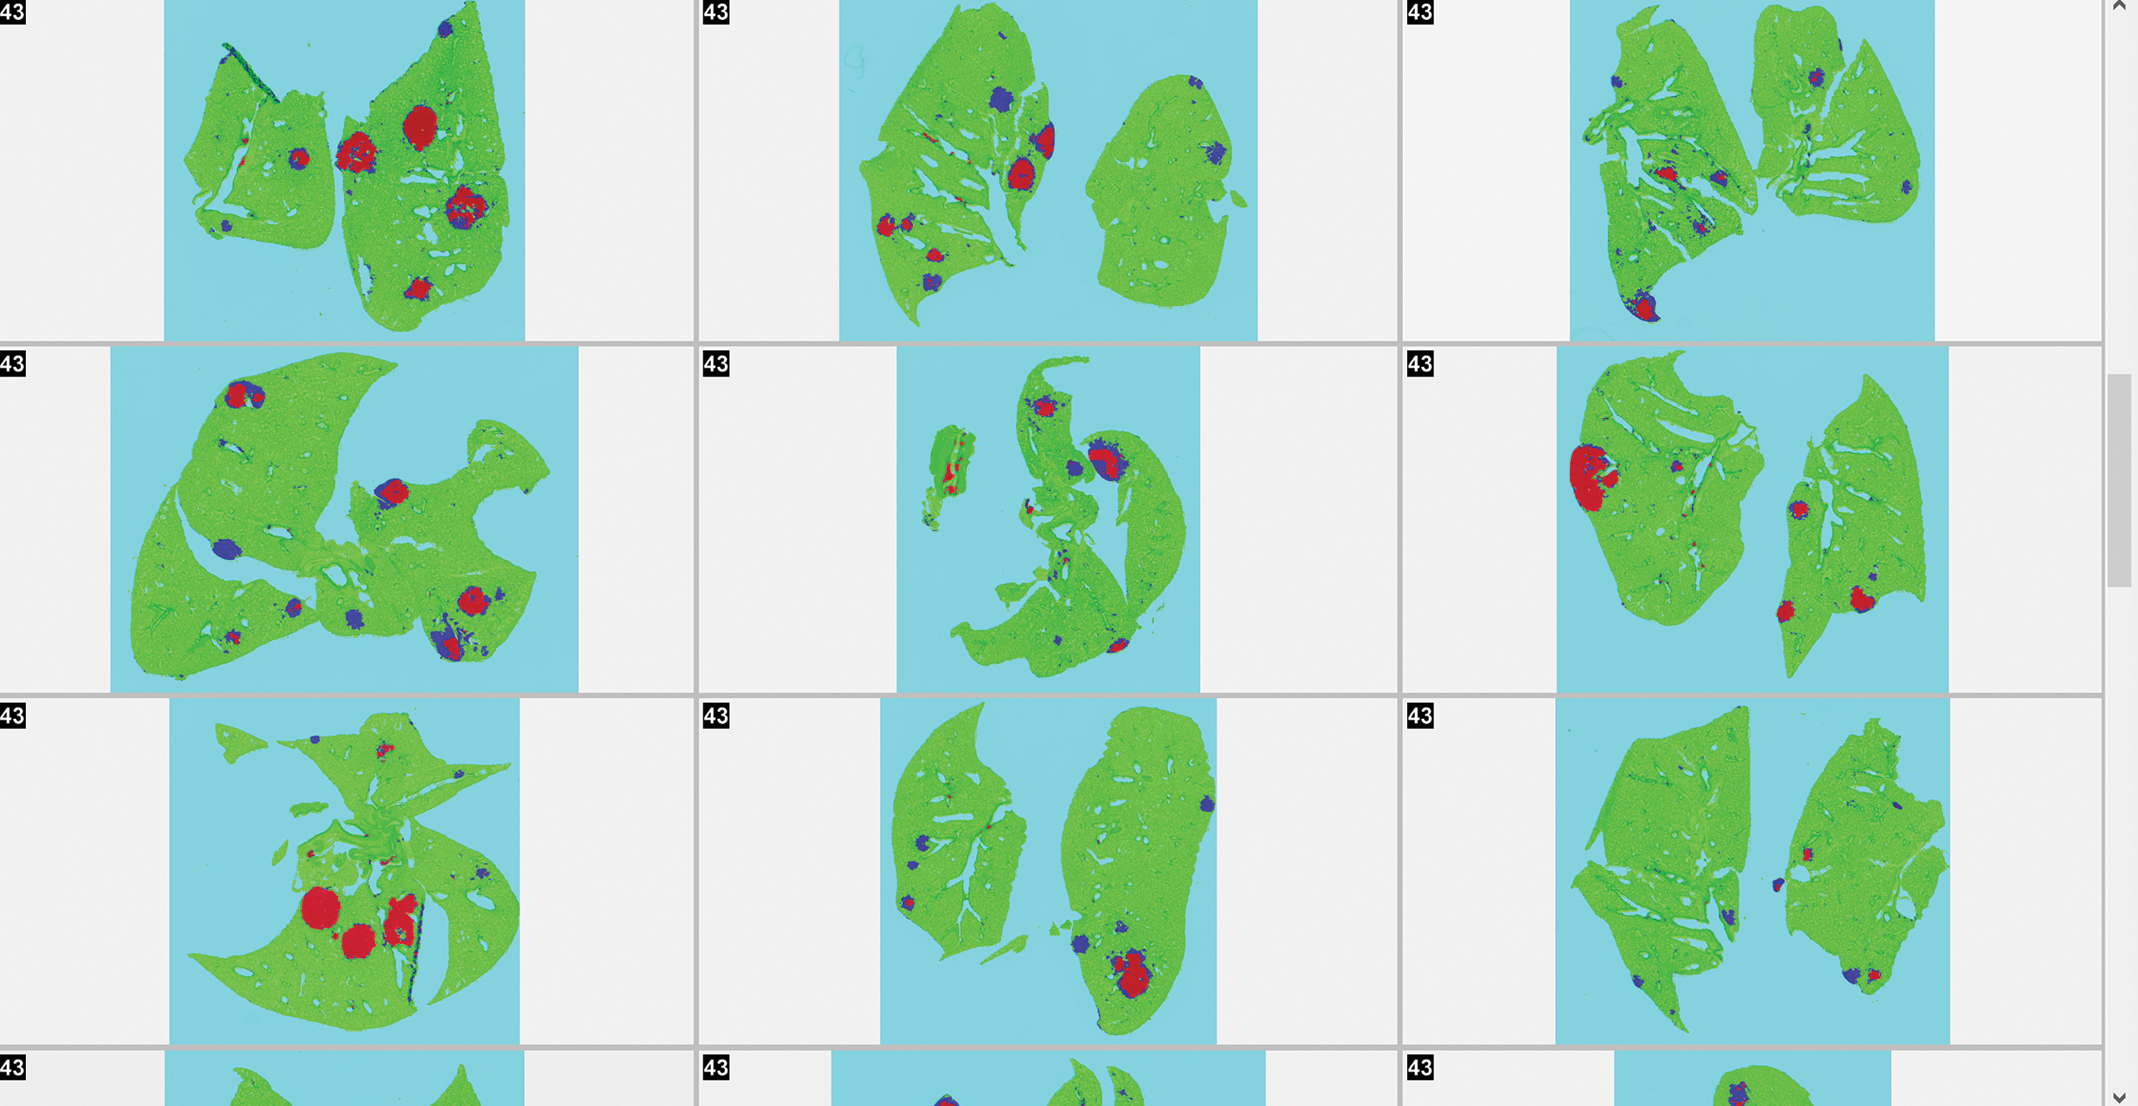
Screening mode of the lung proliferative lesions masks allowing rapid review of multiple high-resolution thumbnails for decision support.
Supplemental Material
Supplemental Material, sj-docx-1-tpx-10.1177_0192623320973986 - Using Deep Learning Artificial Intelligence Algorithms to Verify N-Nitroso-N-Methylurea and Urethane Positive Control Proliferative Changes in Tg-RasH2 Mouse Carcinogenicity Studies
Supplemental Material, sj-docx-1-tpx-10.1177_0192623320973986 for Using Deep Learning Artificial Intelligence Algorithms to Verify N-Nitroso-N-Methylurea and Urethane Positive Control Proliferative Changes in Tg-RasH2 Mouse Carcinogenicity Studies by Daniel Rudmann, Jay Albretsen, Colin Doolan, Mark Gregson, Beth Dray, Aaron Sargeant, Donal O’Shea D, Jogile Kuklyte, Adam Power and Jenny Fitzgerald in Toxicologic Pathology
Footnotes
Acknowledgments
The authors thank the Haolin Wei for his review and editorial suggestions for this manuscript.
Declaration of Conflicting Interests
Charles River Laboratories and Deciphex, Ltd. are engaged in an exclusive research and development partnership.
Funding
The author(s) received no financial support for the research, authorship, and/or publication of this article.
Supplemental Material
Supplemental material for this article is available online.
References
Supplementary Material
Please find the following supplemental material available below.
For Open Access articles published under a Creative Commons License, all supplemental material carries the same license as the article it is associated with.
For non-Open Access articles published, all supplemental material carries a non-exclusive license, and permission requests for re-use of supplemental material or any part of supplemental material shall be sent directly to the copyright owner as specified in the copyright notice associated with the article.