
Abstract
Sensitive kidney safety assessment is important for successful drug development in both preclinical and clinical stages. The Food and Drug Administration recently qualified a composite measure of 6 urine creatinine-normalized biomarkers, such as clusterin, cystatin C, kidney injury molecule 1 (KIM-1), N-acetyl-β-
Introduction
Drug-induced kidney injury (DIKI) is a significant contributor to drug attrition. 1 Traditional kidney safety biomarkers such as serum creatinine, blood urea nitrogen (BUN), urinalysis, urine albumin, and urine total protein have been used to monitor renal safety in both clinical and preclinical studies but have limitations, such as low sensitivity and being late indicators of renal damage. 2,3 The search for novel translatable kidney safety biomarkers with improved sensitivity and specificity has been ongoing for decades. 4
The Predictive Safety Testing Consortium (PSTC), with participants from several major pharma companies, has worked closely with the US Food and Drug Administration (FDA) to qualify novel safety biomarkers for multiple organ systems. Over the past decade, a number of novel urinary biomarkers for improved predictability of DIKI have been validated for use in preclinical studies,
5
but their impact in practical use has been limited by a lack of experience of translatability to the clinic. In 2018, the FDA approved a panel of 6 urinary biomarkers based on a clinical package submitted by the PSTC that included biomarker data from a nondrug healthy volunteer study and from samples collected in a retrospective study of patients with cisplatin-treated mesothelioma. The individual biomarkers clusterin, cystatin C, kidney injury molecule 1 (KIM-1), N-acetyl-β-
In rodents, the protein expression of KIM-1, clusterin, and NGAL is induced in renal proximal tubular cells upon kidney injury, resulting in increased urinary levels. 3,7 -10 KIM-1 is known as one of the genes increasing the most after kidney injury, correlating with kidney pathology in preclinical studies and with a renal injury outcome in clinical studies of acute kidney injury (AKI). 11 -14 NGAL was among the top 7 most induced genes after kidney injury 7 ; however, NGAL can be expressed in many different tissues and is also induced by inflammation, liver injury, and cancer. 15
N-acetyl-β-
The recent FDA approval of the biomarker panel is promising, but extended use of this novel tool will require further assessment. It remains to be seen if the CM or individual biomarkers would be able to detect milder degrees of injury that may be seen with other mechanisms and treatment modalities.
Synthetic oligonucleotide drugs continue to make steady progress to a mature and clinically validated therapeutic platform. 21 The majority of the single-stranded antisense oligonucleotides (ASOs) contain a negatively charged phosphorothioate backbone, resulting in nuclease resistance and strong binding to plasma proteins with reduced clearance via the glomerular filtration. When cleared into the urine, a large fraction is reabsorbed in the proximal tubular epithelium, leading to high ASO concentration in these cells. 22 Most ASOs also contain different ribose modifications in the 2′ position, thus providing further nuclease resistance and higher affinity to RNA. Examples of commonly used ribose modifications include 2′-O-methyl (2′OMe) and 2′-O-methoxyethyl (2′MOE) where the newer 2′O-4′C-bridged ribose modifications such as locked nucleic acid (LNA) and constrained ethyl (cEt) have been implemented in single-stranded ASOs to achieve even higher binding affinity to the RNA targets as well as proteins. 23-25
The kidney is a complex organ involved in drug metabolism and elimination, and with the high ASO concentration achieved in the kidney cortex, it is perhaps not surprising that kidney toxicities can occur. One type of sequence-independent kidney toxicity observed with 2′MOE ASOs is mainly driven by accumulation and is only seen at high doses in toxicity studies. 22,26 A general low risk for renal toxicity at therapeutically meaningful doses is indicated by a meta-analysis of 28 placebo-controlled clinical trials of 11 different 2′MOE ASOs. 27 Although statistically significant changes in serum creatinine and estimated glomerular filtration were observed for ASO-treated patients, these findings were reported as within normal range and of low clinical relevance. Patients with underlying renal impairment may, however, show an increased susceptibility for changes in renal parameters. 28
In addition, with the use of higher affinity 2′ ribose ASO chemistries like LNA and cEt, a different pattern of renal toxicity that occurs at lower doses has emerged. 29 With sequence being the key determinant for this type of toxicity, preclinical screening is required to select sequences that are as safe as possible. Although possibly acting via different toxicity mechanisms, there have been instances where such preclinical safety screening has failed to identify ASOs of varying chemistry that resulted in renal toxicity in clinical studies. 30 -33 This highlights the need for more sensitive preclinical tools that translate to a clinical setting and can be used to monitor renal safety.
KIM-1 has been demonstrated to be a highly specific and sensitive biomarker for DIKI in preclinical studies of small molecules 8,13,34,35 ; however, publicly available preclinical biomarker data for ASOs are limited. A tricyclo-DNA oligonucleotide drug was shown to increase urinary KIM-1 in mice. 36 In a clinical study with a 14-mer oligonucleotide LNA ASO SPC5001, targeting PCSK9, significantly elevated urinary KIM-1 correlated with histopathologically confirmed tubular injury. 30,31 In a different clinical study with a 2′MOE-modified ASO against SGLT2, a dose-dependent increase in urinary KIM-1 and β2-microglobulin correlating with increased plasma creatinine was observed. Rather than tubular injury, a possible adaptive tubular dysfunction was proposed as a mechanism in this study. 32,37 Taken together, these reports suggest that assessing urinary biomarkers in both preclinical and clinical ASO studies is important to understand changes reflecting adaptive functional versus adverse renal events.
In this study, we investigate in mice the response of the FDA-approved panel of novel urinary safety biomarkers and the composite measurement index to a constrained ethyl (cEt) ASO (tool ASO) showing nephrotoxicity and a control ASO.
Materials and Methods
Animals
The study was conducted in accordance with European and Swedish animal welfare regulations and approved by the Swedish Animal Welfare Agency (ethical application no. 001162-2017). Animals were accommodated in an equal light/dark cycle (12/12 hours) with free access to food and water throughout the study. Thirty-two male FVB mice were acclimatized for at least 5 days, then divided into 4 cohorts of 8 animals in each.
Study Design
Group 1 was dosed with phosphate-buffered saline (vehicle), group 2 with 50 mg/kg Ionis-860042 (control ASO), and groups 3 and 4 with 50 or 10 mg/kg of Ionis-860151 (tool ASO), respectively (Table 1). All animals were dosed subcutaneously once a week for 8 consecutive weeks on days 1, 8, 15, 22, 29, 36, 43, 50, and 57. Blood and urine samples were collected 48 hours after each dose. The mice were terminated 48 hours after the last dose. Blood samples were collected by tail prick, placed on ice prior to centrifugation, and stored as plasma at −20 °C until analysis. Urine was collected by spot urine sampling, and samples were centrifuged at 1700g for 10 minutes at 4 °C and then aliquoted and stored at −80 °C until processing.
Dose Groups and Treatment Details.
Abbreviations: ASO, antisense oligonucleotide; PBS, phosphate-buffered saline.
Materials
Two cEt ASO compounds were obtained from Ionis Pharmaceuticals: Ionis-860042 and Ionis-860151 (Ionis Pharmaceuticals). These ASOs have a full phosphorothioate backbone and a 3-10-3 gapmer design with 2′ ribose cEt in the 5′ and 3′ wings flanking a central DNA region. The ASOs have the following sequences: Ionis-860042: GCAAAAGTCCGACCAG and Ionis-860151: TGTGAACCCTGAGCCA. The ASOs were selected from an in vivo screening exercise and displayed comparable efficacy. However, Ionis-860151 exhibited a greater induction of biomarkers of renal tubular injury and will be referred to as the tool compound and Ionis-860042 will be used as a control.
Histopathology
Kidneys and livers were collected at necropsy and immersed in 10% neutral-buffered formalin. After fixation, similar sections were trimmed from all animals, dehydrated by routine ethanol gradient, and embedded in paraffin. Paraffin blocks were subsequently cut in 3 µm sections and stained with hematoxylin–eosin for histological assessment. Pathological findings were graded semiquantitatively as 0 = no pathology, 1 = minimal, 2 = slight, and 3 = moderate. No pathological findings were considered severe.
Biomarker Analysis
Urinary Biomarker Analysis
N-acetyl-β-d -glucosaminidase assay
For NAG analysis, a colorimetric assay (cat. no. 10 875 406 001; Roche, Sigma-Aldrich) was transferred and optimized for a 96-well plate format due to the limited amount of mouse urine. Briefly, 120 µL of reagent A was activated at 37 °C for 5 minutes in a 96-well plate, and 10 µL of prediluted urine specimen and serially diluted standards (353-6 mU/mL, cat. no. 10 982 962 001; Roche, Sigma-Aldrich) were added to the microplate and incubated for 16 minutes at 37 °C. The reaction was stopped with 200 µL of stop reagent, and the absorbance was measured at 580 nm using a spectrophotometer (Spectramax Id3; Molecular Devices). The amount of NAG was interpolated from the standard curve.
Multiplex biomarker analysis
Commercial kits were used to quantify urinary NGAL, clusterin, cystatin C, osteopontin (MKI2MAG-94k; Millipore), KIM-1, and β2-microglobulin (MKI1MAG-94k; Millipore) according to kit inserts with minor modifications and analyzed on a BioPlex 200 instrument (BioRad Laboratories) using the BioPlex manager software version 6.1 standards. Standards and quality controls (QCs) were run in duplicates for each biomarker, and the standard curve was generated using lyophilized standards included in the kit. The mean fluorescence intensity was used to calculate the observed concentration. Minor modifications from kit instructions were singlicate analysis of samples and adjustment of gate settings during BioPlex analysis to 8000 to 25,000 according to Millipore recommendations. Inter- and intra-assay coefficient of variations (CVs) for QC samples were calculated per biomarker and across all plates and reported in Supplemental Table 1.
Clinical Chemistry
The following plasma chemistry parameters were measured using standardized methods in terminal samples: aspartate aminotransferase (AST), alanine aminotransferase (ALT), alkaline phosphatase (ALP), glutamate dehydrogenase (GLDH), creatine kinase, total bilirubin, bile acid, urea, creatinine, glucose, cholesterol, triglycerides, total protein, albumin, globulin, total calcium, potassium, phosphate, sodium, and chloride.
Creatinine analysis was performed using an in-house mass spectrometry assay. Briefly, 5 µL blood was diluted with 10 µL water. Urine was diluted 50 times. For blood, 100 µL of 0.2 µM D3-Crea IS in 90% acetonitrile (ACN) was added and the sample was mixed. 10 µL creatinine in 90% ACN was used as standard samples and diluted with 200 µL IS solution after adding 20 µL water to standard samples. Separation was achieved on a Waters BEH-Amide 5 cm × 2.1 mm column using 95% ACN and 5% buffer (5 mM AmF + 0.0625% FA) as A phase and buffer (10 mM AmF + 0.125% FA) as B phase. All samples were analyzed in a single run for each matrix, and creatinine concentrations were interpolated from the standard curve. Intra-assay variation was evaluated by repeated measures of a QC sample. For a sample of a mean creatinine concentration of 7.4 µM, the intra-assay CV was 4.3%.
Statistical Analysis
Biomarker concentrations were normalized to urine creatinine, and the geometric mean of fold change (FC) from baseline was used for visualization. For statistical analysis of biomarker FCs between time points, treatment groups, and histopathology score groups, mixed-effects analysis was performed, followed by Dunnett multiple comparisons test or Kruskal-Wallis using Prism version 8.0.2. A P value of <.05 was considered significant unless otherwise stated. Calculation of the individualized composite measure (CMi) of the kidney biomarker panel was performed as proposed in the FDA qualification as follows:

where FC ij is the urine creatinine normalized FC from baseline for participant i and biomarker j = 1, 2,…, 6.
Spearman correlation was used for the evaluation of correlations between histopathology findings and creatinine normalized biomarker concentrations and between biomarkers.
Results
Antisense Oligonucleotide-Induced Histopathology Changes
Representative images from kidneys are presented in Figure 1A to D. Pathological changes manifested as tubular degeneration and regeneration (basophilia). For incidences, see Table 2.
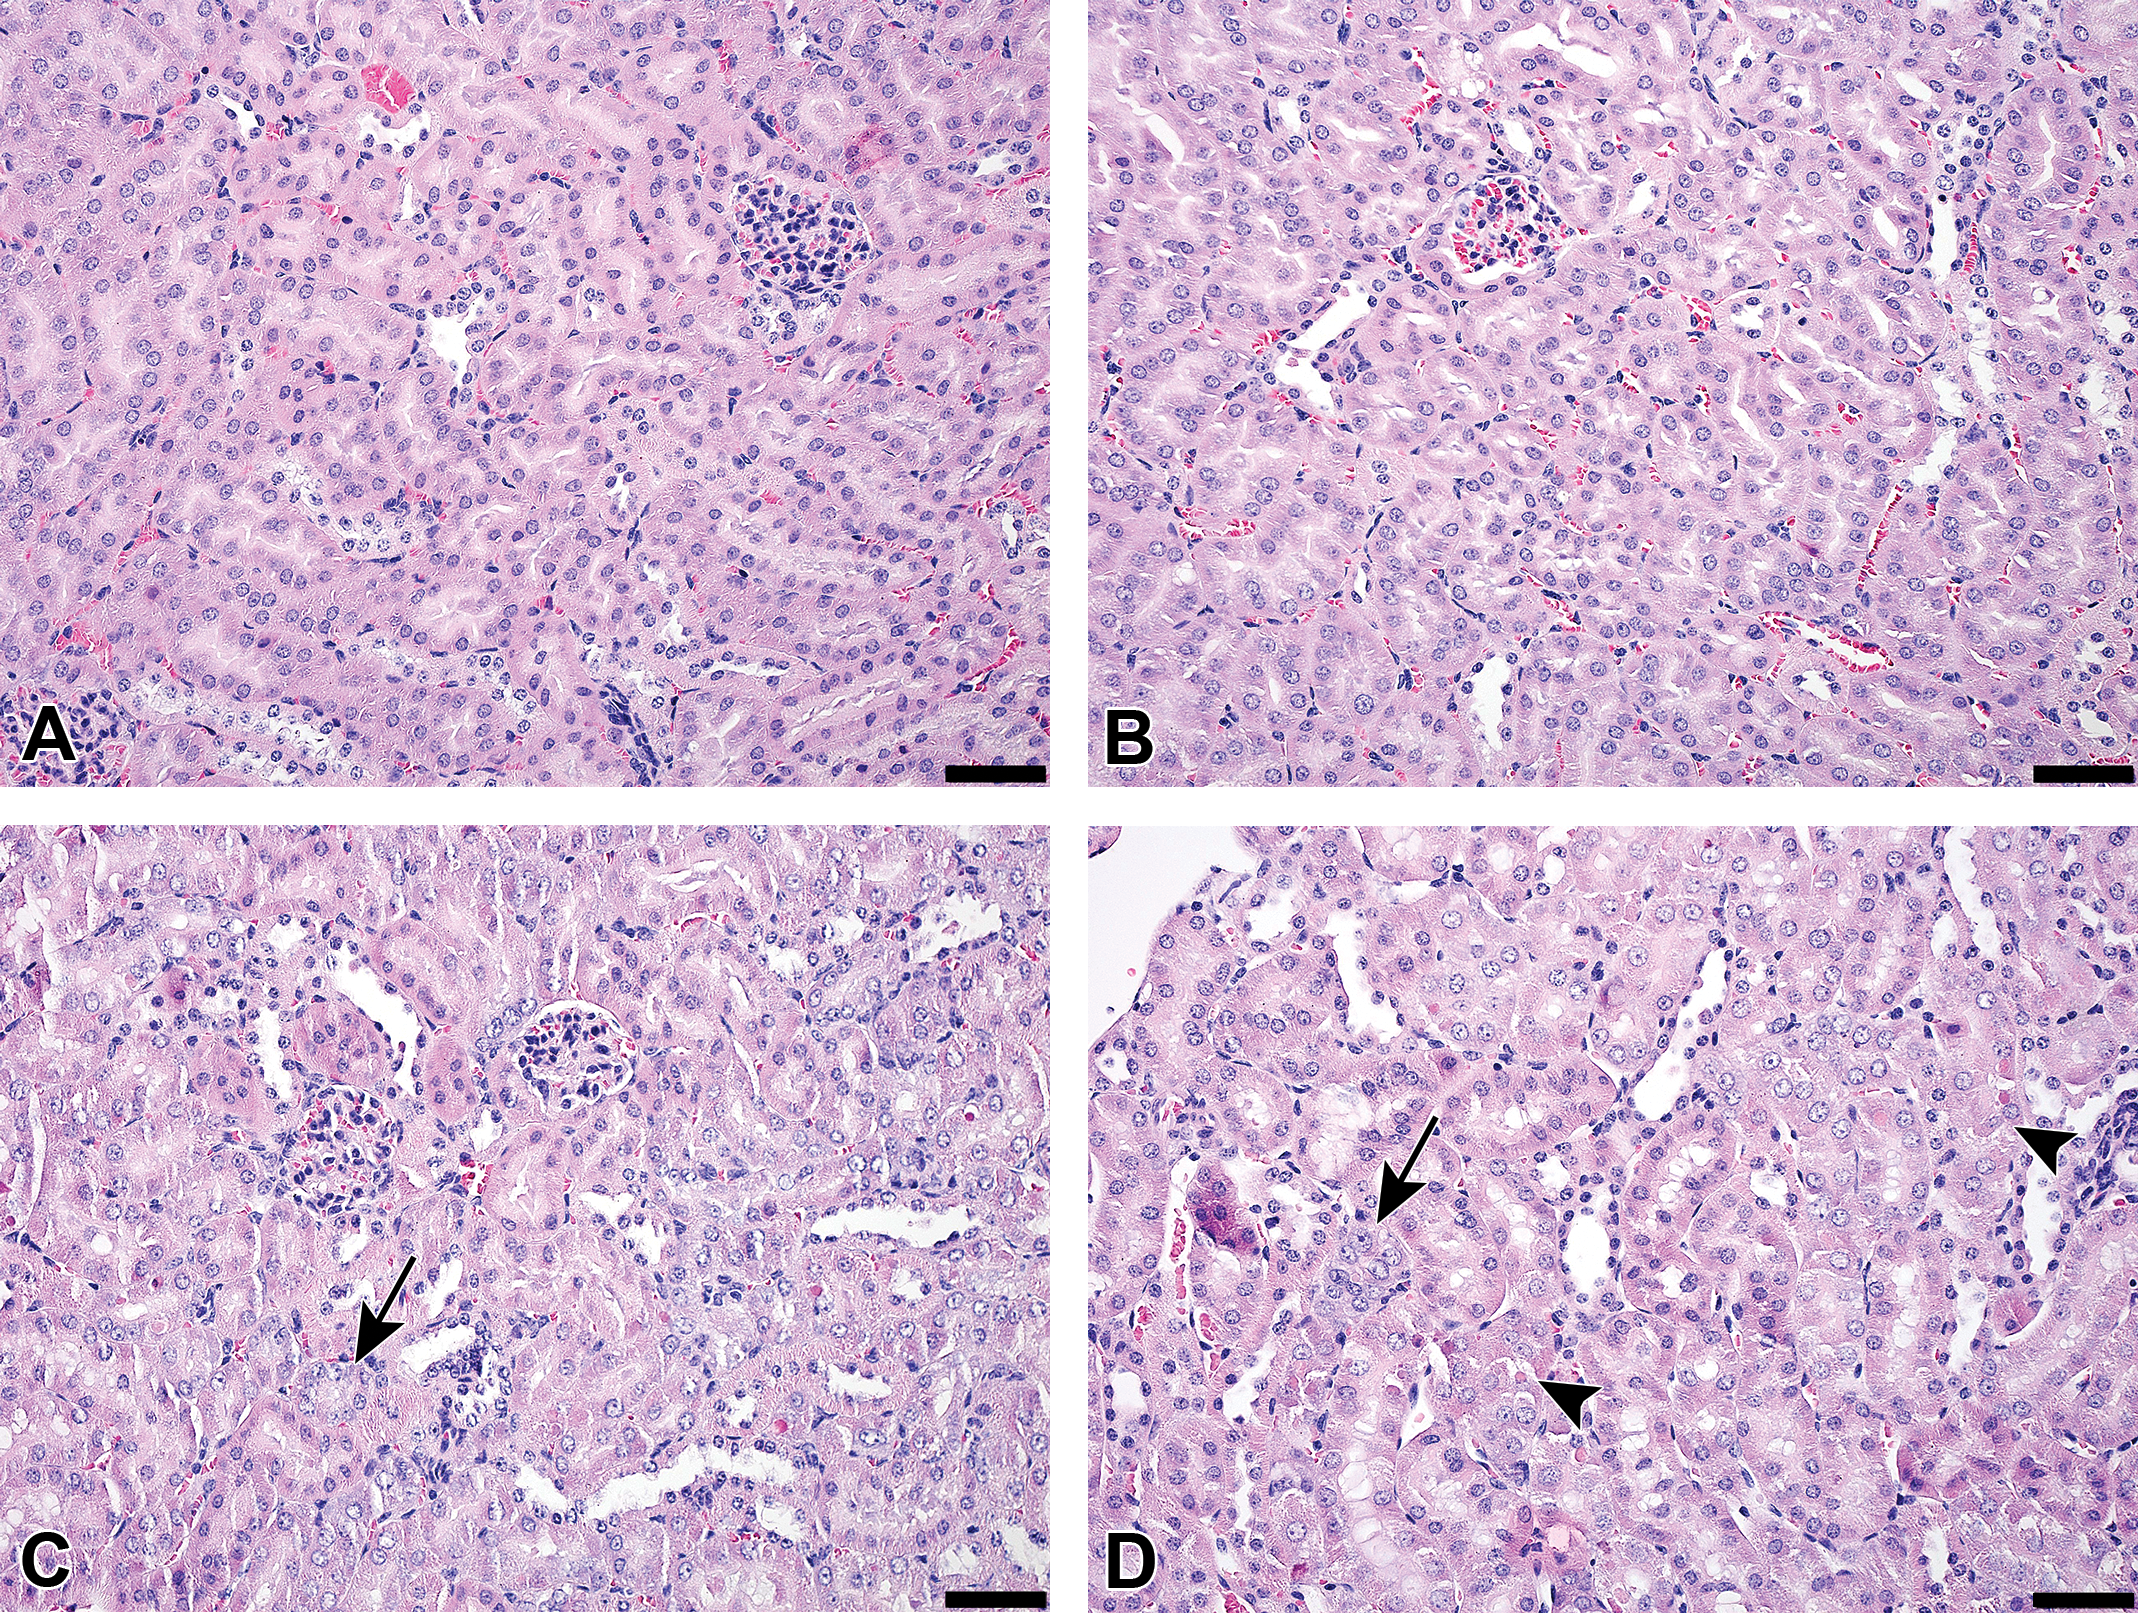
Kidney histomorphology after 8 weeks of treatment in (A) PBS controls, (B) control ASO 50 mg/kg, (C) tool ASO 10 mg/kg, and (D) tool ASO 50 mg/kg. No pathological findings were observed in the kidneys of PBS control or control ASO animals. Tubular pathology was found in tool ASO animals. Black arrows indicate tubular regeneration (basophilia), black arrowheads indicate tubular degeneration. Original objective ×20, black bar represents 50 μm, hematoxylin-eosin stain. ASO indicates antisense oligonucleotide; PBS, phosphate-buffered saline.
Incidence of Histopathological Findings in Kidney and Liver After 8 Weeks of Treatment.
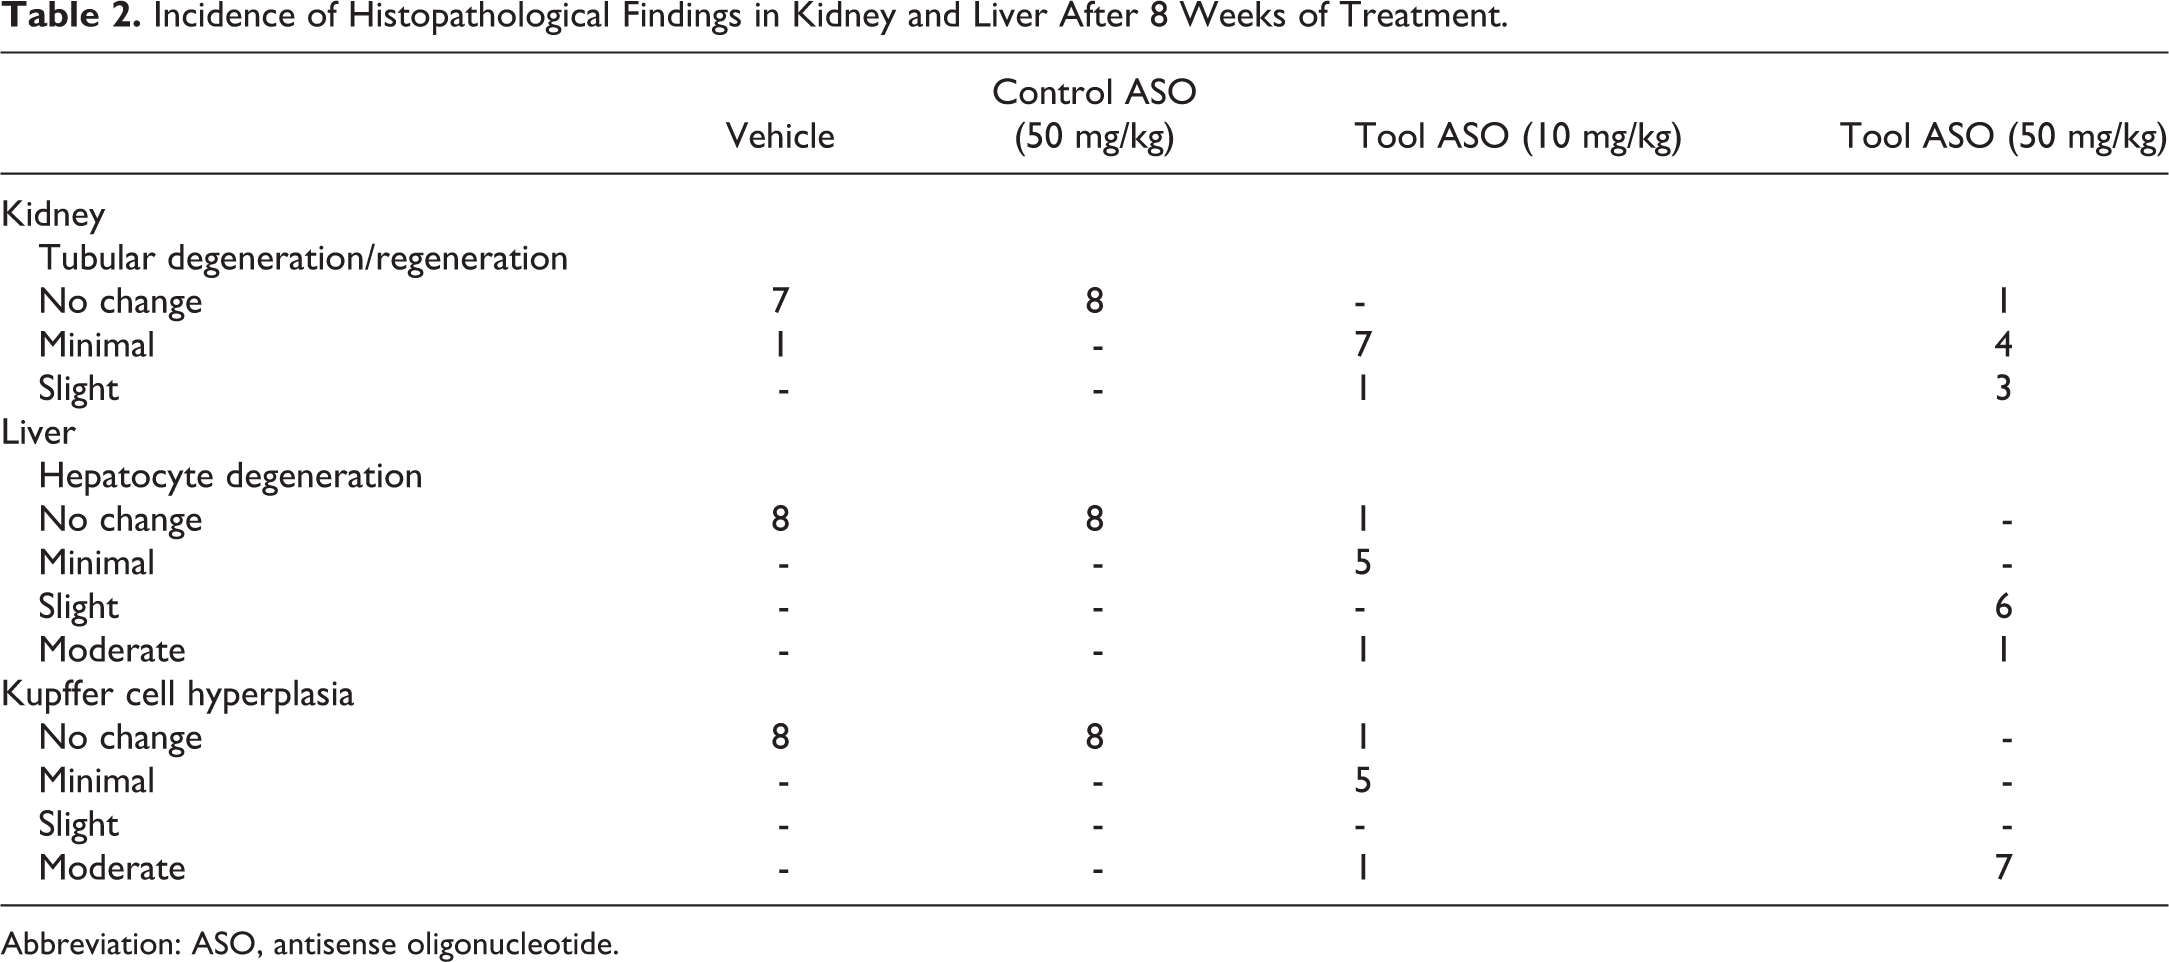
Abbreviation: ASO, antisense oligonucleotide.
Pathological findings in the liver included hepatocyte degeneration and Kupffer cell hyperplasia (see Table 2). Focal lymphocyte infiltration was seen in some animals (not shown in the table). Representative images are presented in Figure 2A to D. There were no signs of liver pathology in the vehicle and control ASO groups.
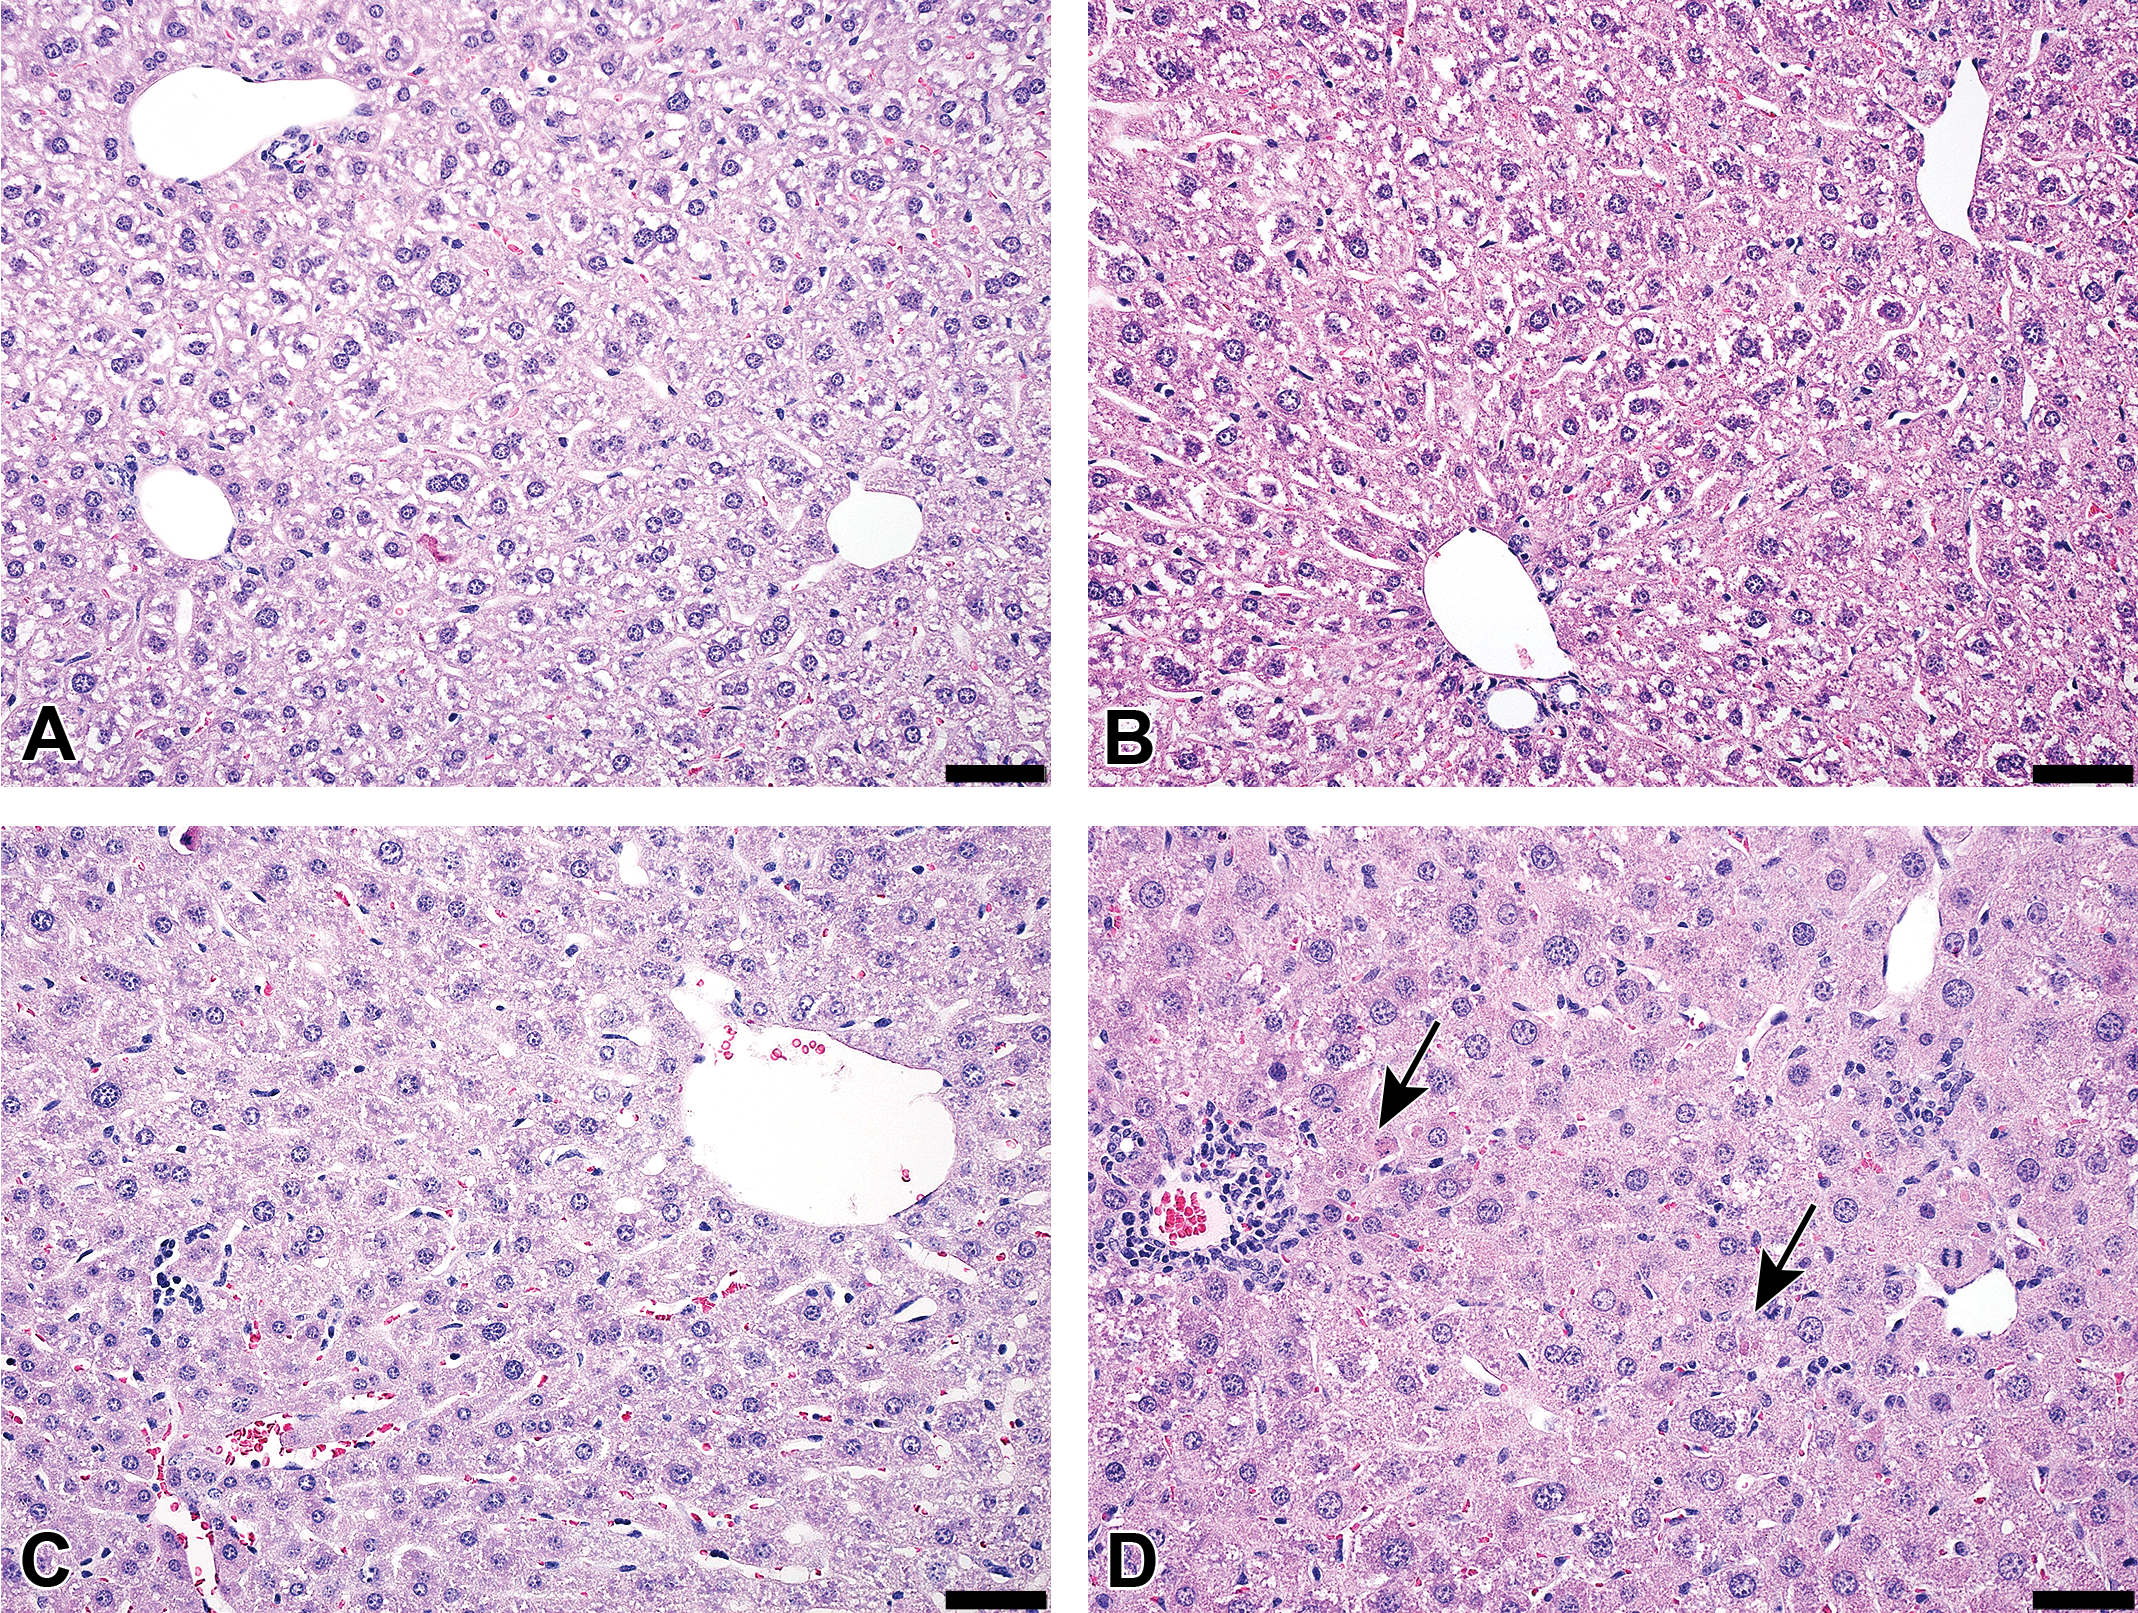
Liver histomorphology after 8 weeks of treatment in (A) PBS controls, (B) control ASO 50 mg/kg, (C) tool ASO 10 mg/kg, and (D) tool ASO 50 mg/kg. No pathological findings were observed in the livers of PBS control or control ASO animals. A few hepatocytes with degeneration were seen in tool ASO 10 mg/kg animals. C, A representation of liver area without degenerative changes. D, Black arrows indicate hepatocyte degeneration. Focal inflammatory cell infiltrates were also seen in tool ASO animals (C and D). Original objective ×20, black bar represents 50 μm, hematoxylin-eosin stain. ASO indicates antisense oligonucleotide; PBS, phosphate-buffered saline.
Temporal Change in Urinary Kidney Biomarker Concentrations by ASO Treatment
Biomarker milliplex assay performance captured by QC samples was overall within acceptable limits and showed intra-assay CVs of 3.3% to 17.9% and inter-assay CVs of 5.6% to 20.4%. Inter-assay QC1 for NAG shows a 24.6% CV, but with the biological variability shown by NAG, this is unlikely to change our judgment of the usefulness of this biomarker for ASO-induced kidney toxicity in this study. The potential difference in biomarker concentration due to assay variability is not considered relevant as the biological variability was substantially greater. Moreover, the FCs on group level and the biological conclusions drawn in this study are unlikely to be affected by assay variability. Biomarker concentrations were normalized to urine creatinine to reduce the influence of intra- and interindividual urinary flow. Biomarker results are presented as geometric means of FC from predose levels after normalizing to urine creatinine in Figure 3. Significant differences for each time point compared to vehicle are reported in Supplemental Table 2. Additionally, data on a potentially clinically relevant urinary kidney biomarker, β2-microglobulin, are reported in Supplemental Figure 1 for comparison.
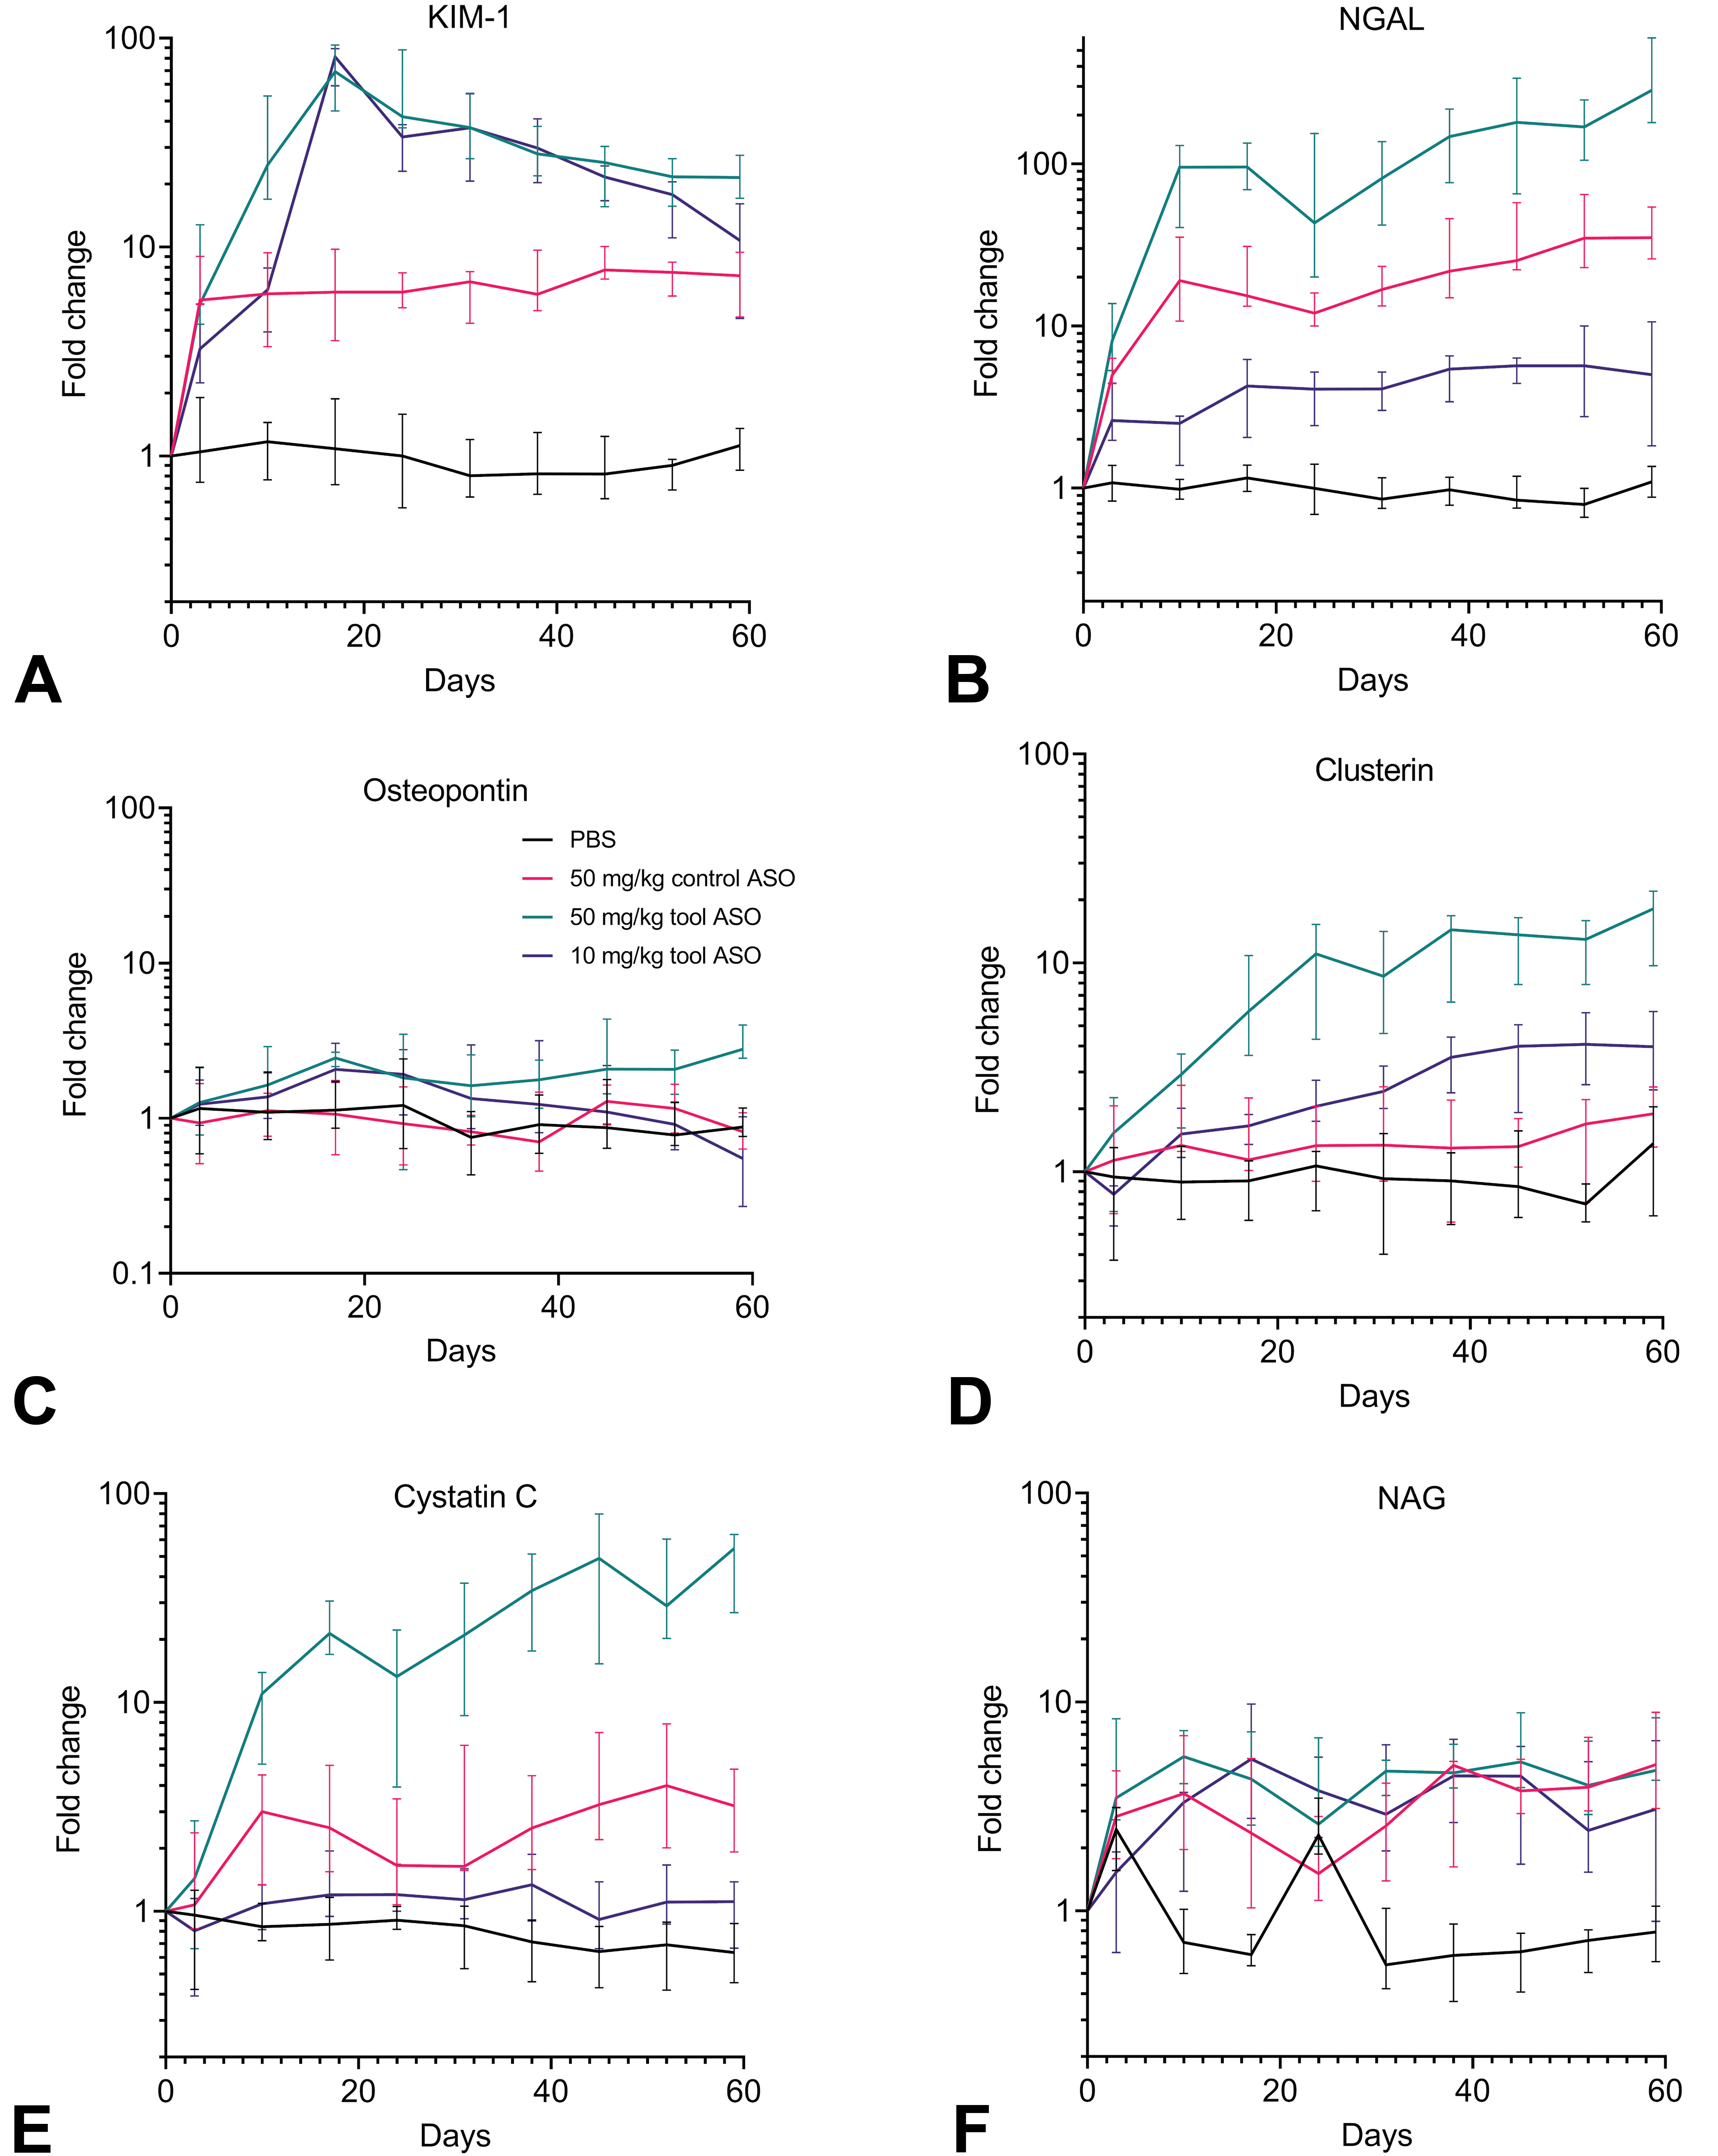
Kidney biomarker levels at different time points expressed as fold change normalized to urine creatinine across groups during 8 weeks of treatment. KIM-1 (A), NGAL/lipocalin 2 (B), osteopontin (C), clusterin (D), cystatin-C (E), and NAG (F). Fold changes are visualized by geometric mean with interquartile range error bars. ASO indicates antisense oligonucleotide; KIM-1, kidney injury molecule 1; NAG, N-acetyl-β-
KIM-1 was increased by treatment with 50 mg/kg tool ASO from day 3 and onward (Figure 3A), reaching a peak increase (69.1×) on day 17. KIM-1 increases occurred slightly later for 10 mg/kg tool ASO, although reaching a similar peak level (81.3×) at day 17 as for the corresponding higher dose. Dosing the control ASO did not result in a distinct peak of KIM-1, but an elevation from the baseline level was observed already from day 3 and was sustained throughout the entire study period (5.6-7.8).
NGAL was elevated already at day 3 in the 50 mg/kg tool ASO group (Figure 3B) and continued to increase until the end of the study (285.1×). Also, 10 mg/kg tool ASO induced an early but milder increase in NGAL at day 3 and continued to increase over time, reaching a 5× change at termination. In the control ASO group, NGAL elevation occurred from day 10, reaching peak changes at termination (35.1×), and was overall higher than for the mice dosed with 10 mg/kg tool ASO.
A trend toward higher osteopontin levels was apparent in the 50 mg/kg tool ASO group; however, no statistically significant changes were found in ASO-treated groups compared to vehicle at any time point (Figure 3C).
Increased clusterin levels were detected from day 10 for the high dose of tool ASO and from day 17 for 10 mg/kg (50 mg/kg = 2.9× at day 10; 10 mg/kg = 1.7× at day 17; Figure 3D). The dose-dependent increases in clusterin after tool ASO treatment plateaued at day 38. No significant changes in clusterin were detected at any time point in the control ASO group.
Elevated cystatin C levels appeared at day 10 in 50 mg/kg tool ASO- and control ASO-treated groups (50 mg/kg tool ASO = 11.0×; control ASO = 3.0×, Figure 3E) and continued to increase over time in the 50 mg/kg tool ASO group, reaching a peak change at termination (54.2×). For the ASO control group, cystatin C reached a 3.2× change at termination. Cystatin C levels were largely unaffected by doses of 10 mg/kg tool ASO.
For NAG, there was no clear trend for ASO-treated groups across the entire treatment period, although elevated levels appeared at several time points (Figure 3F).
Although reflecting different processes or sites of toxicity in the kidney, the biomarker changes were all correlated in animals treated with the tool ASO (Table 3). Clusterin, NGAL, and cystatin C were highly correlated with Spearman correlation coefficients around 0.8, reflecting their similar pattern of change over time. However, KIM-1, being most affected but with a different profile over time, is less correlated with the other 5 biomarkers.
Biomarker Correlations in Tool ASO-Treated Groups.a
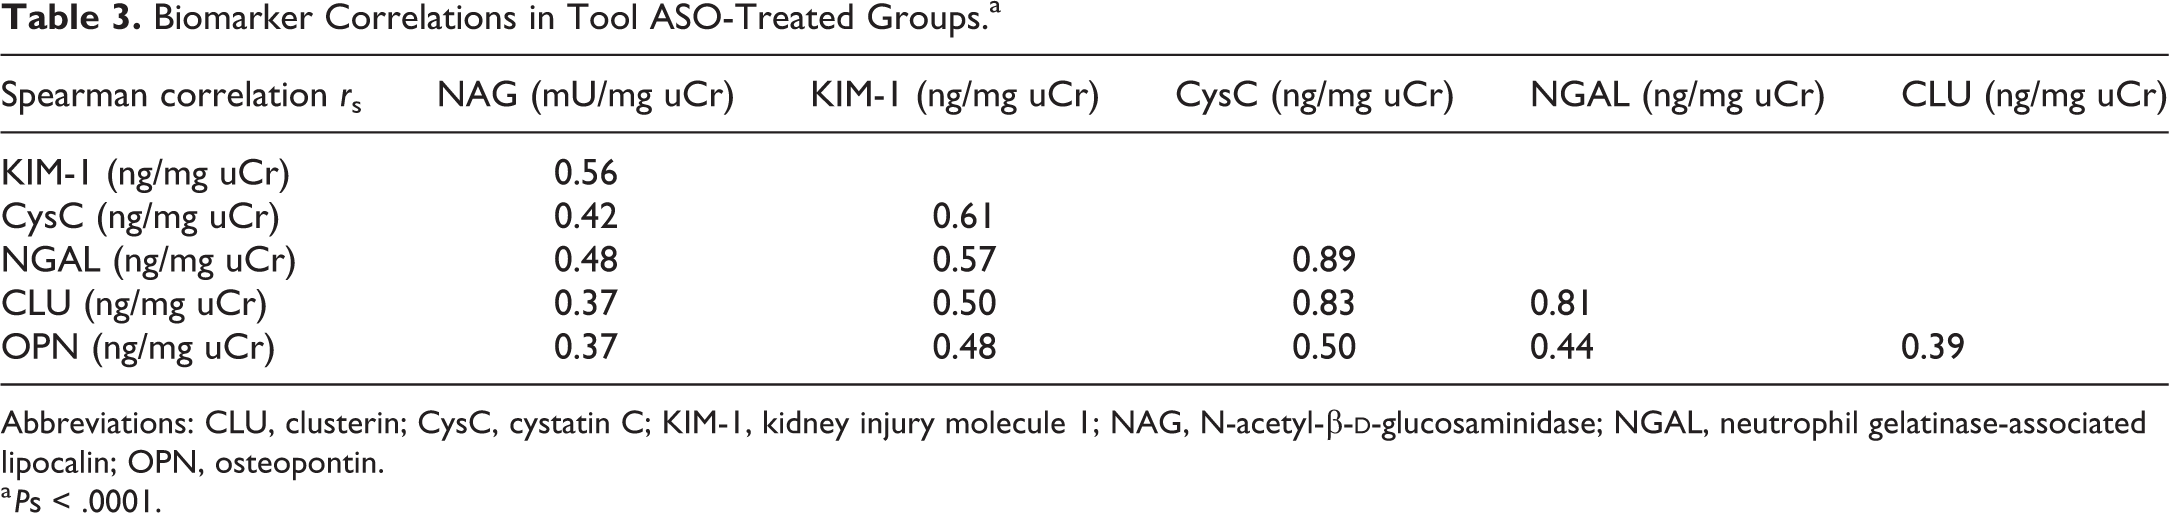
Abbreviations: CLU, clusterin; CysC, cystatin C; KIM-1, kidney injury molecule 1; NAG, N-acetyl-β-
a Ps < .0001.
To visualize the biomarker results as a CM suggested for clinical use by FDA, calculation of the CMi was plotted per group against time in Figure 4.
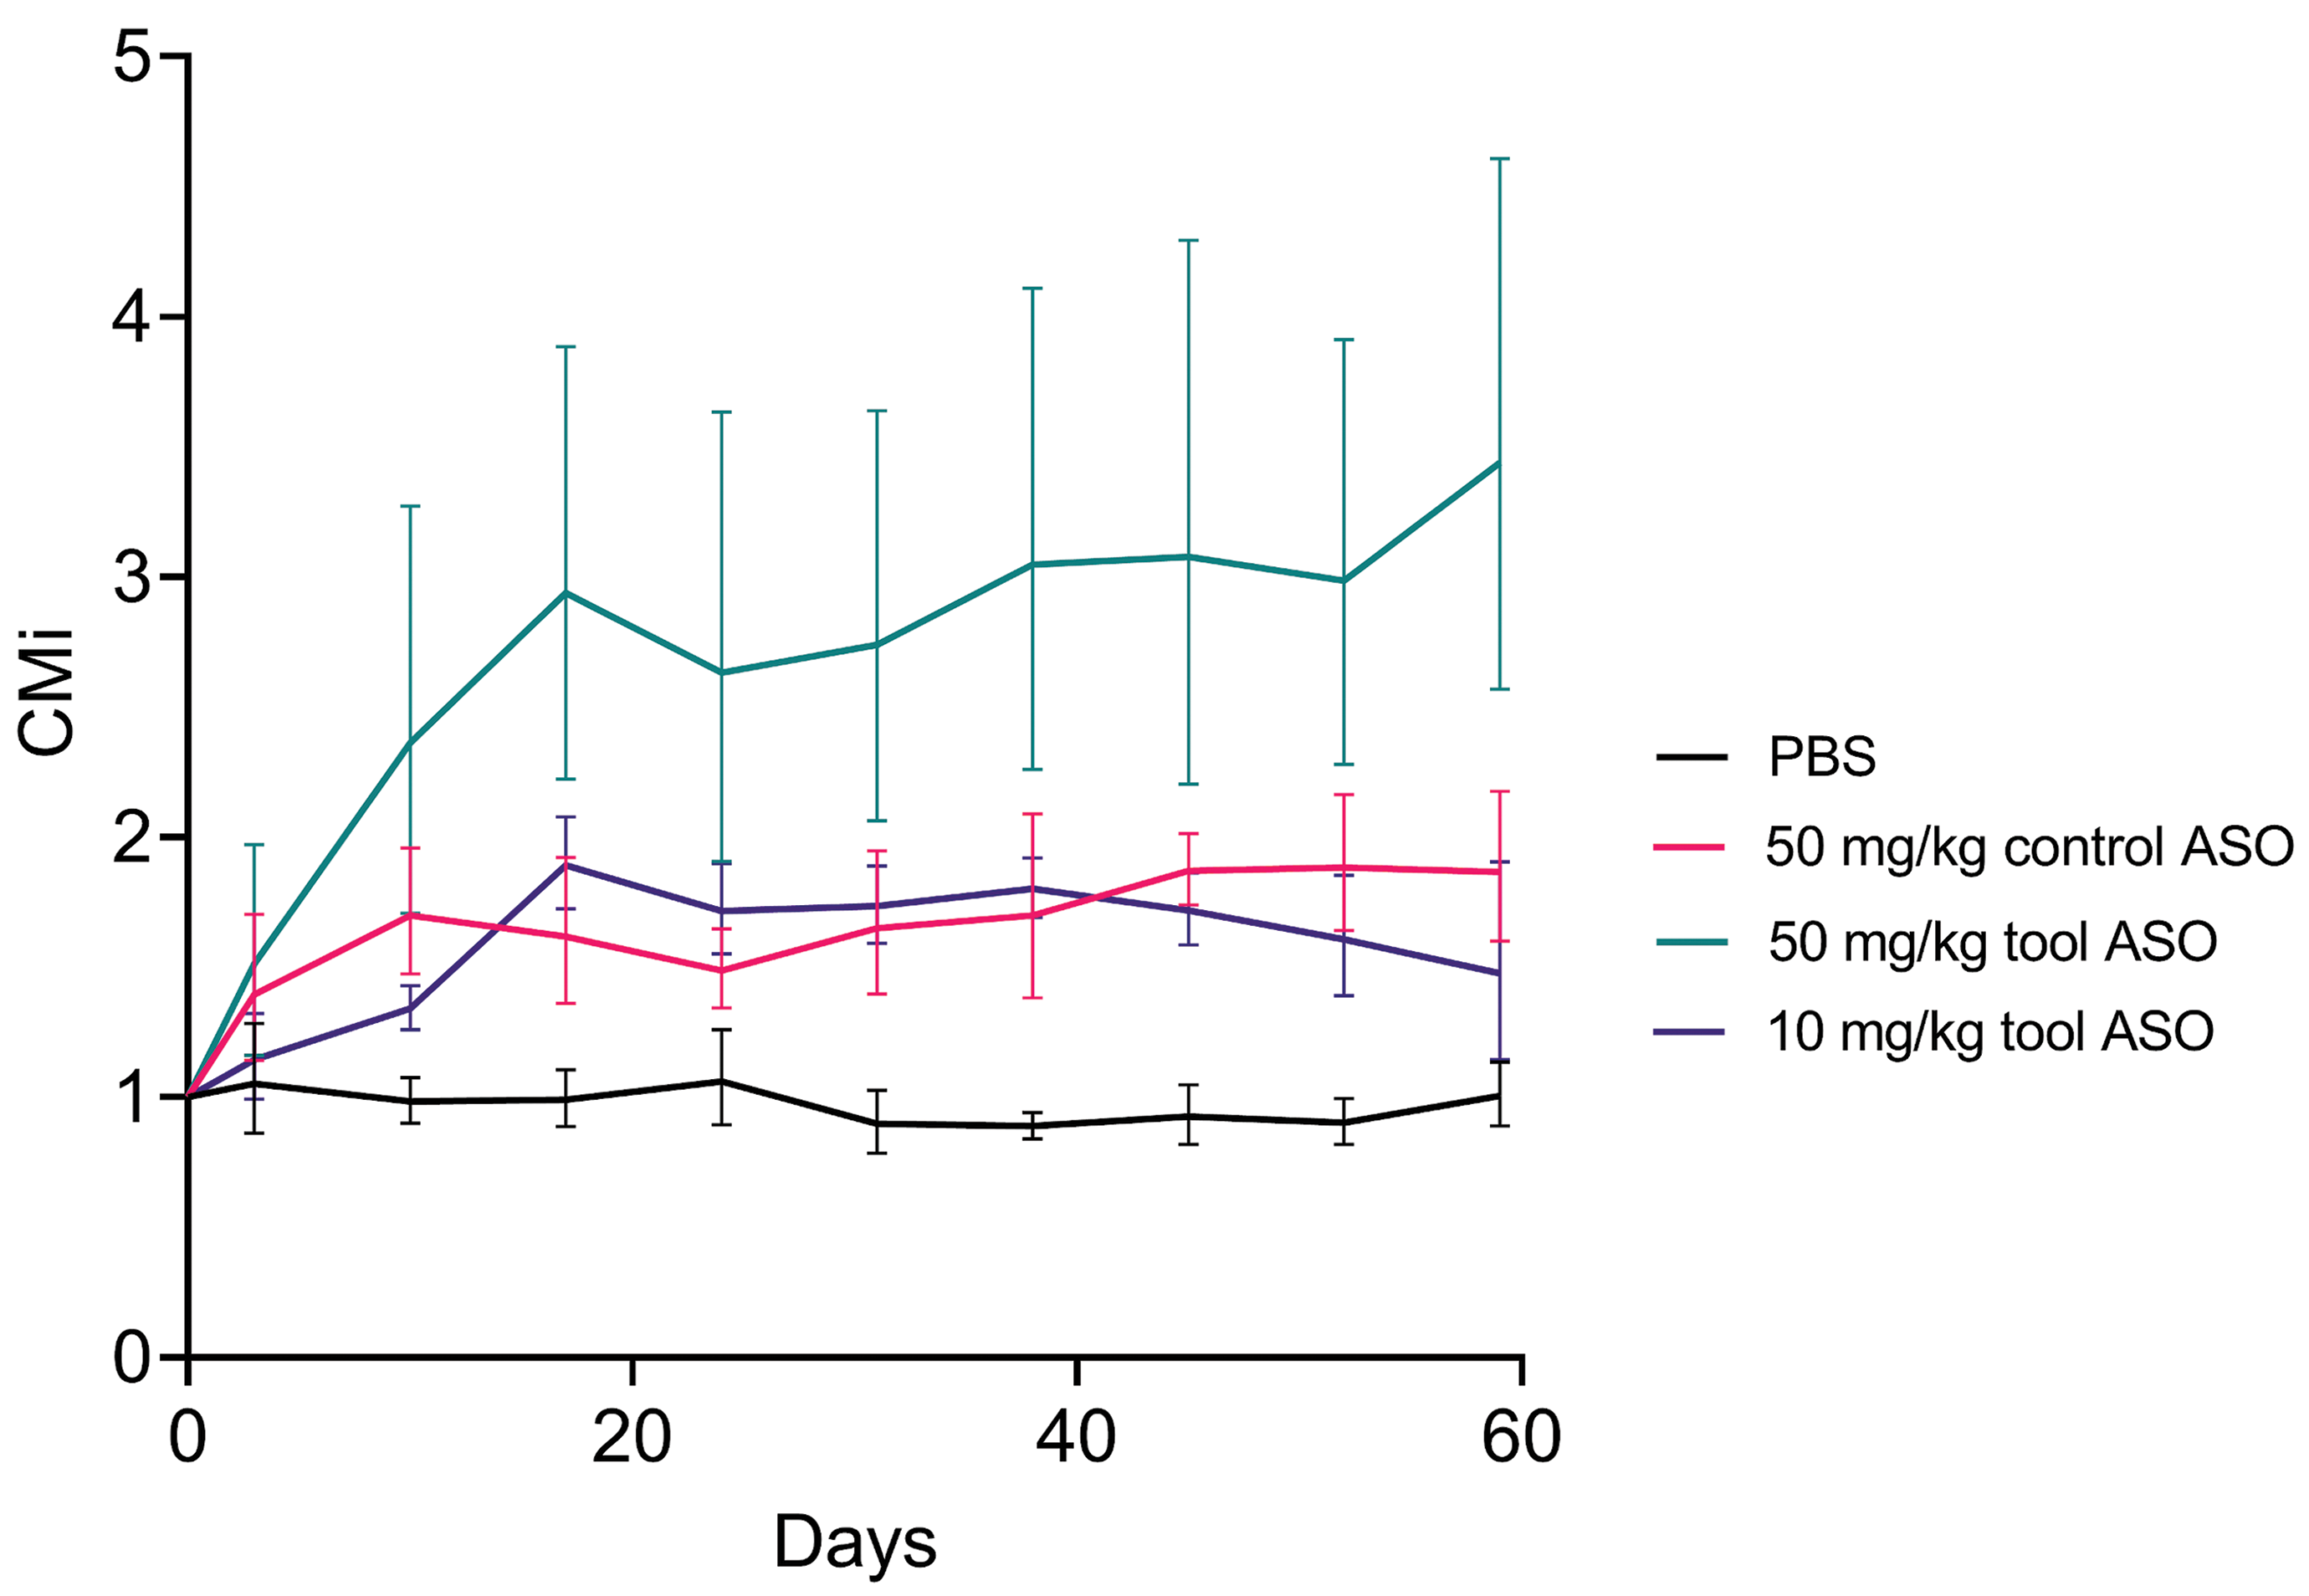
Food and Drug Administration–qualified composite measure of kidney biomarkers across groups during 8 weeks treatment was increased for all 3 groups from day 3 compared to vehicle (phosphate-buffered saline) throughout the study. Fold changes are visualized by geometric mean with interquartile range error bars. CMi indicates individualized composite measure.
Biomarker Associations to Pathology
The concentrations of KIM-1 and clusterin at termination increased significantly with the severity of tubular degeneration/regeneration (KIM-1 P < .01; clusterin P < .001; Figure 5A and B). For KIM-1, the association with terminal pathology findings was more pronounced at day 17 (P = .0002; Figure 5C), whereas clusterin levels at this early time point were not associated with terminal pathological severity (Figure 5D). The concentrations of NGAL and cystatin C at termination did not change at different degrees of kidney pathology (Figure 5E and F). Osteopontin and NAG did not change significantly with kidney pathology (data not shown).
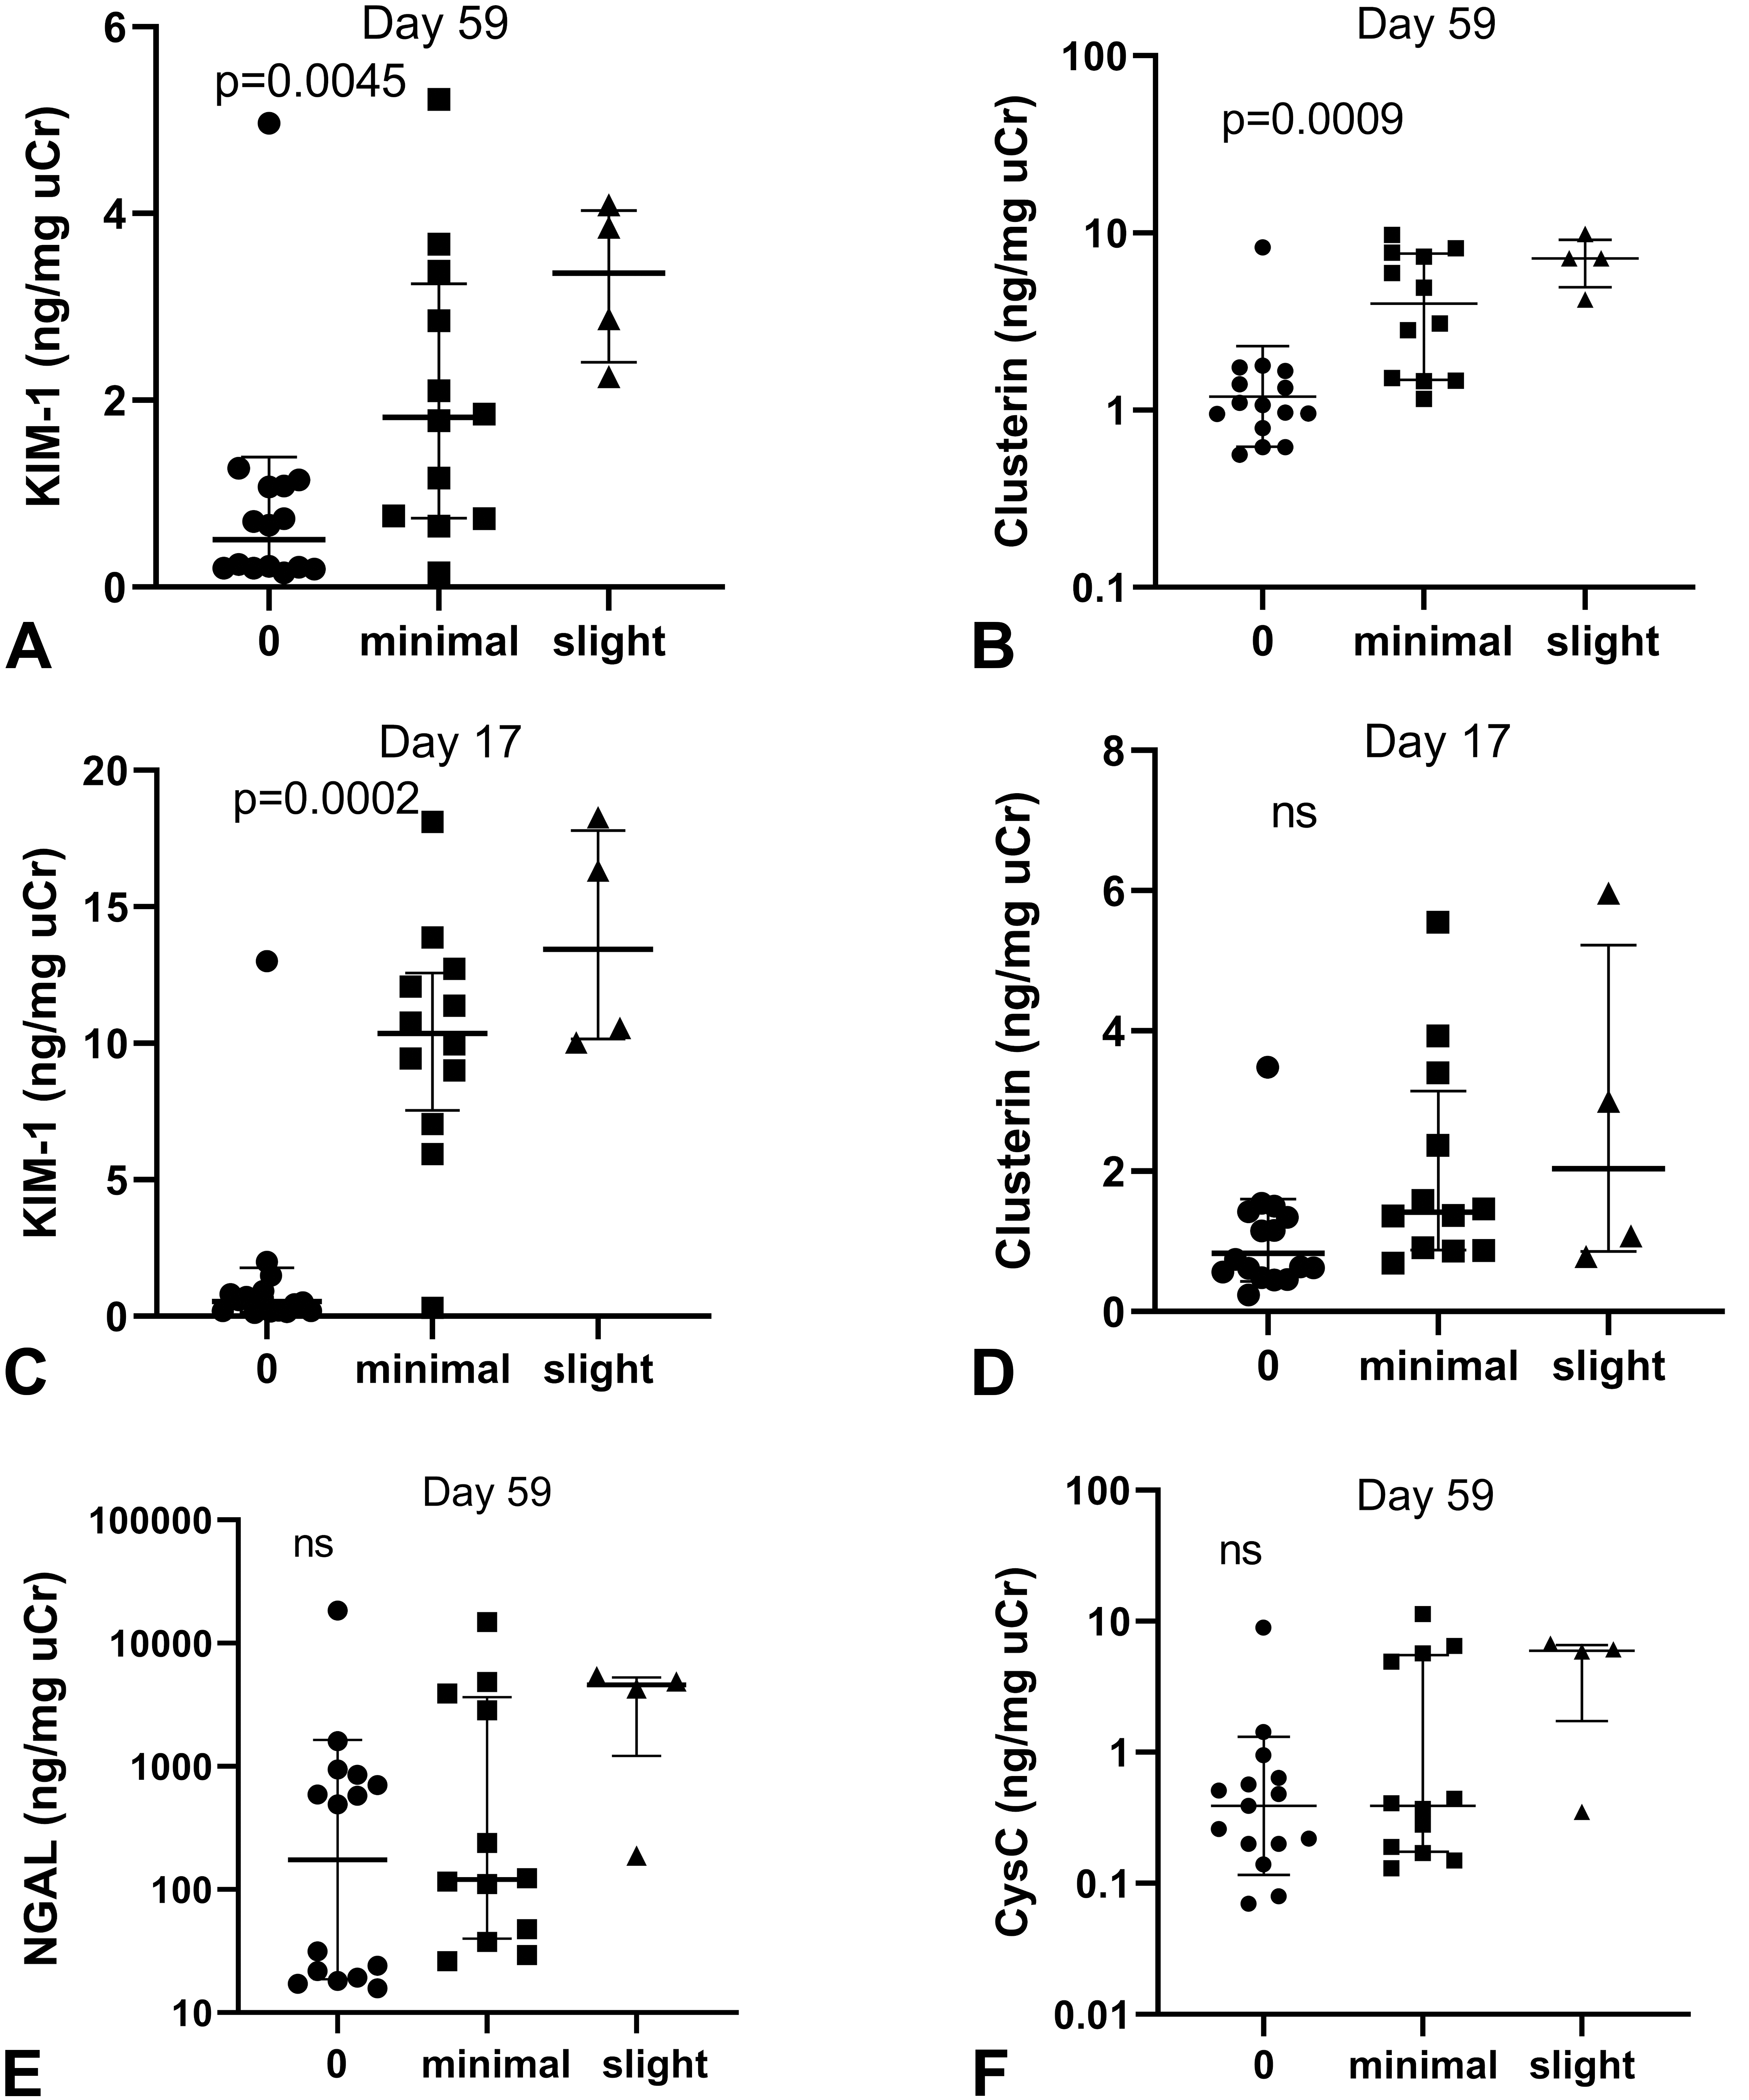
Biomarker concentration changes at day 17 and at termination were associated with the severity of tubular basophilia at termination after 8 weeks. A and B, At study termination, KIM-1 and clusterin increase significantly with increasing kidney pathology. C, Kidney toxicity at termination was preceded by peak KIM-1 levels at day 17. D, Clusterin levels at day 17 were not significantly associated with kidney pathology at termination. E and F, Both NGAL and cystatin C levels at termination were not increased with kidney pathology. KIM-1 indicates kidney injury molecule 1; NGAL, neutrophil gelatinase-associated lipocalin; CysC, cystatin C.
The association between pathology findings and urine creatinine normalized biomarker concentrations at termination after the different ASO treatments was statistically evaluated by Spearman correlation. Across the 3 ASO-treated groups, KIM-1 and clusterin concentrations were correlated with kidney pathology (r s = 0.68 and 0.78, respectively, P < .001), whereas NGAL, cystatin C, osteopontin, and NAG concentrations were not correlated with the degree of tubular basophilia.
Clinical Chemistry Analysis
Creatinine concentration in blood and urine is presented in Figure 6. No consistent changes in either blood or plasma creatinine were observed in any of the groups. Other ASO-related changes in plasma chemistry parameters were observed at both doses of the tool ASO and were generally dose dependent, with minimal changes at 10 mg/kg. These changes included minimally to markedly increased AST (at 50 mg/kg only), ALT, ALP, GLDH, bile acids, albumin (at 50 mg/kg only), and globulins and minimal to mild decreases in cholesterol and triglycerides. Plasma chemistry results are reported in Table 4.
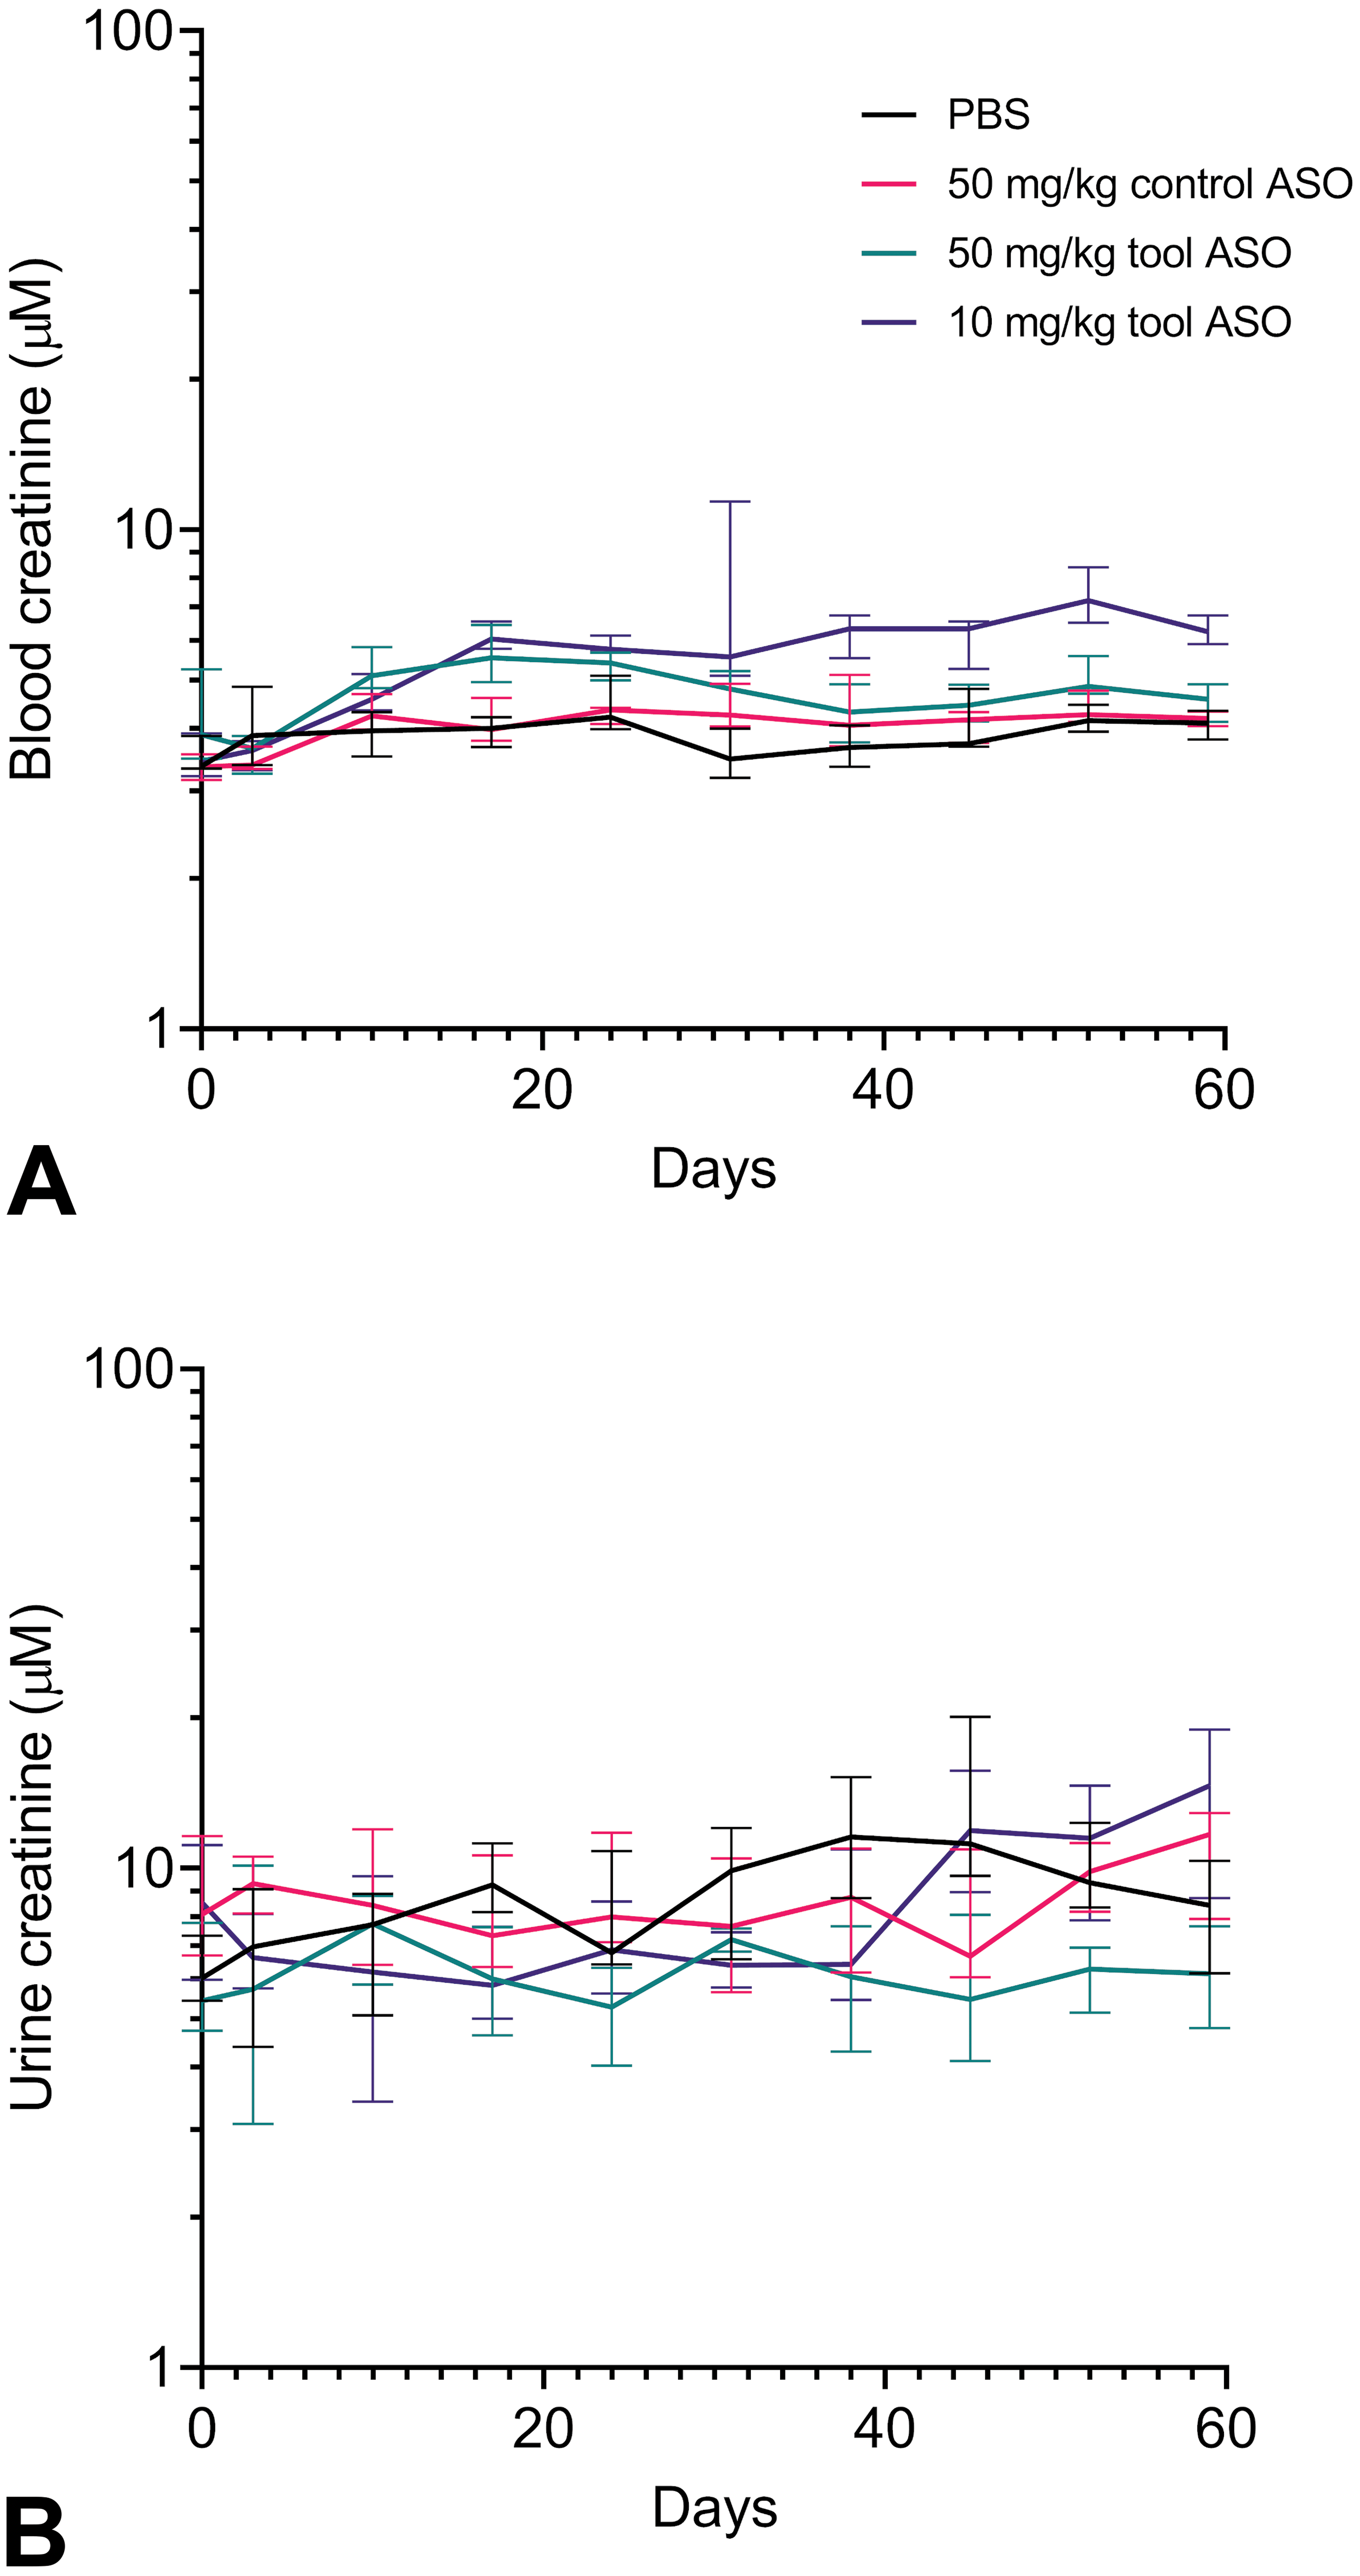
Longitudinal blood and urine creatinine concentrations across groups during 8 weeks of ASO treatment. A, Creatinine concentration in blood increased at days 10 to 24 and 52 after treatment with 50 or 10 mg/kg tool ASO. In the 10 mg/kg group, increased levels were additionally found on day 45 and at termination (day 59). B, Urine creatinine concentrations were decreased at days 38 to 52 after dosing 50 mg/kg tool ASO, whereas other treatments did not significantly affect urine creatinine concentration from vehicle levels. ASO indicates antisense oligonucleotide.
Clinical Chemistry Characteristics.
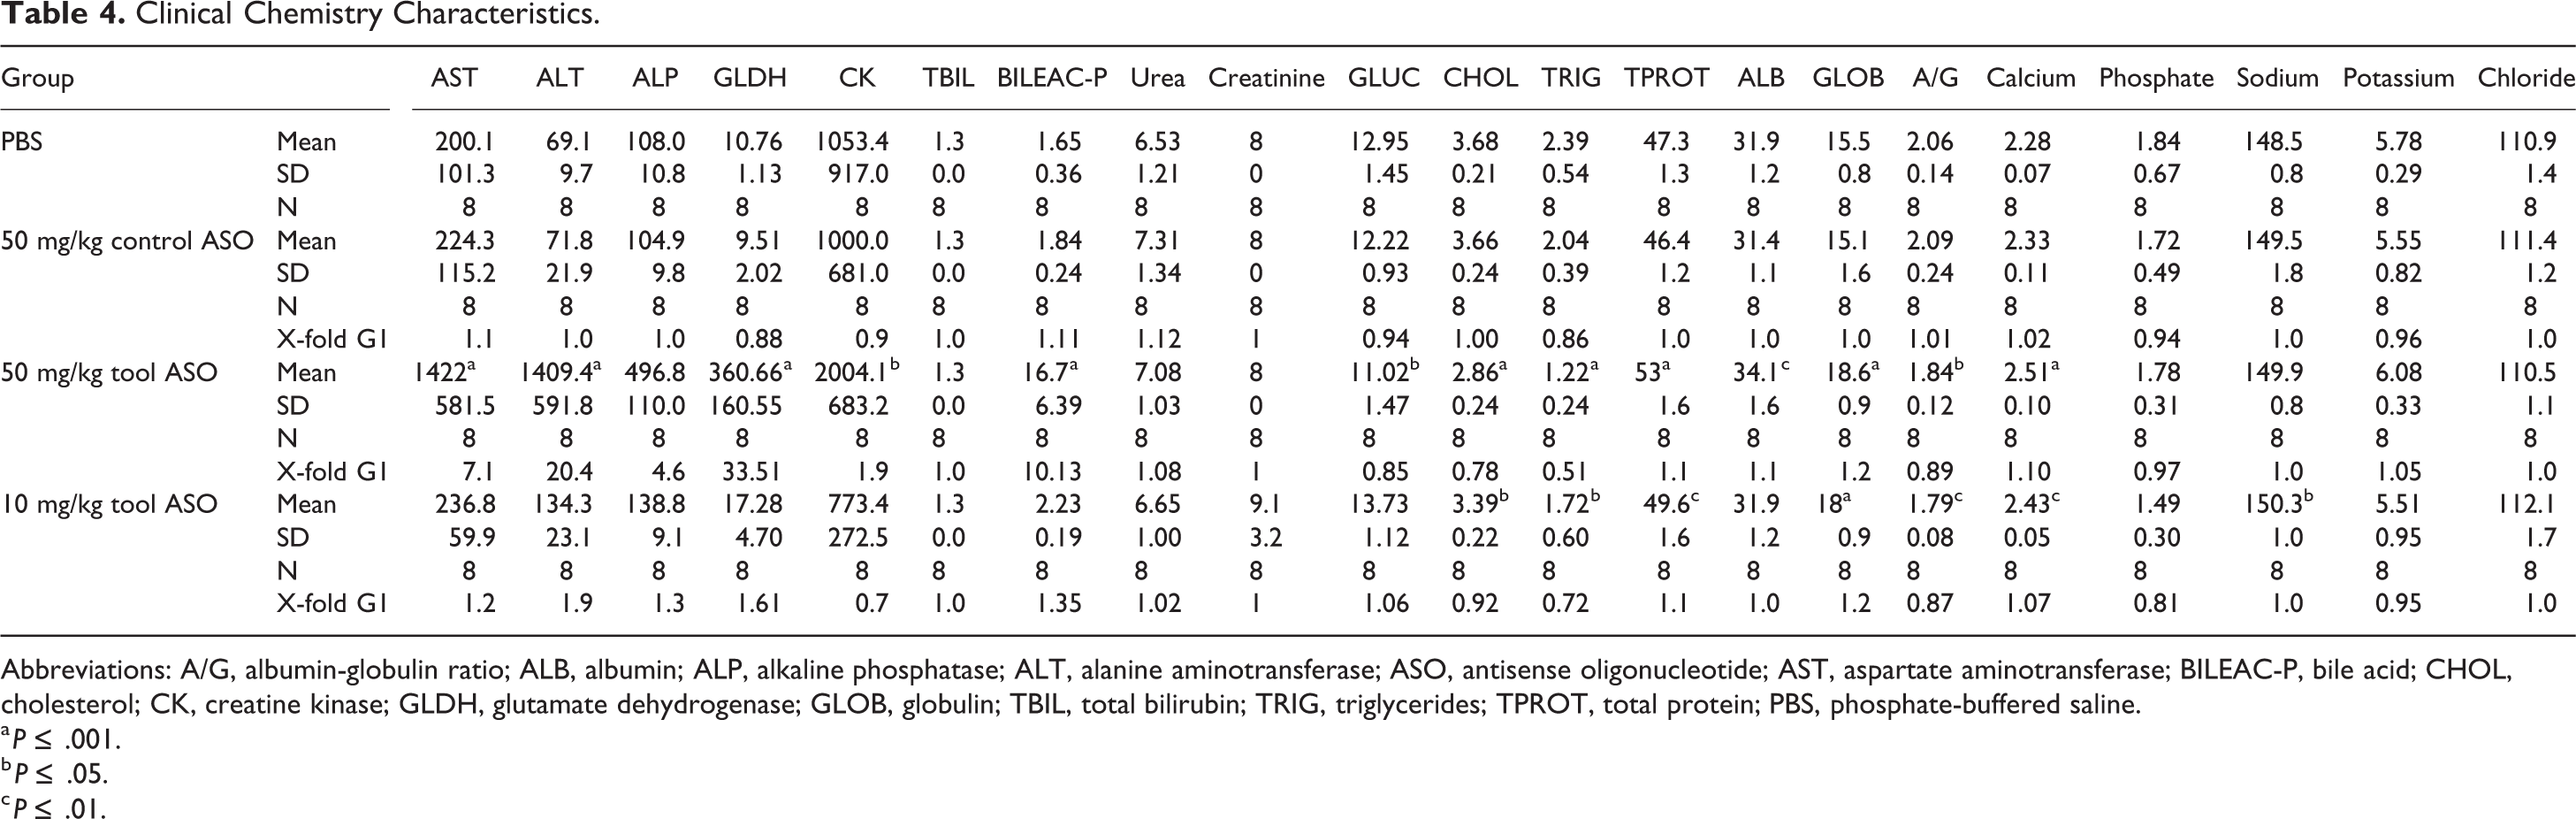
Abbreviations: A/G, albumin-globulin ratio; ALB, albumin; ALP, alkaline phosphatase; ALT, alanine aminotransferase; ASO, antisense oligonucleotide; AST, aspartate aminotransferase; BILEAC-P, bile acid; CHOL, cholesterol; CK, creatine kinase; GLDH, glutamate dehydrogenase; GLOB, globulin; TBIL, total bilirubin; TRIG, triglycerides; TPROT, total protein; PBS, phosphate-buffered saline.
a P ≤ .001.
b P ≤ .05.
c P ≤ .01.
Discussion
The recent FDA qualification of a set of kidney biomarkers for early detection of renal tubular toxicity in healthy volunteer phase 1 studies has the potential to both aid clinical trial success and improve translation from preclinical studies. The panel was validated using the small molecule nephrotoxic drug cisplatin. 6 The present study is the first, to our knowledge, to report on the full FDA biomarker panel in mouse and the first to evaluate the utility of the panel for detecting preclinical kidney toxicity induced by a tool ASO, inducing kidney toxicity. There have been cases of ASOs inducing renal toxicity in the clinic with no clear signs in the preceding preclinical toxicity studies, 30,33 highlighting the need for sensitive kidney biomarkers specifically suitable to monitor ASO-induced renal safety liabilities.
Much effort has been put into identifying urinary biomarkers with greater sensitivity and specificity for DIKI than traditional biomarkers such as serum creatinine and BUN. 3,35,38,39 Kidney injury seen in relation to ASO treatment typically affects the proximal tubules, although occasional incidents of glomerular damage have also been observed. 40-42 In the current study, kidney pathology, manifesting as minimal to slight tubular degeneration/regeneration, was detected after dosing with a toxic cEt gapmer ASO. At termination, the levels of KIM-1, clusterin, NGAL, and cystatin C were elevated in a dose-dependent manner, which was paralleled by kidney pathology. Importantly, no clear effects on blood creatinine levels were seen at any time point. The early KIM-1 increases in our study are in line with reports of similar rapid inductions seen in rodents with several nephrotoxins that are also known to target proximal tubules. 8,13,35,43,44 The expression of KIM-1 and NGAL has been shown to increase after kidney injury in proximal tubule epithelial cells, which initiate proliferation and migration to damaged areas, reflecting a regenerative response. 45-47
Unexpectedly, treatment with control ASO also induced elevations in several biomarkers, but to a lesser extent than a similar dose of the tool ASO. The levels of KIM-1 and NGAL were clearly increased above baseline already after the second injection of the control ASO. As no kidney pathology was evident at termination in the control ASO group, it is unlikely that this biomarker increase reflects AKI. The kidney cortex, specifically the proximal tubular cells, shows the highest local concentration of ASOs of this chemistry. Thus, KIM-1 and NGAL biomarker increases in the control ASO group could reflect an adaptive response to the accumulation of ASO rather than overt toxicity. Other possible explanations could be that it reflects the downstream consequences of the pharmacological knockdown of the ASO targets. However, both the control ASO and tool ASO groups were developed toward the same pharmacological target displaying equal knockdown efficiency, rendering this less likely. Furthermore, whereas KIM-1 expression is kidney-specific, injury or inflammatory induction of NGAL expression and secretion can occur in other organs, for example, from activated neutrophils and hepatocytes, and increased circulating NGAL levels could accumulate in urine. 45,48,49 Additional studies are required to further understand the observations in the control ASO group, but our results indicate that moderate elevations in some urinary safety biomarkers should be interpreted with caution in ASO studies.
Previous clinical or preclinical ASO studies reporting the use of the biomarkers included in the FDA panel are sparse and their translatability from preclinical to clinical setting requires further investigation. In phase 1 clinical trial of the LNA SPC5001, targeting PCSK9, a healthy volunteer had AKI confirmed by biopsy histology. 31 In a follow-up biomarker study, van Poelgeest et al 30 reported concurrent increases in urinary KIM-1, β2-microglobulin, and, to a lesser extent, α-GST concentration in affected patients after 4 doses of 5 mg SPC5001. In a clinical trial of Isis-388626, the 2′MOE ASO targeting SGLT2 and similar KIM-1, β2-microglobulin, and α-GST increases were reported along with AKI in 2 of 12 patients dosed with 100 mg. 32 For this ASO, it was suggested that the relatively rapid recovery of biomarker elevation after dose cessation reflects a transient tubular dysfunction rather than tubular injury. 32,37 As the aim with Isis-388626 was to target SGLT2 in proximal tubular cells, this response could also be target related. Preceding studies in mouse and monkey with the abovementioned LNA and MOE ASOs did not include specific kidney biomarkers and histopathology did not reveal renal toxicity 42 (and reported by van Poelgeest et al as unpublished GLP study reports in monkey). Regardless of kidney toxicity arising from ASO chemistry or target engagement effects, including sensitive kidney biomarkers in both early clinical and preclinical studies would provide important information. Although species-specific renal responses to ASOs have been reported, 40 translatability of ASO-induced biomarker changes across species is not well understood and remains to be further investigated. However, it should be noted that NAG was tested in these 2 clinical studies and did not show any appreciable response. 30,32
In our mouse study, the minor effects of tool ASO administration on NAG and osteopontin levels across the study suggest that these biomarkers do not accurately reflect renal toxic or adaptive responses to the ASOs as well as the other 4 biomarkers in the panel do. Whereas the tool ASO in this study induced proximal tubular changes, NAG and osteopontin are known to mainly reflect distal tubular injury, which may explain the lack of consistent change. 50,51 The NAG finding is consistent with the lack of response seen in the ASO clinical studies described above. 30,32 Osteopontin was not tested in these studies.
The FDA panel qualification was verified based on observations with a small molecule drug, but it is possible that an alternative selection of urinary biomarkers is needed to reflect the types of kidney injury that are induced by other therapeutic modalities. As an example, urinary β2-microglobulin has frequently been used for the detection of kidney toxicity induced by both ASOs and other modalities. 32,43,51 As reported in Supplemental Material, in our study, this biomarker increased in a dose-dependent manner after tool ASO administration. Further work is needed to verify if the FDA-qualified kidney biomarker panel should be complemented by additional biomarkers in future ASO safety studies. It is also important to acknowledge that the elevations in the biomarkers followed different temporal patterns. The levels of KIM-1 increase rapidly in animals dosed with tool ASO, reaching the highest levels on day 17 and gradually decreasing after this. The levels of the other biomarkers tend to increase gradually over time, being highest at termination. This must be considered when results are interpreted. Further studies are needed to see if this pattern is repeated using other ASOs with nephrotoxic properties.
The CMi pattern was similar to those seen with some individual biomarkers: marked elevation for the higher dose level of tool ASO and moderate elevation for both the lower dose of tool ASO and the control ASO. However, the use of the CM alone to interpret the biomarker data would mean losing the granularity of individual biomarker patterns, which is important, especially when biomarker changes are seen in the absence of pathological findings and alternative explanations are sought. Although the CM may become useful in the future as a translational bridge between preclinical pathology findings and renal safety monitoring in clinical studies, it is not qualified for preclinical studies. More research with various tools and control compounds is needed to further evaluate its utility.
There are some limitations to this study. The tool ASO did cause not only kidney pathology but also liver pathology, suggesting that the injury mechanism could be due to general cytotoxicity rather than specific nephrotoxicity. However, experience from ASO screening studies and emerging mechanistic data indicate that sequence-dependent toxicity in the high exposure organs such as the liver and kidney could be caused by similar mechanisms. 52 Further studies including additional ASOs are needed to elucidate this. Other possible study limitations are that ASO tissue concentrations were not assessed and that pathology readout was only available at termination. Future studies should include intermediate pathology end points to evaluate the predictive ability of the biomarkers. Still, it is encouraging that even the lowest degrees of kidney pathology at termination were reflected in elevations of KIM-1 and clusterin, suggesting the potential superiority of these biomarkers in the context of ASO-related nephrotoxicity.
In conclusion, the current study indicates that there is value in using the FDA-qualified kidney biomarker panel for the detection of ASO-induced kidney toxicity in mice. However, as we detected biomarker elevations without signs of kidney pathology using a control ASO, further work is needed to elucidate the impact of this observation on the interpretation of biomarker elevations in clinical ASO studies.
Supplemental Material
Supplemental Material, sj-docx-1-tpx-10.1177_0192623320964391 - Urinary Kidney Biomarker Panel Detects Preclinical Antisense Oligonucleotide-Induced Tubular Toxicity
Supplemental Material, sj-docx-1-tpx-10.1177_0192623320964391 for Urinary Kidney Biomarker Panel Detects Preclinical Antisense Oligonucleotide-Induced Tubular Toxicity by Åsa Sandelius, Jayati Basak, Mikko Hölttä, Stefan Sultana, Gina Hyberg, Amanda Wilson, Patrik Andersson and Magnus Söderberg in Toxicologic Pathology
Supplemental Material
Supplemental Material, sj-docx-2-tpx-10.1177_0192623320964391 - Urinary Kidney Biomarker Panel Detects Preclinical Antisense Oligonucleotide-Induced Tubular Toxicity
Supplemental Material, sj-docx-2-tpx-10.1177_0192623320964391 for Urinary Kidney Biomarker Panel Detects Preclinical Antisense Oligonucleotide-Induced Tubular Toxicity by Åsa Sandelius, Jayati Basak, Mikko Hölttä, Stefan Sultana, Gina Hyberg, Amanda Wilson, Patrik Andersson and Magnus Söderberg in Toxicologic Pathology
Supplemental Material
Supplemental Material, sj-tif-1-tpx-10.1177_0192623320964391 - Urinary Kidney Biomarker Panel Detects Preclinical Antisense Oligonucleotide-Induced Tubular Toxicity
Supplemental Material, sj-tif-1-tpx-10.1177_0192623320964391 for Urinary Kidney Biomarker Panel Detects Preclinical Antisense Oligonucleotide-Induced Tubular Toxicity by Åsa Sandelius, Jayati Basak, Mikko Hölttä, Stefan Sultana, Gina Hyberg, Amanda Wilson, Patrik Andersson and Magnus Söderberg in Toxicologic Pathology
Footnotes
Authors’ Note
Patrik Andersson and Magnus Söderberg contributed equally to this study.
Acknowledgments
The authors thank Marcella Sini for expert histopathology support; Lars Löfgren for expert mass spectrometry support and blood creatinine analysis; and Ionis Pharmaceuticals for providing tool and control ASO compounds. The authors also thank Scott Henry and Sebastien Burel from Ionis Pharmaceuticals for valuable manuscript review and comments.
Declaration of Conflicting Interests
ÅS, JB, MH, SS, GH, AW, PA and MS are all employees and shareholders of AstraZeneca and declare that this did not influence the study design, analysis or interpretations and they have no other conflicts of interest with respect to the research, authorship and/or publication of this article.
Funding
The author(s) received no external financial support for the research, authorship, and/or publication of this article.
Supplemental Material
Supplemental material for this article is available online.
References
Supplementary Material
Please find the following supplemental material available below.
For Open Access articles published under a Creative Commons License, all supplemental material carries the same license as the article it is associated with.
For non-Open Access articles published, all supplemental material carries a non-exclusive license, and permission requests for re-use of supplemental material or any part of supplemental material shall be sent directly to the copyright owner as specified in the copyright notice associated with the article.