
Abstract
Quantitative assessment of proliferation can be an important endpoint in toxicologic pathology. Traditionally, cell proliferation is quantified by labor-intensive manual counting of positive and negative cells after immunohistochemical staining for proliferation markers (eg, Ki67, bromo-2′-deoxyuridine, or proliferating cell nuclear antigen). Currently, there is a lot of interest in replacing manual evaluation of histology end points with image analysis tools based on artificial intelligence. The aim of the present study was to explore if a commercially available image analysis software can be used to quantify epithelial proliferative activity in rat mammary gland and minipig oviduct. First, algorithms based on artificial intelligence were trained to detect epithelium in each tissue. Areas of BrdU- or Ki67-positive nuclei and negative nuclei were subsequently quantified with threshold analysis. Artificial intelligence-based and manually counted labelling indices were strongly correlated and equally well detected the estrous cycle influence on proliferation in mammary gland and oviduct epithelium, as well as the dramatically increased proliferation in rat mammary glands after treatment with estradiol and progesterone. In conclusion, quantification of epithelial proliferation in two reproductive tissues can be achieved in a reliable fashion using image analysis software based on artificial intelligence, thus avoiding time- and labor-intensive manual counting, requiring trained operators.
Introduction
Increased cell proliferation can be a normal physiological response but can also be a preneoplastic or neoplastic alteration. Increased cell proliferation has been suggested as a possible marker for nongenotoxic carcinogenic compounds. 1 It has previously been described that glucagon-like peptide-1 receptor agonists led to hyperplasia of thyroid C-cells in mice and rats, 2 and during nonclinical development of insulin analogues, it is recommended to assess proliferation of epithelial cells in the rat mammary gland, because suprapharmacological doses of the insulin analogue B10Asp/X10 increased the incidence of mammary tumors in rats. 3,4 Quantitative assessment of cell proliferation can therefore be an important endpoint in toxicologic pathology. Cell proliferation is traditionally quantified by manual counting of positive and negative cells after immunohistochemical (IHC) staining for a proliferation marker, such as Ki67, 5-bromo-2′ -deoxyuridine (BrdU), or proliferating cell nuclear antigen. These counts are subsequently used for calculation of the labelling index (LI), that is, the fraction of cells which are positive for the applied proliferation marker. There are different approaches for counting of cells in a tissue. It was previously described that it is sufficient to count 100 to 200 events in 100 to 200 fields of vision, selected by systematic, random sampling through the tissue sample. 5 Another recommendation is that it is necessary to count at least 1000 cells in total (sum of positive and negative cells) to obtain a valid estimate of the LI in a given tissue section. 6 Both counting approaches are very time-consuming.
There is interest in replacing manual evaluation of histology end points, such as counting of proliferating cells, with digital image analysis (DIA) based on artificial intelligence (AI). 7 In the field of human medical pathology, multiple recent studies used DIA and AI to quantify cell proliferation in various types of tumors. 8 -13 Replacement of manual counting with DIA saves resources, variation between different operators is reduced, and it has also been reported that DIA outperforms manual assessment of tumor proliferation in terms of accuracy and prognostic predictive value. 11 In the field of toxicologic pathology there are only few studies where cell proliferation in animal tissues has been quantified with DIA and compared to manual counting, 14,15 and a recent study with rat mammary gland utilized user-developed software. 14 Such tools can be shared in the scientific community, but it might not be easy to adapt such software to a different type of analysis, and often high-level programming skills are required for users to be able to work with such systems. There are also multiple commercially available software packages available for DIA, some of which include analysis modules based on AI. These software packages require no programming skills from the user and are therefore attractive to use in digital toxicologic pathology.
The aim of the present study was to explore if a commercially available software solution based on AI can be used to quantify cell proliferation in rat mammary gland and minipig oviduct tissue. These two cases were chosen, because proliferation in these tissues previously has been quantified by IHC staining of BrdU or Ki67 during nonclinical development of novel drug candidates 16,17 (additionally, unpublished data from Novo Nordisk A/S). Furthermore, in both these tissues it was relevant to assess specifically the epithelial proliferation. It was therefore chosen to use DIA based on AI, because AI would allow for automized distinction between the epithelial and nonepithelial tissue compartments. The AI-based quantifications of proliferation were thereafter validated by comparison to results from manual counting of positive and negative cells, and by calculation of the correlation between AI-based and manually assessed epithelial proliferation.
Materials and Methods
Animals
Thirty-one outbred female Sprague-Dawley rats (NTac: SD, Taconic) were included in the study. The rats were housed 2 to 5 animals per cage. The animal room environment was maintained at 18 °C to 24 °C, 30% to 70% relative humidity, air change 8 to 15 times/h, and a light/dark cycle of 12/12 hours. The animals had unrestricted access to a complete pelleted rodent diet (Altromin 1324, Brogården) and tap water (nonchlorinated, nonacidified). The experimental procedures were performed under a license granted by the Danish Animal Experiment Inspectorate. The rats were divided into 6 groups, and all test compounds were administered by subcutaneous injection in the neck skin. Details of the groups and treatments are given in Table 1. Group 1 and 4 were control groups and were treated once daily with a vehicle. Group 2 and 5 were treated once daily with 600 nmol/kg of native human insulin. Group 3 and 6 were treated with a combination of estradiol-17β (1,3,5-Estratriene-3,17β-diol; Sigma-Aldrich) 20 μg/d and progesterone (4-pregnen-3,20-dione) 4 mg/day (E&P). Rats in group 1 to 3 were treated for 5 days and rats in group 4 to 6 were treated for 19 days. On the last day of treatment, all rats were dosed intraperitoneally with 50 mg/kg BrdU (Sigma-Aldrich), dissolved at 5 mg/mL in sterile 0.9% NaCl solution (Sigma-Aldrich), 6 and 3 hours before euthanasia. The rats were anaesthetized with isoflurane inhalation and euthanized by exsanguination. Ovaries, uterus, vagina, and the third and sixth mammary gland from the right side were collected and fixed in 10% neutral buffered formalin (VWR International AB) for 24 to 48 hours. All organs were trimmed, processed, and embedded in paraffin as described previously. 18
Details of Rats.
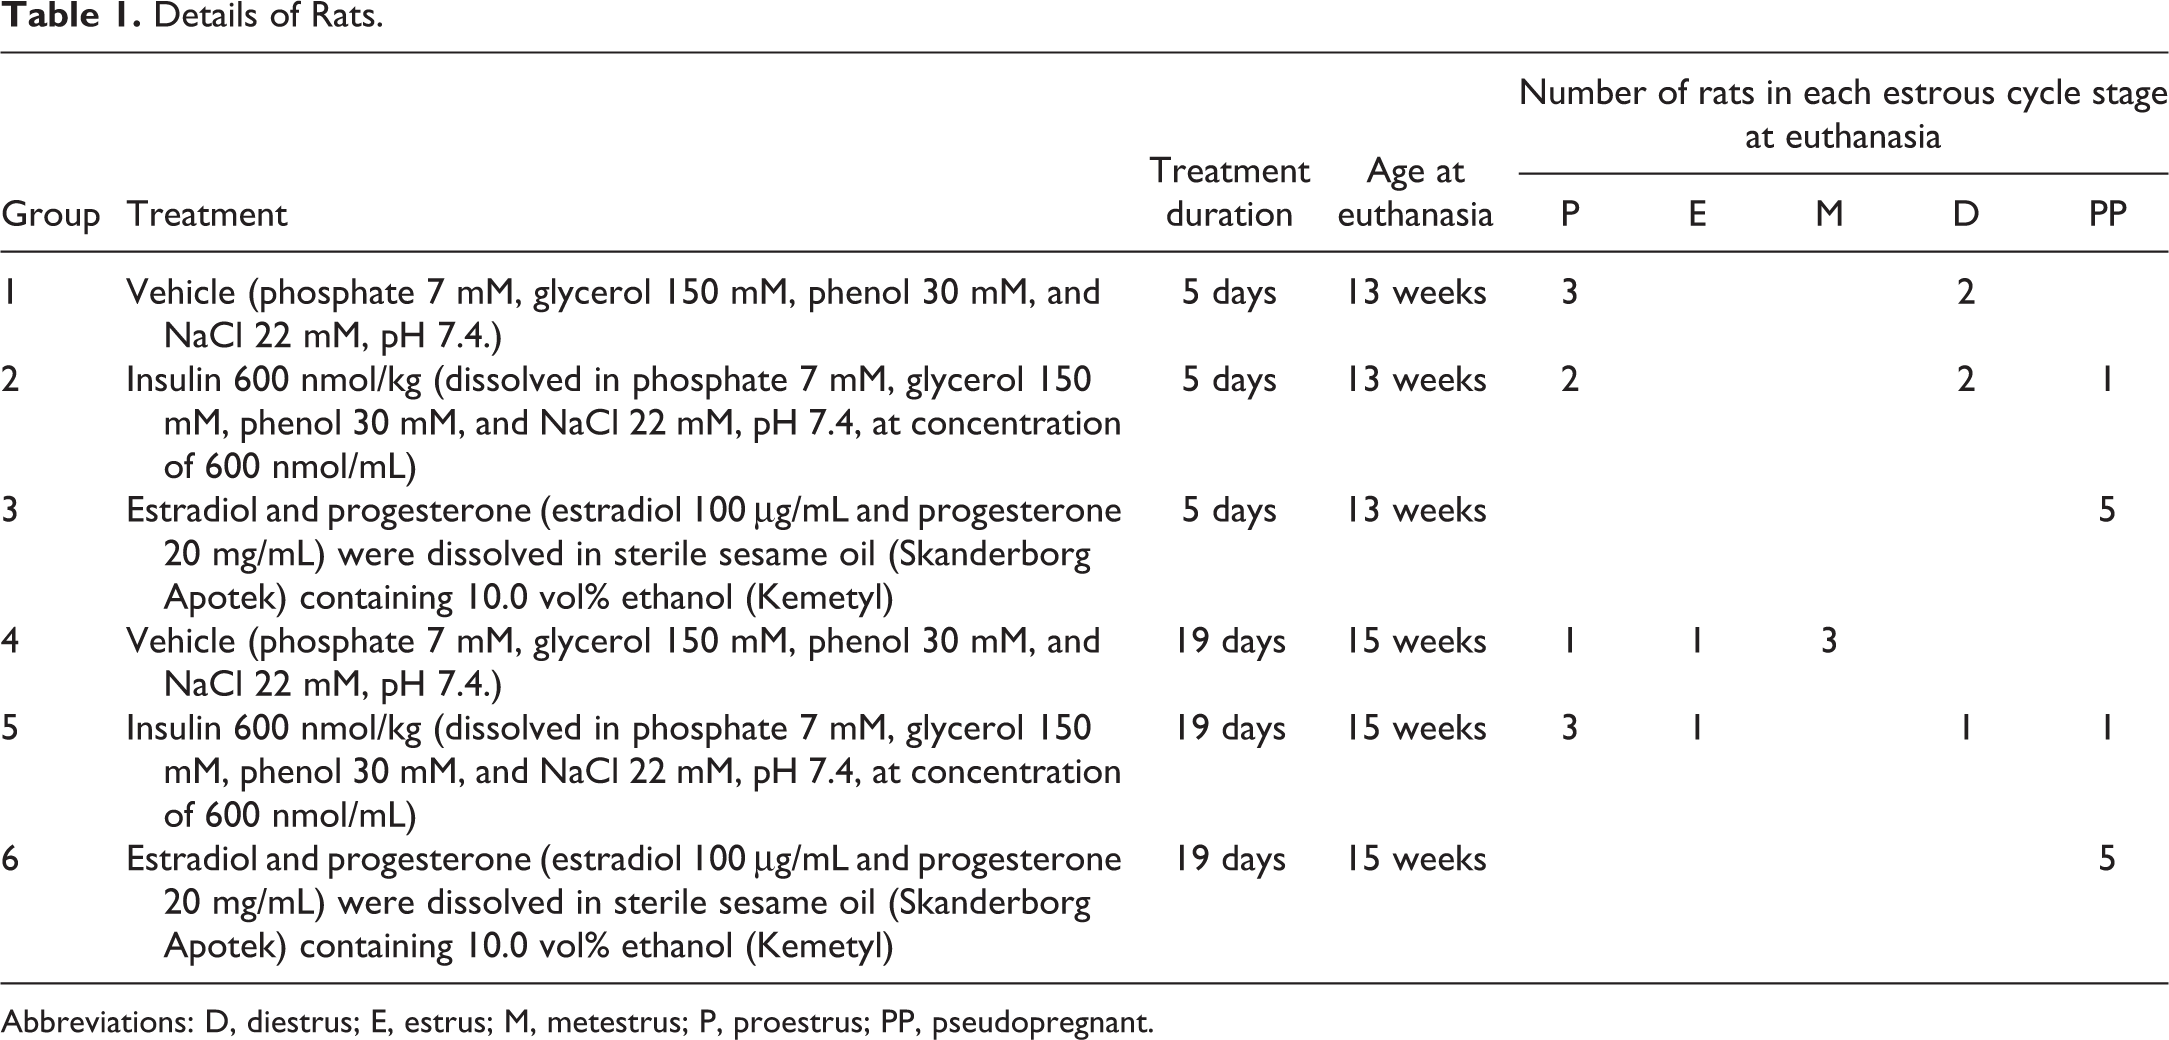
Abbreviations: D, diestrus; E, estrus; M, metestrus; P, proestrus; PP, pseudopregnant.
Formalin-fixed and paraffin-embedded samples of the ovaries, oviducts, uterus, and vagina from 18 female Göttingen minipigs (Ellegaard Göttingen Minipigs), which had been included in 4 different previous toxicity studies, were retrieved from the archives. These minipigs were vehicle-treated control animals or vehicle-treated recovery control animals and were 6 to 13 months old at the time of euthanasia and collection of tissue samples. Details of the minipigs are described in Table 2. In all studies, the minipigs had been fed a complete pelleted minipig diet (SMP(E) SQC, Special Diets Services) and had unrestricted access to tap water (nonacidified, nonchlorinated). The minipigs were group-housed in floor-pens at 21 °C ± 3 °C, air change 15 times/h, and a light/dark cycle of 12/12 hours. In all experiments, the minipigs were euthanized by exsanguination while under deep anaesthesia (mixture of zolazepam, tiletamine, ketamine, xylazin, and butorphanol). Organs had been fixed in 10% neutral buffered formalin (VWR International AB) for 48 to 72 hours and subsequently embedded in paraffin.
Details of the Göttingen Minipigs.
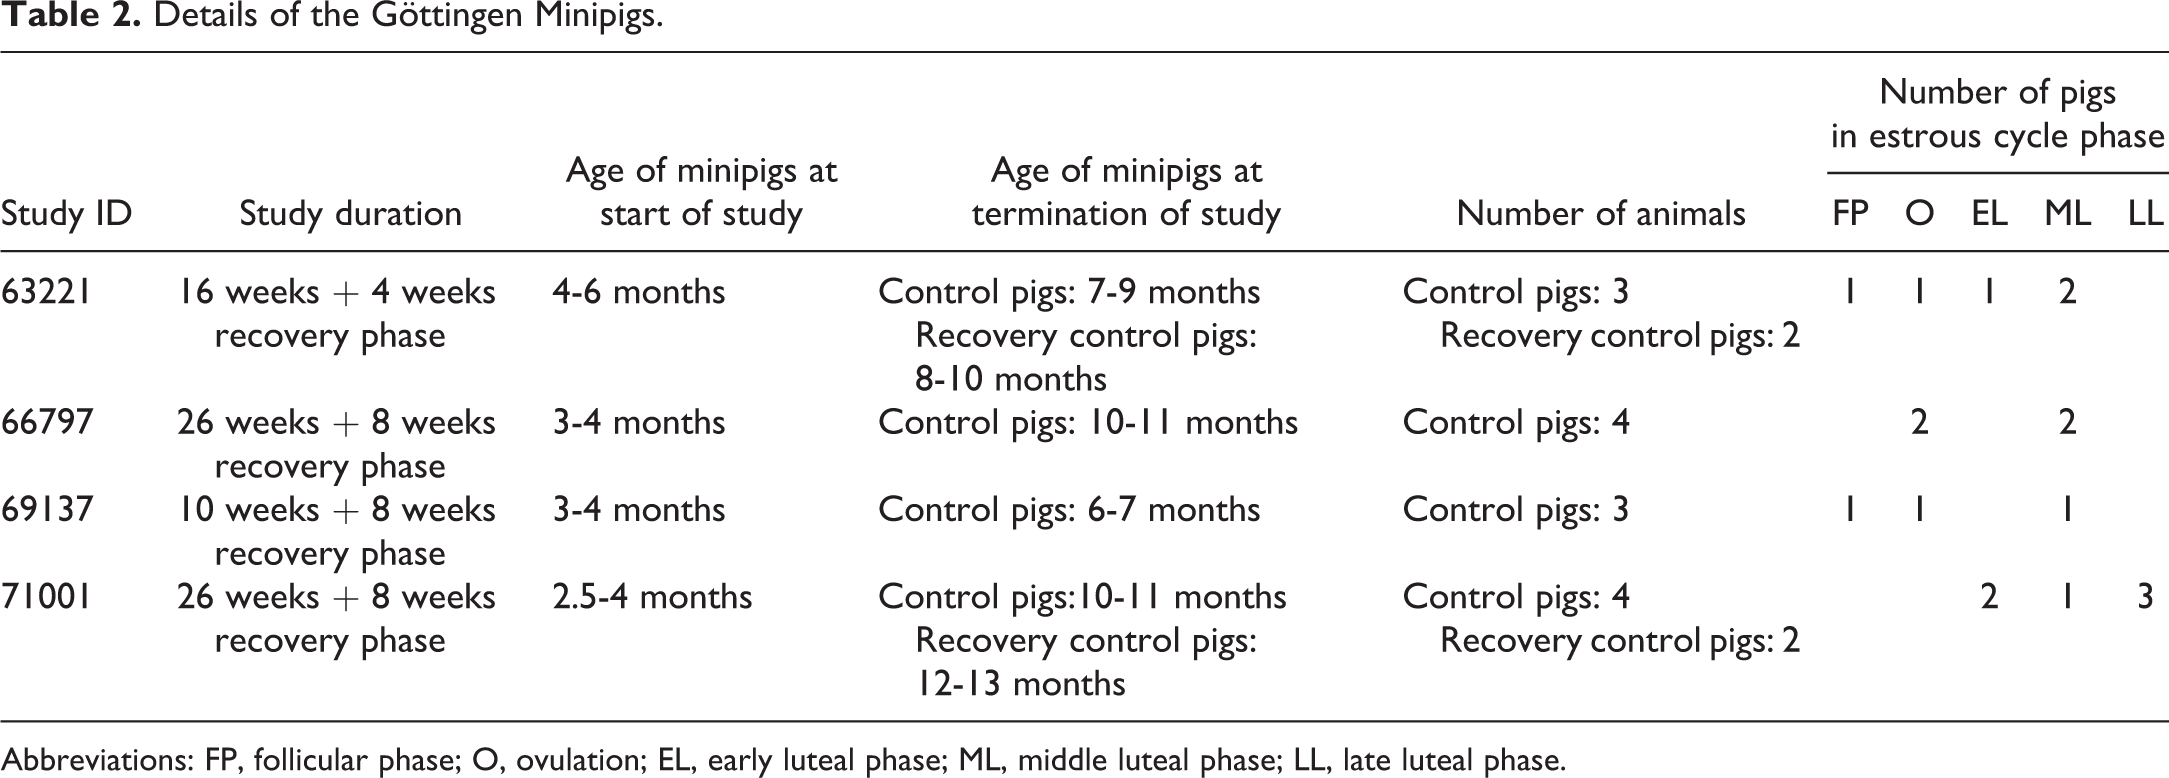
Abbreviations: FP, follicular phase; O, ovulation; EL, early luteal phase; ML, middle luteal phase; LL, late luteal phase.
Histology and Estrous Cycle Staging
Sections of rat ovaries, uterus, and vagina of 3-µm thickness were cut and stained with hematoxylin and eosin (HE, both from Sigma-Aldrich) and used for staging of the rats in the four phases of the estrous cycle: proestrus, estrus, metestrus, and diestrus, as described previously. 19 From the mammary gland samples, horizontal sections of 3 µm thickness were prepared as described previously, 18 and stained with HE for inspection of the mammary gland morphology. From minipig ovaries, oviduct, uterus, and vagina, sections of 3-µm thickness were cut and stained with HE or periodic acid (Merck) and Schiff’s reagent (Merck) and subsequently used for staging in relation to the estrous cycle of the minipigs as described in a previous study, where the phases in the minipig estrous cycle were defined as follicular phase, ovulation, early-, mid-, and late luteal phase. 20
Immunohistochemistry for BrdU and Ki67
Immunohistochemical staining for BrdU in horizontal sections of the rat mammary glands were done as described previously, 21 with a mouse monoclonal anti-BrdU antibody (clone Bu20a, Dako) as the primary antibody. Immunohistochemical staining for Ki67 in sections of minipig oviduct was done on a Ventana Discovery Ultra platform (Roche). Sections were heated at 60 °C for 32 minutes prior to heat-induced epitope retrieval, performed in Cell Conditioning Solution (Roche) with pH 8.4, at 95 °C for 64 minutes. Endogenous peroxidase activity was quenched with application of Discovery inhibitor (Roche) for 8 minutes. The slides were then rinsed in Reaction buffer (Roche) (this buffer was used at all rinsing steps unless otherwise stated) and unspecific binding of the primary antibody was blocked with incubation in TNB blocking buffer (Roche) for 20 minutes. A monoclonal rabbit anti-Ki67 antibody (clone SP6, Novus Biologicals) was used as primary antibody. This was diluted 1:200 (the supplier does not state the concentration of the antibody) in Antibody diluent (Roche) and applied to the slides for 60 minutes at 37 °C. Brightvision horse radish peroxidase-labelled anti-rabbit polymer (VWR International) was used for detection and applied to the slides for 20 minutes, followed by application of purple chromogen (Roche) for 32 minutes. The slides were finally counterstained by manual dipping the slides twice in hematoxylin (Sigma-Aldrich), rinsed in tap water, dehydrated, and finally cover glasses were mounted with Pertex (Sigma-Aldrich). Sections of minipig intestine were included as positive control. Negative controls included omission of the primary antibody and replacement of the primary antibody with a monoclonal rabbit IgG isotype control (BioNordika Denmark A/S).
Scanning of Mammary Gland and Oviduct Sections
A digital whole-slide image (WSI) of each rat mammary gland and minipig oviduct section was generated by scanning the sections on a NanoZoomer 2.0HT digital slide scanner (Hamamatsu) according to the manufacturers’ instructions.
Manual Counting of Proliferating Cells for Calculation of Labelling Indices
In the mammary gland sections, BrdU-positive (BrdU+) epithelial cells and negative epithelial cells were counted as described previously. 18 In brief, approximately 200 fields of vision were identified by systematic random sampling using the stereology module in VIS (Visiopharm). Bromo-2′ -deoxyuridine+ epithelial cells were counted in a primary counting frame (CF) and negative epithelial cells were counted in a secondary CF superimposed on each field of vision. Based on initial test counts (data not shown), the area of the secondary CF was set to 5% of the primary CF, because there generally were many more negative cells than BrdU+ cells. In rats treated with E&P, there was pronounced hyperplasia of the mammary gland epithelium (see Figure 1), and in these rats approximately 90 fields of vision were sampled, and the area of secondary CF was 30% of the primary CF. The counts of BrdU+ and negative cells were adjusted for the different areas of the CFs and used for calculation of the BrdU+ LI in percent of the total number of mammary epithelial cells. Three sections with low, medium, or high BrdU-labelling, respectively, were each counted 5 times to validate the reproducibility of the counting method.
In the minipig oviduct sections, a similar approach was used, however, since minipig oviduct sections contained relatively more epithelium, it was enough to sample approximately 100 fields of vision in each section and the area of the secondary CF was 3.5% of the primary CF. Three oviduct sections with a low, medium, or high level of Ki67+ epithelial cells, respectively, were each counted 3 times, to test the reproducibility of the counting method. For all oviduct and mammary gland sections, stage of the estrous cycle and/or type of treatment was blinded for the person who performed the counting.
Quantification of Proliferating Cells With HALO AI Image Analysis Software
Whole-slide images of rat mammary gland and minipig oviduct sections were analyzed with HALO AI 3.0 (Indica Labs). First, classifying AI-based algorithms for segmentation of the tissue into categories were trained. A DenseNet classifying algorithm was trained for classification of the mammary gland tissue in the 3 categories of adipose tissue, connective tissue, and epithelium. This was done by manually drawing annotations in each category in 11 mammary gland sections in total, representing 11 different rats. These 11 rats were randomly selected in stratified groups, to represent all estrous cycle stages and treatment groups. The algorithm performance was checked by visual inspection several times during the training procedure, and misclassification of tissue was corrected by manually adding correct annotations in the misclassified areas followed by retraining of the algorithm. In total, 1722 annotations were made, and these annotations covered on average <1.3% of the area of each tissue category in the annotated slides (Table 3). A VGG classifying algorithm was trained for classification of the minipig oviduct tissue in the categories of background (ie, clear glass), connective tissue, epithelium, and apical epithelial cytoplasm, by manually making annotations of each category in 11 oviduct sections from 6 different minipigs, selected randomly from groups representing each stage of the estrous cycle. The algorithm was trained, visually inspected with respect to classification performance and retrained with additional annotations as described above. In total 965 annotations were made, and these covered on average <0.8% of the area of each tissue category in the sections used for training (Table 3). The apical epithelial cytoplasm was defined as a category, because initial analyses showed that the apical ciliated cell membranes and blebs from the apical cell membranes frequently were mistaken for intact negative epithelial nuclei. Therefore, this area with apical cell membranes and cytoplasm without nuclei was identified and excluded from the epithelium.
Algorithms Used for Segmentation of Rat Mammary Gland and Minipig Oviduct Tissue.
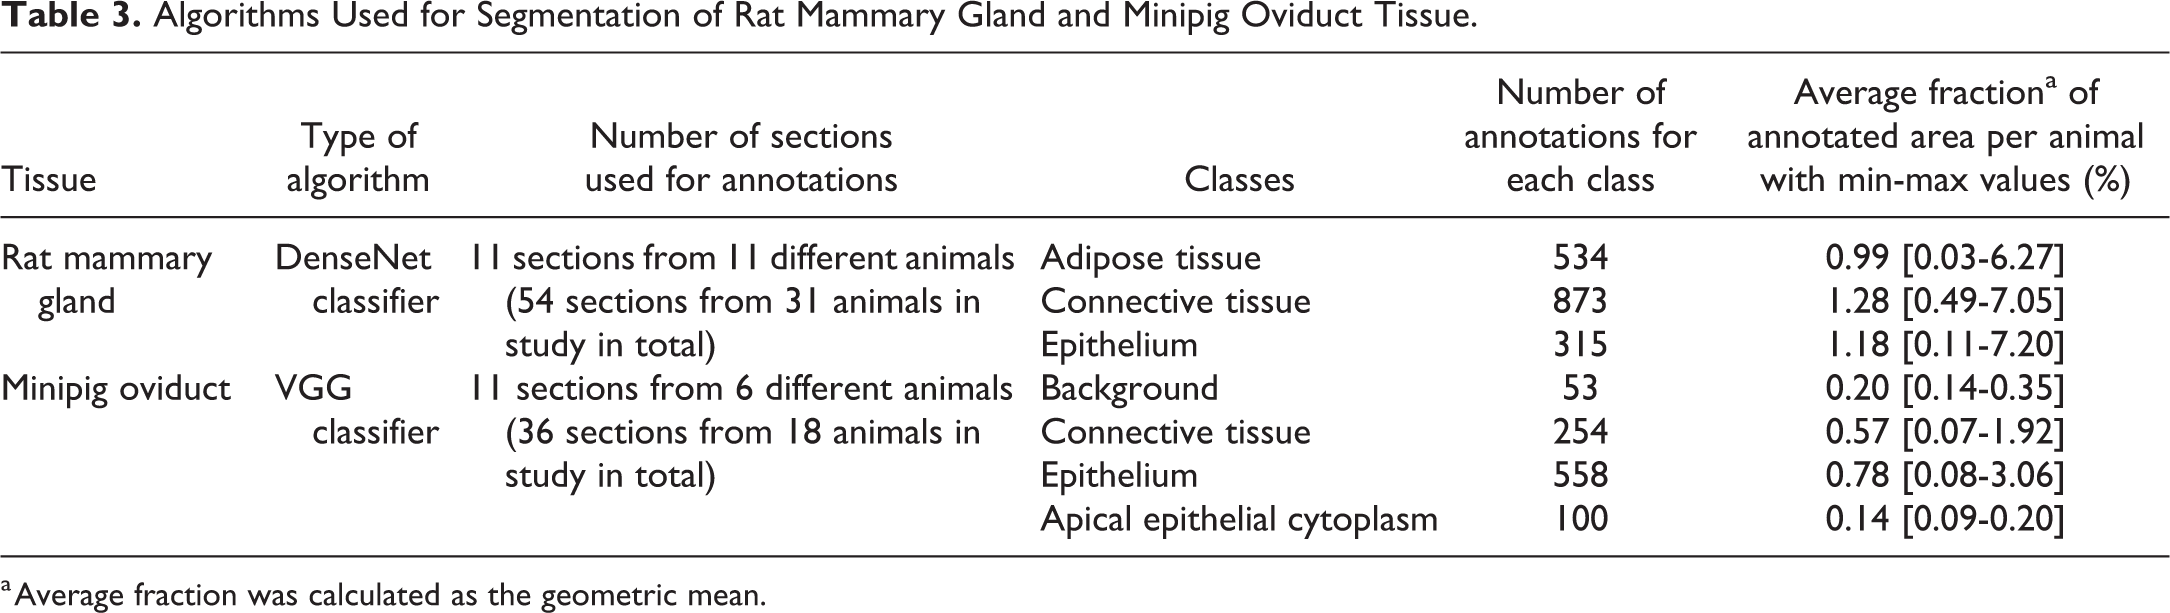
a Average fraction was calculated as the geometric mean.
The reason for use of different types of classifying algorithms in rat mammary gland and minipig oviduct (DenseNet vs VGG classifier) was that at the time of analysis of each tissue, the most advanced AI-algorithm available in HALO AI was used. There were no practical differences between the two types of algorithms with respect to how they were used in HALO AI or trained by the user, and both types of algorithms performed well, see further below. Both types of algorithms are available in the current version of HALO AI. Detailed comparison of different types of algorithms was beyond the scope of this study.
The trained AI-based classifying algorithms were then used for analysis of all tissue sections. In each mammary gland section, regions of interest (ROIs) were manually drawn around all area containing mammary fat pad and the classifying algorithm was used to classify the tissue. Subsequently, the nuclear areas of BrdU+ cells and negative cell were quantified with the threshold-based analysis module Area quantification_v1.0 within HALO (Indica labs), specifically within the areas classified as epithelium by the algorithm. This was done by setting a threshold for the definition of positive BrdU-staining (brown) and negative nuclear counterstaining (hematoxylin, light blue). In the minipig oviduct sections, ROIs were drawn around each entire oviduct cross-section, and the trained algorithm was then used to classify the tissue. Subsequently, the nuclear areas of Ki67+cells and negative cells were quantified in the area classified as epithelium in the minipig oviduct sections with the threshold-based Area quantification_v1.0 analysis module. The same thresholds for definition of BrdU- or Ki67-staining were used across all mammary gland or oviduct sections. However, there were subtle differences in the intensity of the nuclear hematoxylin counterstaining between sections, and visual inspection of analyzed images revealed it was therefore necessary to adjust the threshold for identification of negative nuclear staining between sections and repeat the analysis. If a WSI contained few areas with folded tissue or staining artefacts, these were manually excluded from the ROIs. Four out of 58 mammary gland sections contained multiple staining artefacts (dark fiber-like structures were scattered all over the sections) and were excluded from the study. For all sections, type of treatment and/or stage of the estrous cycle was blinded for the person who performed the DIA. Finally, the BrdU+ or Ki67+ area fraction (AF) in (a) percent of the total nuclear area (ie, the sum of the proliferation marker-positive and -negative nuclear areas) or (b) in percent of the area classified as epithelium were calculated for each section. That is, in the minipig oviduct, the area classified as epithelium did not include the area classified as apical epithelial cytoplasm (as shown in Figure 4).
Statistical Analysis and Assessment of Agreement Between Manual Counting and AI-Assisted Image Analysis
Statistical analysis was done with JMP version 14 (SAS Institute) and GraphPad Prism 8 (GraphPad Software). In the rat mammary gland data set (data from 54 sections, representing 31 different rats), each endpoint (ie, BrdU+ LI, BrdU+ AF of epithelial nuclei, and BrdU+ AF of epithelium) was analyzed in a mixed linear model with stage of the estrous cycle and gland number as fixed effects and animal ID as a random effect. Results from F-tests of each fixed effect are shown in Supplementary Table 1. In the oviduct data set, the endpoint Ki67+ LI (data from 18 sections from 18 different pigs) was analyzed in linear model with stage of the estrous cycle and presence of oviductal squamous metaplasia as fixed effects. The endpoints Ki67+ AF of epithelial nuclei (data from 36 sections from 18 different pigs) and Ki67+ AF of epithelium (data from 36 sections from 18 different pigs) were analyzed in mixed models with stage of the estrous cycle, oviduct section, and presence of squamous metaplasia as fixed effects and animal ID as a random effect. Results from F-tests of fixed effect in all analyses are shown in Supplementary Table 2. All data were transformed with the natural logarithm (ln) to fulfil the assumptions of normal distribution and variance homogeneity. In each analysis, ln-scale differences between all groups were estimated in pairwise t-test with Tukeys adjustment for multiple comparisons, and these differences were back-transformed to have the differences expressed as ratios (ie, fold-differences). To assess the agreement between BrdU+/Ki67+ LIs generated by manual counting and BrdU+/Ki67+ AFs generated by DIA, Pearson correlation coefficients were calculated between pairwise combinations of end points (ln-transformed). This was done on data sets that contained observations from all tissue sections and data sets where observations from tissue sections used for training of algorithms were excluded. Furthermore, for each section the difference between two endpoints was plotted against the average of the two endpoints on Bland-Altman plots (ln-scale) and the average bias was calculated and back-transformed to obtain ratios. Finally, the magnitude of fold-differences identified between groups were compared between the manually counted LIs and the endpoints generated by DIA.
Results
Treatment With Estradiol and Progesterone Dramatically Increased Mammary Gland Proliferation
Two out of 31 rats were found to be spontaneously pseudopregnant (PP), with multiple large corpora lutea in the ovaries, folding of the uterine luminal epithelium and formation of a layer of mucoid cells in the vaginal epithelium, as described previously. 19,21 The histological appearance of uterus and vagina in rats treated with E&P resembled the PP rats (not shown). Treatment with E&P also had a pronounced effect on the histological appearance of the mammary gland, with pronounced lobular hypertrophy in treated rats compared to control rats (Figure 1A-C). This was obvious after treatment for 5 days and increased further after treatment for 19 days. In PP rats, the lobular hyperplasia was also observed and the epithelium displayed pronounced secretory activity (Figure 1D). In agreement with these morphological changes, few epithelial cells were positive for BrdU in control rats (Figure 1E), whereas a substantial number of epithelial cells were positive for BrdU in PP rats and rats treated with E&P (Figure 1F). Thus, there was considerable variation in both morphology and proliferative activity of the mammary gland tissue between the animals.
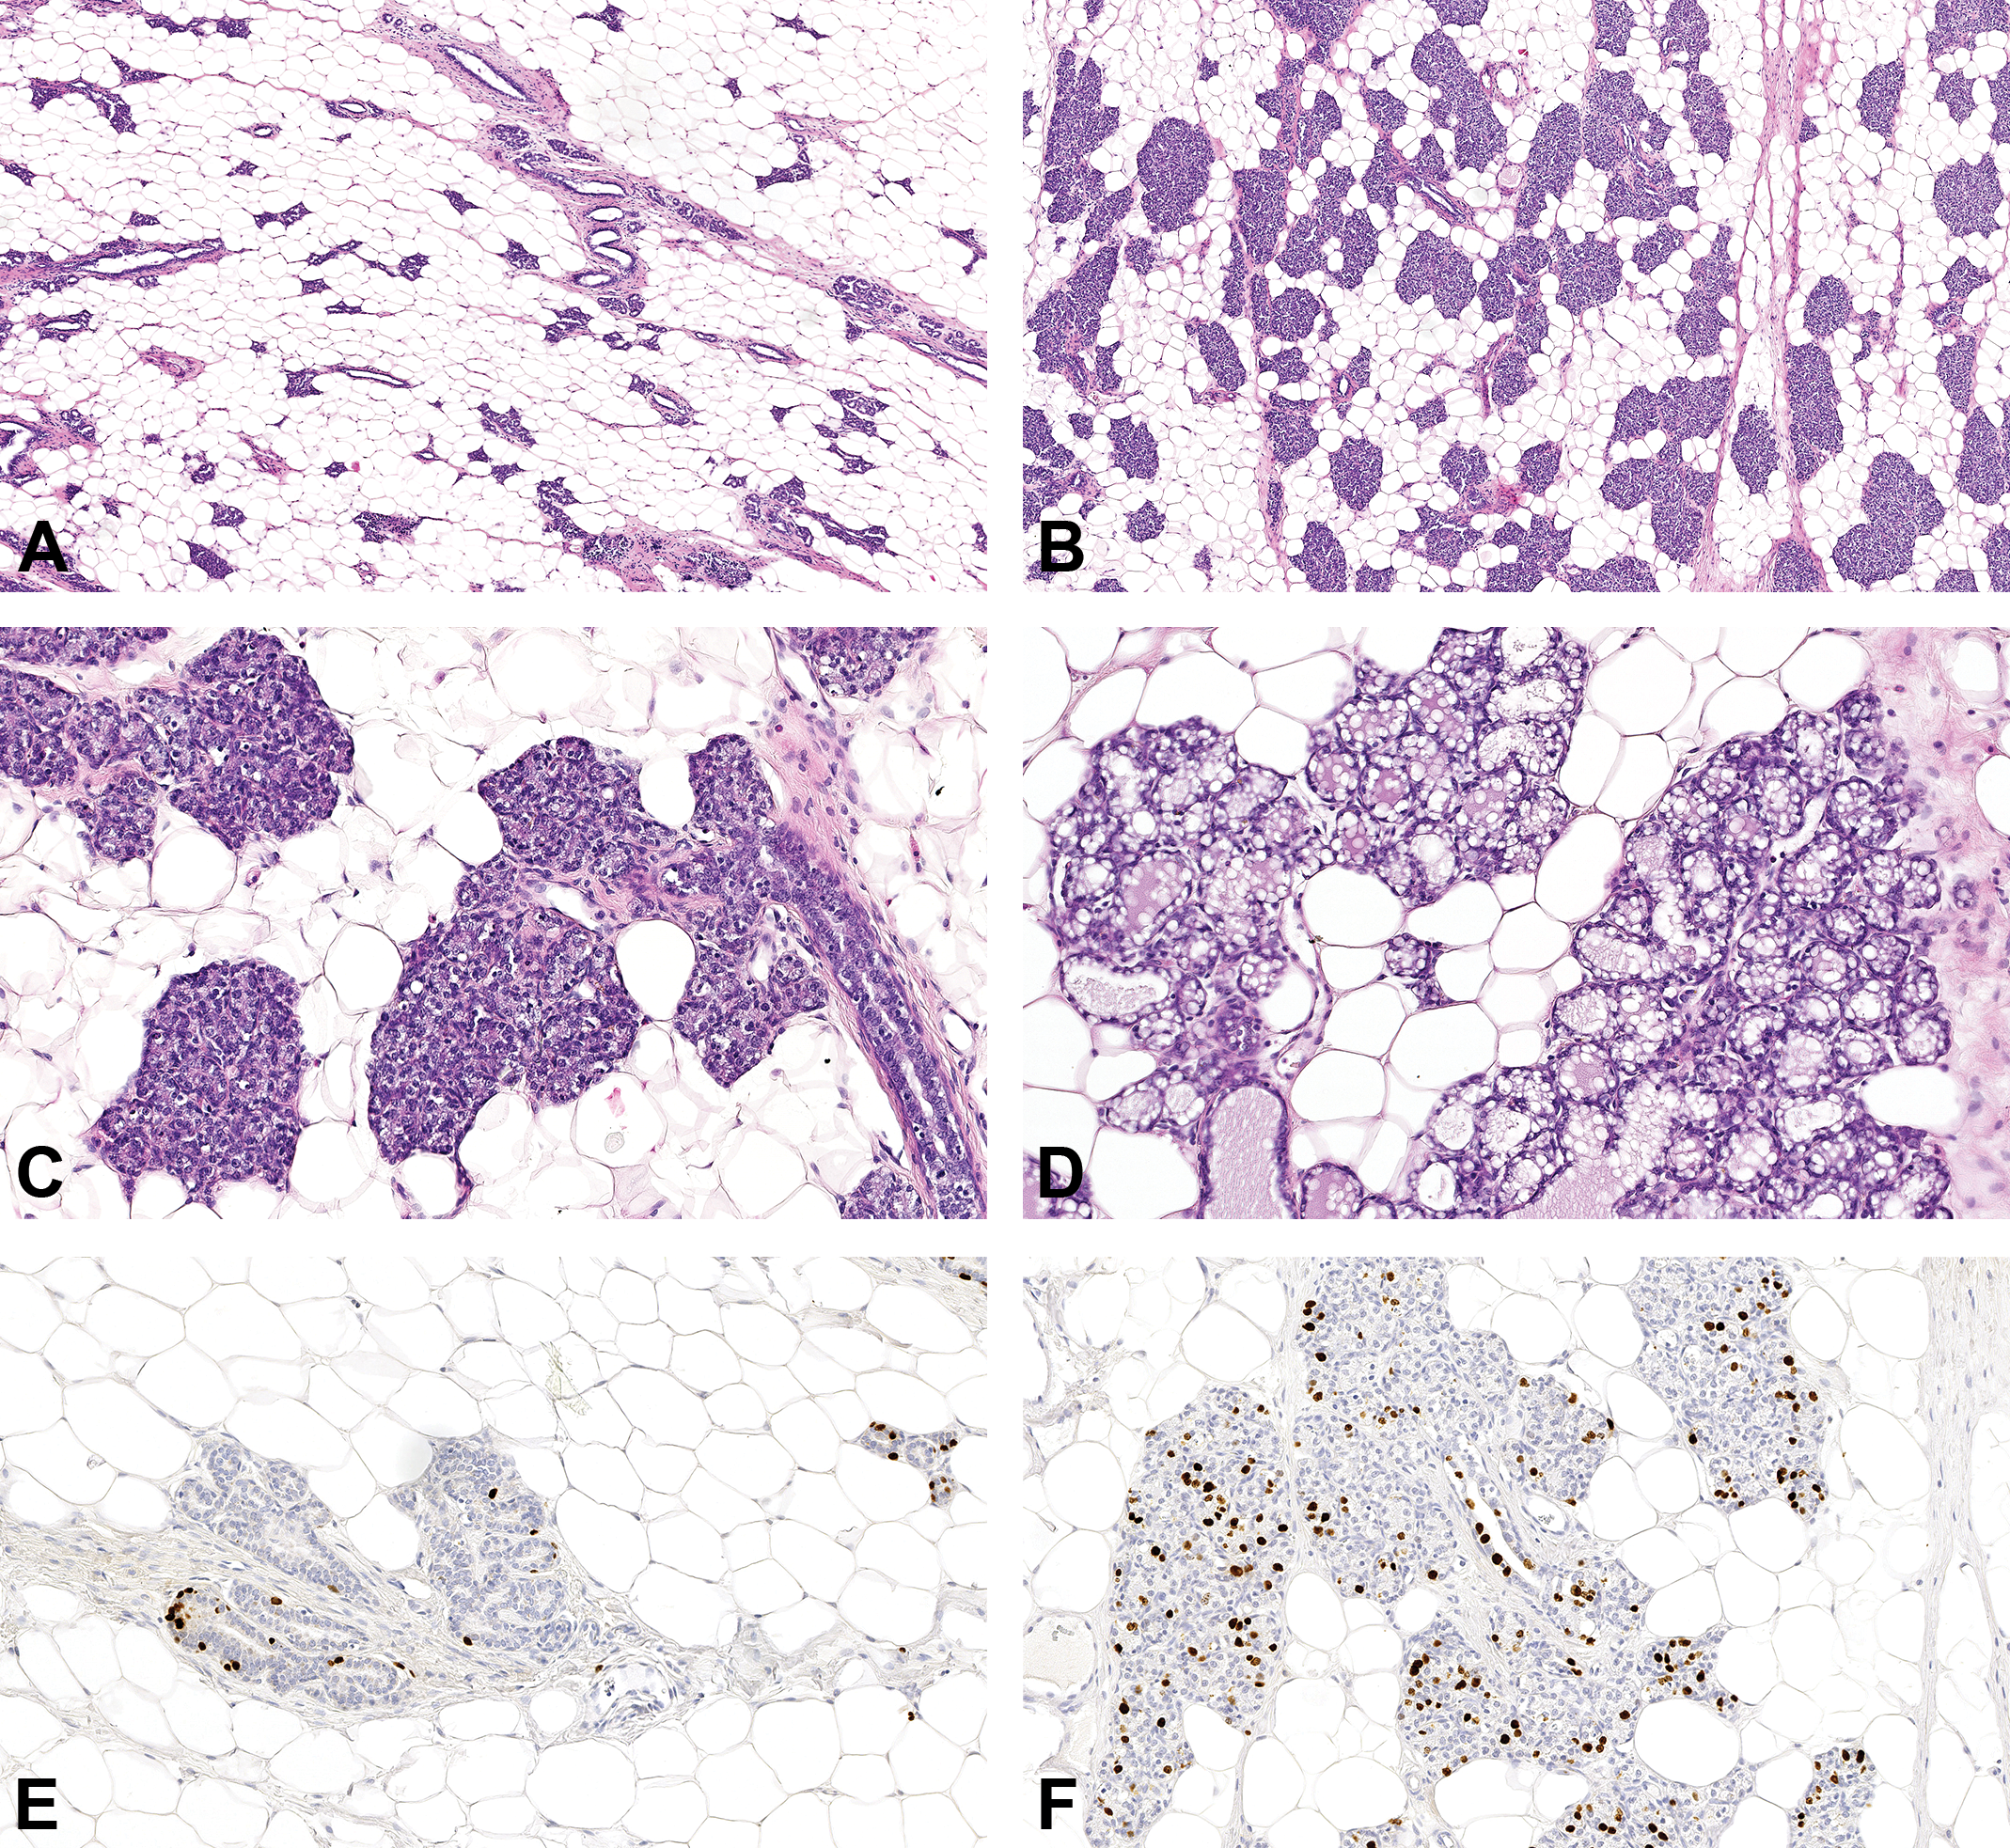
Morphology and BrdU-labeling in mammary gland tissue varied considerably between PP rats, vehicle-treated rats, and E&P-treated rats. A, Mammary gland from rat in diestrus. HE. B, Mammary gland from rat treated with E&P for 19 days. HE. C, Higher magnification of mammary gland from rat treated with E&P for 19 days. HE. D, Mammary gland from PP rat. HE. E, Mammary gland from rat in metestrus phase stained for BrdU. F, Mammary gland from rat treated with E&P for 19 days stained for BrdU. BrdU indicates bromo-2′-deoxyuridine; E&P, treated with estradiol and progesterone; HE, hematoxylin and eosin.
Mammary Gland Proliferation Assessed With Manual Counting and Image Analysis Were Strongly Correlated and Dependent on the Estrous Cycle and Pseudopregnancy
The trained classifying algorithm based on AI was applied on WSIs of the mammary gland sections with diverse morphology and could sufficiently classify the contents of the mammary fat pad from normal rats, rats treated with E&P, as well as PP rats as adipose tissue, connective tissue, and epithelium (Figure 2A-C). Subsequently, the threshold-based area analysis module was used to quantify the area stained for BrdU and the area of the negative nuclei within the epithelial compartment (Figure 2D).
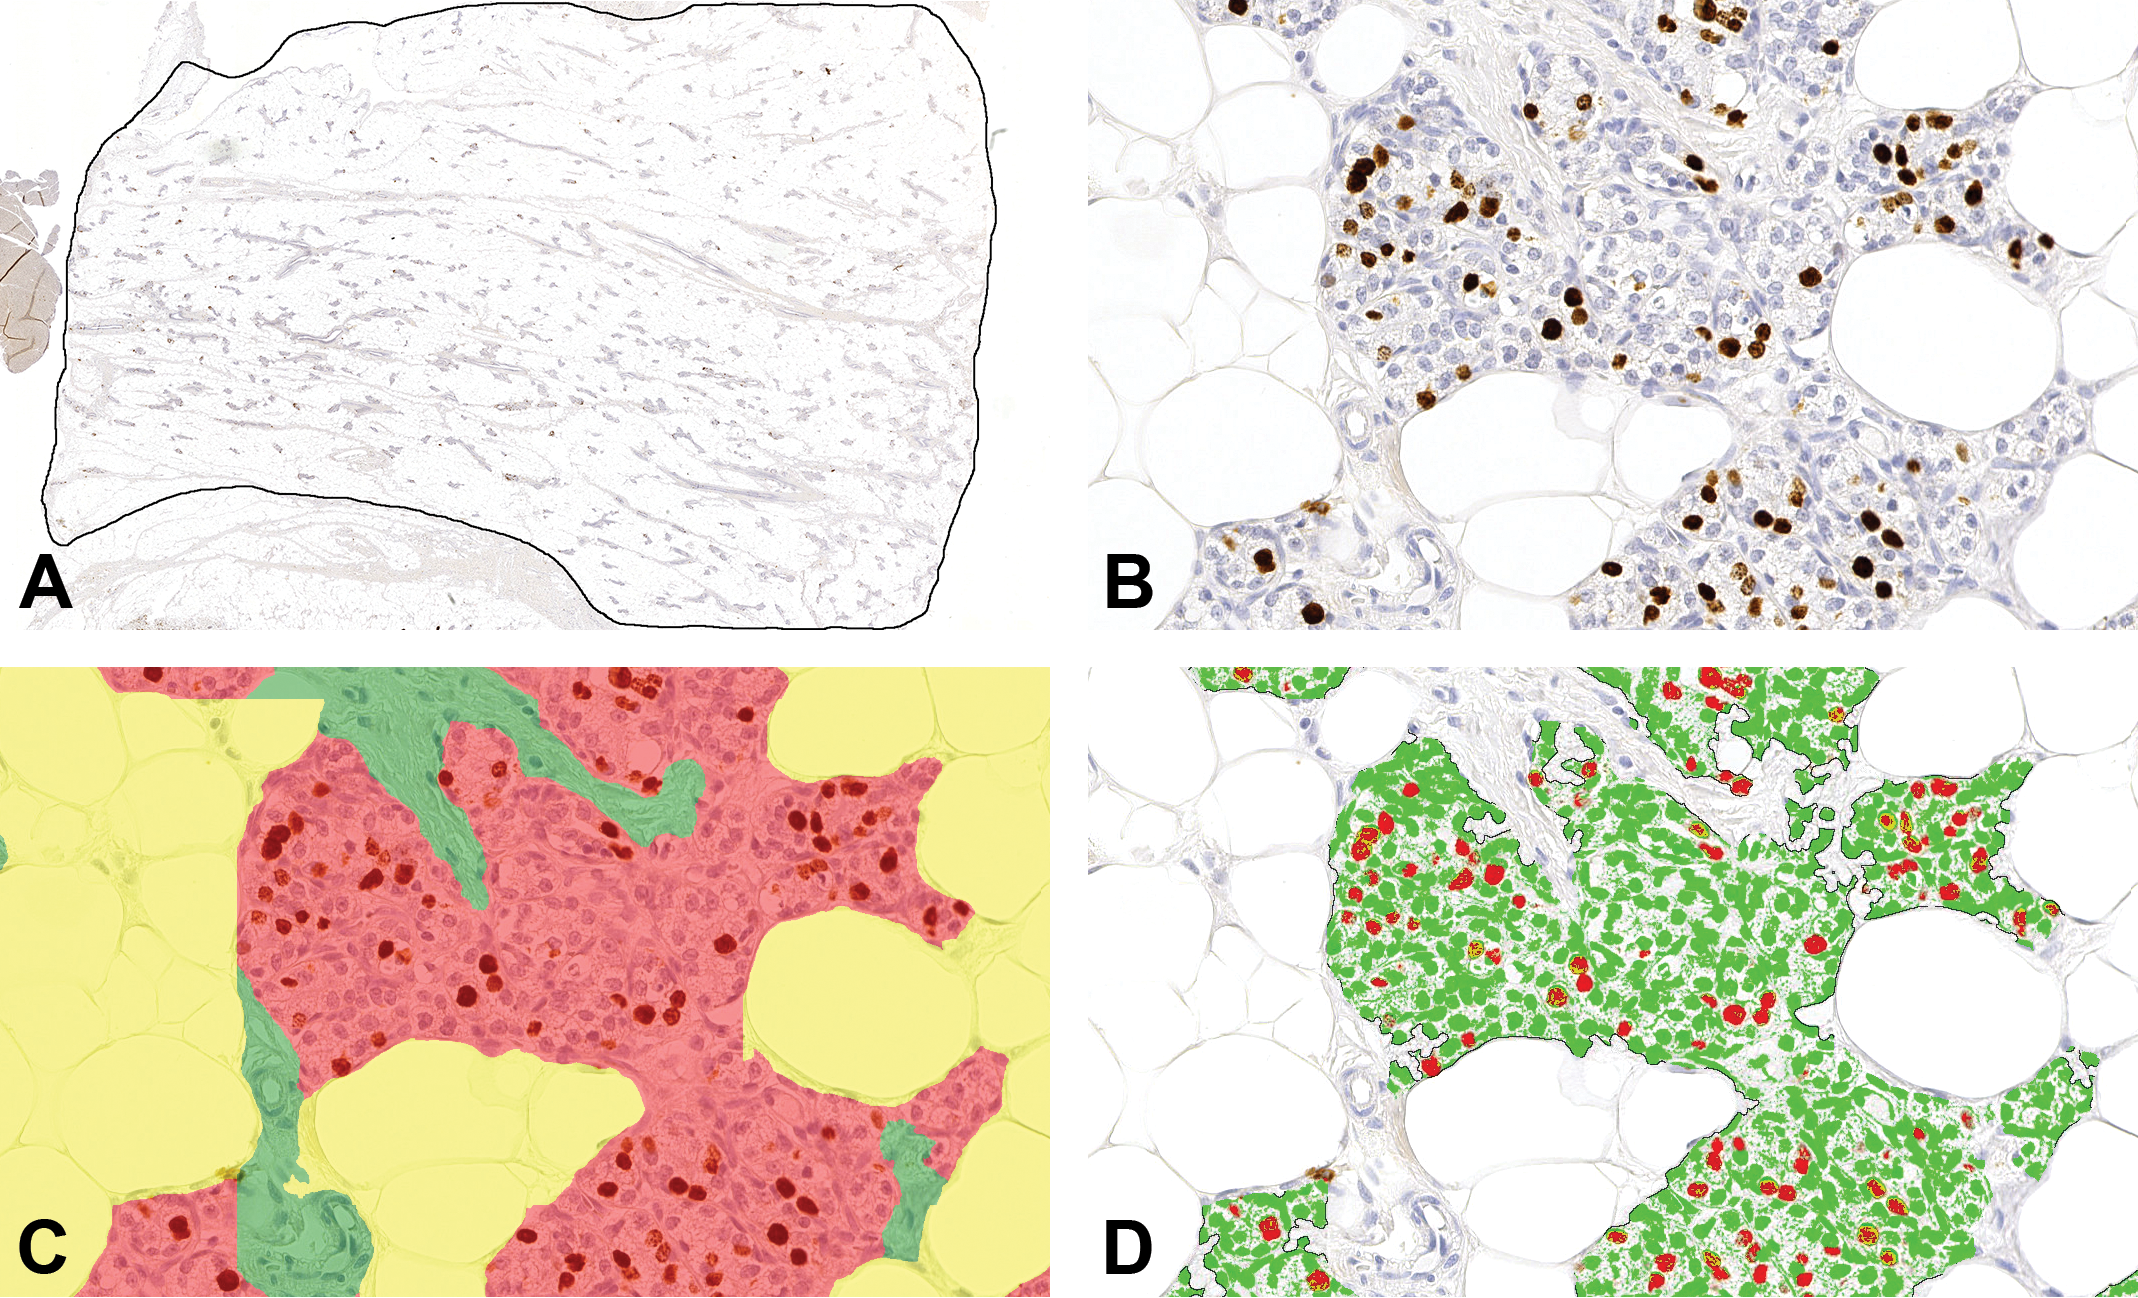
Image analysis of rat mammary gland tissue. A, A region of interest (ROI) was manually drawn around the area with mammary fat pad which contained the mammary gland tissue. B, Mammary gland tissue from a rat treated with E&P for 19 days stained for BrdU. C, The mammary gland tissue shown in panel B classified as adipose tissue (yellow overlay), connective tissue (green overlay), or epithelium (red overlay). D, The mammary gland tissue shown in panel B and C. In the area classified as epithelium, areas of BrdU+ nuclei (red and yellow overlay) and negative nuclei (green overlay) were quantified. BrdU indicates bromo-2′-deoxyuridine; E&P, treated with estradiol and progesterone.
With the systematic random sampling method, the BrdU+ LIs could be assessed by manual counting with a high level of precision, as the coefficient of variation (CV) for manual counting within the same section equalled 6% to 13%, across sections with low, medium, and high level of BrdU+ cells (Figure 3A). Initial data-analysis revealed that treatment with native human insulin did not influence proliferative activity significantly in this study (Supplementary Figure 1), and the proliferative activity was therefore explored across estrous cycle stages, spontaneous PP rats, and E&P-treated rats. The BrdU+ L is assessed using manual counting were significantly increased in E&P-treated rats and during metestrus in normal rats (Figure 3B). The same pattern was observed when DIA was used to quantify the BrdU+ AF of the epithelial nuclei (Figure 3C). The Pearson correlation coefficient between BrdU+ LIs and BrdU+ AFs of epithelial nuclei equalled 0.9751 (Figure 3D), which indicates a very high level of correlation. When the differences between BrdU+ LI and BrdU+ AF of epithelial nuclei for each section were plotted against the average of the 2 methods, good agreement was observed across the data set, with a nonsignificant trend toward a systematic difference of approximately 1.4-fold between the two endpoints (Figure 3E). The BrdU+ AF of the epithelium revealed the same dependency on the estrous cycle and treatment with E&P as the two other endpoints (Figure 3F), and the Pearson correlation coefficient between the BrdU+ AF of the epithelium and the BrdU+ AF of the epithelial nuclei equalled 0.9931 (Figure 3G), which indicates an almost perfect correlation between the two endpoints. The Bland-Altman plot also indicated good agreement between the two endpoints (Figure 3H). Furthermore, when the magnitudes of fold-differences between groups were compared between the three different endpoints used to describe the proliferative activity, the differences were generally of comparable magnitudes (Table 4 and Supplementary Figure 2).
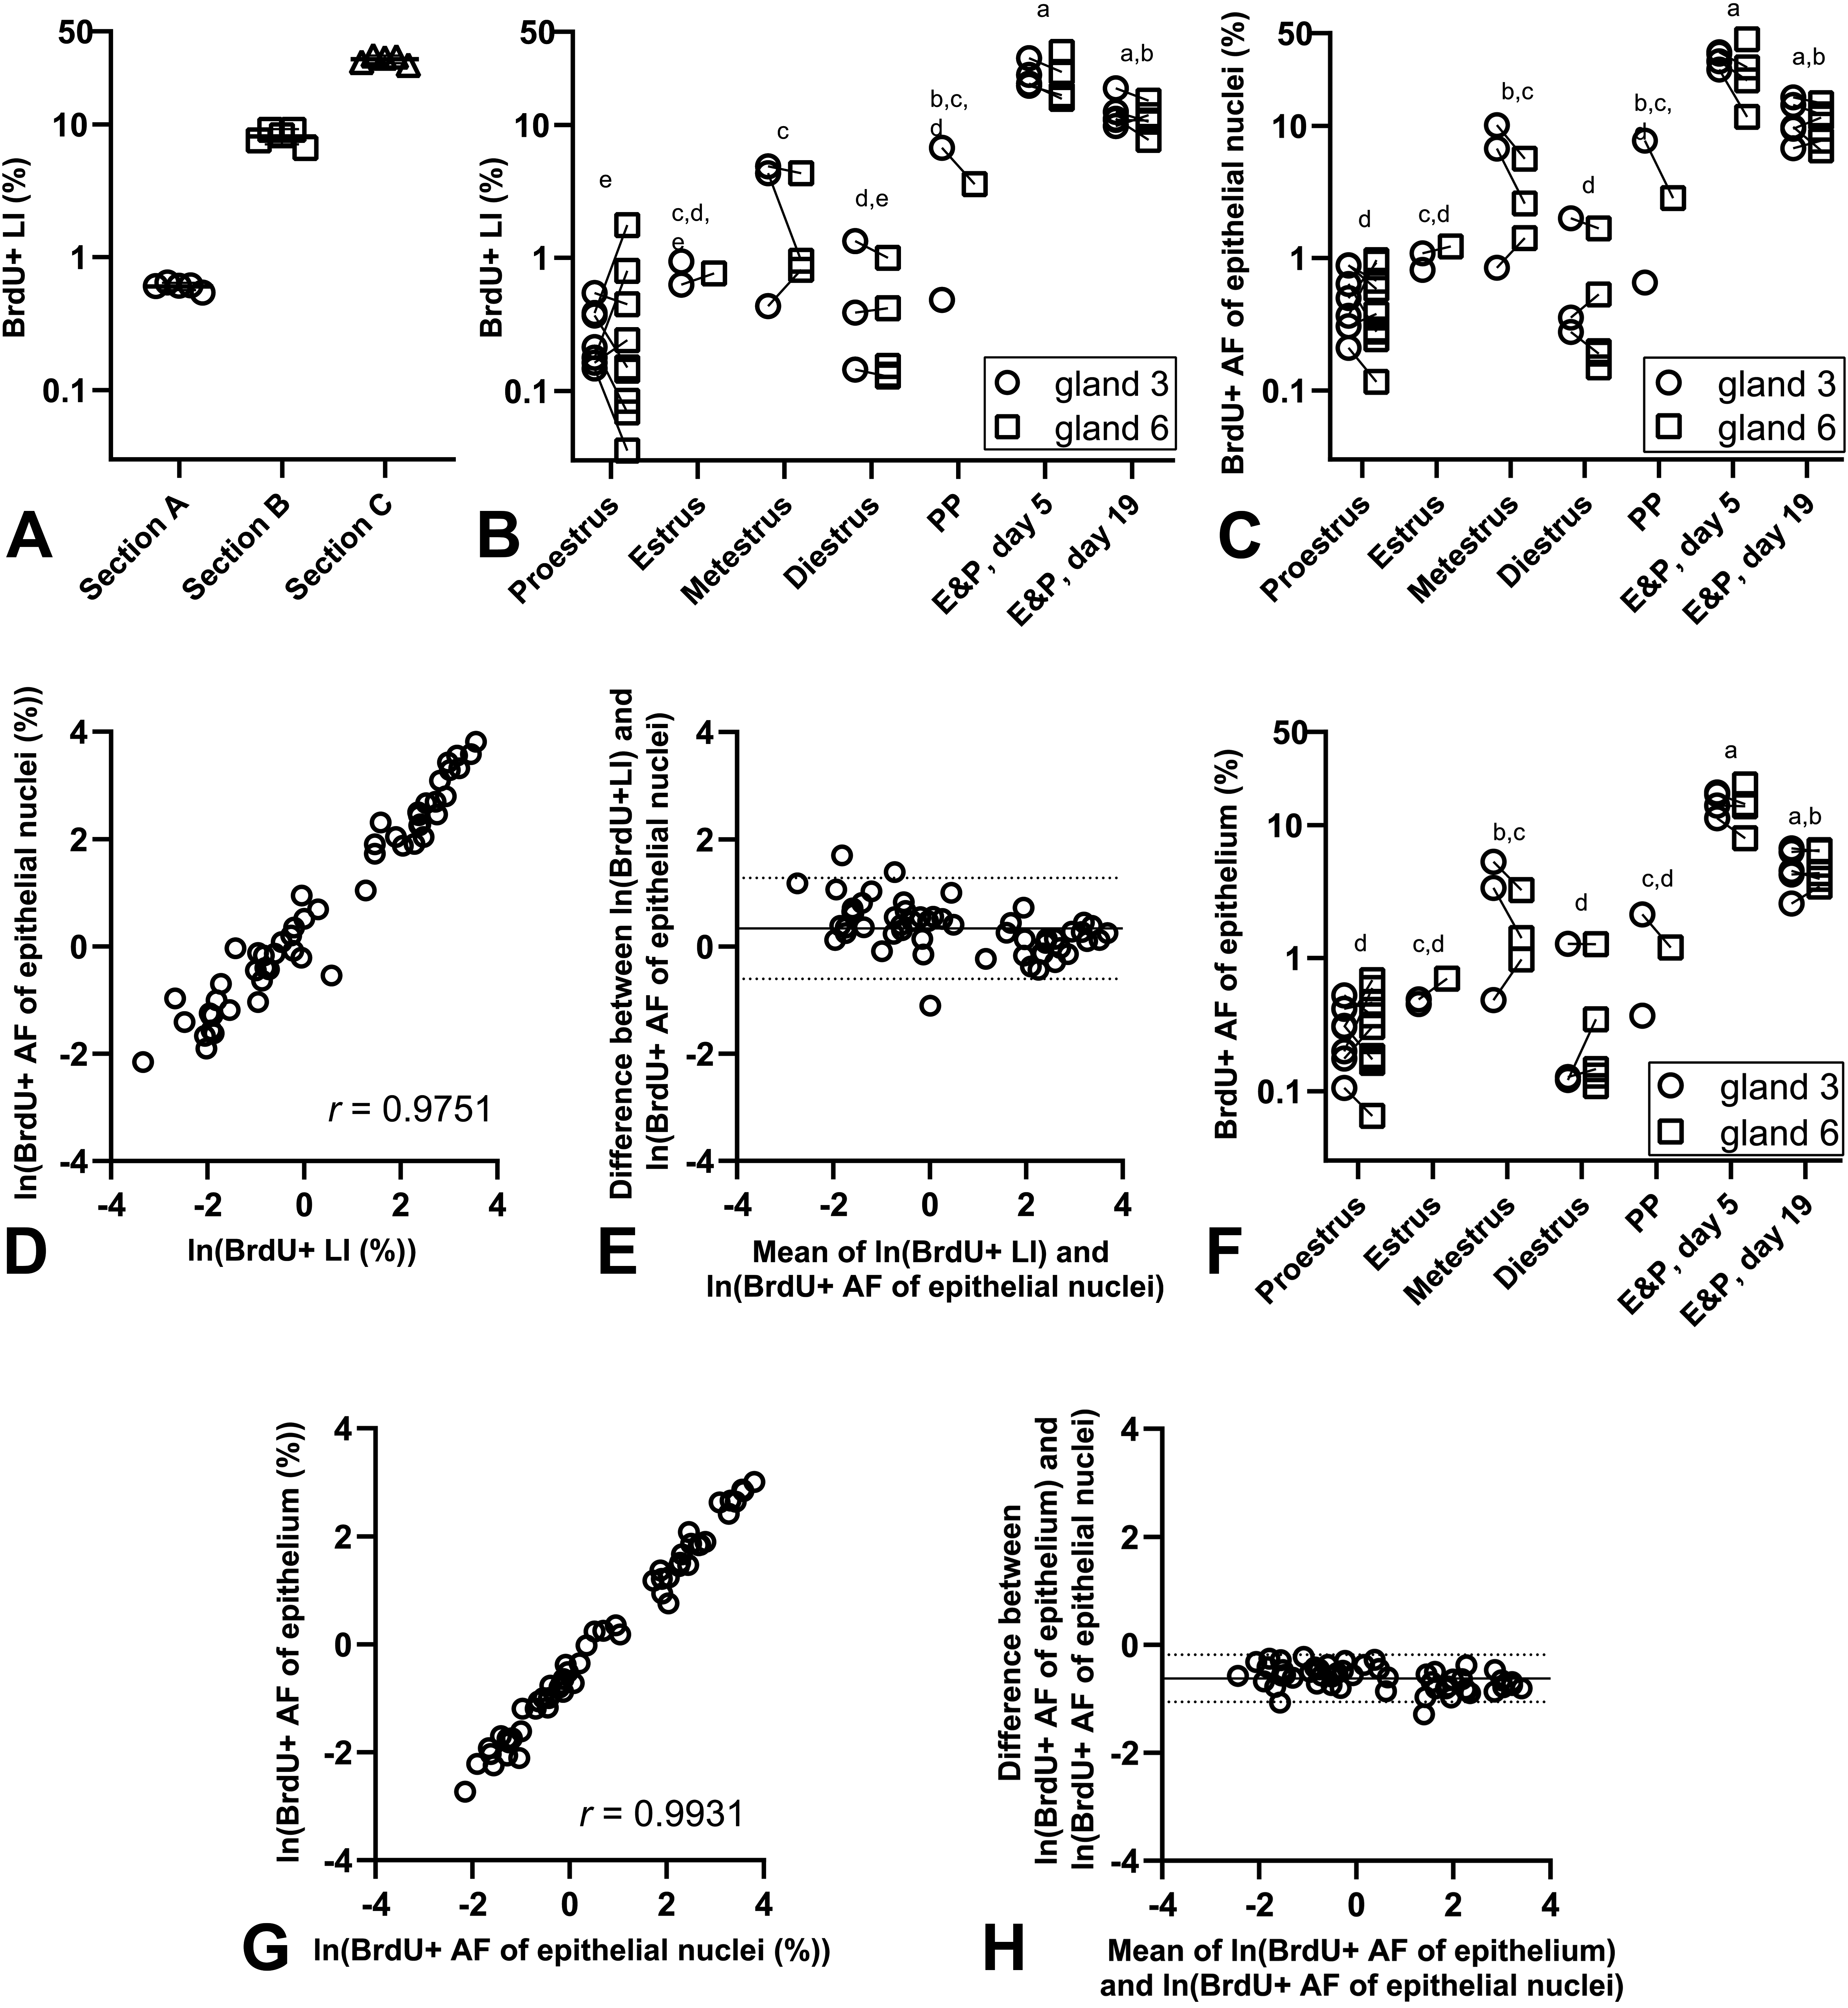
Quantification of proliferation in rat mammary gland. A, Repeated counting procedures in mammary gland sections yielded fully comparable BrdU+ LIs. B, BrdU+ LIs assessed with manual counting. C, The BrdU+ AF of the epithelial nuclei. D, Correlation between the BrdU+ AF and BrdU+ LIs assessed with manual counting. The Pearson correlation coefficient is stated on the figure. E, Bland-Altman plot of the difference between BrdU+ LI and BrdU+ AF of epithelial nuclei plotted against the average of the two endpoints (ln-scale). The mean difference was 0.337 (indicated with full line) and the 95% confidence interval was [−0.602; 1.278] (indicated with dotted lines). When back-transformed, this equalled a mean fold-difference of 1.4 [0.5; 3.6]. F, The BrdU+ AF of the epithelium. G, Correlation between the BrdU+ AF of the epithelium and the BrdU+ AF of the epithelial nuclei (both ln-transformed). The Pearson correlation coefficient is stated on the figure. H, Bland-Altman plot of the difference between BrdU+ AF of the epithelium and BrdU+ AF of epithelial nuclei plotted against the average of the two endpoints (ln-scale). The mean difference was −0.621 (indicated with full line) and the 95% confidence interval was [−1.056; −0.186] (indicated with dotted lines). When back-transformed, this equalled a mean fold-difference of 0.5 [0.3; 0.8]. In all panels symbols indicate observations from individual animals. Groups marked with different letters were significantly different when groups were compared in t-tests, with Tukeys adjustment for multiple pairwise comparisons. In panel B, C, and F, observations from mammary gland 3 and 6 from the same animal are connected with a line. AF indicates area fraction; BrdU, bromo-2′-deoxyuridine; E&P, treated with estradiol and progesterone; LI, labelling index; PP, pseudopregnant.
Fold-Differences Between Groups in Rat Experiment.
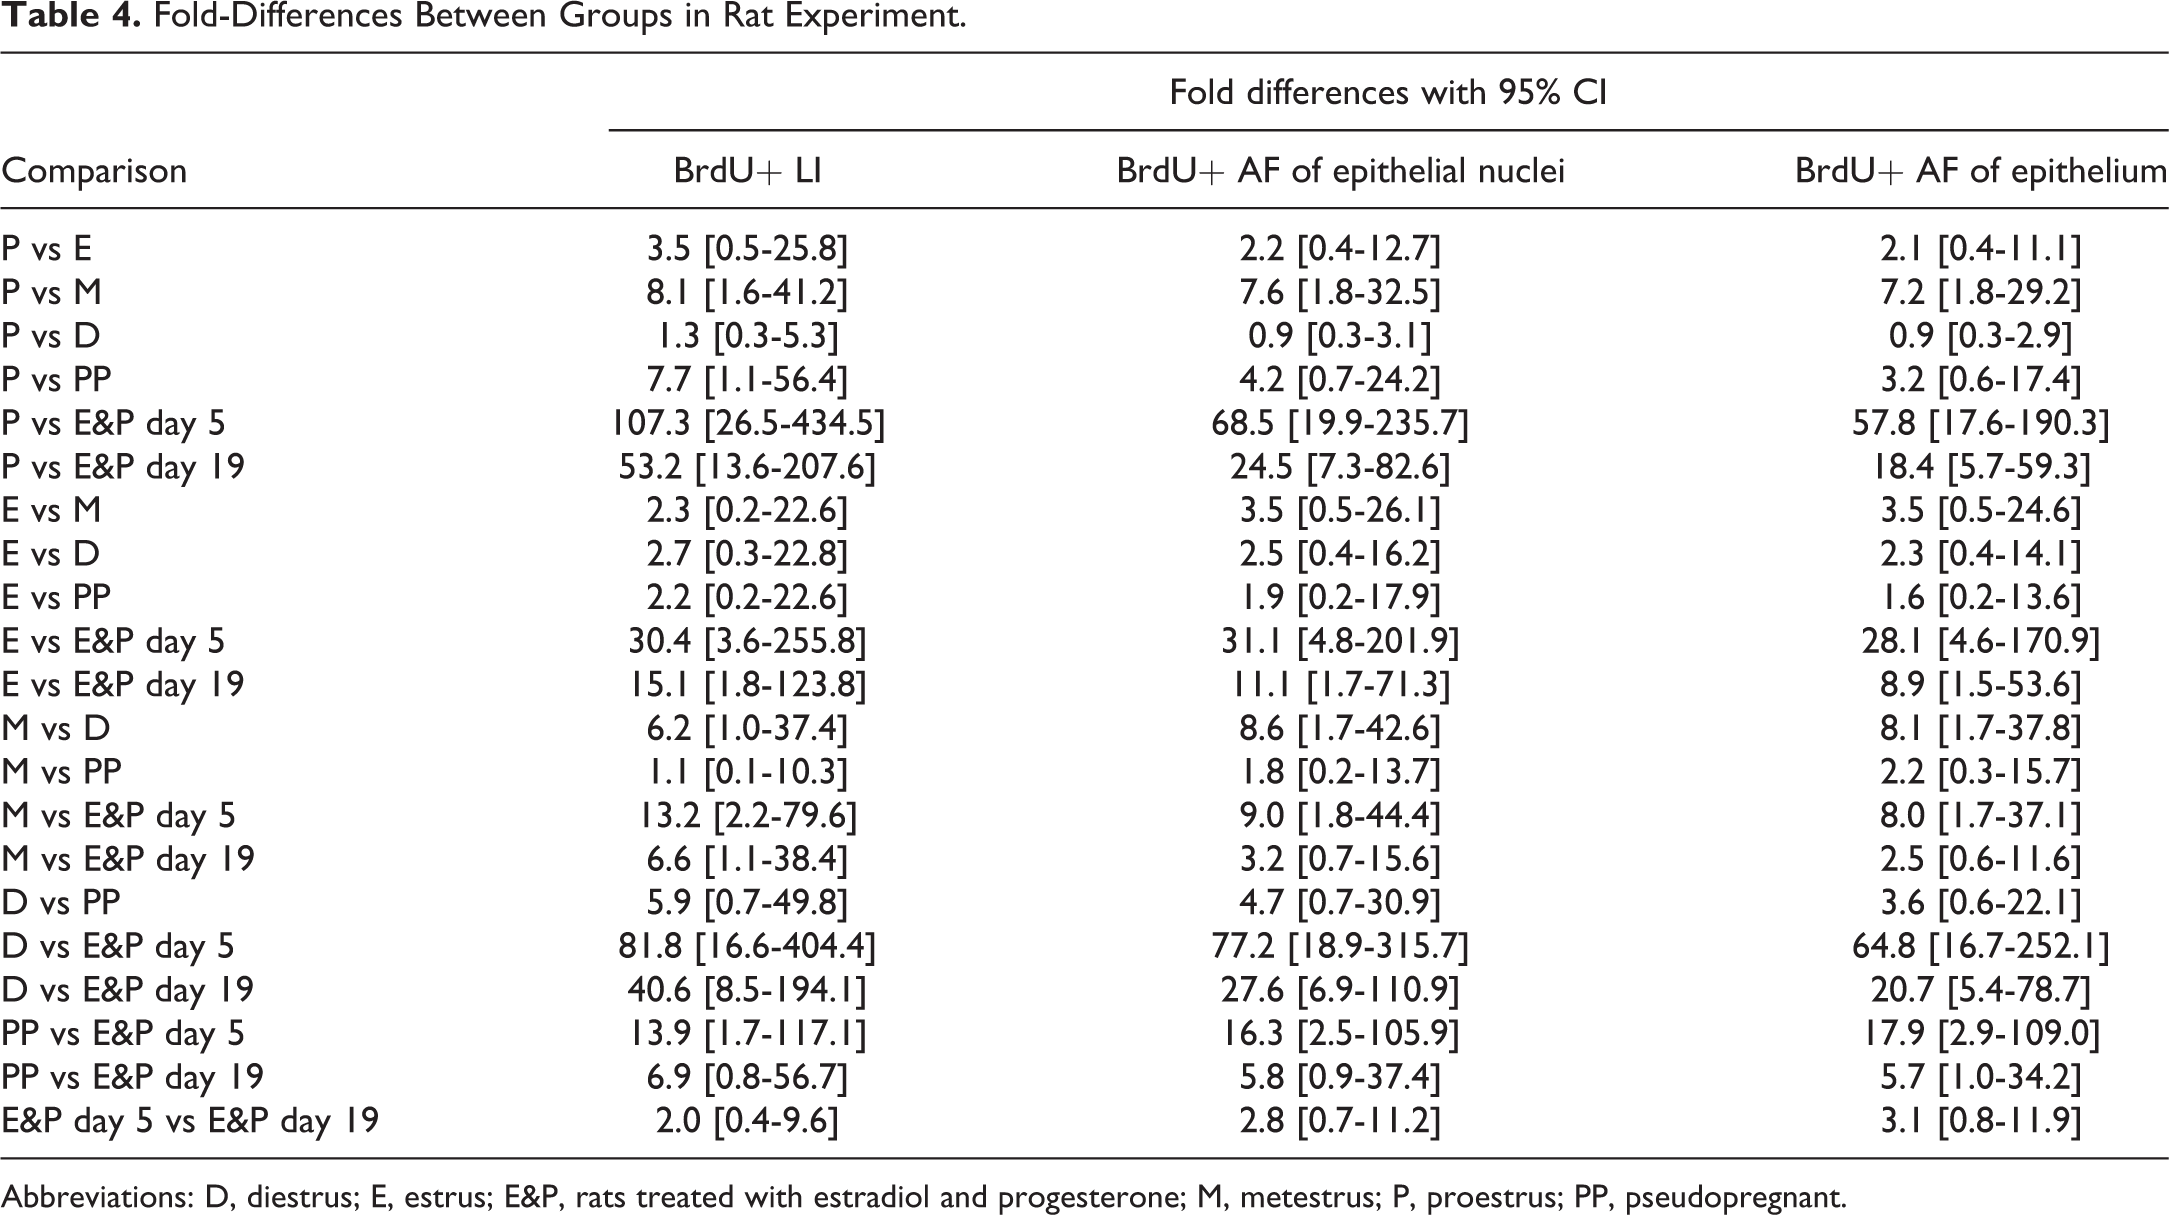
Abbreviations: D, diestrus; E, estrus; E&P, rats treated with estradiol and progesterone; M, metestrus; P, proestrus; PP, pseudopregnant.
When data from the mammary gland sections which had been used for training of the classifying algorithm were excluded from the three data sets, the calculated correlation coefficients between end points were fully comparable to the correlation coefficients calculated on the full data sets (Table 5).
Pearson Correlation Coefficient Between End Points for Proliferation in Rat Mammary Gland With 95% CIs.
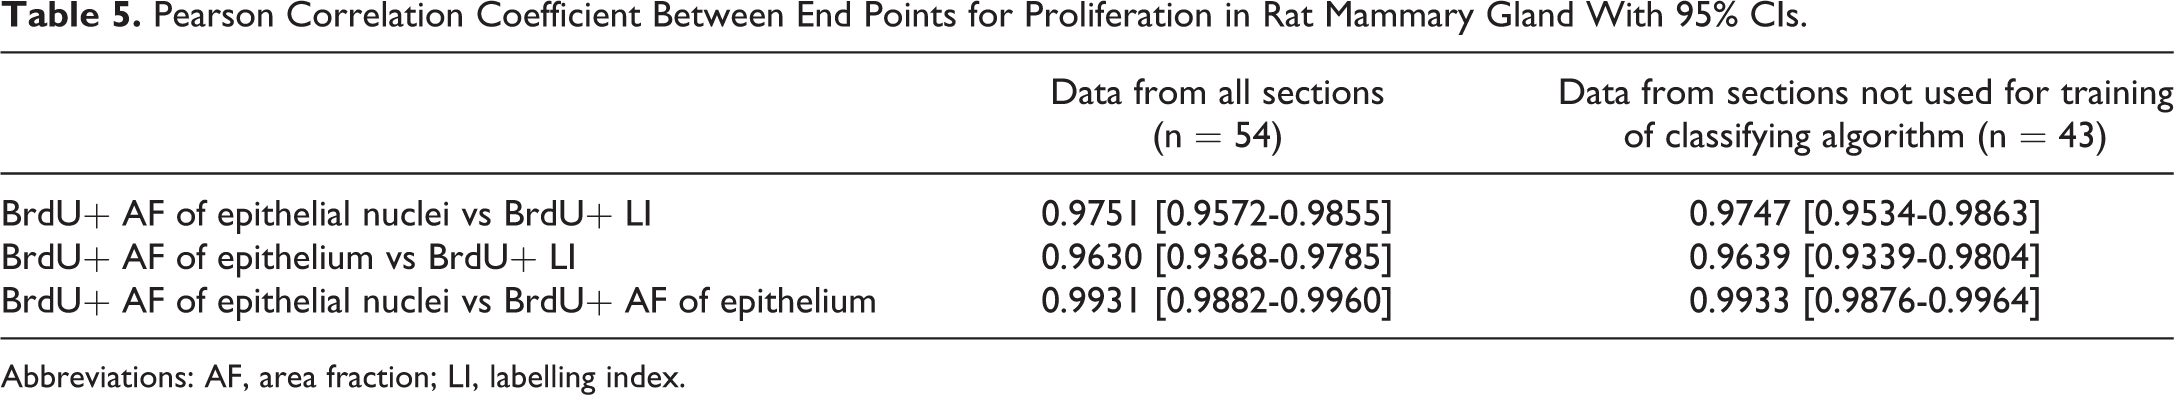
Abbreviations: AF, area fraction; LI, labelling index.
Minipig Oviduct Epithelial Proliferation Assessed With Manual Counting and Image Analysis Were Highly Correlated, and Both Methods Demonstrated the Estrous Cycle Dependency
In sections from minipig oviduct, there was considerable variation between animals with respect to the number of positive epithelial staining for Ki67 (Figure 4A-C). The trained algorithm was used to segment each WSI in background, connective tissue, epithelium, or apical cytoplasm (Figure 4D and E), and thereafter the area analysis module was used to quantify areas of Ki67+ nuclei and negative nuclei in the areas classified as epithelium (Figure 4F).
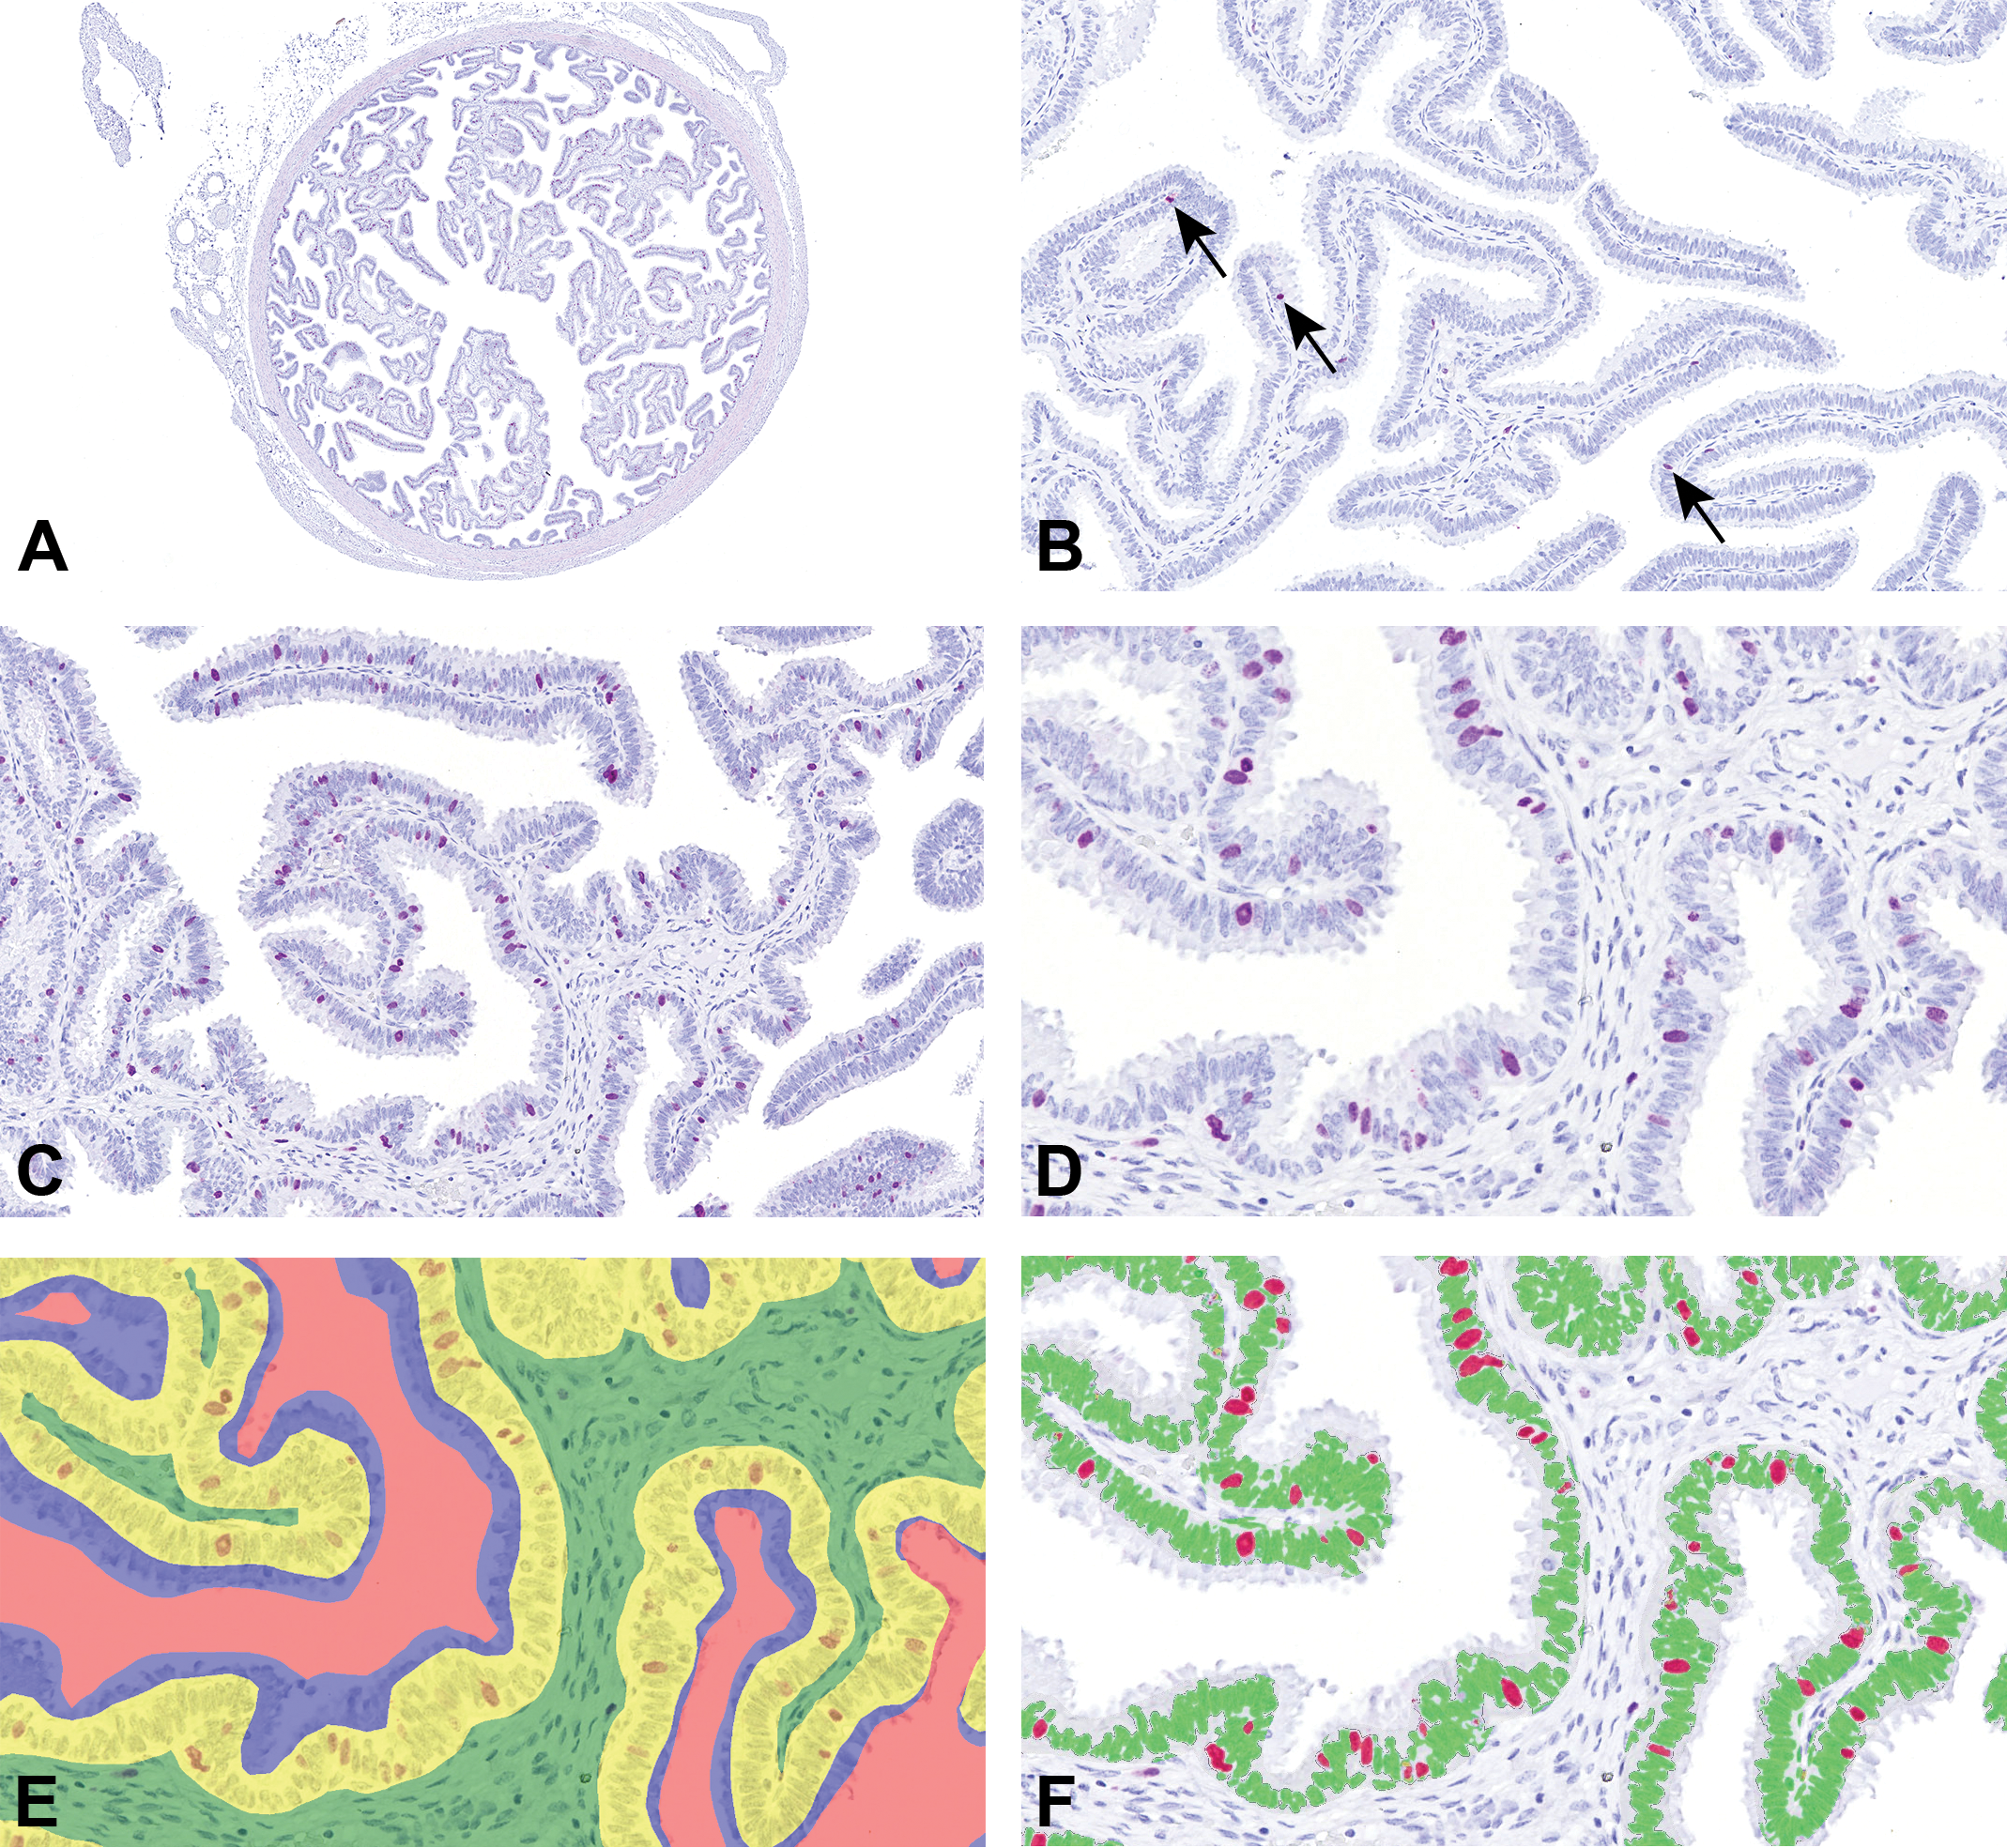
Image analysis of minipig oviductual tissue. A, A region of interest (ROI) was manually drawn around the oviduct. B, Oviduct section from a pig with low proliferative activity. The arrows indicate Ki67+ cells (purple chromogen). C, Oviduct section from pig with high proliferative activity. Ki67+ staining is identified with purple chromogen. D, Higher magnification of the oviduct section shown in panel C stained for Ki67 (purple chromogen). E, The oviduct section shown in panel D, classified as background (ie, clear glass, marked with red overlay), connective tissue (green overlay), epithelium (yellow overlay), or apical epithelial cytoplasm (blue overlay). F, The oviduct section shown in panel D and E. In the area classified as epithelium, areas of Ki67+ nuclei (red overlay) and negative nuclei (green overlay) were quantified.
With the systematic random sampling method, the epithelial Ki67+ LI in minipig oviduct could be assessed in a reproducible manner (Figure 5A) and in sections with low, medium, and high proliferative activity the intrasection CV was 14% to 17%. Ki67+ LIs assessed by manual counting in a subset of the oviduct sections revealed that proliferative activity was significantly increased during the follicular phase and the late luteal phase (Figure 5B). When the proliferative activity was quantified by assessment of the Ki67+ AF of the epithelial nuclei in the same subset of oviductal sections, the follicular phase and the late luteal phase also displayed significantly increased proliferative activity (Figure 5C). The Pearson correlation coefficient between the Ki67+ LIs and the Ki67+ AFs of epithelial nuclei equalled 0.9786 (Figure 5D), that is, a very high degree of correlation. The Bland-Altman plot showed good agreement, and a nonsignificant trend toward a systematic difference of approximately 1.2-fold between the two endpoints was observed (Figure 5E). The Ki67+ area was quantified with DIA in all 36 oviduct sections. The Ki67+ AF of epithelial nuclei and the Ki67+ AF of the epithelium both showed that the proliferative activity was increased during the follicular phase and the late luteal phase (Figure 5F and G), and the Pearson correlation coefficient between these two endpoints equalled 0.9933 (Figure 5H), which is near perfect correlation. The Bland-Altman plot also demonstrated excellent agreement between these two endpoints (Figure 5I). In agreement with these findings, the magnitudes of the fold-differences between groups in each of the three data sets were generally fully comparable (Table 6 and Supplementary Figure 3).
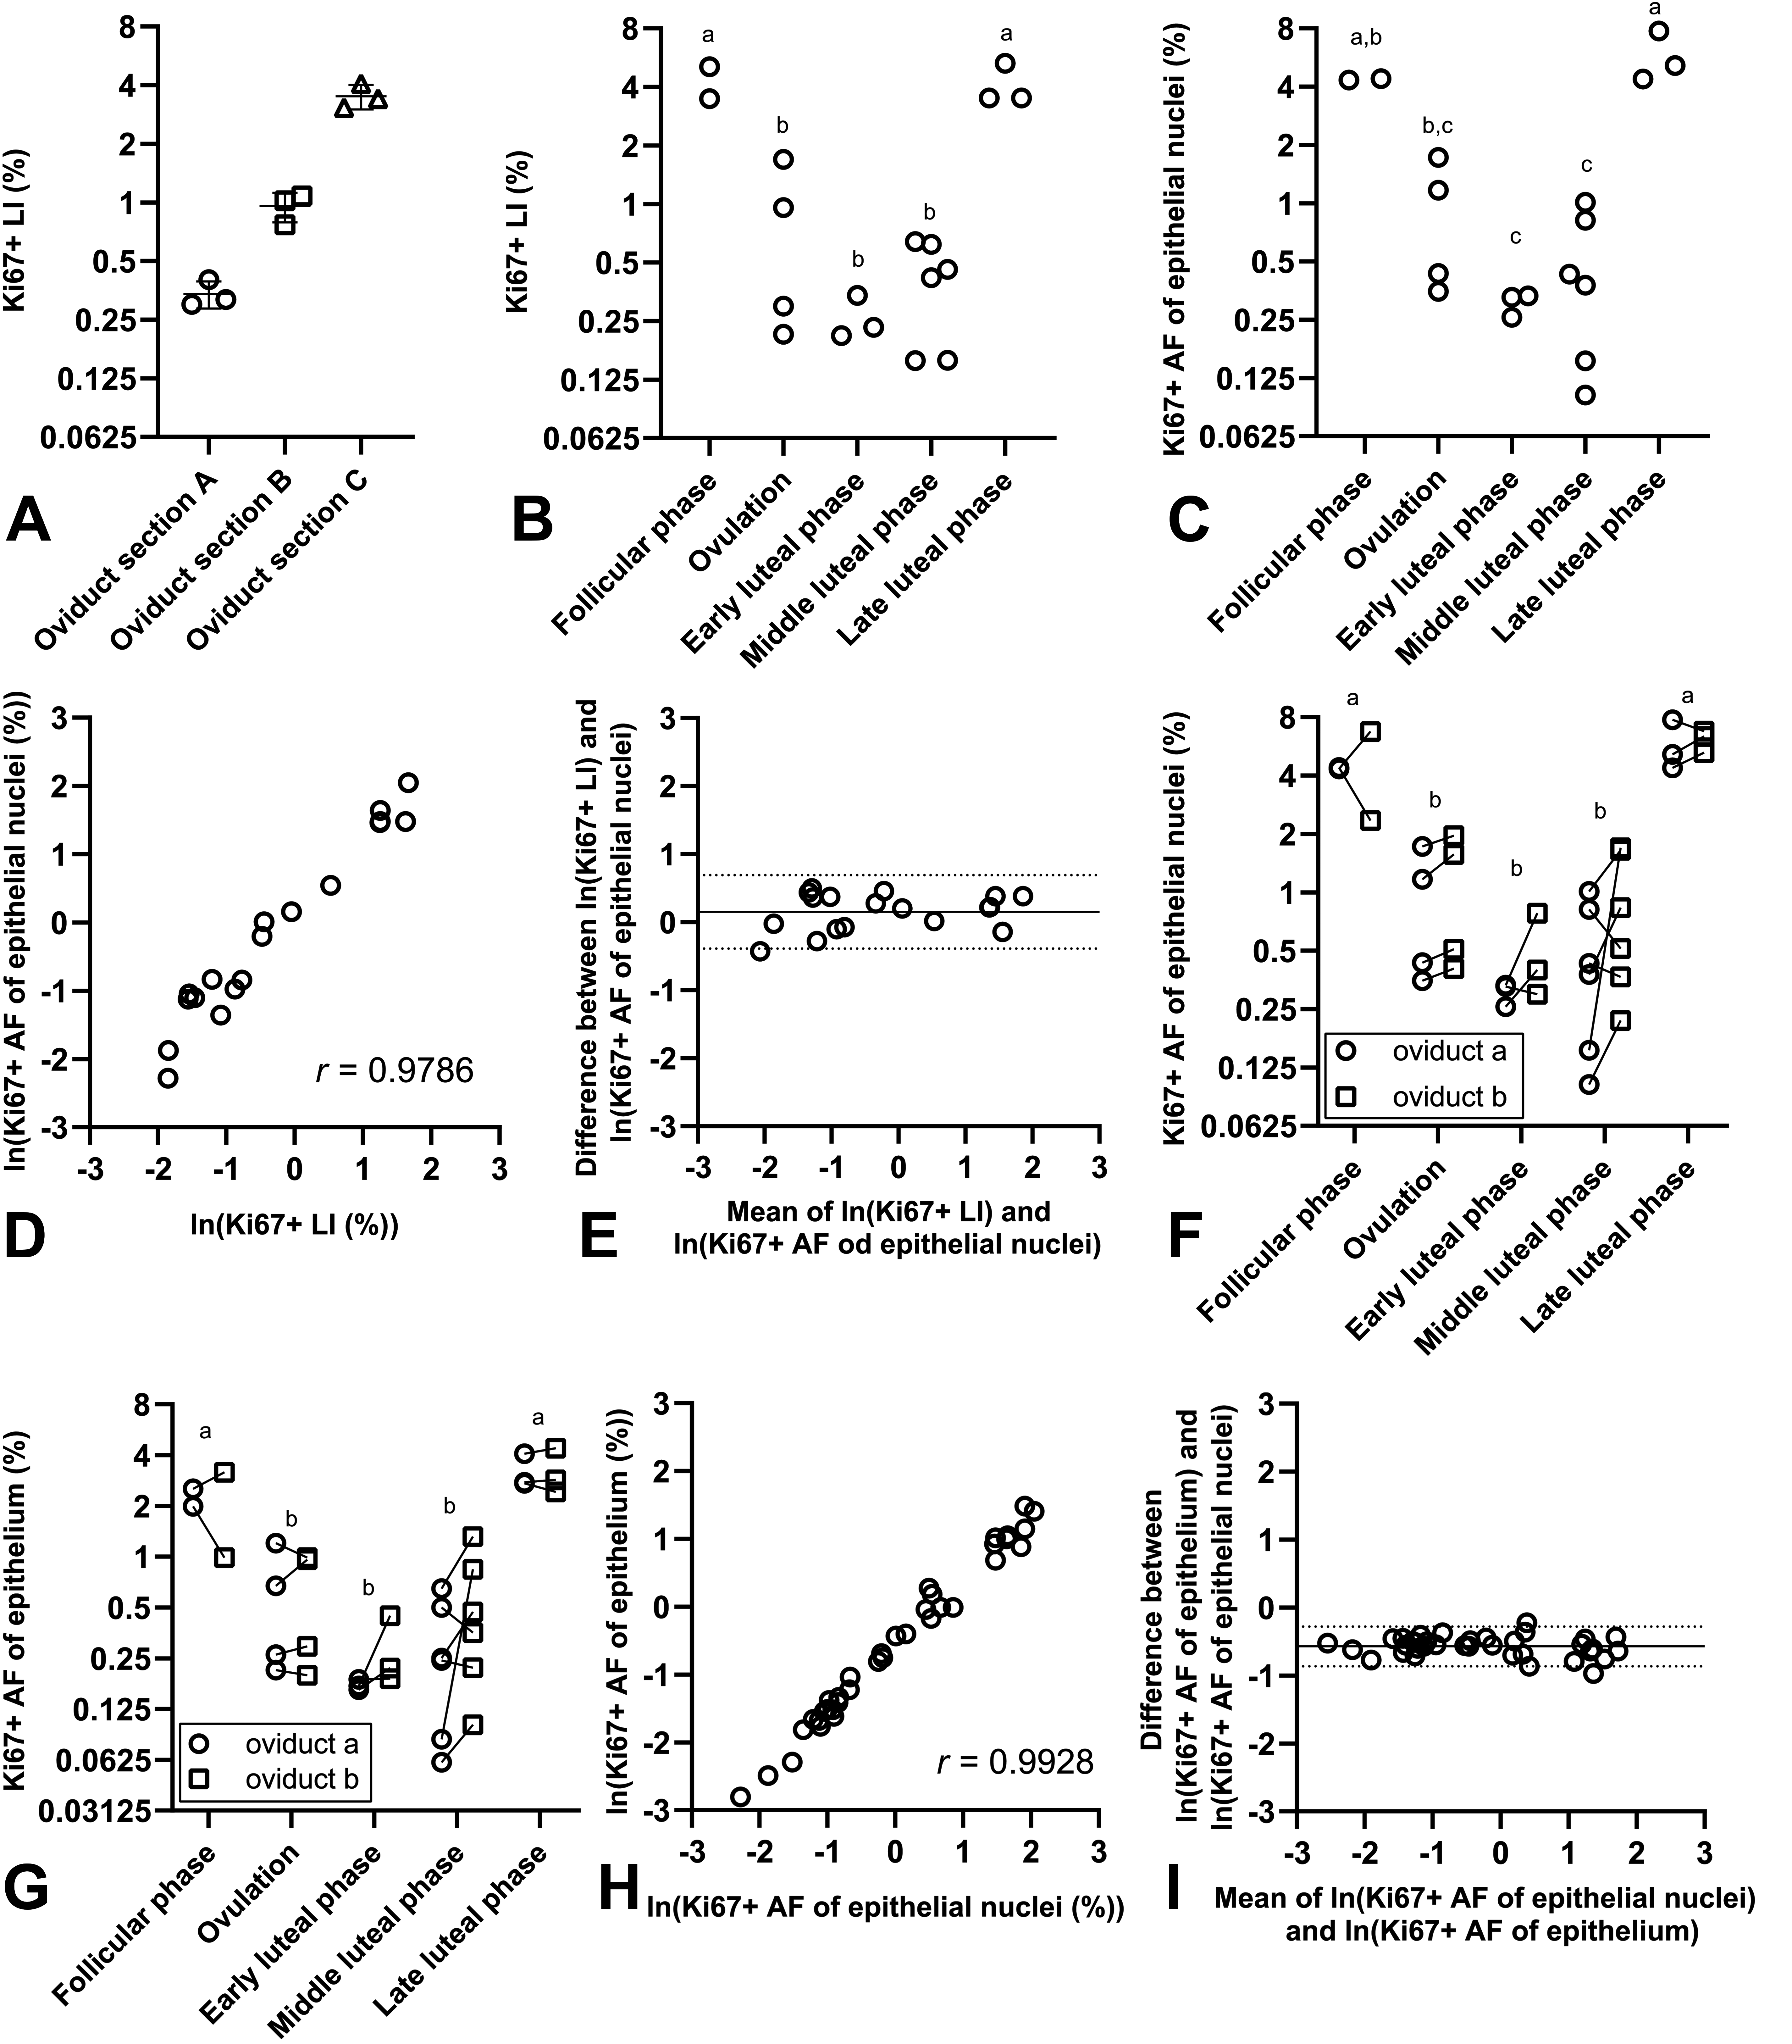
Quantification of proliferation in minipig oviduct. A, Repeated counting procedures in oviduct sections yielded fully comparable Ki67+ LIs. B, Ki67+ LIs assessed with manual counting. C, The Ki67+ AF of the epithelial nuclei. D, Correlation between the Ki67+ AF of epithelial nuclei and Ki67+ LIs assessed with manual counting. The Pearson correlation coefficient is stated on the figure. E, Bland-Altman plot of the difference between Ki67+ LI and Ki67+ AF of epithelial nuclei plotted against the average of the two endpoints (ln-scale). The mean difference was 0.154 (indicated with full line) and the 95% confidence interval was [−0.385 to 0.694] (indicated with dotted lines). When back-transformed, this equalled a mean fold-difference of 1.2 [0.7-2.0]. F, The Ki67+ AF of the epithelial nuclei assessed in all oviduct sections in the study. G, The Ki67+ AF of the epithelium assessed in all oviduct sections in the study. H, Correlation between the Ki67+ AF of the epithelium and the Ki67+ AF of the epithelial nuclei (both ln-transformed). The Pearson correlation coefficient is stated on the figure. I, Bland-Altman plot of the difference between Ki67+ AF of the epithelium and Ki67+ AF of epithelial nuclei plotted against the average of the two endpoints (ln-scale). The mean difference was −0.571 (indicated with full line) with a 95% confidence interval of [−0.863 to −0.278] (indicated with dotted lines). When back-transformed, this equalled a mean fold-difference of 0.6 [0.4-0.8]. In all panels, symbols indicate observations from individual animals. Groups marked with different letters were significantly different when groups were compared in t-tests, with Tukeys adjustment for multiple pairwise comparisons. In panel F and G observations from oviduct sections originating from the same animal are connected with a line. AF indicates area fraction; LI, labelling index.
Fold-Differences in Epithelial Proliferation Between Stages of the Estrous Cycle in Minipig Oviduct.
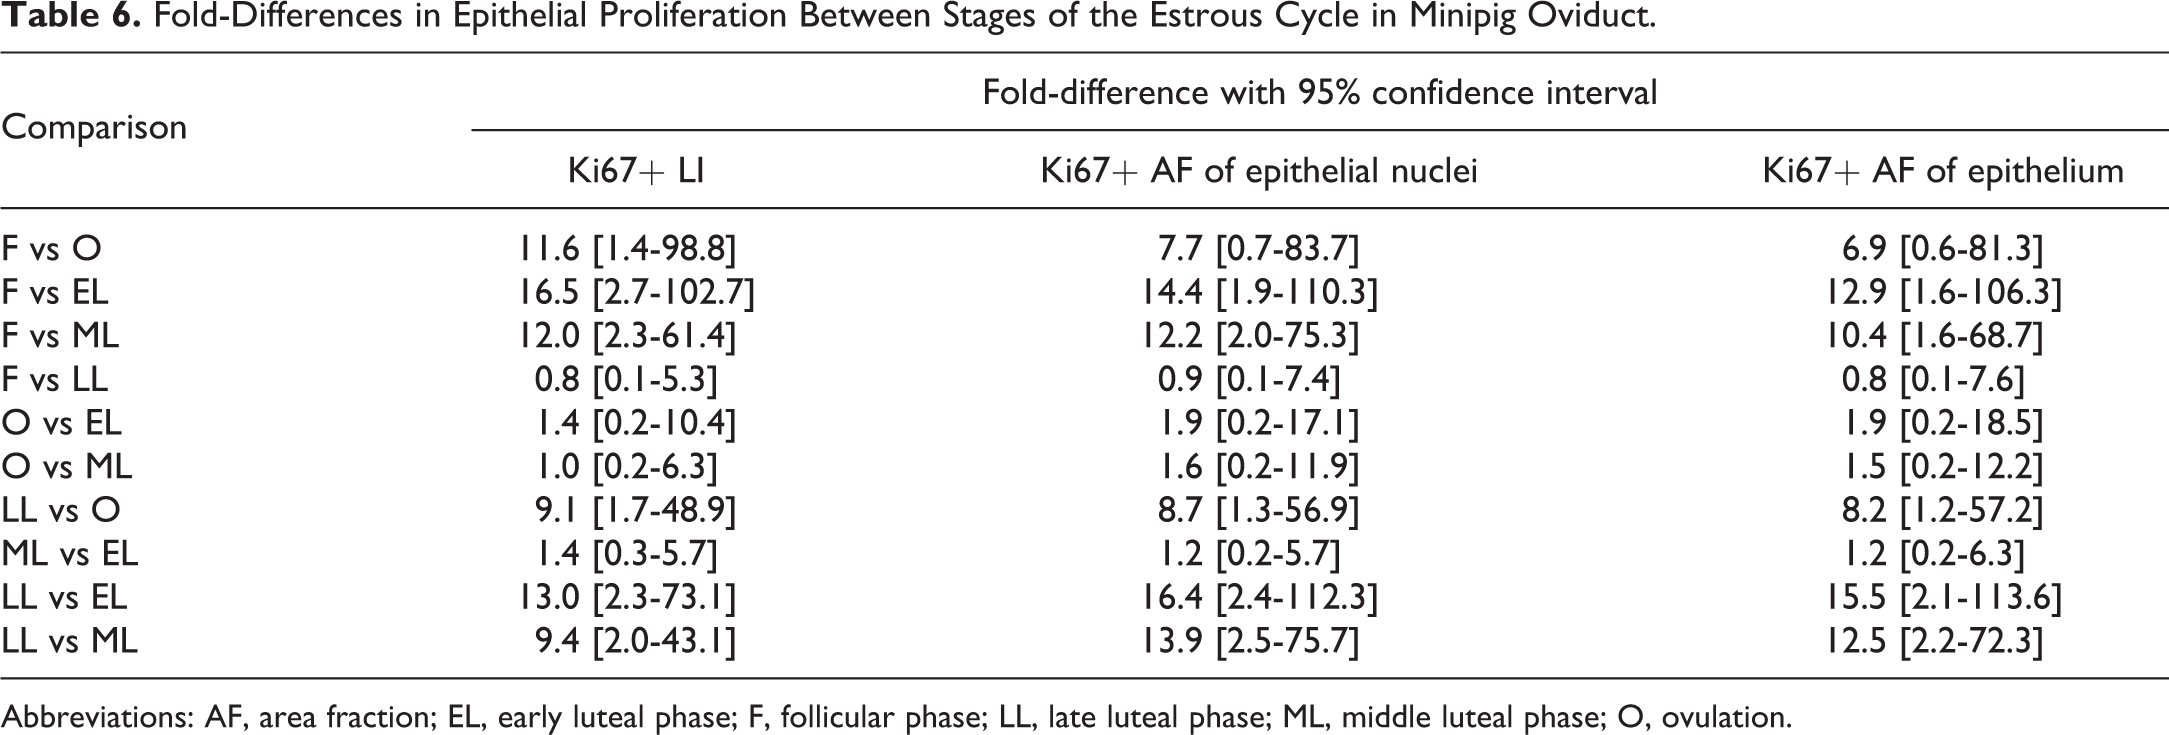
Abbreviations: AF, area fraction; EL, early luteal phase; F, follicular phase; LL, late luteal phase; ML, middle luteal phase; O, ovulation.
Correlation coefficients calculated on data sets where data from sections used for training of the classifying algorithm had been excluded were high and not significantly different from the correlation coefficients calculated on the full data sets (Table 7).
Pearson Correlation Coefficient Between End Points for Proliferation in Rat Mammary Gland With 95% CIs.
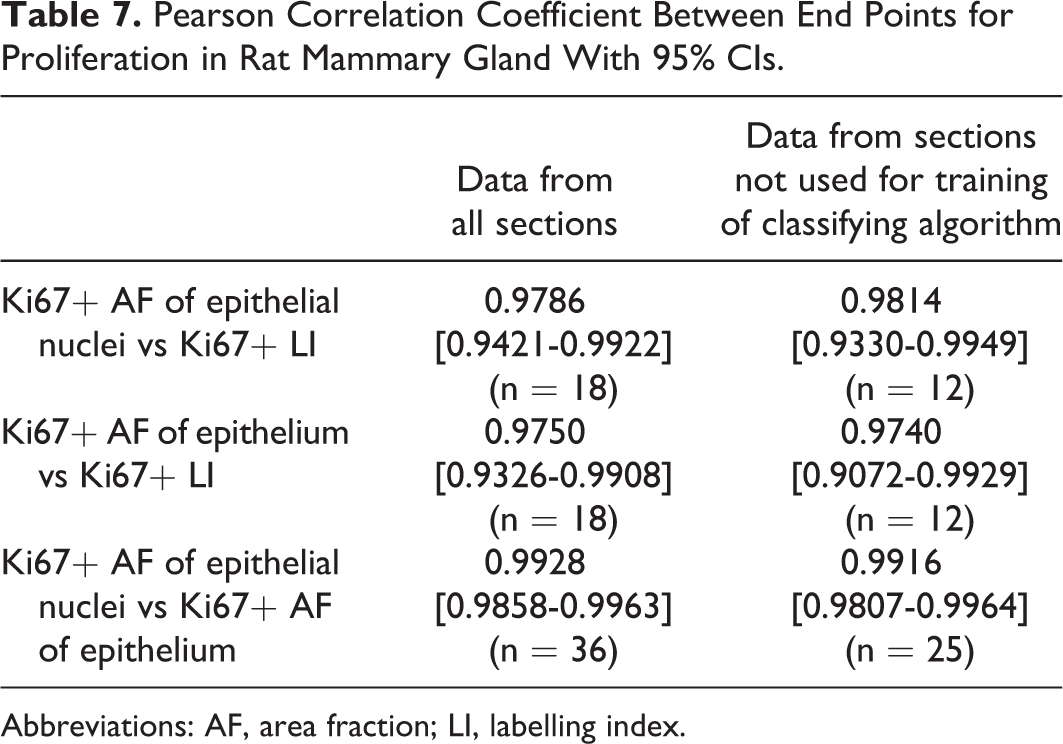
Abbreviations: AF, area fraction; LI, labelling index.
Oviductal Squamous Metaplasia Occurred as a Background Finding in Göttingen Minipigs
Uni- or bilateral oviductal squamous metaplasia was observed in 6 of the 18 minipigs. A representative picture of an oviductal squamous metaplasia is shown in Figure 6. As expected, Ki67+ cells were observed also in metaplastic areas (Figure 6B). To explore if presence of squamous metaplasia was indicative of exposure to factors which would influence epithelial proliferation in the oviduct in general, presence of squamous metaplasia was included as a fixed effect in the analysis of oviductal proliferation. Presence of squamous metaplasia did not have a significant effect on the proliferative activity (Supplementary Table 2).
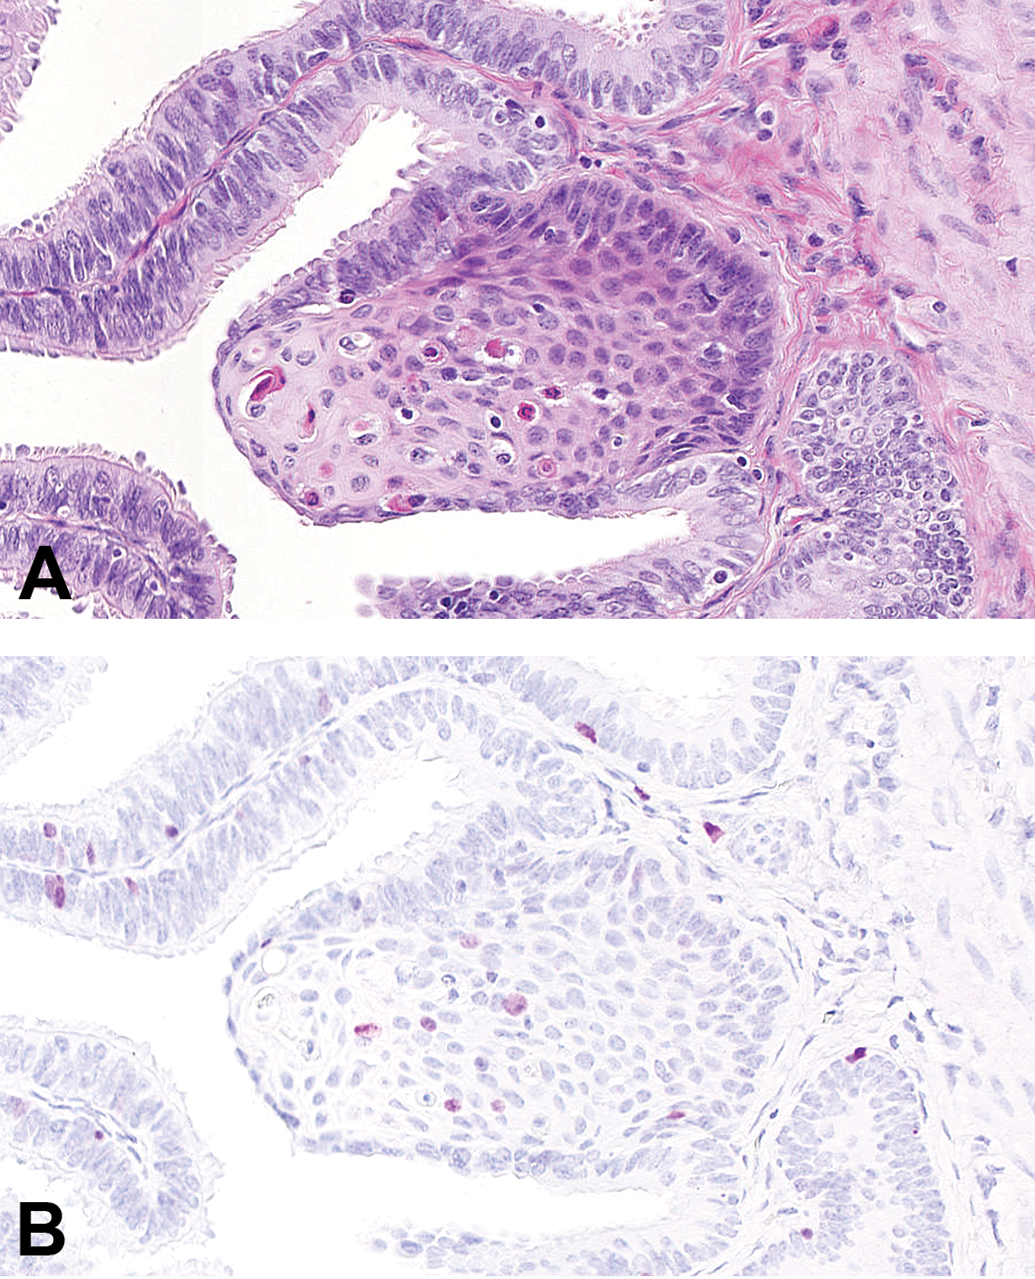
Oviductal squamous metaplasia in Göttingen minipigs. A, Oviductal squamous metaplasia in a minipig. HE. B, Ki67-staining of the metaplasia shown in panel A (a parallel section). Ki67+ cells were also observed in the oviductal squamous metaplasia. HE indicates hematoxylin and eosin.
Discussion
We demonstrate here that quantification of the fractional areas stained positive for BrdU or Ki67 in epithelium of rat mammary gland and minipig oviduct, respectively, correlate and agree well with the corresponding BrdU+ or Ki67+ LIs assessed by manual counting in the same tissue sections. Furthermore, data generated by DIA revealed differences between groups which were fully comparable to the results of analysis of the proliferation data generated by manual counting. Therefore, it is possible to use AI-based DIA for quantification of epithelial proliferation in samples of rat mammary gland and minipig oviduct.
In both rat mammary gland and minipig oviduct tissue, epithelial proliferation was strongly dependent on the estrous cycle, and proliferation in the rat mammary gland also increased significantly in animals treated with E&P. This has also been described in previous studies of the rat mammary gland, 21 -25 and highlights the dynamic nature of the rat mammary gland tissue. There is to our knowledge no previous studies which have demonstrated that oviduct epithelial proliferation in Göttingen minipigs is dependent on the estrous cycle, but distinct morphological changes in the oviduct epithelium during the phases of the estrous cycle have been reported previously in sows, 26 and other studies reported high proliferation in pig oviduct during the follicular phase 27 and during the late luteal phase in microminipigs. 28 Thus, in both rat mammary gland and minipig oviduct tissues, it is critically important to take the impact of the estrous cycle into account when proliferation is analyzed in toxicity studies.
We observed squamous metaplasia in oviduct sections from 6 of the 18 minipigs. This is a common background finding in Göttingen minipigs 29 and sows sent to abattoirs, 30 and literature data indicate that the incidence of focal squamous metaplasia increases with age in microminipigs. 31 However, our data indicate oviductal squamous metaplasia likely is underdiagnosed in minipigs. Furthermore, while the metaplastic cells have undergone a transformative process, we could not detect that occurrence of squamous metaplasia had any effect on proliferation in the oviductal epithelium.
Regarding DIA, our findings are in good agreement with a previous study which reported good agreement between Ki67+ Lis quantified with the same software as in this study and Ki67+ LIs assessed manually by a pathologist in breast cancer samples. 9 Similar observations have been reported with other platforms for DIA 8,11 and DIA-based assessment of proliferation in tumor samples has also been reported to agree well between different software packages. 8,9 Our findings are also in concordance with a recent study in rat mammary gland tissue, where a user-developed software was used for quantification of the Ki67+ LI. 14 In that study, an algorithm was developed for identification of glandular tissue, but the authors describe that this algorithm often misclassified adipose tissue or connective tissue as glandular tissue. Therefore, it was necessary to visually inspect all the classified areas and when needed, manually correct the algorithm classification. Our results demonstrate that it was possible to train a classifying algorithm which allows for sufficiently specific identification of glandular tissue in rat mammary gland sections, so time-consuming manual corrections generally can be avoided. Another advantage in our study is that the DIA was made on WSI of the rat mammary gland tissue, so potentially biased manual selection of mammary gland areas, as in the study by Lindauer et al, 14 is avoided. We developed this algorithm on BrdU-stained mammary gland sections, and the same methodology could be applied on Ki67-stained rat mammary gland sections for precise estimation of proliferation in epithelial compartments.
The commercial AI-based software application used in this study includes an analysis module intended for identification of individual cells. However, in our hands, this analysis module could not in a sufficiently specific manner identify single cells in rat mammary gland and minipig oviduct sections, where epithelial nuclei frequently cluster and overlap each other (data not shown). Therefore, we quantified the areas of nuclei stained positive for a given proliferation marker and normalized this to the total area of nuclei (positive and negative) or the area classified as epithelium. A previous study reported a high correlation between area and number of proliferating cells. 32 Furthermore, in the recent mammary gland study discussed above, it was in fact the area of positive and negative nuclei which was quantified, which subsequently was divided by a constant value for the average area per nucleus. 14
When different methods are used to quantify the same endpoint, for example, a Ki67+ LI, agreement between the methods is frequently shown using Bland-Altman plots. 9,14 We used manual counting to quantify the fraction of cells positive for a proliferation marker and DIA to quantify fractional areas stained positive for proliferation markers, that is, different endpoints for proliferative activity were quantified using different methods. It was therefore expected that there could be a systematic difference between the end points and methods. The size of cells and nuclei increase during the cell cycle in preparation for mitosis, 33 and a Ki67+/BrdU+ AF of epithelial nuclei could therefore be systematically larger than the Ki67+/BrdU+ fraction of cells in the same section. In fact, the BrdU+ and Ki67+ AFs of the epithelial nuclei were approximately 1.4- and approximately 1.2-fold larger than the corresponding BrdU+ and Ki67+ LIs, respectively (Figure 3E and 5E). The compartments classified as epithelium in mammary gland and oviduct sections comprised epithelial nuclei but also cytoplasmatic area. Since the BrdU+ and Ki67+ staining occurs in the nuclei, the AFs of the epithelium are therefore also expected to be systematically lower than the corresponding AFs of the epithelial nuclei. This was in fact also observed (Figure 3H and 5I).
Based on a previous study with rat caecum and colon, it has been suggested that differences between methods for quantification of a LI for a proliferation marker should be smaller than ±10%-points in order to be acceptable, 14,15 and Bland-Altman plots for quantification of agreement are typically made using absolute values for Ki67+ Lis. 9,14 However, on many of these published plots, absolute differences between methods increase as the absolute Ki67+ LI increase. Since we compared different endpoints for quantification of epithelial proliferation (LI vs AF), it would not make sense to apply an acceptance limit of maximum ±10%-points. Rather, relative differences between the methods were of interest, also because we aimed to quantify differences between groups as fold-differences. The Bland-Altman plots showed that the relative differences between manual counting and DIA generally were constant across tissues with low and high proliferative activity (Figure 3E and Figure 5E), although the rat mammary gland data set comprised a few sections with larger relative differences between manual counting and DIA (Figure 3E). However, it is important to remember that the applied counting method will result in an estimate of the “true” LI in the tissue section. In the 2 sections showing the highest discrepancy between manual counting and DIA, the proliferative cells were found in only 2 or 5 small clusters, with very high local proliferative activity. The LI based on counting of cells in a randomly sampled part of a tissue section will depend a lot on whether these very few clusters with positive cells are sampled or not. With DIA, the whole tissue section is analyzed, which we believe is a clear advantage.
In a previous study comparing DIA of Ki67 staining of sections from breast tumors to manual counting, heterogeneous clustering of positively stained cells was also observed to result in a difference between DIA and manual counting. 9 That study also reported that clustering and nuclear overlap of negative cells, Ki67 staining artefacts, and nuclear hematoxylin overstaining could result in large differences between manual counting and DIA. We observed the same issues, and it is important to perform a given IHC staining at the highest possible quality and as uniformly as possible across all tissue sections when endpoints must be quantified with DIA. In our study, variability in the counterstaining of nuclei with hematoxylin was a particular issue, requiring manual adjustment of the threshold for identification of negative nuclei between sections (see “Materials and Methods”). This problem could be solved by quantifying the area positive for a proliferation marker relative to the area of the epithelium. One might intuitively expect the AF of the epithelial nuclei to best resemble the manually counted LI, since the area classified as epithelium includes areas which are not nuclei. However, in both rat mammary gland and minipig oviduct sections, we found a near perfect correlation and good agreement between BrdU+/Ki67+AFs of the epithelial nuclei and BrdU+/Ki67+AFs of the area classified as epithelium (Figure 3G and 5H).
The aim of this study was to test DIA with a commercially available software based on AI on two case studies with a relatively limited number of animals and tissue sections. The aim was not to develop classifying algorithms which would work well on all possible rat mammary gland or minipig oviduct section to be analyzed in future studies. We believe these two cases resembles scenarios which a scientist working within the field of toxicologic pathology are likely to encounter, where it in a given study is necessary to quantify proliferation. We therefore did not divide the sections into training and test data sets when the results derived from the AI-based analyses were compared to the results from manual counting. In a situation with a real study, where no classifying algorithms have been defined beforehand, the same approach would be used. One could speculate that it then likely is necessary to manually outline large parts of the tissue sections in the study, and that use of a classifying algorithm will only save limited time compared to manually outlining the entire set of tissue sections. However, we used only approximately 1/6 to 1/3 of the tissue sections in the two cases for training, and the annotated areas covered on average <0.8% of each class in the oviduct sections and <1.3% of each class in the mammary gland sections (Table 3). It can then be argued that performance of a classifying algorithms will likely be overestimated when it is evaluated across sections used for training and sections not used for training. However, this was not the case in our study, likely because of the very low amounts of annotated areas in the sections used for training (see Tables 3, 5, and 7).
The time consumption for performing DIA of 36 oviduct sections, including training of the algorithm, was approximately 8 hours, for a user with experience with the chosen software application. In comparison, manual counting as done in the present study takes approximately 30 minutes per section. That is, manual counting of the 36 sections, allowing also time for repeated counting of some sections for validation of the random sampling method, would have taken approximately 20 to 22 hours. Digital image analysis was therefore at least twice as fast as manual counting. It should be noted that this case comprised a relatively low number of tissue sections and that the major part of the time was spent on drawing annotations and training the classifying algorithm. In a hypothetical study with a larger number of tissue sections, training of a classifying algorithm would have taken approximately the same amount of time. The largest benefits of DIA and AI will therefore be seen in large studies.
There are recent examples of studies where manual drawing of several hundred annotations for generation of classifying algorithms were avoided. In a study with breast cancer samples, the epithelial compartment was identified with IHC staining for cytokeratin. The area positive for cytokeratin was easily identified with DIA and saved as ROIs, which subsequently were pasted into and aligned in a digital image of a parallel section stained for Ki67. 9 In another study, mitotic cells were first identified with IHC staining for phospho-histone H3. The positive cells were identified with DIA and saved as annotations, which subsequently were transferred into a WSI of the same slide stained with HE (HE-staining had been performed after IHC staining for phospho-histone H3). The annotations were then used for training of an algorithm for identification of mitotic cells in HE-stained sections. 12 Such methods can be used for more time-efficient generation of annotations for training of algorithms and are likely to be used more in the future pathology studies.
In conclusion, quantification of epithelial proliferation in rat mammary gland and minipig oviduct can be done in a reliable fashion with a commercially available AI-based software. This software packages, and others alike, are useful and valuable tools, which can also be used for other types of histological analyses with quantitative readouts in the field of toxicologic pathology.
Supplemental Material
Supplemental Material, sj-docx-1-tpx-10.1177_0192623320950633 - Artificial Intelligence-Based Quantification of Epithelial Proliferation in Mammary Glands of Rats and Oviducts of Göttingen Minipigs
Supplemental Material, sj-docx-1-tpx-10.1177_0192623320950633 for Artificial Intelligence-Based Quantification of Epithelial Proliferation in Mammary Glands of Rats and Oviducts of Göttingen Minipigs by Henning Hvid, Mikala Skydsgaard, Nikolai K. Jensen, Birgitte M. Viuff, Henrik E. Jensen, Martin B. Oleksiewicz and Peter H. Kvist in Toxicologic Pathology
Supplemental Material
Supplemental Material, sj-docx-2-tpx-10.1177_0192623320950633 - Artificial Intelligence-Based Quantification of Epithelial Proliferation in Mammary Glands of Rats and Oviducts of Göttingen Minipigs
Supplemental Material, sj-docx-2-tpx-10.1177_0192623320950633 for Artificial Intelligence-Based Quantification of Epithelial Proliferation in Mammary Glands of Rats and Oviducts of Göttingen Minipigs by Henning Hvid, Mikala Skydsgaard, Nikolai K. Jensen, Birgitte M. Viuff, Henrik E. Jensen, Martin B. Oleksiewicz and Peter H. Kvist in Toxicologic Pathology
Supplemental Material
Supplemental Material, sj-tif-1-tpx-10.1177_0192623320950633 - Artificial Intelligence-Based Quantification of Epithelial Proliferation in Mammary Glands of Rats and Oviducts of Göttingen Minipigs
Supplemental Material, sj-tif-1-tpx-10.1177_0192623320950633 for Artificial Intelligence-Based Quantification of Epithelial Proliferation in Mammary Glands of Rats and Oviducts of Göttingen Minipigs by Henning Hvid, Mikala Skydsgaard, Nikolai K. Jensen, Birgitte M. Viuff, Henrik E. Jensen, Martin B. Oleksiewicz and Peter H. Kvist in Toxicologic Pathology
Supplemental Material
Supplemental Material, sj-tif-2-tpx-10.1177_0192623320950633 - Artificial Intelligence-Based Quantification of Epithelial Proliferation in Mammary Glands of Rats and Oviducts of Göttingen Minipigs
Supplemental Material, sj-tif-2-tpx-10.1177_0192623320950633 for Artificial Intelligence-Based Quantification of Epithelial Proliferation in Mammary Glands of Rats and Oviducts of Göttingen Minipigs by Henning Hvid, Mikala Skydsgaard, Nikolai K. Jensen, Birgitte M. Viuff, Henrik E. Jensen, Martin B. Oleksiewicz and Peter H. Kvist in Toxicologic Pathology
Supplemental Material
Supplemental Material, sj-tif-3-tpx-10.1177_0192623320950633 - Artificial Intelligence-Based Quantification of Epithelial Proliferation in Mammary Glands of Rats and Oviducts of Göttingen Minipigs
Supplemental Material, sj-tif-3-tpx-10.1177_0192623320950633 for Artificial Intelligence-Based Quantification of Epithelial Proliferation in Mammary Glands of Rats and Oviducts of Göttingen Minipigs by Henning Hvid, Mikala Skydsgaard, Nikolai K. Jensen, Birgitte M. Viuff, Henrik E. Jensen, Martin B. Oleksiewicz and Peter H. Kvist in Toxicologic Pathology
Footnotes
Authors’ Note
The raw data are available upon reasonable request from the corresponding author.
Acknowledgments
The authors wish to thank laboratory technicians Susanne Juul Rasmussen and Jette Mandelbaum for preparation and staining of histological sections.
Declaration of Conflicting Interests
The author(s) declared the following potential conflicts of interest with respect to the research, authorship, and/or publication of this article. Hvid, H., Skydsgaard, M., Jensen, N. K., Viuff, B. M., and Kvist, P. H. are employed by Novo Nordisk A/S. Hvid, H., Skydsgaard, M., Viuff, B. M., and Kvist, P. H. hold shares in the company.
Funding
The author(s) received no financial support for the research, authorship, and/or publication of this article.
Supplemental Material
Supplemental material for this article is available online.
References
Supplementary Material
Please find the following supplemental material available below.
For Open Access articles published under a Creative Commons License, all supplemental material carries the same license as the article it is associated with.
For non-Open Access articles published, all supplemental material carries a non-exclusive license, and permission requests for re-use of supplemental material or any part of supplemental material shall be sent directly to the copyright owner as specified in the copyright notice associated with the article.