
Abstract
A liquid chromatography–tandem mass spectrometry assay was developed and qualified for the multiplexed quantitation of a small molecule stimulator of soluble guanylate cyclase (sGC) and its target engagement biomarker, 3′,5′-cyclic guanosine monophosphate (cGMP), in ocular tissues and plasma from a single surrogate matrix calibration curve. A surrogate matrix approach was used in this assay due to the limited quantities of blank ocular matrices in a discovery research setting. After optimization, the assay showed high accuracy, precision, and recovery as well as parallelism between the surrogate matrix and the biological matrices (rabbit plasma, vitreous, and retina–choroid). This assay provided pharmacokinetic and target engagement data after intravitreal administration of the sGC stimulator. The nitric oxide-sGC-cGMP pathway is a potential target to address glaucoma. Increasing sGC-mediated production of cGMP could improve aqueous humor outflow and ocular blood flow. The sGC stimulator showed dose-dependent exposure in rabbit vitreous, retina–choroid, and plasma. The cGMP exhibited a delayed yet sustained increase in vitreous humor but not retina–choroid. Multiplexed measurement of both pharmacokinetic and target engagement analytes reduced animal usage and provided improved context for interpreting PK and PD relationships.
Introduction
The molecule 3′,5′-cyclic guanosine monophosphate (cGMP) is a biomarker of interest in drug discovery because of its role as a secondary messenger in amplifying a wide range of signals from extracellular molecules and cues. 1 The cGMP’s signal amplification occurs through binding to nucleotide-gated ion channels 2 or to target proteins that control downstream effects. 3 In the ocular space, cGMP demonstrates both these mechanisms with its regulatory role in visual phototransduction and fluid flow in the eye.
The cGMP-gated ion channels mediate visual phototransduction by gating ion channels depending on the presence or absence of light. In the dark, high levels of cGMP keep ion channels open. Upon exposure to light, a signaling cascade activates phosphodiesterases (PDEs) to degrade cGMP causing the ion channels to close. The resulting change in current continues the signaling cascade and leads to excitation of retinal nerves. 4
The cGMP levels also play a role in aqueous humor outflow from the anterior chamber and blow flood in the eye. A proposed mechanism for cGMP mediation of fluid flow is through activation of a cGMP-dependent protein kinase which in turn phosphorylates multiple downstream targets. 5 These targets promote relaxation of the trabecular meshwork to allow outflow of aqueous humor or relaxation of vascular smooth muscle to increase blood flow. 6
Poor regulation of aqueous humor flow and impaired blood flow through the optic nerve head are risk factors for glaucoma. 7 -9 The nitric oxide (NO)–soluble guanylate cyclase (sGC)-cGMP pathway has been explored as a potential target to address these underlying risk factors for glaucoma. 10 -13 In this pathway, NO binds to sGC and leads to the production of cGMP, which in turn triggers downstream effects on aqueous humor and blood flow. Our discovery research effort explored the ability of small molecule stimulators to engage sGC to increase cGMP production and potentially improve blood flow at the back of the eye.
Accurate and precise measurements of both the sGC stimulator and cGMP are required to contextualize target engagement studies. Commercially available kits are available for measuring cGMP using radioimmunoassay (RIA) or enzyme-linked immunosorbent assay (ELISA), and many liquid chromatography–tandem mass spectrometry (LC-MS/MS) assays have been reported. 14 -19 While ELISA and RIA are more sensitive than LC-MS/MS, they cannot be easily adapted to measure a small molecule compound. Furthermore, the specificity of mass spectrometry allows for multiplexed measurements of cGMP alongside other analytes given proper sample preparation. This ability to concurrently measure a drug substance and its target engagement biomarker in multiple matrices is time- and resource-sparing and provides a conveniently linked data set for future analysis. 20
Here, we present an LC-MS/MS bioanalytical assay to support our discovery program on the NO-sGC-cGMP pathway. We measure a small molecule sGC stimulator and its target engagement biomarker, cGMP, in ocular tissues and plasma through a surrogate matrix approach. The assay provides pharmacokinetic and target engagement data after intravitreal administration of an sGC stimulator.
Materials and Methods
Reagents
3′,5′-cyclic guanosine monophosphate was obtained from Sigma-Aldrich. An internal standard cocktail of 1-µM cGMP 13C15N2 (Toronto Research Chemicals), 200 nM labetalol, 200 nM imipramine, and 200 nM diclofenac (Cerilliant) in acetonitrile (ACN) was used. Control matrix for qualification experiments (Dutch-Belted rabbit plasma, vitreous, and retina) was obtained from BioIVT.
Assay Development
Nonspecific binding of sGC stimulator to conical tubes was tested by spiking 1-mL vitreous with 0.05-µM sGC stimulator and transferring the vitreous across multiple tubes. The same pipette tip was used for all transfers. A 50 µL aliquot of vitreous was taken for analysis by LC-MS after the first, third, and seventh transfers. Vitreous aliquots were analyzed via LC-MS/MS following the procedure described below. To test the effect of ACN on nonspecific binding, the same process was repeated with a solution of ACN and vitreous (3-mL ACN, 1-mL vitreous).
Stability of cGMP in tissue was tested by spiking 400 µL of rabbit vitreous, retina–choroid homogenate, plasma, or blood with 2-µM cGMP. Retina–choroid homogenate was prepared by adding 300-µL 4% bovine serum albumin (BSA) in phosphate-buffered saline (PBS) to 100-mg retina–choroid and homogenizing with 2-mm ceramic beads. Matrices were prechilled on ice for 30 minutes prior to addition of cGMP. A 50 µL aliquot of each matrix was taken for analysis by LC-MS at 5, 15, 30, and 60 minutes. Matrix aliquots were analyzed via LC-MS/MS following the procedure described below. To test the effect of ACN on cGMP degradation, the same process was repeated with a mixture of ACN and vitreous or retina–choroid homogenate (1.2-mL ACN, 400-µL matrix).
Suppression of cGMP ionization by matrix interference was evaluated by injecting ACN extracted vitreous or vitreous with 1% polyethylene glycol (PEG) through the LC, infusing a 500-nM solution of 13C15N2 cGMP at 5 µL/min into the post-column flow, and monitoring for a change in 13C15N2 cGMP signal over the gradient time course. LC-MS conditions were the same as used for study samples.
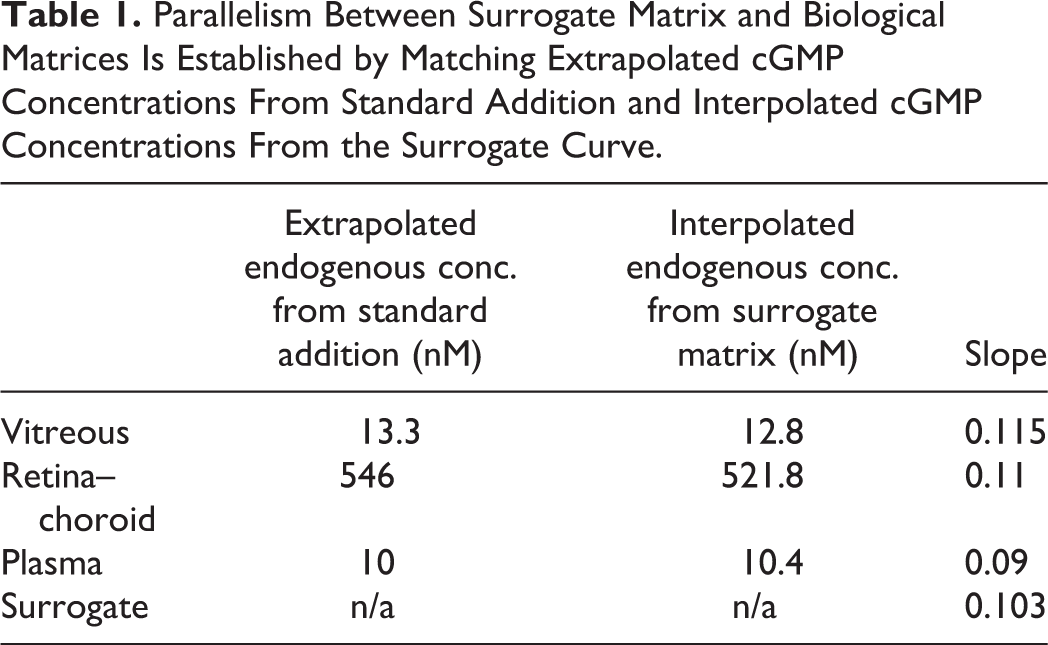
Parallelism for cGMP between surrogate matrix (4% BSA in PBS) and biological matrices (plasma, vitreous humor, and retinal–choroid homogenate) was assessed by a standard addition approach. 21 The cGMP was dispensed into surrogate and biological matrices to create triplicate calibration curves. Endogenous cGMP concentrations were found either through extrapolation of biological matrix curves to the negative x-intercept or interpolation using the surrogate matrix curve.
Standard Curve Calibrators, QC Sample, and Study Sample Preparation
Analytes for standard curve calibrators were dispensed into individual wells by an HP D300 Digital Dispenser with final cGMP and sGC stimulator concentrations of 0.001, 0.005, 0.01, 0.05, 0.1, 0.5, 1, 5, and 10 nmol/g after addition of surrogate matrix (4% BSA in PBS). Calibrators were freshly dispensed in triplicate for each analysis.
Analytes for quality control (QC) samples were dispensed into individual wells with final spiked cGMP and sGC stimulator concentrations of 0.001, 0.003, 0.5, and 7.5 nmol/g after addition of biological matrix. Biological matrix QC samples contained 1-mM 3-isobutyl-1-methylxanthine (IBMX) to prevent cGMP degradation while analytes equilibrated with a matrix. Homogenates for retina–choroid QC samples were prepared by adding 4% BSA in PBS as homogenizing diluent to retina–choroid at a ratio of 3 µL/1 mg tissue, followed by homogenization with 2-mm ceramic beads. Calibrators, plasma, and vitreous were also mixed at a ratio of 3-µL diluent per 1-mg matrix. After equilibration with analytes, calibrator and QC samples were mixed with an internal standard cocktail at a ratio of 12-µL internal standard cocktail per 1-mg biological matrix and then centrifuged to pellet the precipitated proteins.
Study samples were added to pre-tared tubes containing known volumes of ACN containing internal standard cocktail immediately after dissection to stop PDE activity and prevent ex vivo degradation of cGMP. Tissue weights were determined after weighing the tared tubes. Additional diluent and internal standard cocktail were added to maintain the same ratios as seen in calibrators and QC samples (3-µL diluent per 1-mg biological matrix, 12-µL internal standard cocktail per 1-mg biological matrix). Study samples were then homogenized with 2-mm ceramic beads.
Supernatants from calibrators, QC, and study samples were transferred to wells containing an equal volume of water with 0.1% formic acid and analyzed by LC-MS.
LC-MS Conditions
Chromatographic separation was performed on a Waters Acquity I-Class UPLC with a Waters HSS T3 1.8-µm, 2.1 × 100 mm column maintained at 40 °C with a flow rate of 0.4 mL/min. Mobile phase A consisted of water with 0.1% formic acid, and mobile phase B consisted of ACN with 0.1% formic acid. The initial condition of 100% A was held for 0.5 minutes, followed by a linear gradient to 95% B for 2 minutes, held at 95% B for 0.5 minutes, followed by equilibration back to 100% A. Samples were stored in an autosampler maintained at 10 °C. Two-µL of extracted samples were injected.
Mass spectrometer quantitation was performed on a Waters Xevo TQ-XS Triple Quadrupole with electrospray ionization under positive mode. Settings such as source temperature (150 °C), desolvation temperature (600 °C), capillary voltage (2 kV), and desolvation gas flow (1200 L/h) were optimized manually. Mass spectrometer settings for cGMP, the sGC stimulator, and the internal standard cocktail were optimized with the Intellistart procedure of Waters MassLynx. The cocktail contained a stable isotope-labelled 13C15N2 cGMP as an internal standard for cGMP, and diclofenac, imipramine, and labetalol as generic internal standards for compounds with a wide range of polarities. Imipramine was used as the internal standard for the sGC stimulator. Multiple reaction monitoring transitions for imipramine, cGMP, and 13C15N2 cGMP were 281/193, 346/152, and 350/155, respectively. cGMP and 13C15N2 cGMP eluted at 1.74 minutes. Dwell times for all analytes were assigned with the auto-dwell function to ensure 15 points across the peak.
Animal Care and Handling
All of the animal procedures described herein were approved by the IACUC and performed in an AAALAC-accredited facility. All animals were housed with a 12:12 hour light:dark cycle. Male Dutch-Belted rabbits were sourced from Covance. Male C57BL/6 mice were sourced from Taconic. Certified High-Fiber Rabbit Diet 5326 and hyper chlorinated water were available ad libitum. Experiments were conducted according to the ARVO Statement for the Use of Animals in Ophthalmic and Vision Research.
Ex Vivo Target Engagement With Retinal Explant
Two freshly harvested retinas from male C57BL/6 mice were incubated in each well containing 1-mL Neurobasal medium (Gibco) with 1× B-27 with increasing concentrations of sGC stimulator (0.003-3 µM) in the presence of 5% O2. Each concentration was tested as a single replicate. Pairs of retinas weighed between 5 and 10 mg. After 4 hours, retinas were collected into pre-tared tubes containing known volumes of ACN and analyzed via LC-MS/MS following the procedure described above.
Intravitreal Injection
The intravitreal injection procedure was adapted from previous literature. 22 Rabbits were anesthetized with a cocktail of ketamine (25 mg/kg) and xylazine (5 mg/kg), and topical 0.5% proparacaine hydrochloride eye drops. Pupils were then dilated with 1 to 2 drops of 1% tropicamide. With the eye held open with a speculum and stabilized with a pair of forceps, 20 µL of vehicle or drug-dosing solution was injected with a 31G needle 1 mm posterior to the limbus. The injection site was pressed with a cotton swab and the rabbit was placed on a warming pad to recover. The ointment was also applied to the eyes to prevent corneal dryness during recovery.
Pharmacokinetic and Target Engagement Study
Intravitreal injections of 20-µL vehicle (20:60:20% wt/wt/vol dimethyl sulfoxide [DMSO]: PEG200:5 mM phosphate buffer pH 7.5) or sGC stimulator at 4, 20, and 100 µg/eye were carried out in male Dutch-Belted rabbits with bilateral injections in order to minimize animal use. Rabbit weighed approximately 2 kg. Briefly, 20 g of DMSO and 60 g of PEG200 were mixed with 5 mM phosphate buffer pH 7.5 (qs) in a 100-mL volumetric flask. The vehicle was filtered through a 0.2-µm filter unit (Thermo Scientific Nalgene) before use. Different concentrations of sGC stimulator were prepared at 4, 20, and 100 µg/20 µL vehicle. Two rabbits were used for each time point and dosing group for a total of 24 rabbits. At 1, 4, and 24 hours of time points, rabbits were physically restrained with an in-house manufactured restrainer. A sample of 0.5 to 1 mL of blood was collected from the ear vein and immediately dispensed into blood collection tubes containing K2EDTA. Rabbits were then euthanized with 1-mL pentobarbital (390 mg/mL, intravenous [IV]). Blood samples were centrifuged at 6000 rpm for 6 minutes at 4 °C to collect plasma. Eyeballs were enucleated, snap-frozen in liquid nitrogen, and stored at −80 °C. The frozen eyeballs were dissected on a clean board and vitreous humor and retina–choroid tissue samples collected into pre-tared tubes containing known volumes of acetonitrile.
Intraocular Pressure, Mean Arterial Pressure, and Fundus Imaging
Intraocular pressure (IOP), mean arterial pressure (MAP), and fundus imaging measurements were carried out at baseline and prior to the 24-hour time point of the pharmacokinetic/target engagement study. All 3 measurements were completed under 30 minutes per rabbit.
The IOP measurement procedure was adapted from the previous literature. 23 Rabbits were restrained and locally anesthetized with topical 0.5% proparacaine hydrochloride eye drops. A Tono-Pen transducer was touched lightly to the central cornea to record IOP. The average of 2 to 3 readings was used for data analysis.
Rabbits were then anesthetized with a ketamine/xylazine cocktail as previously described to prepare for MAP measurements. A 24G sterile IV catheter was inserted into the ear artery with 0.9% saline with heparin (20-500 IU/mL) as catheter lock. The catheter tip was connected to a pressure transducer via a sterilized 3-way adaptor and MAP was recorded.
Rabbit pupils were dilated with tropicamide as previously described to prepare for fundus imaging. Images were obtained for both eyes using a Heidelberg SLO confocal scanning ophthalmoscope to evaluate inner retina vasculature response. Vessel diameters were quantified from the average of 3 pixel measurements on the left and right side of the optic nerve head. Identical sections were measured at baseline and at 24 hours.
Data Analysis and Statistical Methods
Acquired mass spectrometry data were processed with Waters TargetLynx. Calibration curve analyte/internal standard peak area ratios were plotted against nominal concentration values with 1/x 2 weighting. Concentrations of unknown samples were quantified using peak area ratios against their respective calibration curves. 13C15N2 cGMP and imipramine were used as internal standard for cGMP and the sGC stimulator, respectively.
Assay accuracy and precision were calculated as follows: % deviation = (mean − nominal)/nominal) and % CV = SD/mean). Lower and upper limit of quantitation were set based on concentrations with acceptable accuracy and precision (15%). Recovery was calculated as mean preprocessed spike peak area ratio/mean post-processed spike peak area ratio and matrix effect was calculated as (mean post-processed spike peak area ratio/mean neat spike peak area ratio) − 1.
Statistics were analyzed with Graphpad Prism. Measurements from rabbits eyes were treated as independent from each other as each eye received a separate intravitreal injection. A nonparametric approach was used as the small sample size did not allow for testing normality. Target engagement (cGMP) statistics were assessed with Kruskal–Wallis tests and multiplicity adjustment across dose groups was performed with Dunn method. Pharmacodynamic statistics (IOP, MAP, and vessel diameter) were assessed with Wilcoxon signed-rank tests for baseline and 24-hour measurements. Significance was assigned to P values ≤ .05.
Results
Bioanalytical Assay Development
Preliminary experiments were performed to explore potential weak points in the bioanalytical assay and guide method development. Low recovery measurements pointed toward complications unique to ocular tissues and cGMP. Furthermore, matrix effect measurements suggested an excipient from a proposed dosing solution may impact mass spectrometry signal (data not shown).
Nonspecific binding of typically lipophilic small molecule drugs to laboratory plastic is a common concern in bioanalysis, 24,25 especially when using matrices with relatively low protein content such as vitreous humor. When vitreous spiked with 0.05-µM sGC stimulator was transferred across multiple conical tubes, recovered compound levels were successively lower (Figure 1). This observation indicates nonspecific binding in vitreous may be a liability for an assay to accurately measure drug concentrations from in vivo samples. Plasma-containing sGC stimulator did not have this nonspecific binding issue (data not shown). Addition of ACN directly to the conical tube containing all the dissected vitreous prevented loss of the drug due to nonspecific binding.
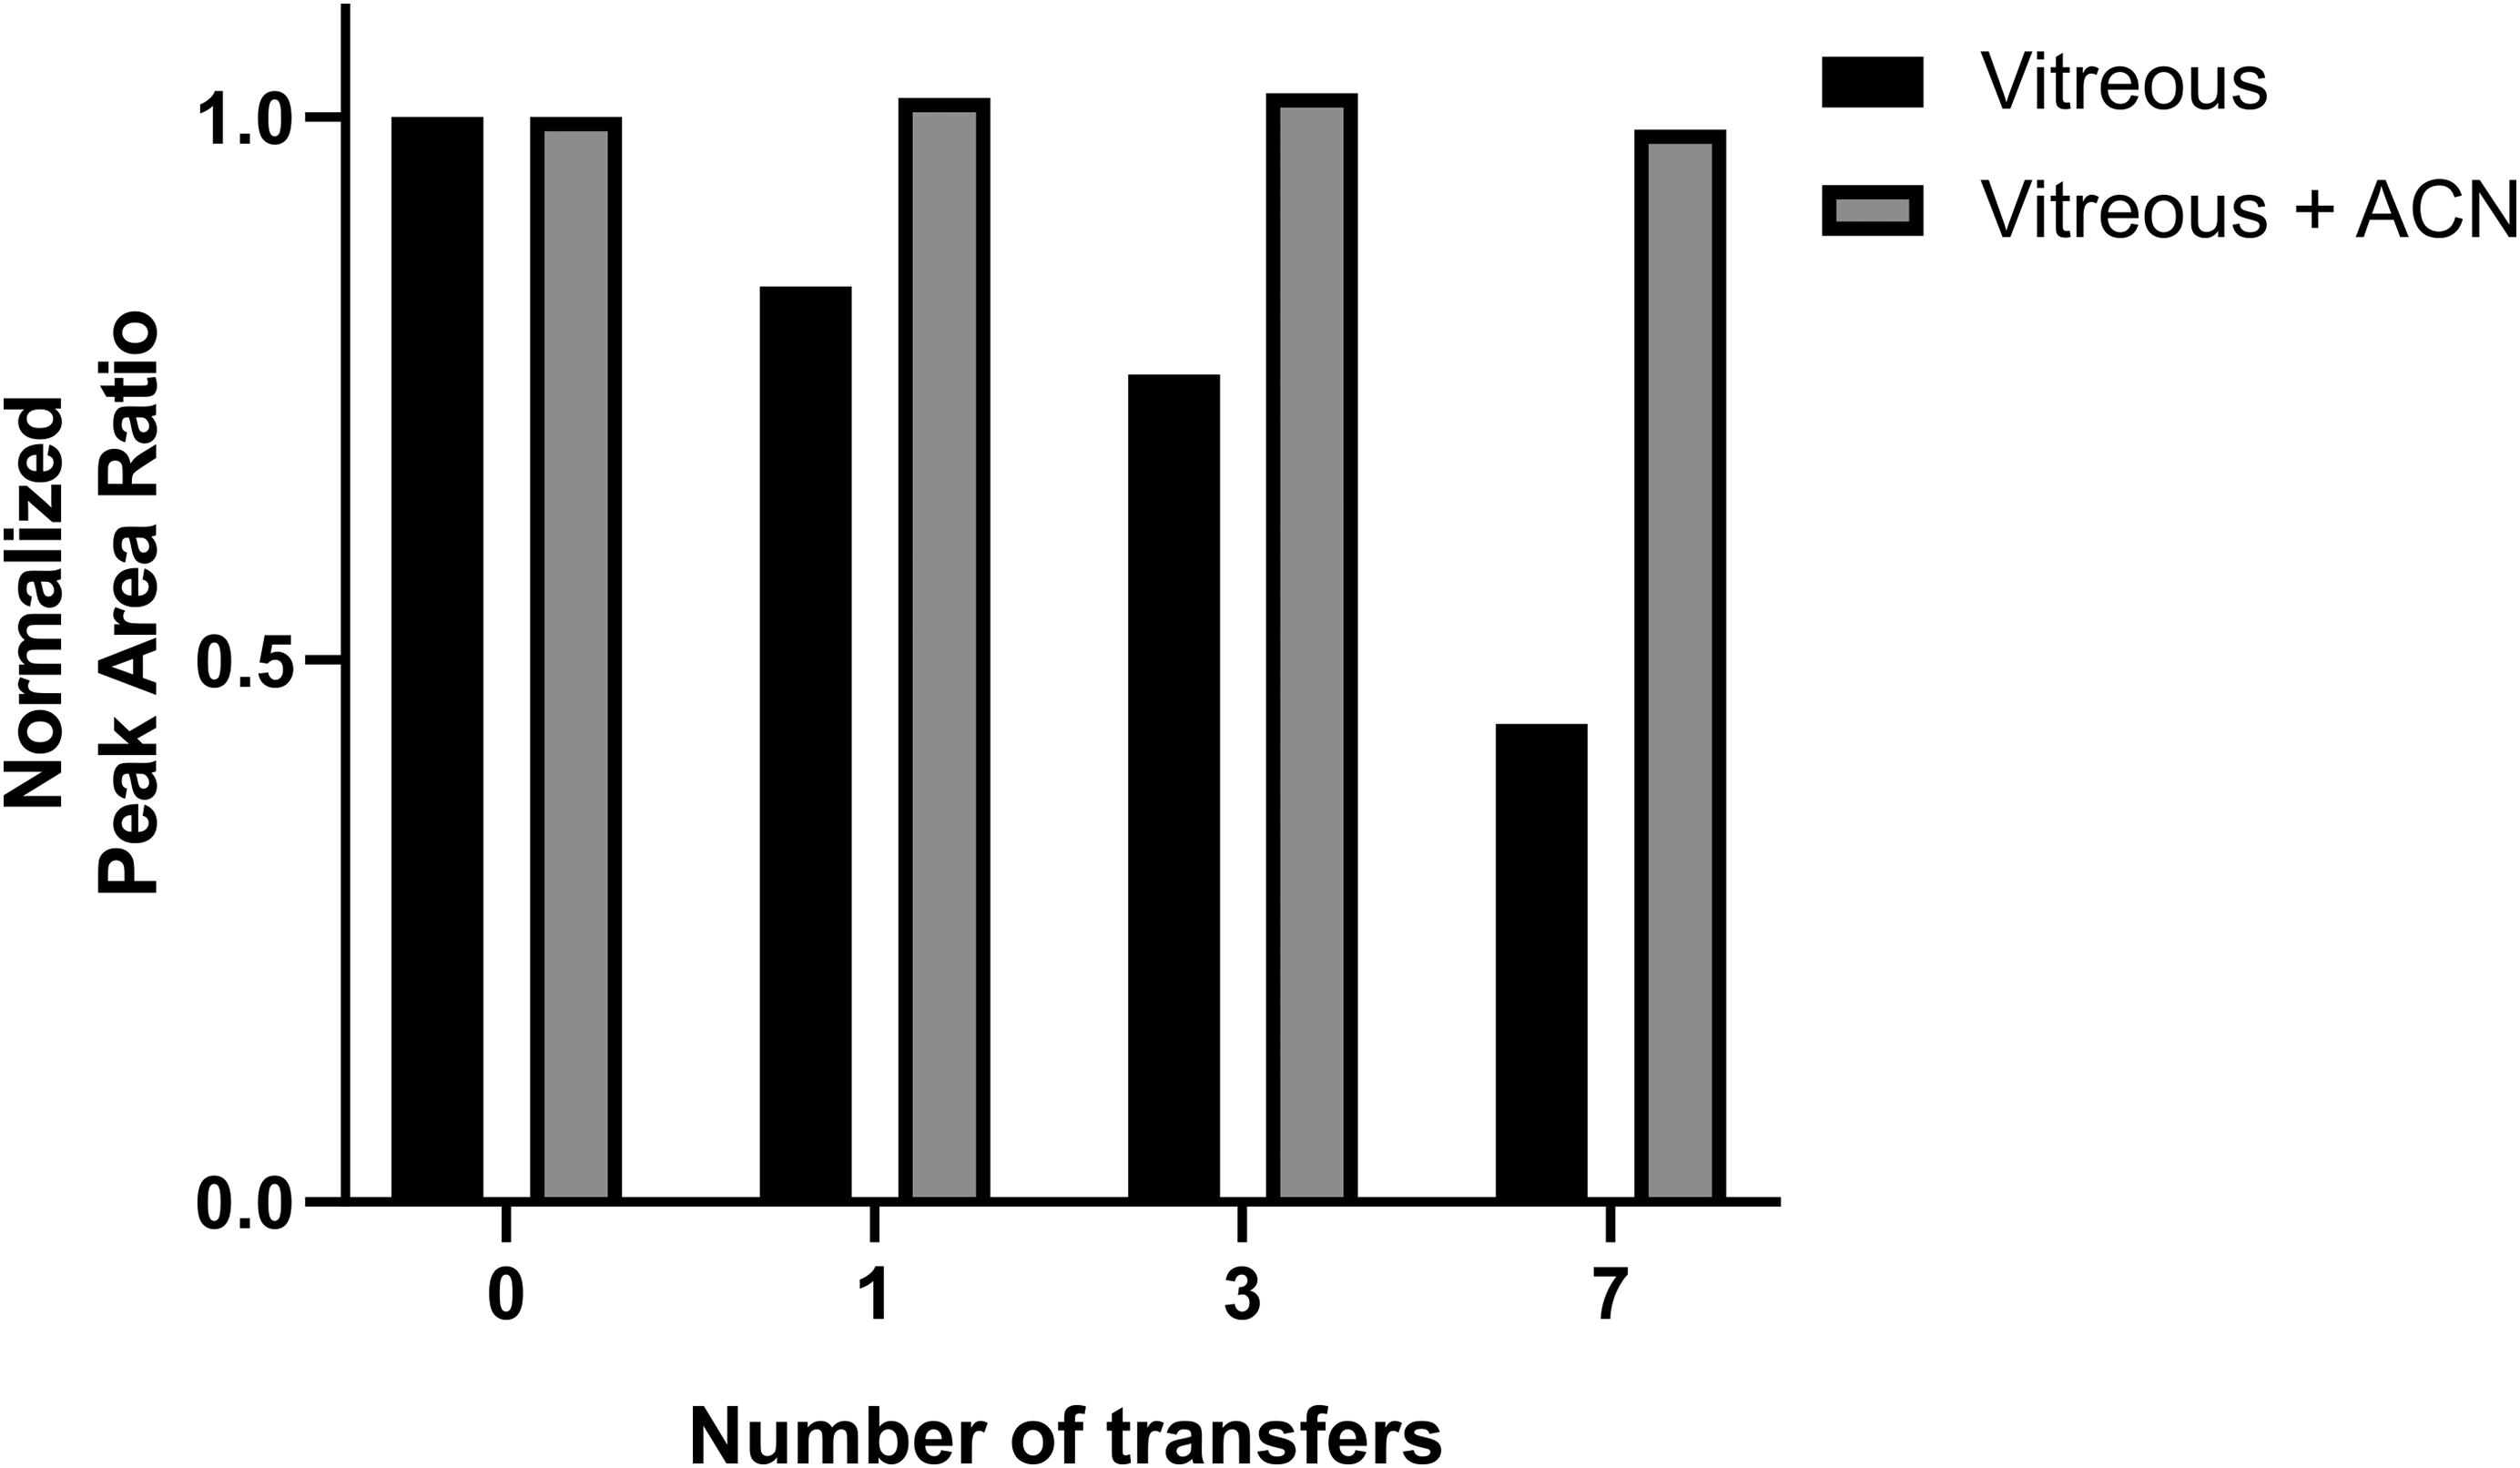
Lipophilic sGC stimulator was lost as spiked vitreous was transferred across multiple conical tubes. Addition of acetonitrile prevented loss of compound due to nonspecific binding to the plastic. sGC indicates soluble guanylate cyclase.
Phosphodiesterases will continue to degrade cGMP in tissue samples post-dissection, leading to measurements that do not reflect conditions at the study time point. To study this degradation, vitreous, retina–choroid homogenate, plasma, and blood were spiked with cGMP and incubated on ice (Figure 2). Even under chilled conditions, cGMP rapidly degraded in vitreous humor and retina–choroid homogenate. In contrast, cGMP was stable in blood and plasma with no degradation out to 1 hour. To preserve the levels of cGMP in dissected vitreous and retina–choroid samples, ACN containing an internal standard cocktail was added to denature PDEs and halt cGMP degradation. This choice also aligned the assay with our solution to nonspecific binding, and with routine protein precipitation methods that use an organic solvent as a precipitant for sample cleanup.
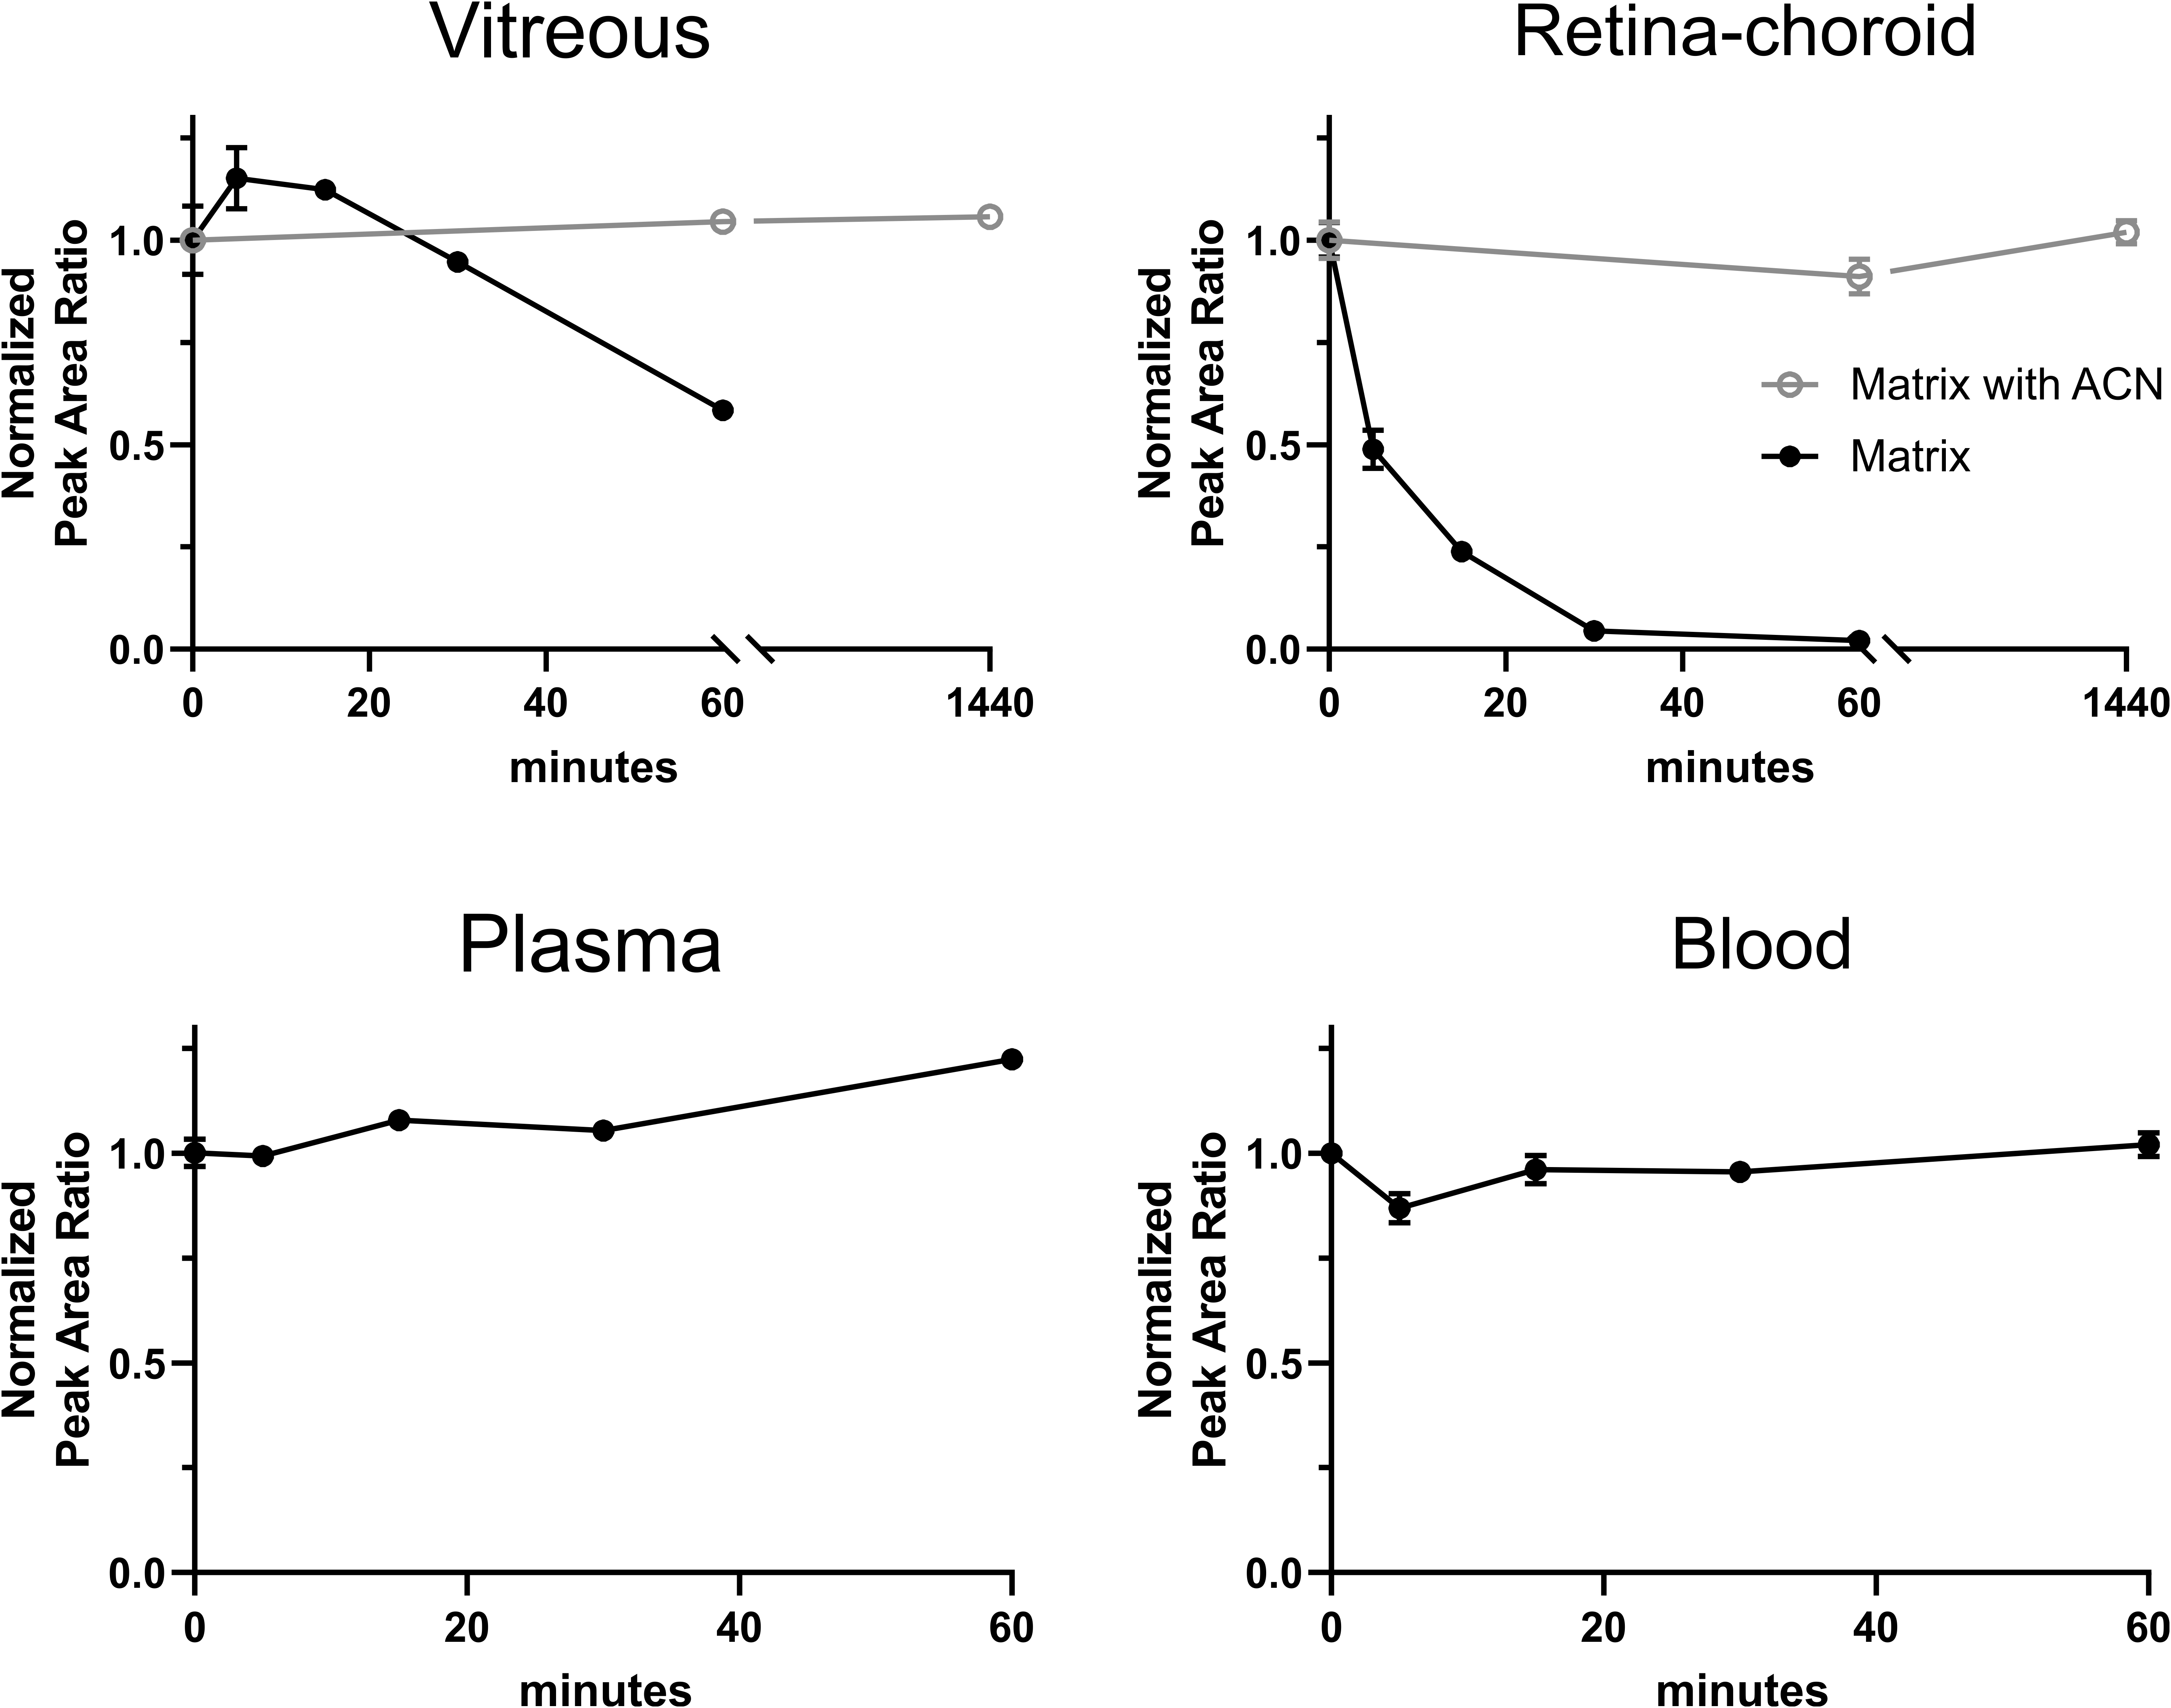
cGMP was unstable in vitreous and retina–choroid homogenate on ice but remained stable if acetonitrile was added to denature PDEs. cGMP was stable in plasma and blood on ice. Mean and SE of the mean from 3 replicates are shown. cGMP indicates 3′,5′-cyclic guanosine monophosphate.
Polyethylene glycol is a common excipient used in dosing solutions, but it can potentially interfere with LC-MS measurements due to ionization suppression of certain co-eluting compounds. 26 Initial LC-MS runs using a 50-mm Waters HSS T3 column and a generic 2.5-minute gradient from 5% to 95% ACN 27 showed PEG and cGMP co-eluted with strong suppression. If uncorrected, this suppression would result in under-measurement of cGMP. Switching to 100% aqueous mobile phase starting conditions and a 100 mm column Waters HSS T3 column achieved separation between cGMP elution and the region of PEG suppression as shown in the tee-infusion results in Figure 3. Changes in signal show how analyte ionization changes with mobile phase composition and the presence of matrix. Stable-isotope labeled 13C15N2 cGMP was used to avoid confounding signal from endogenous cGMP.
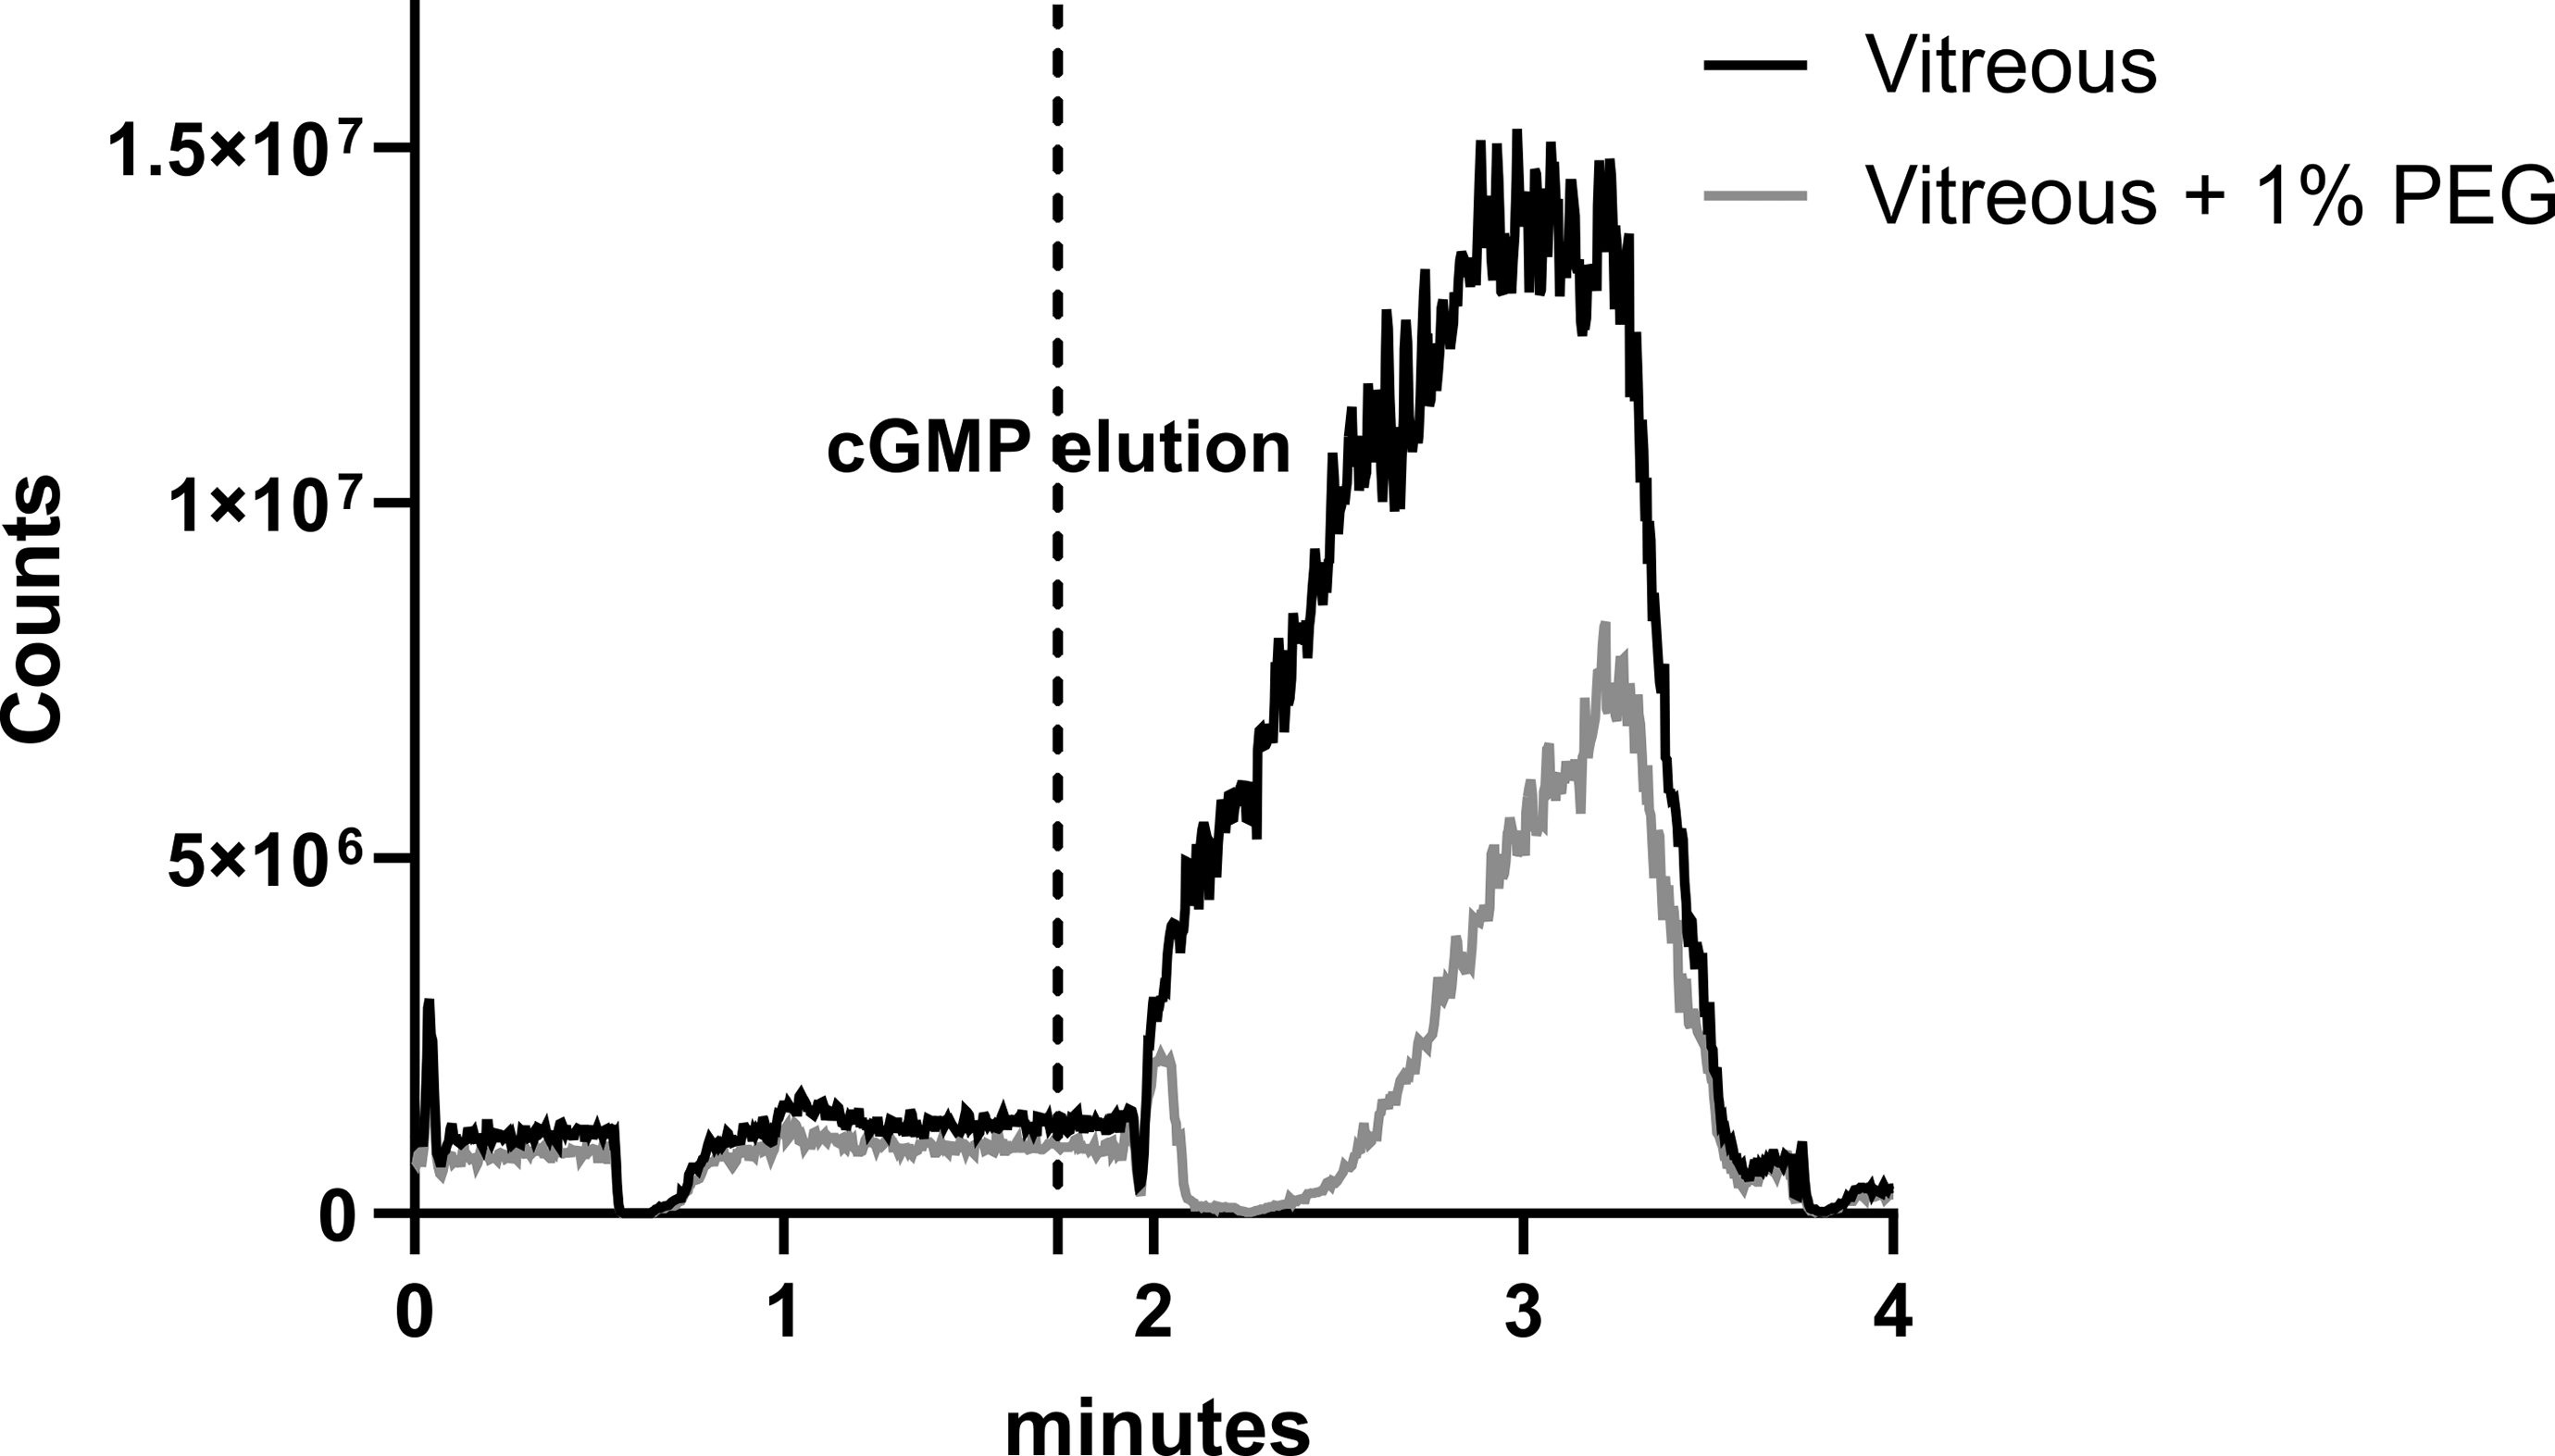
Mass spectrometry counts from post column infusion of 13C15N2 cGMP with an injection of protein precipitated vitreous or vitreous + 1% PEG show suppression due to PEG. The cGMP analyte elutes prior to the region of PEG ionization suppression of cGMP.
Assay Qualification
Our qualification experiments sought to demonstrate that we could accurately and precisely measure the sGC stimulator and cGMP in vitreous, retina, and plasma using a single surrogate matrix calibration curve with uniform influence from recovery and matrix effect. A standard addition parallelism experiment was also performed to establish parallelism between biological matrices and the surrogate matrix. 21
Similar to the sample preparation procedure for study samples, biological matrices in these assay qualification experiments were diluted and homogenized (if necessary) with surrogate matrix to even out any recovery/matrix effect between matrices. One key difference from unknown study samples was that assay qualification samples were prepared with a PDE inhibitor, IBMX. 1-mM 3-isobutyl-1-methylxanthine prevented cGMP degradation while analytes equilibrated with the matrix.
Phosphate-buffered saline with 4% bovine serum albumin 28 was selected as surrogate matrix for vitreous humor, retina–choroid, and plasma based on standard addition parallelism experiments. Back-extrapolated cGMP concentrations from standard addition matched interpolated values from the surrogate curve within 5%. Additionally, slopes of calibration curves produced from the biological matrices agreed well with the surrogate matrix curve (Table 1). It is important to note that this experiment only establishes parallelism and should not be overinterpreted to determine cGMP concentrations in naive rabbit tissue as blank plasma and ocular tissues were purchased from commercial sources with no special precautions taken against ex vivo cGMP degradation.
Parallelism Between Surrogate Matrix and Biological Matrices Is Established by Matching Extrapolated cGMP Concentrations From Standard Addition and Interpolated cGMP Concentrations From the Surrogate Curve.
Recovery and matrix effect for sGC stimulator and cGMP in plasma, vitreous, vitreous with 1% PEG, retina–choroid, and surrogate matrix were evaluated with preprocessing spike, post-processing spike, and neat spike. Samples were spiked at the medium QC level (0.5 µM) followed by protein precipitation. Values for cGMP were evaluated using the stable-isotope labelled 13C15N2 cGMP to avoid confounding signal from endogenous cGMP. Recovery was calculated as mean preprocessed spike peak area ratio/mean post-processed spike peak area ratio and matrix effect was calculated as (mean post-processed spike peak area ratio/mean neat spike peak area ratio) − 1.
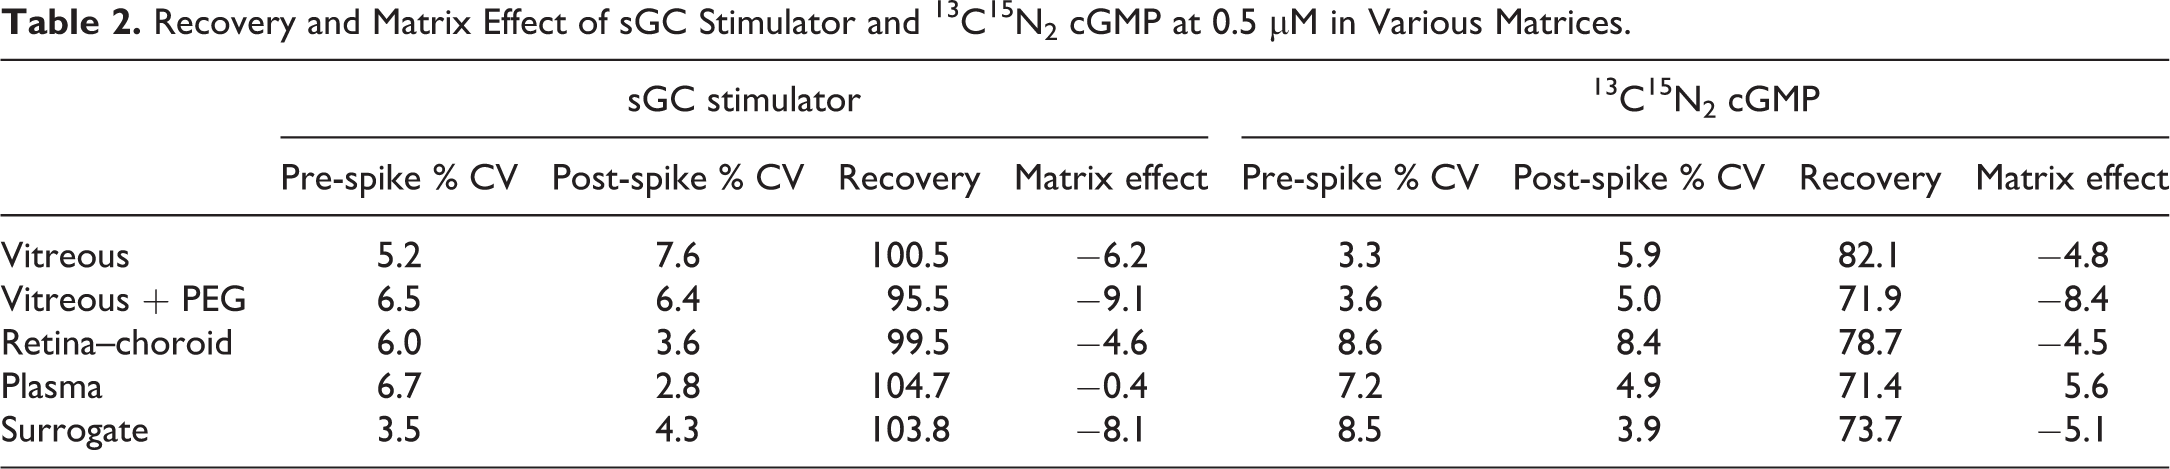
Protein precipitation was sufficient to reach full recovery of sGC stimulator from all matrices with minimal matrix effect and variability. Recoveries of cGMP were lower but still uniform with minimal matrix effects. Importantly, vitreous with 1% PEG showed little difference for recovery and matrix effect indicating chromatographic separation could prevent any impact of PEG suppression (Table 2).
Recovery and Matrix Effect of sGC Stimulator and 13C15N2 cGMP at 0.5 µM in Various Matrices.
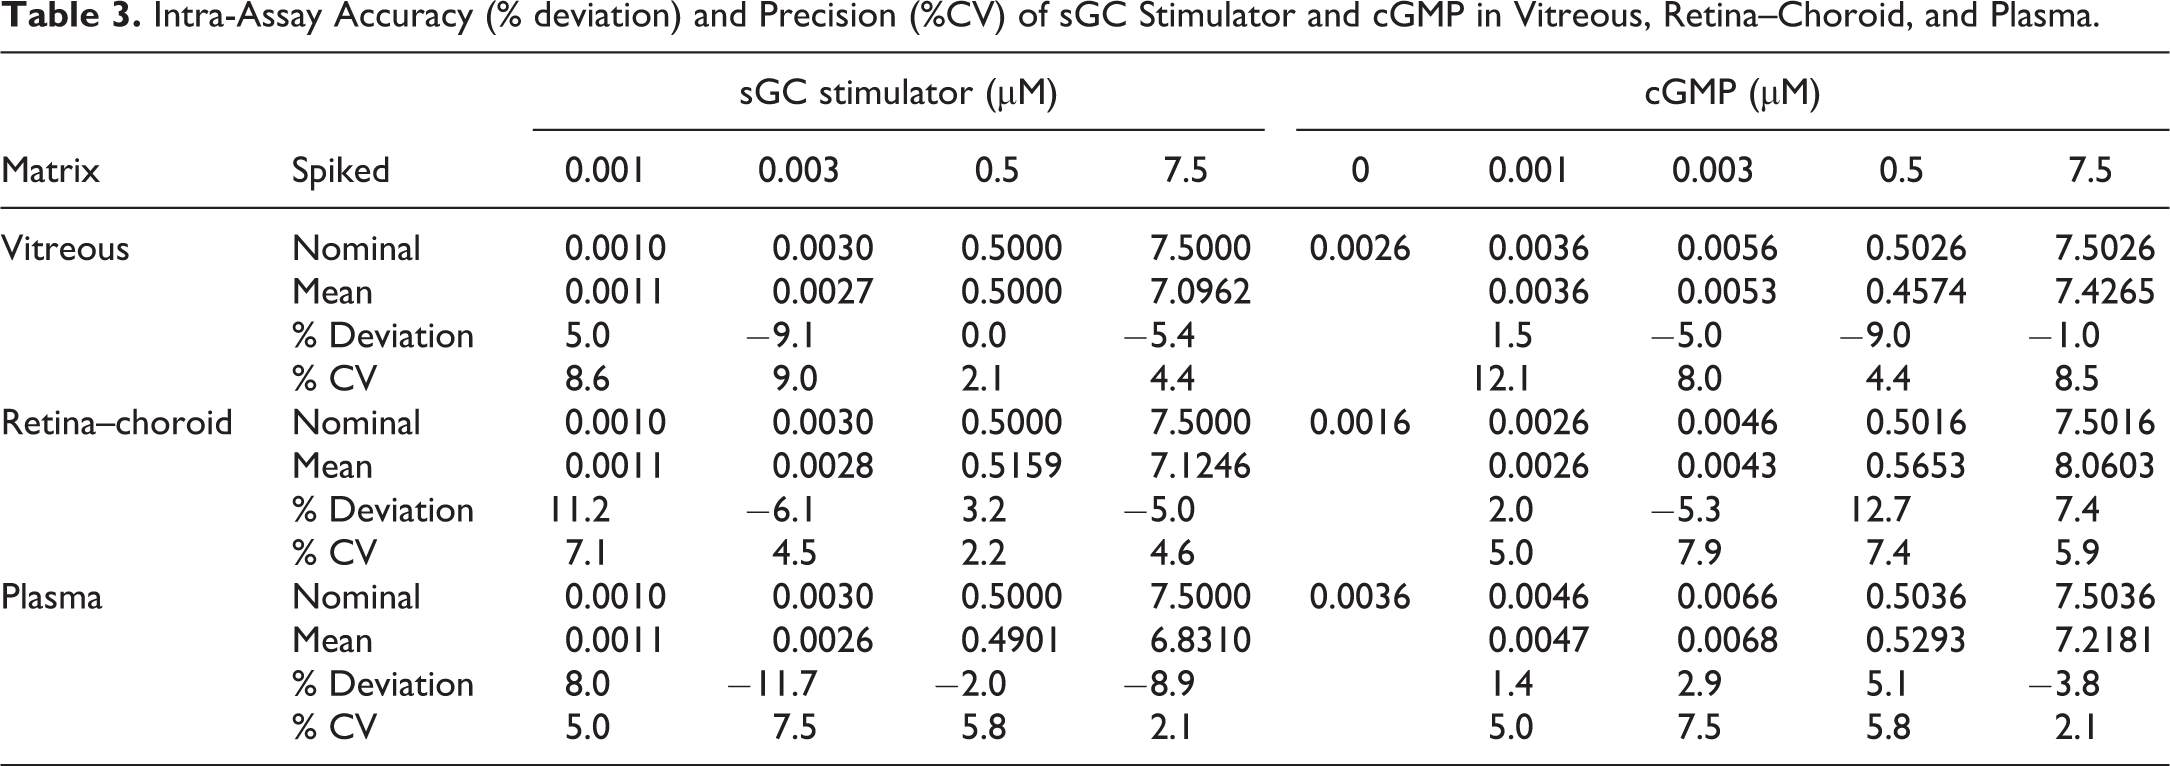
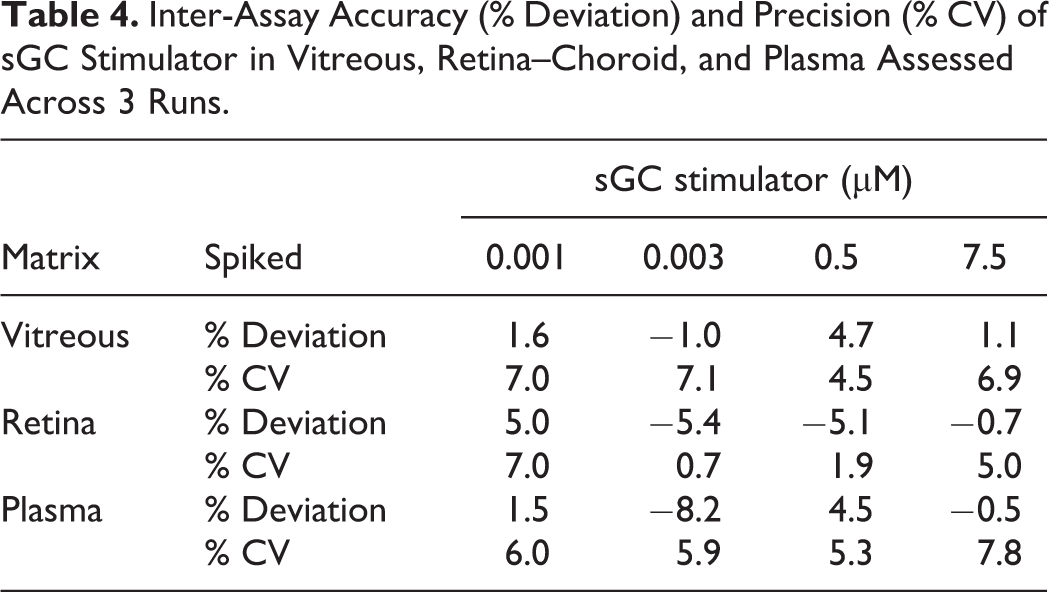
Calibration standards containing spiked sGC stimulator and cGMP were prepared in surrogate matrix with lower limit of quantitation (LLOQ) of 1 nM and upper limit of quantitation (ULOQ) of 10 µM. Calibration curves were made with linear regression of analyte/IS peak area ratio using a 1/x 2 weighting. Intra- and inter-assay accuracy and precision were evaluated with biological matrix QC samples spiked at 4 concentration levels (lower limit QC = 1 nM, low QC = 3 nM, medium QC = 0.5 µM, and high QC = 7.5 µM) with 6 replicates across 3 runs with their own calibration curves. Endogenous levels of cGMP in each matrix were measured from naive unspiked samples. Nominal concentrations for each QC level were the endogenous levels in the matrix plus the spiked concentration. Assay accuracy (% deviation = (mean − nominal)/nominal) and precision (% CV = SD/mean) were all within acceptance criteria of ±15% (Tables 3 and 4). Inter-assay accuracy and precision could not be assessed for cGMP due to varying endogenous concentrations across different tissue lots.
Intra-Assay Accuracy (% deviation) and Precision (%CV) of sGC Stimulator and cGMP in Vitreous, Retina–Choroid, and Plasma.
Inter-Assay Accuracy (% Deviation) and Precision (% CV) of sGC Stimulator in Vitreous, Retina–Choroid, and Plasma Assessed Across 3 Runs.
Application in Support of Proof of Biology and Target Engagement Studies
The multiplexed quantitation assay for sGC stimulator and cGMP was developed to support proof of biology and in vivo target engagement studies. Initial ex vivo target engagement experiments with mouse retinal explants showed cGMP levels rose as retinal explants were incubated with increasing concentrations of the sGC stimulator (Figure 4).
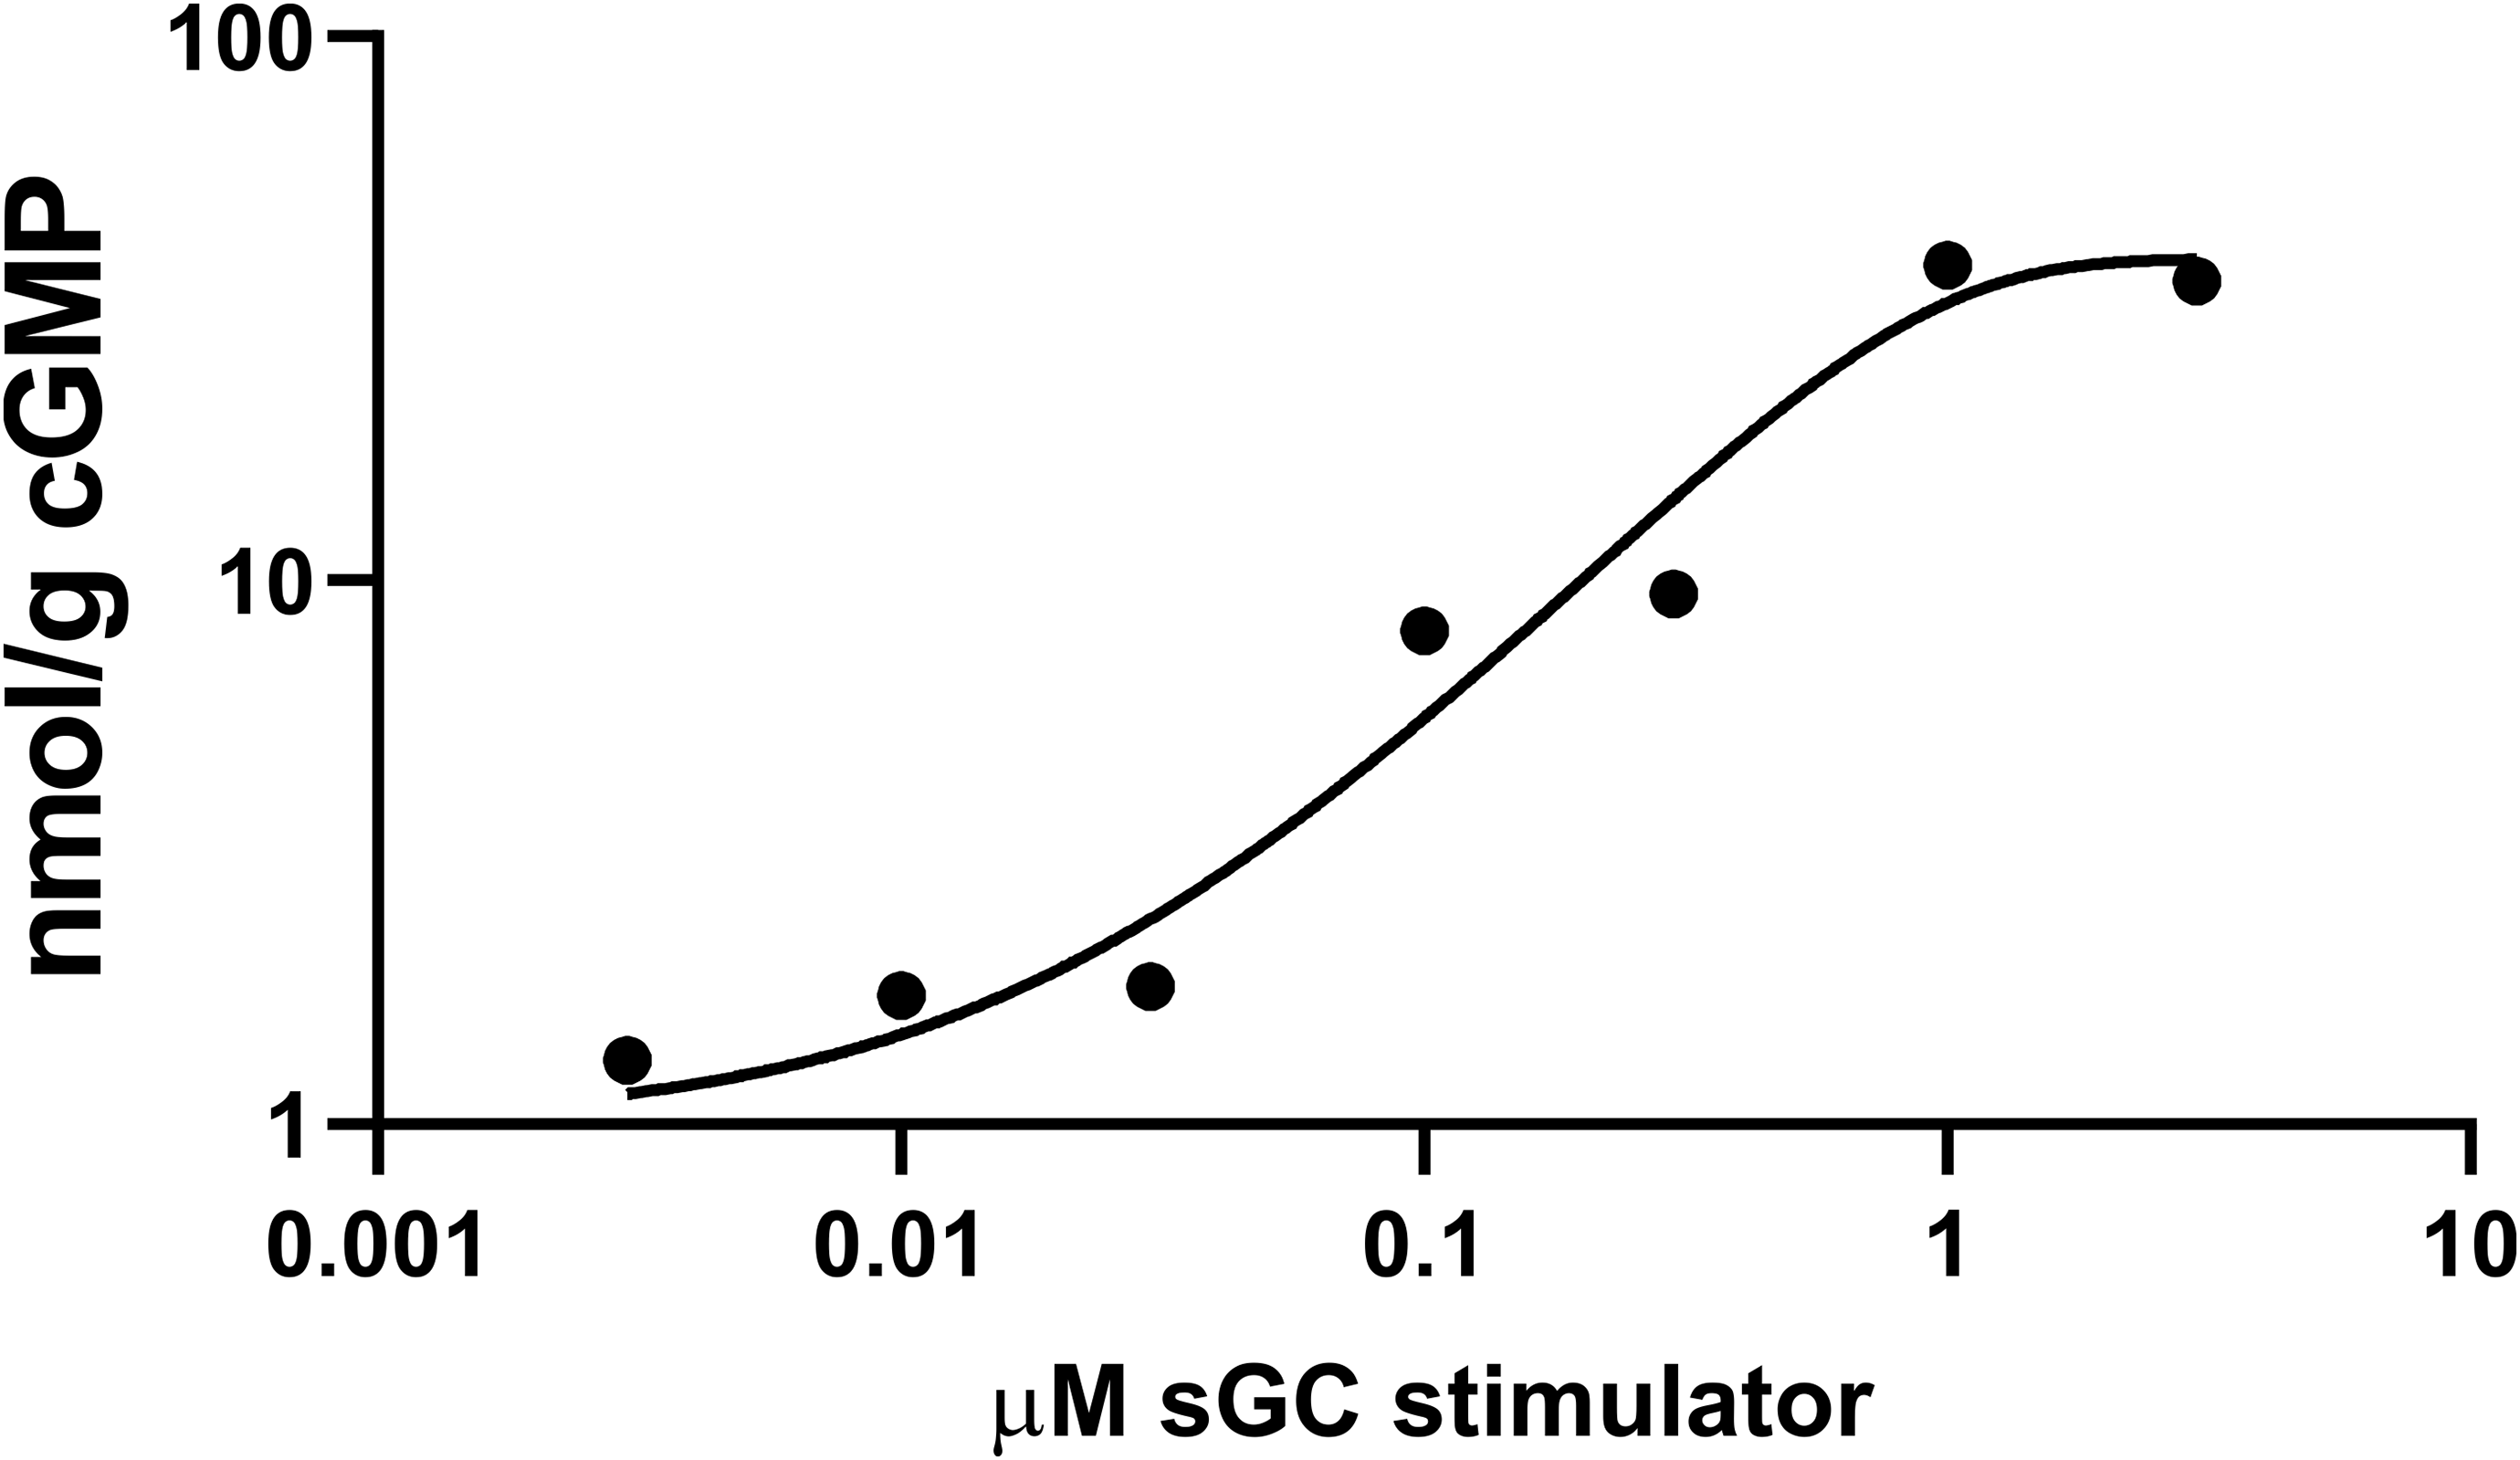
cGMP levels in mouse retinal explants rise with increasing levels of sGC stimulator. cGMP indicates 3′,5′-cyclic guanosine monophosphate; sGC, soluble guanylate cyclase.
With these promising ex vivo results, in vivo studies were planned to investigate whether intravitreal delivery of an sGC stimulator could result in target engagement of sGC to produce cGMP. Rabbits were dosed intravitreally in both eyes with vehicle or sGC stimulator at 4, 20, and 100 µg/eye dose levels.
Plasma, vitreous, and retina–choroid samples for pharmacokinetics and target engagement measurements were collected at 1, 4, and 24 hours (Figure 5). The sGC stimulator levels trended higher with dose in all tissues, although drug levels in vitreous and retina–choroid plateaued with the 100 µg/eye dose level possibly due to dissolution-limited drug distribution and elimination. Some vitreous and retina–choroid samples showed drug concentrations above the qualified upper limit of quantitation of 10 µM. Although a higher ULOQ was not qualified, the calibration curve retained linearity in the study run beyond the drug levels measured.
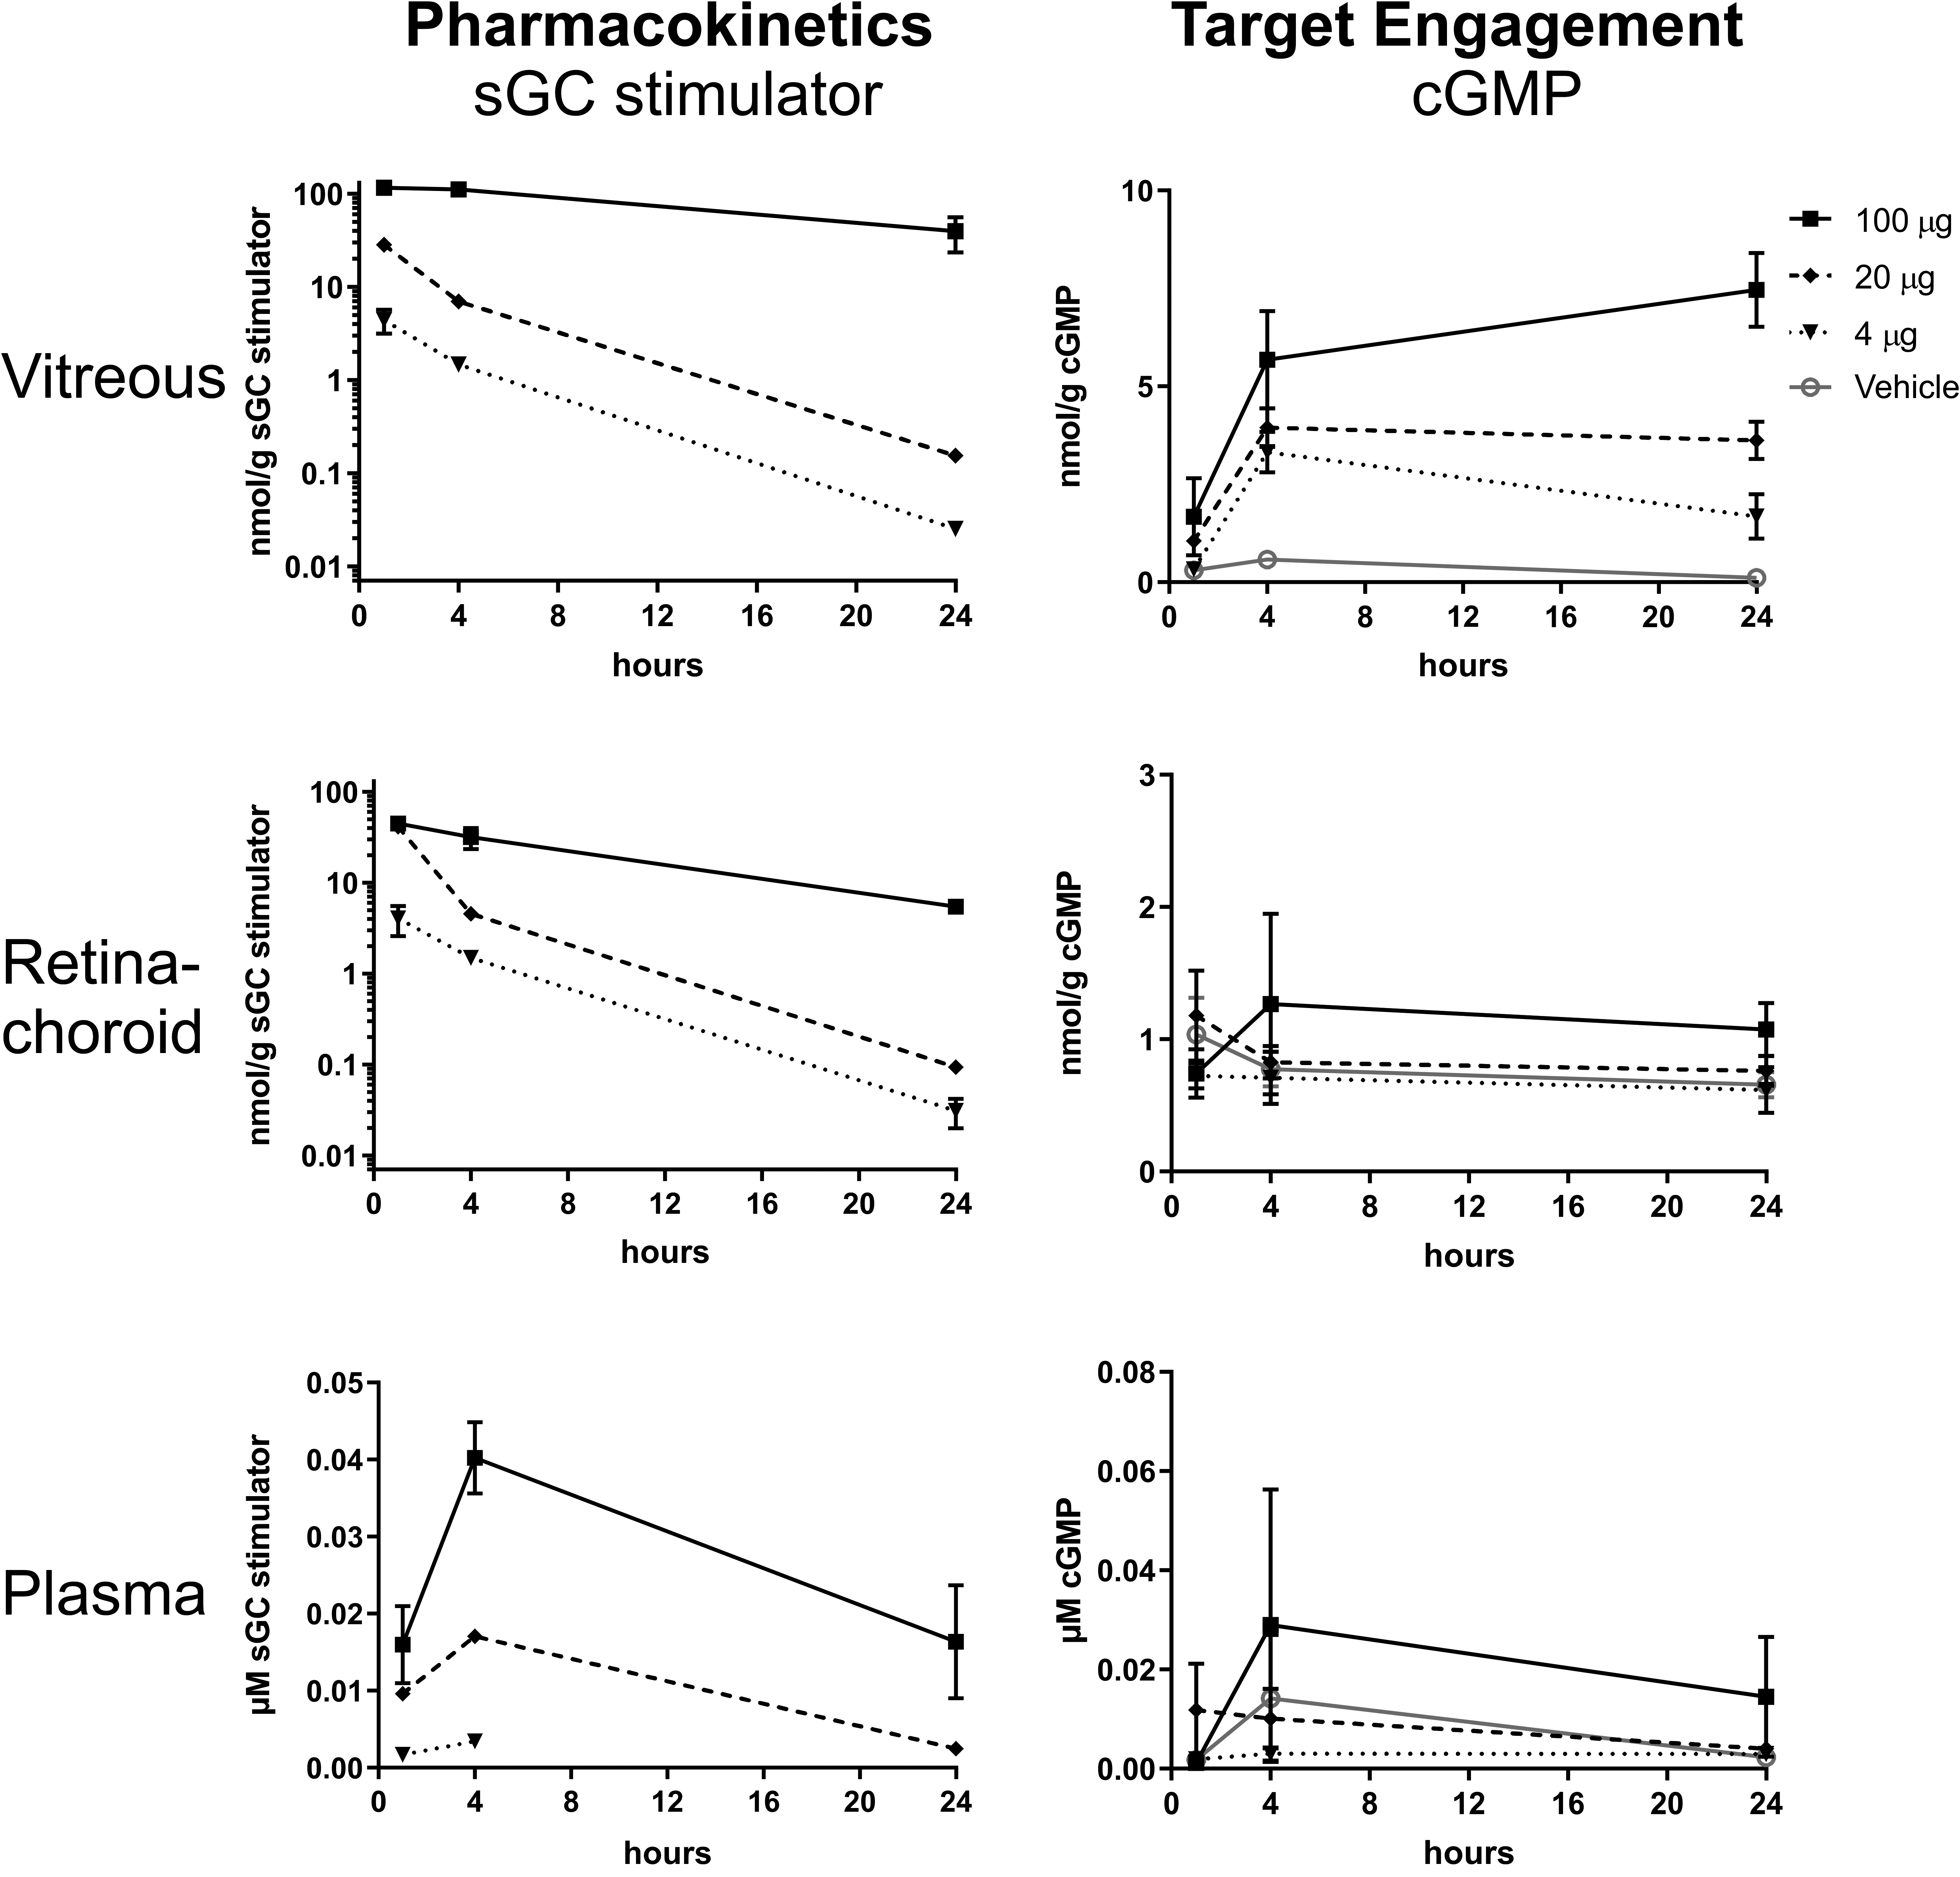
Pharmacokinetics (sGC stimulator concentration) and target engagement (cGMP concentration) in vitreous, retina–choroid, and plasma after intravitreal administration of sGC stimulator at 4, 20, and 100 µg/eye dose levels. Mean and SE of the mean are shown. Statistical significance of vitreous target engagement 100 µg/eye from vehicle at 4 and 24 hours, P ≤ .05.
The cGMP target engagement exhibited a delayed yet sustained increase in vitreous humor, even as sGC stimulator levels decreased at later time points. However, due to small sample size, statistical significance was not achieved except between 100 µg/eye and vehicle at 4 and 24 hours. At least part of the cGMP measured in vitreous is presumably produced in the retina. However, no target engagement was seen in retina–choroid, with no increase of cGMP across all dose levels compared to vehicle. These results are discordant with our retinal explants results. The differences might simply depend on the type of tissue samples. Dissected retina–choroid tissue versus in vitro culture of retinal explants may vary on their intrinsic exposure to physiological factors such as the activity of transporters, PDEs, and fluid flow.
While not the primary aims of the target engagement study, IOP, MAP, and vessel diameter through fundus imaging were measured at baseline and immediately prior to the 24-hour time point as additional pharmacodynamic readouts (Figure 6). Although statistical significance was not achieved with the small sample size available, all 3 measurements exhibited trends toward the pharmacological effect. Intraocular pressure was measured to be lower at the 24-hour time point compared to baseline for the 20 and 100 µg/eye dose groups, possibly due to the increased trabecular outflow. Mean arterial pressure was also impacted as sGC stimulator cleared out of the eye and into systemic circulation (Figure 5, plasma), causing a drop in arterial pressure. Mean arterial pressure trended lower as the dose increased. Fundus imaging of each rabbit eye measured increasing vessel diameter from baseline to 24 hours at the 100 µg/eye dose. Imaging also found evidence of leakage of blood into the eye at the 20 and 100 µg/eye doses, suggesting vascular injury could be a concern with this compound and route of administration.
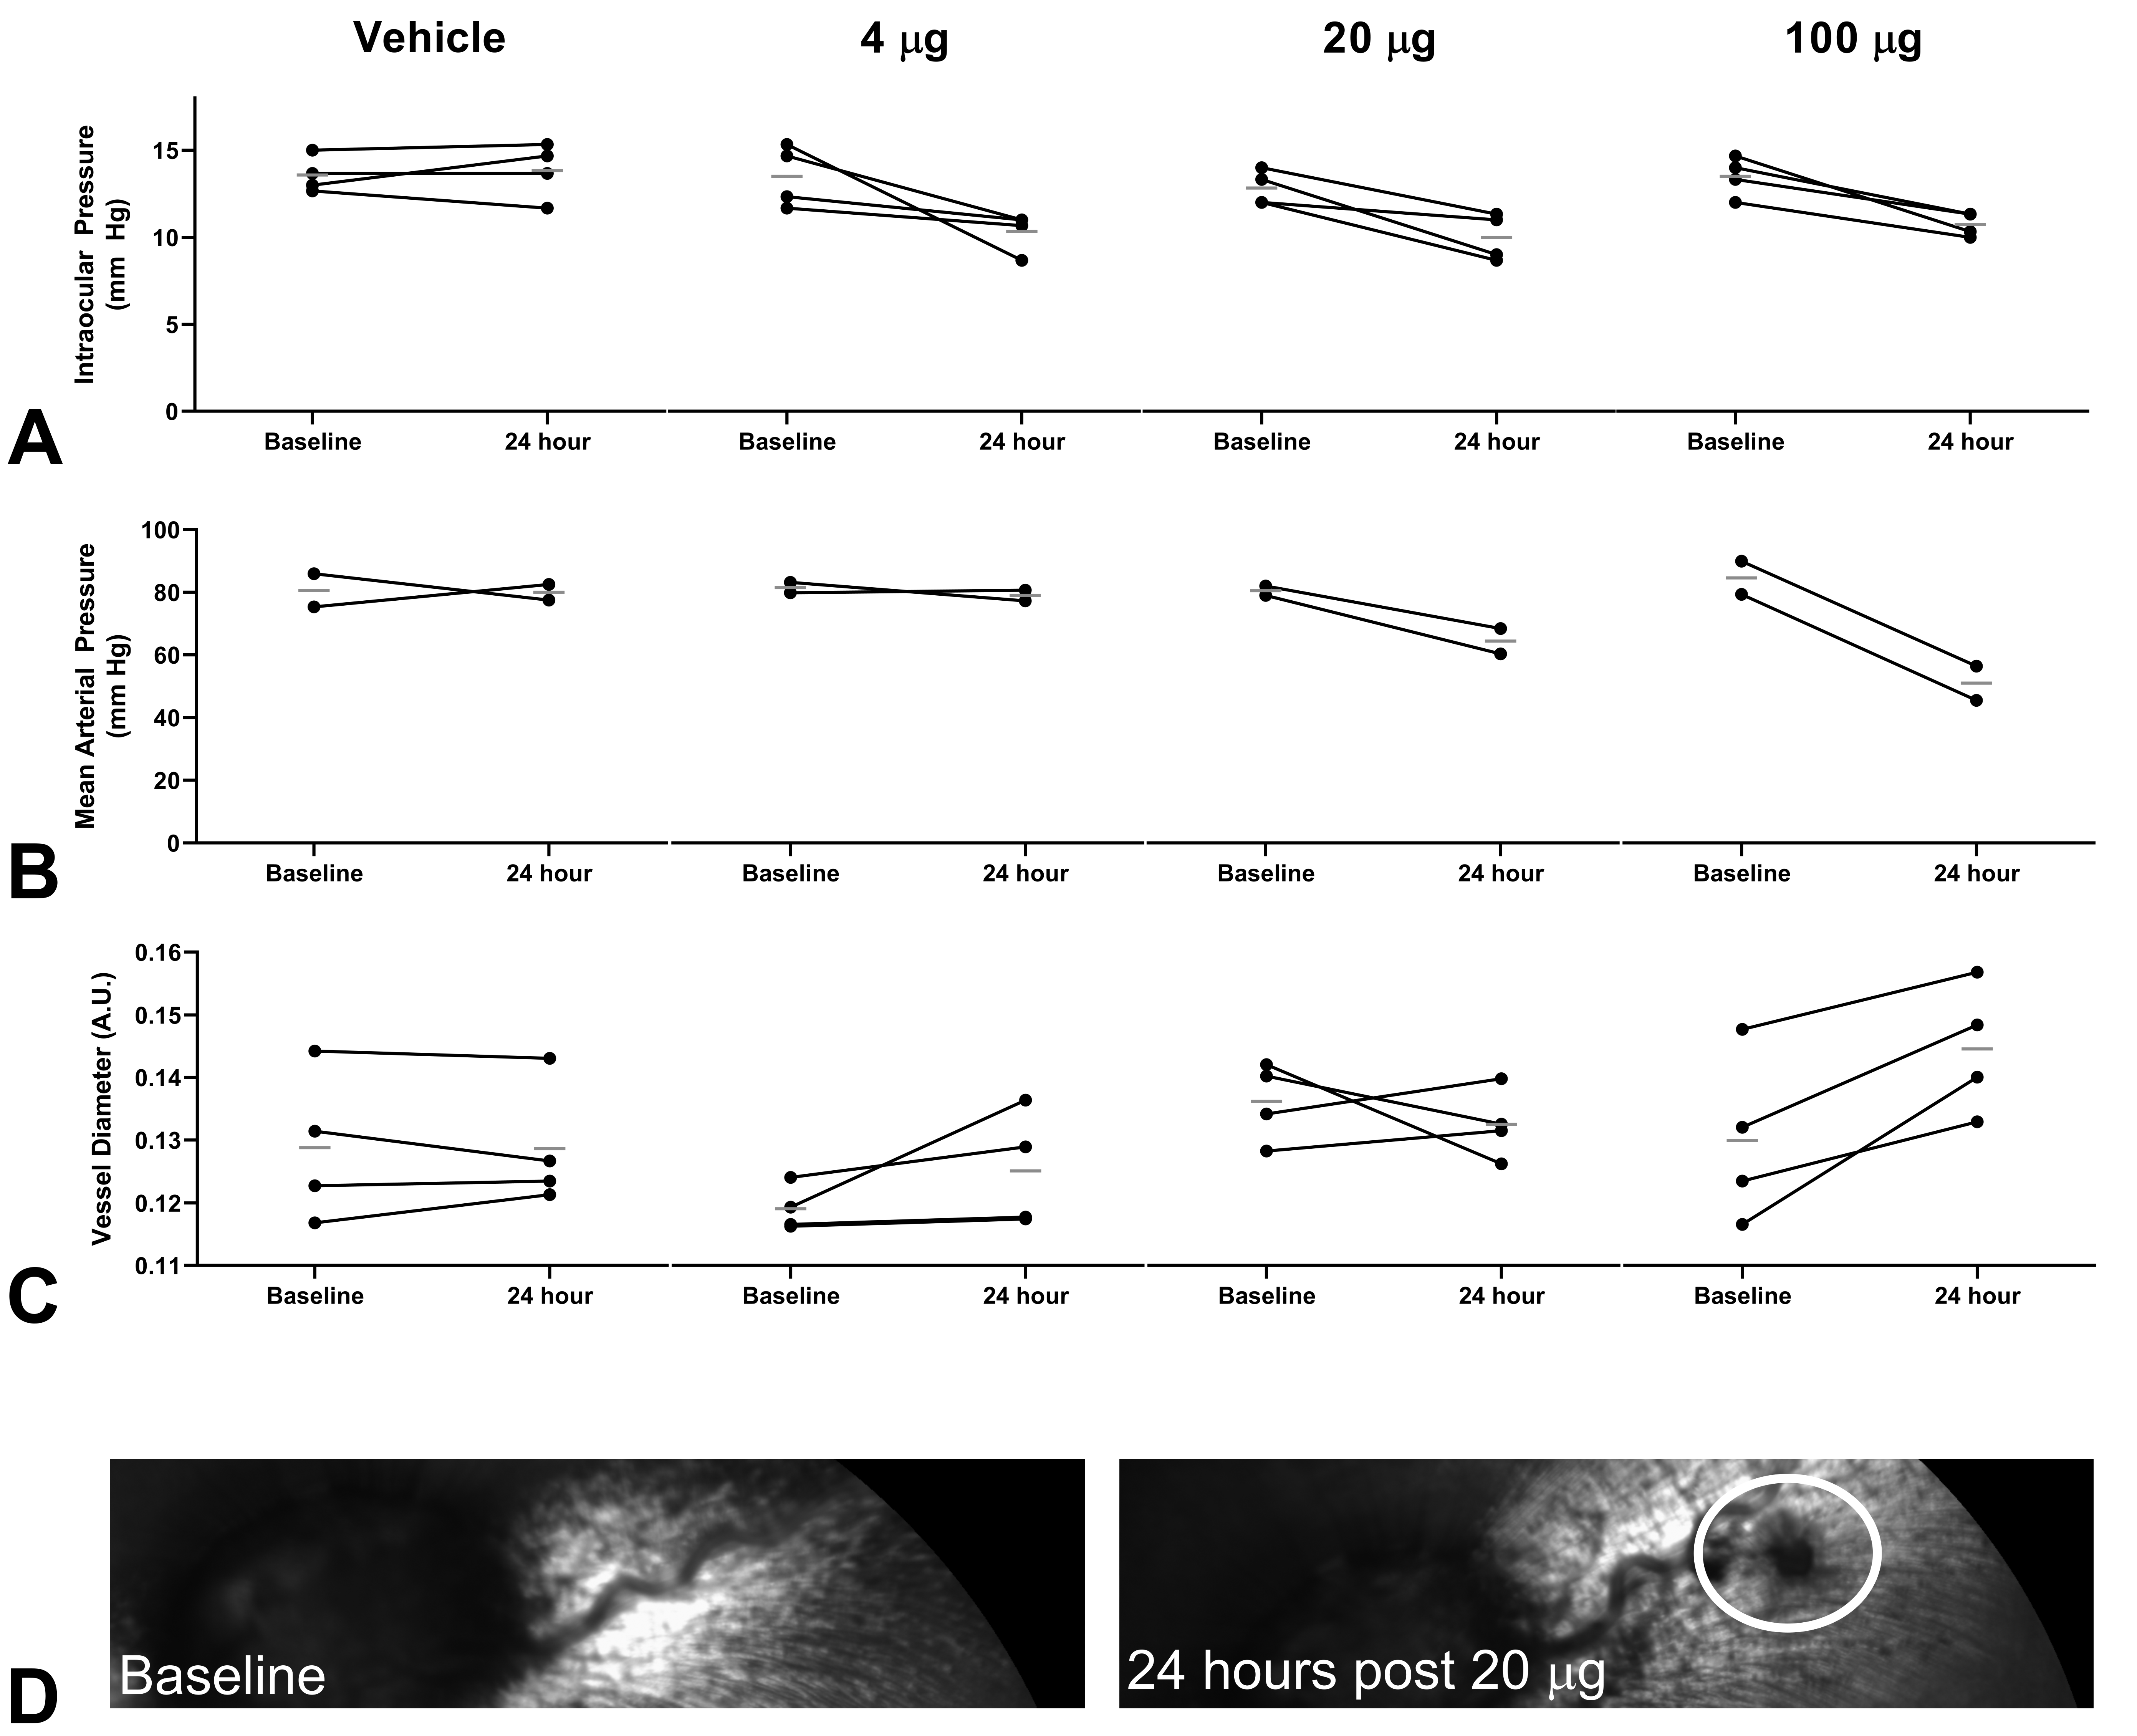
Pharmacodynamic effect at baseline and 24 hours after intravitreal administration of sGC stimulator. A, Intraocular pressure, B, Mean arterial pressure, C, Vessel diameter measured through fundus imaging, D, Fundus imaging shows evidence of leakage from blood vessel. Circles indicate measurements of the same eye or animal tracked from baseline to 24 hours. Flat bar indicates mean of measurements.
Discussion
Bioanalytical measurements of an sGC stimulator and cyclic guanosine monophosphate in ocular tissues and plasma are complicated by multiple factors: nonspecific binding of the sGC stimulator to laboratory plastic, ex vivo degradation of cGMP, suppression of cGMP ionization due to co-elution with excipient, and the lack of blank ocular tissues.
Nonspecific binding and ex vivo degradation are addressed in this work through the addition of ACN to both increase the solubility of the compound and prevent cGMP degradation by denaturing PDEs. Anti-adsorption additives are commonly added to matrix collection tubes to prevent nonspecific binding. These additives typically function by blocking binding sites (BSA 29 or detergents 28 ) or by increasing analyte solubility (cyclodextrin 30 or organic solvent 31 ). A typical sample cleanup procedure adds organic solvent to an aliquot of a study matrix to precipitate proteins. By adding ACN to the entire collection tube, we could prevent nonspecific binding to the collection tube while also precipitating proteins for sample cleanup.
Other cGMP measurement methods use PDE inhibitors such as IBMX to prevent ex vivo degradation. 18,32 These inhibitors have been used for matrices such as plasma or cell culture supernatants that are collected in liquid form so that the inhibitors can mix rapidly and halt PDE activity. In contrast, our rabbit ocular tissues are dissected and collected in a frozen mass. In our hands, adding IBMX under conditions that mimicked the frozen collection process could not produce results with adequate accuracy and precision, presumably due to uneven contact between tissue and IBMX as the samples thawed (data not shown). Adding ACN produced consistent results as it remained in a liquid state prior to tissue thawing and could immediately denature PDEs and halt cGMP degradation.
Suppression of analyte ionization due to matrix or excipient co-elution is another complicating factor that leads to poor accuracy and precision. Solid-phase extraction (SPE) is a common technique that others have used to cleanup contaminants that may interfere with mass spectrometry measurements. However, an SPE cleanup procedure would be difficult to develop for this multiplexed assay involving analytes with relatively different chemical properties. We opted to use slightly longer chromatographic conditions to separate matrix and excipient contaminants from our analytes of interest.
Blank ocular tissues would ideally be used to matrix match calibrants and study samples. However, additional rabbits beyond study subjects would need to be sacrificed and dissected. Even if ocular tissue was procured, further processing would be required to remove endogenous cGMP. Following the principle of the 3Rs (Replace, Reduce, and Refine), 4% BSA in PBS was used as surrogate matrix and diluent to replace the need for blank plasma and ocular tissue. This surrogate matrix is often used as a replacement for plasma due to its similar pH, ionic strength, and protein content. 28,33 By using a diluent that matched the surrogate matrix, recovery, and matrix effect variability between ocular tissues and the surrogate matrix calibrators could be reduced. 34 Parallelism and accuracy experiments showed this approach with a single surrogate matrix could be used to quantitate our analytes in ocular tissue and plasma. Besides reducing the number of animals required, the use of a single surrogate matrix to multiplex analyte measurements in 3 biological matrices has clear benefits on time and resource demands.
Others have used similar surrogate matrix/dilution approaches for ocular tissue bioanalysis. Drug concentrations in ocular tissue were measured by preparing ocular tissue homogenates with plasma as diluent before calibrating against a plasma matrix standard curve. 35 Simultaneous quantitation of 7 drugs in ocular tissues were reported with surrogate matrix calibration curves in simulated lacrimal fluid with or without BSA supplementation. 36
An alternative surrogate analyte approach has been used to measure cGMP in brain by calibrating against a stable isotope labeled cGMP with similar ionization characteristics. 19 Plasma has also been aged to degrade cGMP until it was undetectable to prepare cGMP-free matrix. 18 Surrogate analyte and aging approaches are feasible when analyzing plasma and brain tissue as only a few additional animals are required to collect tissue for calibrators. However, an unacceptably large number of rabbits would be required to obtain enough ocular tissue to prepare blank retina–choroid matrices.
This bioanalytical assay was developed and qualified with accuracy, precision, recovery, and matrix effect assessments. In-run assay validation was used to assess other common bioanalytical criteria to ensure acceptable data quality. For example, carryover was assessed within the study through a blank injection after the highest calibrator. Autosampler stability was assessed through the use of triplicate standard curves spaced throughout the queued batch. Analyte instability would result in failed calibration standards. Freeze-thaw stability was deemed unnecessary as samples were thawed and analyzed only once.
Multiplexed quantitation of sGC stimulator and cGMP provided pharmacokinetic and target engagement data in support of discovery research on the NO-sGC-cGMP pathway in the eye. This pathway’s effect on glaucoma treatment has been explored with a topically dosed sGC stimulator, MGV354, to improve aqueous outflow at the front of the eye. MGV354 was found to lower IOP in rabbit and monkey models although the authors noted a lack of cGMP measurement in ocular tissue as a limitation for their study. 12 Ultimately, the compound could not demonstrate IOP lowering in humans. 13
We hypothesized that administration of an sGC stimulator to the back of the eye could increase cGMP levels and potentially improve blood flow at the back of the eye. Our results show high levels of sGC stimulator in vitreous and retina–choroid. cGMP target engagement levels are elevated in vitreous, although statistical significance could only be determined between the 100 µg/eye dose and vehicle at 4 and 24 hours. In contrast, cGMP in retina–choroid showed no trend with dose level even at the highest level of 100 µg/eye, indicating a lack of target engagement by the sGC stimulator at the back of the eye. It is possible that despite the sample preparation precautions, cGMP was degraded too rapidly during the dissection process to preserve any changes driven by sGC stimulation.
Pharmacodynamic measurements of IOP, MAP, and retinal vessel diameter were also collected alongside the pharmacokinetic and target engagement data. The measurements trended toward an effect from the sGC simulator. However, the study size was insufficient to determine statistical differences even at the highest dose.
In summary, a bioanalytical assay for multiplexed quantitation of a small molecule sGC stimulator and its target engagement biomarker, cyclic guanosine monophosphate, in ocular tissues and plasma, was developed and qualified. Nonspecific binding and stability issues that could impact the assay’s accuracy and precision were solved with the addition of acetonitrile. Parallelism between the surrogate matrix (4% BSA in PBS) and biological matrices demonstrated that a single surrogate matrix calibration curve can quantitate analytes in vitreous, retina–choroid, and plasma. This assay was used to demonstrate target engagement by intravitreal administration of an sGC stimulator to increase cGMP levels in vitreous, but not retina–choroid. Multiplexing pharmacokinetic and target engagement measurements in the same assay reduced animal usage and enabled a linked data set for further analysis.
Footnotes
Declaration of Conflicting Interests
The author(s) declared the following potential conflicts of interest with respect to the research, authorship, and/or publication of this article: All authors are/were employees of Merck Sharp & Dohme Corp., a subsidiary of Merck & Co., Inc., Kenilworth, NJ, USA, who may own stock and/or hold stock options in Merck & Co., Inc., Kenilworth, NJ, USA.
Funding
The author(s) received no financial support for the research, authorship, and/or publication of this article.