
Abstract
Carcinogenesis of the small intestine is rare in humans and rodents. Oral exposure to hexavalent chromium (Cr(VI)) and the fungicides captan and folpet induce intestinal carcinogenesis in mice. Previously (Toxicol Pathol. 330:48-52), we showed that B6C3F1 mice exposed to carcinogenic concentrations of Cr(VI), captan, or folpet for 28 days exhibited similar histopathological responses including villus enterocyte cytotoxicity and regenerative crypt epithelial hyperplasia. Herein, we analyze transcriptomic responses from formalin-fixed, paraffin-embedded duodenal sections from the aforementioned study. TempO-Seq technology and the S1500+ gene set were used to analyze transcription responses. Transcriptional responses were similar between all 3 agents; gene-level comparison identified 126/546 (23%) differentially expressed genes altered in the same direction, with a total of 25 upregulated pathways. These changes were related to cellular metabolism, stress, inflammatory/immune cell response, and cell proliferation, including upregulation in hypoxia inducible factor 1 (HIF-1) and activator protein 1 (AP1) signaling pathways, which have also been shown to be related to intestinal injury and angiogenesis/carcinogenesis. The similar molecular-, cellular-, and tissue-level changes induced by these 3 carcinogens can be informative for the development of an adverse outcome pathway for intestinal cancer.
Keywords
Introduction
Intestinal carcinogenesis in 2-year cancer bioassays is a rare occurrence. 1 For example, the only agents to clearly induce intestinal tumors from oral exposure in NTP bioassays are the fungicide captan and transitional metal hexavalent chromium (Cr(VI)), and neither of these agents induced intestinal tumors in rats. 2,3 Despite being a site of contact tissue exposed to all ingested material and having a very high proliferative rate, intestinal carcinogenesis is also rare in humans. 4,5 In an effort to better understand intestinal carcinogenesis, we previously compared the duodenal histopathological responses to Cr(VI) and captan (as well as the structurally similar fungicide folpet) in mice exposed to carcinogenic doses. 6 Despite the obvious structural differences between Cr(VI) and the 2 fungicides, the histopathological effects in the duodenum were quite similar, involving villus cytotoxicity and crypt hyperplasia. 6
These similar histopathological responses suggest that these carcinogens, despite structural differences, might operate via similar mechanisms. Indeed, a cytotoxicity regenerative hyperplasia mode of action (MOA) has been proposed for all 3 agents. 7 –10 Coupled with clear evidence for chronic mucosal injury and regenerative hyperplasia, data indicate that these intestinal carcinogens might have similar or identical initiating events in the intestinal villi that induce chronic increases in crypt proliferation leading to intestinal carcinogenesis. Agents that initiate or act upon a common series of key events from the molecular level to population-level adverse responses such as cancer are said to share a common adverse outcome pathway (AOP). 11 The AOP concept has gained considerable attention in recent years as a topic of interest in scientific meetings, journal publications, and regulatory guidance documents. 12,13 Despite this interest, there are currently few recognized AOPs for outcomes of concern to environmental toxicologists, save for relatively established outcomes such as AhR-mediated liver toxicity 14 and cytotoxicity-related forestomach tumors in rodents. 15
The purpose of this study was to extend the histopathological analyses in Thompson et al (2017) 6 to assess the transcriptomic responses to the 3 intestinal carcinogens. To this end, we extracted RNA from formalin-fixed intestinal tissue sections from the aforementioned study. Targeted RNA sequencing using the TempO-Seq® platform (ByoSpyder Technologies, Carlsbad, California) and the S1500+ geneset 16 was used to compare responses to these 3 intestinal carcinogens at the molecular level. By anchoring transcriptomic responses to histopathological changes in these tissues, as well as previously published mechanistic data, these findings contribute information regarding molecular alterations that may represent key events in an AOP for intestinal carcinogenesis in rodents. These findings can inform the risk and safety assessment of carcinogens that induce intestinal tumors, and may be informative in the understanding of mechanisms of human intestinal carcinogenesis.
Materials and Methods
Mouse Exposure Conditions and Intestinal Sample Collection
The in-life study details are described elsewhere. 6 In brief, the study was conducted at Charles River (Spencerville, Ohio) following Good Laboratory Practice standards. Exposed mice were treated with Cr(VI) in the form of sodium dichromate dihydrate (99.95% pure; CAS 7789-12-0; Sigma-Aldrich Inc, Milwaukee, Wisconsin), captan (98.3% purity; CAS 133-060-2; AK Scientific, Inc, Union City, California), and folpet (98% purity; CAS 133-07-3; Santa Cruz Biotechnology, Inc., Santa Cruz, California). Target dose formulations for Cr(VI) were prepared weekly in the drinking water and verified at Eurofins Lancaster Laboratories Environmental (Lancaster, Pennsylvania) using method SW-846 7196A. Dose formulations for captan and folpet were both prepared weekly in diet at concentrations of 6000 and 16 000 ppm; however, the high-dose captan group was reduced to 12 000 ppm due to early signs of frank toxicity. Female B6C3F1 mice ∼9 weeks of age were obtained from Charles River (Raleigh, North Carolina) and acclimated for ∼2 weeks. All mice received NTP-2000 Irradiated Meal Diet (Zeigler Bros., Gardners, Pennsylvania) ad libitum. Control animals were provided with untreated diet and drinking water. Each control and treatment group contained 20 mice that were exposed to the test compound for 28 days, 10 of which were allowed to recover for 28 days following the cessation of treatment (results not reported here for recovery group). Housing and care followed specifications of the United States Department of Agriculture Animal Welfare Act (9 CFR, Parts 1, 2, and 3) and as described in the Guide for the Care and Use of Laboratory Animals from the National Research Council, the Public Health Service Policy on Humane Care and Use of Laboratory Animals from the Office of Laboratory Animal Welfare, and the American Veterinary Medical Association Guidelines on Euthanasia and with the procedures.
The rationale for dose selection was provided previously 6 ; 180 ppm Cr(VI) and 16 000 ppm captan represent the highest concentration employed in their respective cancer bioassays. 3,2 Because evidence indicates that these carcinogens require long-term exposure to induce tumors, the highest carcinogenic concentrations were used for these short-term studies. While these concentrations are orders of magnitude higher than typical human environmental exposures, tumorigenic concentrations were used herein to understand the relationship between molecular changes and tumor response. While the use of more doses is almost always informative, MOA is dose-dependent. 17 The objective of this study was to assess whether the molecular responses to these structurally disparate (Cr(VI) vs captan/folpet) agents are similar in the same study, controlling for as many experimental variables as possible (eg, same source colony, same transcriptomic platform, same pathologist). The 28-day time point was used based on evidence that an early genotoxic event is not the initiating event for the intestinal tumors 9,18 –21 ; thus, querying transcriptomic signatures for mechanisms of carcinogenesis at the 28-day time point provides information following initiation but remains relevant to carcinogenic process(es). Further, Organisation for Economic Co-operation and Development (OECD) guidelines for the transgenic rodent somatic and germ cell gene mutation assays include 28-day consecutive dosing (#488) and for repeated dose oral toxicity studies (#407) recommends 28 days of dosing, and the TG-GATES project also includes 28 days of consecutive dosing. 22
Tissue Processing
Mice were euthanized by CO2 asphyxiation and duodena were excised by transecting the pylorus and proximal jejunum. A small gauge blunt-ended needle was inserted into the distal end of each duodenum to gently flush the specimen with phosphate-buffered saline. The pylorus was then stapled to a small strip of cardboard, and a syringe with a blunt-ended needle was used to instill 10% neutral buffered formalin (NBF) from the distal end thereby gently inflating the intestine to approximately normal size. Hemostats were used to temporarily prevent escape of the formalin until the distal end could be stapled to the card thereby ensuring that the specimens remained linear and untwisted. Each specimen (affixed to card) was then submersed into a container of 10% NBF. After 24 to 48 hours, 10% NBF was exchanged with fresh 10% NBF. The duodenum samples were submitted to Experimental Pathologies Laboratories, Inc (Sterling, Virginia) for processing.
Three segments of duodenum (proximal, middle, distal) were obtained at gross trimming. These segments, each of which was 3 to 4 mm long, were acquired 1 cm, 4 cm, and 7 cm, respectively, from the attached gastric pylorus. Following gross trimming, each segment was filled with HistoGel™ to help maintain lumen patency and villus integrity. 23 The 3 duodenal segments were embedded in the same paraffin block according to routine methods, and oriented for transverse sectioning (anterior end down) in a manner that ensured that the identities of the proximal, middle, and distal segments could be maintained. Sections (each ∼5 µm thick section contained a proximal, middle, and distal duodenal profile) were placed on positive charged glass slides. One section per animal was stained with hematoxylin and eosin (H&E), covered with a glass coverslip, and subsequently evaluated by an American College of Veterinary Pathologists board-certified veterinary pathologist; the results of that assessment are presented elsewhere. 6 Another unstained section per animal was left uncovered and submitted to BioSpyder Technologies, Inc (Carlsbad, California) for further processing.
Transcriptomic Analyses
Seven of the 10 samples from each treatment group were randomly selected to be used for the transcriptomic analyses. Formalin fixed, paraffin-embedded (FFPE) duodenum tissue was scraped from unstained slides (5um sections) into lysis buffer (BioSpyder Technologies, Inc). The resulting cell lysates were processed according to the TempO-Seq protocol, as previously described. 24 Briefly, messenger RNA (mRNA) targets were hybridized with a detector oligomer probe mix. Nuclease digestion of excess oligomers was conducted, followed by ligation to result in a pool of amplification templates sharing polymerase chain reaction (PCR) primer “landing sites.” Following PCR, clean-up, and pooling, the DNA libraries were sequenced using a HiSeq 2500 Ultra-High-Throughput Sequencing System (Illumina, San Diego, California).
Transcriptomic analyses were carried out using the TempO-Seq targeted RNA sequencing technology. This platform is designed to measure a subset of the whole transcriptome; in the present study, “sentinel genes,” referred to as the S1500+ gene list, were sequenced. The S1500+ gene list was identified by the National Institute of Environmental Health Sciences to serve as a representative of the entire transcriptome. These sentinel genes were identified through a combination of community-driven nominations and computational approaches to reflect genes that represent a diverse biological space, serve as a proxy for expression changes across the entire transcriptome, and provide adequate coverage across canonical pathways. 16 These sentinel genes cover all known canonical pathways from Molecular Signature Database (MSigDB) version 4.0, with a minimum of 3 genes required per pathway, and were also identified based on ability to infer expression changes across the portion of the transcriptome not represented within the S1500+ list. The expression levels of 2754 mouse genes from the S1500+ gene list, represented by 3045 probes, were measured using the TempO-Seq platform. Some genes are targeted with multiple probes to detect important alternative splicing variants. RNA sequencing data are publicly available in the National Center for Biotechnology Information (NCBI) Gene Expression Omnibus 25 (GEO Series accession number GSE120146).
Data Processing
Sequencing data were analyzed using multiple packages in the R software, version 3.4 (cran.r-project.org/). The number of sequenced reads per probe were extracted from FASTQ files. A traditional alignment step was not required because the gene-specific probe sequences are known. The DESeq2 R package (version 1.18.1) 26 was used to normalize data such that sample-to-sample variation in sequencing depth was accounted for. Samples with below-optimal sequencing depth were not included in the comparative analysis, according to the following criteria: less than 500 K reads, which is roughly only 10% of the average number of reads across all samples (the average number of reads per sample 4 449 234); or low representation of expressed genes. The latter was characterized by a total number of genes sequenced more than 2 standard deviations below the mean number of genes sequenced per sample, which was 2102. This filter resulted in the removal of 2 samples from the total 42 samples that were sequenced. Principal components analysis conducted with and without samples that were filtered out using these criteria confirmed that the 2 samples with relatively low sequencing depth contributed a disproportionate amount of variation to the experiment (data not shown). Probes with zero counts across all samples were removed. Removal of low-count probes was not conducted as it is not necessary when using the DESeq2 package, owing to the application of shrunken fold-changes and independent filtering to stabilize low-count probes. 26
Statistical methods within DESeq2 were used to identify differentially expressed genes (DEGs) associated with a specific exposure, with betaPrior set to “false.”. 26 The DESeq2 method is based on the calculation of shrunken logarithmic fold changes in expression (representing ratio of exposure over unexposed samples), which are then divided by their standard errors to conduct Wald tests for differential expression. These tests produce z-statistics that are compared against standard normal distribution curves, resulting in Wald test P values, that are then adjusted for multiple testing using the Benjamini and Hochberg (BH) procedure. 26 All differentially expressed probes (DEPs) were defined as those with false discovery rate (FDR) <10% (comparing exposed vs unexposed samples), based on a BH-adjusted P value, paralleling methods previously used to analyze RNA sequencing data. 27,28 Unique DEGs were identified from the DEPs.
Comparison of Global Changes in Gene Expression Across Substances
Global comparisons were conducted to understand the overall difference or similarity between transcriptomic responses in the duodenum to the 3 agents. These global comparisons considered all genes evaluated together, regardless of whether the genes showed significant changes in expression. Correlation between substances (and doses) was assessed using a Pearson test and the log2-transformed fold change values for each probe, averaged among the samples within each treatment group. This method has been employed previously to understand the level of similarity across several substances of unknown or variable composition, complex reaction products or biological materials based on transcriptomic profiling using data generated with the TempO-seq platform. 29 Values of P for correlation pairs were calculated using the Hmisc package in R (version 4.2-0).
Comparison of Genes With Significant Differential Expression Across Substances
The number of DEGs associated with each exposure condition were compared through both statistical- and visual-based approaches. A Fisher exact test was employed to statistically compare the difference between the agent-specific sets of DEGs, relative to what is expected due to random chance. These statistical tests were carried out between all gene lists, testing the significance between 2 lists at a time, using the GeneOverlap R Package (version 1.14.0). 30 Gene lists comparisons were visualized using MA plots, and Venn diagrams, carried out using the VennDiagram R Package (version 1.6.20). 31
Comparison of Pathway-Level Changes Across Substances
Biological pathways that were associated with the transcriptomic response profiles were identified through pathway enrichment analysis. The pathway analysis approach was similar to an approach used previously in evaluating pathway level coverage and performance specifically based on the S1500+ gene list. 16 This approach used the gene set enrichment analysis (GSEA) method to evaluate statistical enrichment of pathways across ranked gene lists, and all canonical pathways were queried through the MSigDB.
Mouse gene identifiers were first converted into human identifiers, when available, using the R package, Homologene, based on NCBI’s HomoloGene database for detecting homologs among eukaryotic gene sets (annotation release 104 and 106 for mouse and human, respectively). 32 Human gene identifiers were then queried for pathway enrichment analysis among all canonical pathways available through the MSigDB, version 6.1, consisting of 1329 canonical pathways annotated according to human identifiers. 33 Of these, 1327 canonical pathways included two or more genes within the S1500+ gene list and were thus included in the analysis. An average of 17 genes from the S1500+ list were included in each canonical pathway. These canonical pathways included gene sets from several pathway databases, including the BioCarta online maps of metabolic and signaling pathways, 34 the Kyoto Encyclopedia of Genes and Genomes (KEGG), 35 the Pathway Interaction Database, 36 and the Reactome database of reactions, pathways, and biological processes. 37
Enrichment of gene sets and pathways was evaluated following the method employed by the GSEA platform made available by the Broad Institute. 38 The R Package, Platform for Integrative Analysis of Omics data, 39 was used to carry out this analysis. Genes were first ranked according to their correlation with the treatment group using the Wald statistical values generated by the DESeq2 analysis, with genes showing significant increases in expression with the greatest magnitude having the highest, positive Wald statistical value (overall max = 10.4), and genes showing significant decreases in expression with the greatest magnitude having the lowest, negative Wald statistical value (overall min = −7.9). Fold-change criteria were not employed. Genes with minimal expression changes (ie, the least induction or reduction associated with exposure) had Wald statistical values near zero. The GSEA method was then used to determine whether the defined set of genes in each pathway were randomly distributed throughout the ranked gene list, representing a nonsignificant pathway enrichment; conversely, if the defined set of genes were primarily present at the top/bottom of the ranked list, this represented a significant pathway enrichment with distinct directionality (ie, primarily up- or downregulated). Pathway enrichment significance was calculated using permutation-based nominal P values based off weighted Kolmogorov-Smirnov test enrichment scores, and adjusted for multiple hypothesis testing by calculating FDRs using the BH method, as previously described. 38 Pathways with enrichment P values <.05 were considered to be significant. Significantly enriched pathways were then compared to previously published histopathological changes in the same animals to characterize the relationship between the molecular signals and phenotypic responses. 6
Results
Histopathological Effects in the Duodenum
The histopathological changes induced by Cr(VI), captan, and folpet in the small intestine were previously described in detail. 6 Because the anchoring of transcriptomic signals to physical and biochemical changes provides valuable additional information in regard to gene expression changes, these histopathological responses are briefly repeated here (Table 1). The major treatment-related findings were villous enterocyte hypertrophy, increased villous enterocytes, and crypt hyperplasia; qualitatively, these findings were similar among the 3 test articles.
Prevalence and Severity of Histopathological Changes in the Duodenum.a
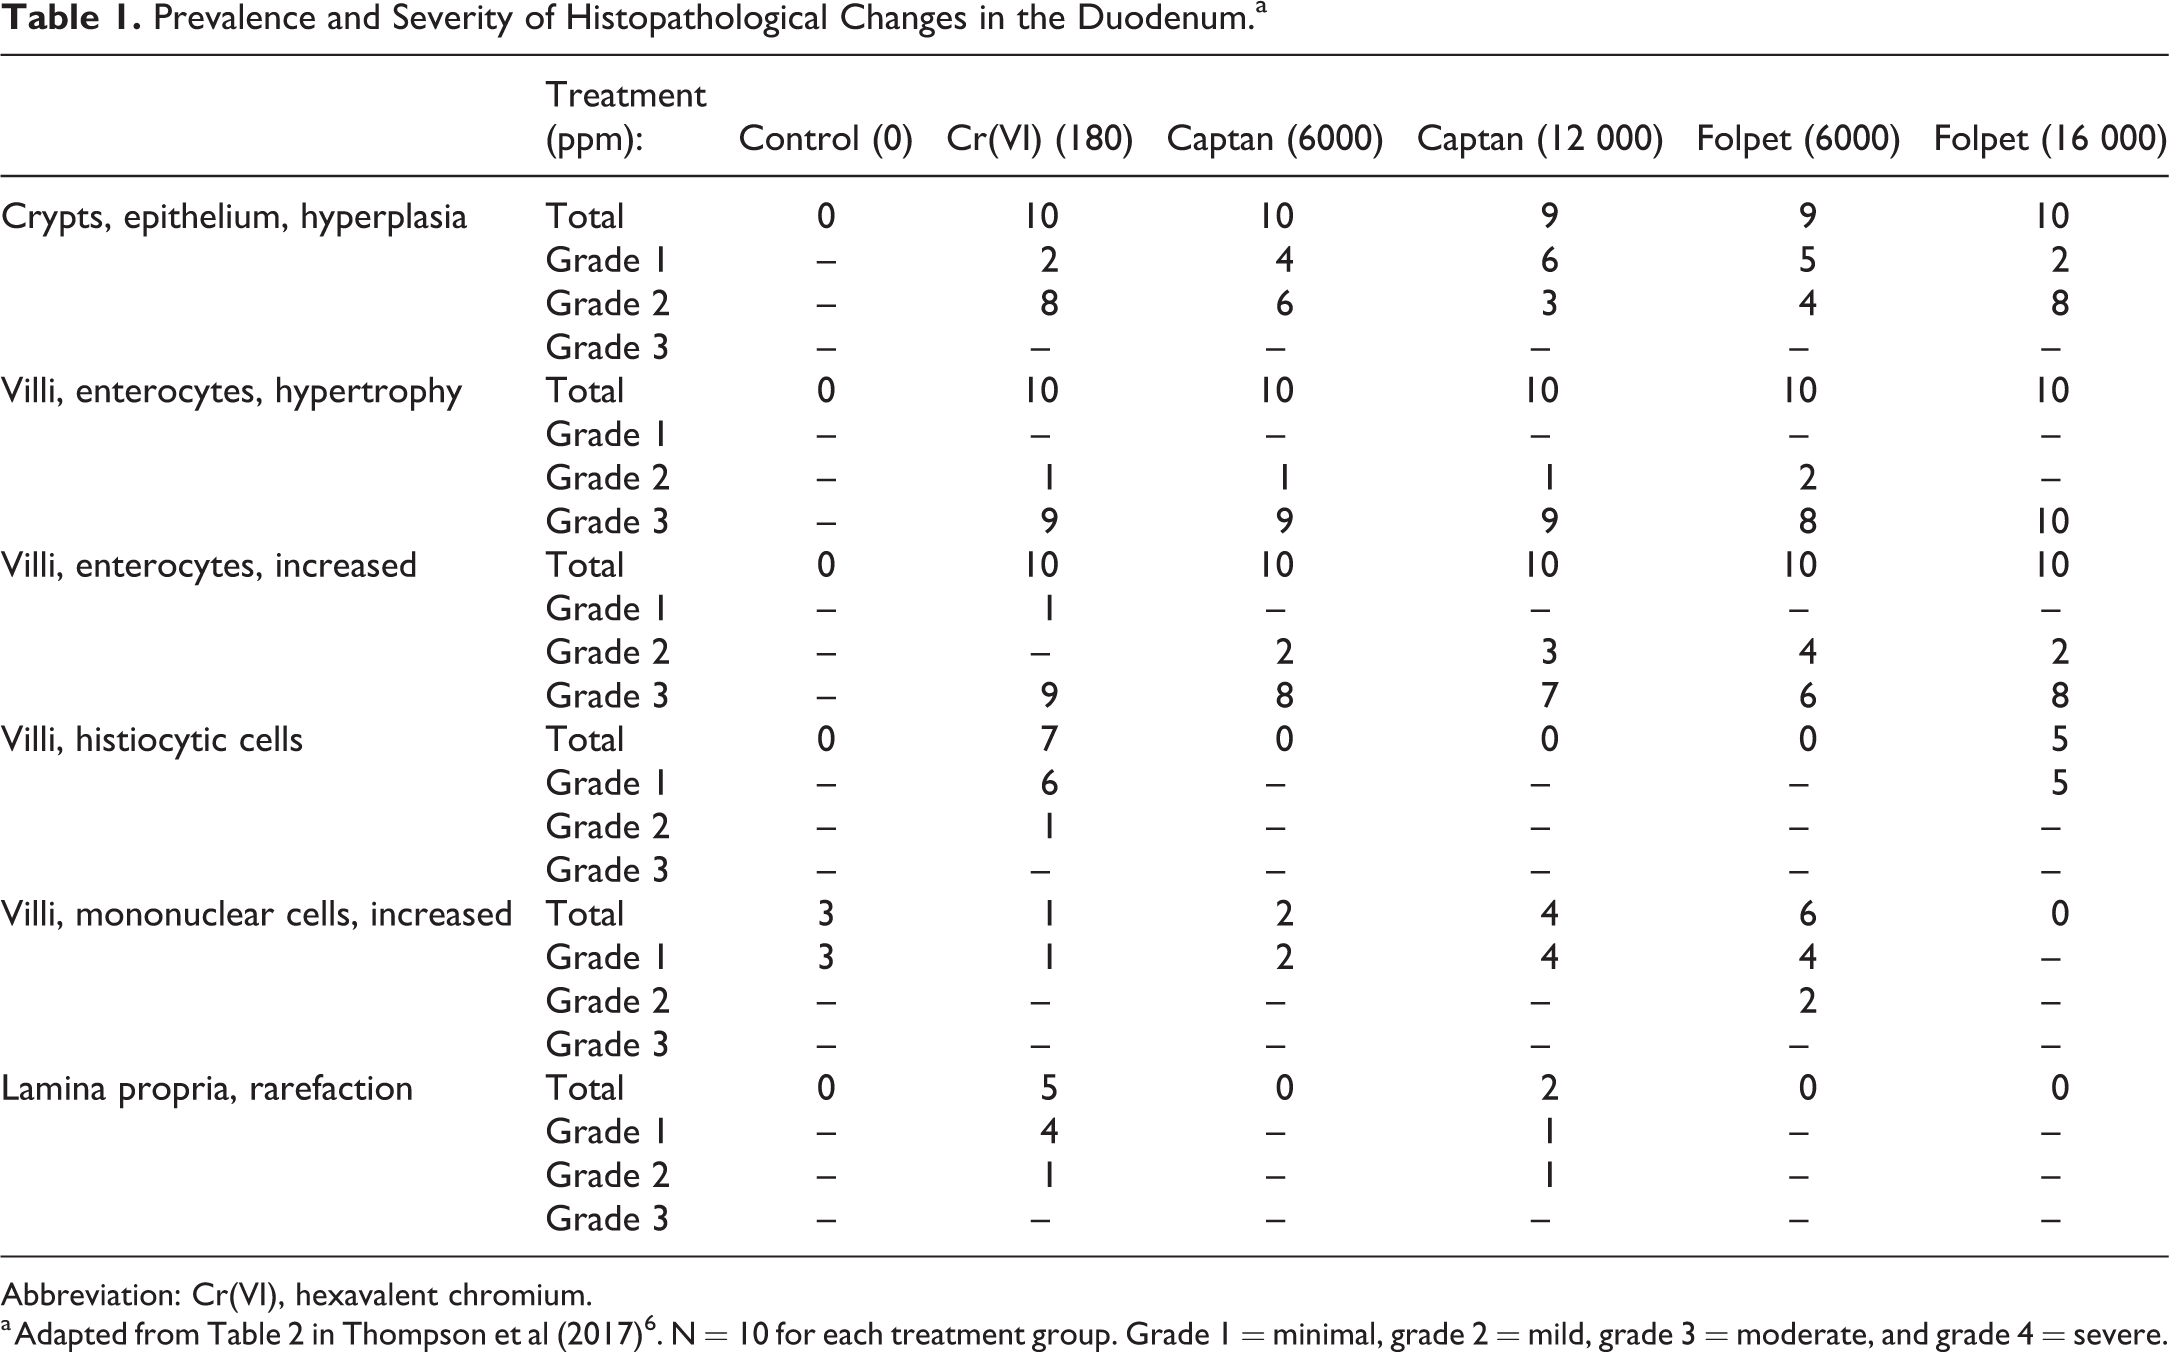
Abbreviation: Cr(VI), hexavalent chromium.
Gene Expression Changes Associated With Exposure
Within the mouse intestine, the expression levels across the S1500+ gene list, representing 3045 probes and 2754 genes (Supplemental Table S1), were evaluated using templated oligomer RNA sequencing. Analysis of exposed versus unexposed samples identified genes showing significant (BH-adjusted P < .10) differential expression associated with exposure (Table 2, Supplemental Table S2). A total of 321 probes (representing 313 genes) were identified with significantly altered expression levels associated with exposure to 180 ppm Cr(VI) in drinking water. In response to captan exposure, a total of 307 probes (304 genes) and 346 probes (339 genes) were identified with significant differential expression resulting from 6000 and 12 000 ppm exposure via feed, respectively. In response to folpet exposure, a total of 322 probes (316 genes) and 516 probes (505 genes) were identified with significant differential expression resulting from 6000 and 16 000 ppm exposure via feed, respectively. Throughout all exposure conditions, approximately 50% of the DEGs showed increased expression and 50% showed decreased expression (Table 2).
The Number of Probes and Genes Identified With Differential Expression Associated With Cr(VI), Captan, or Folpet Exposures in the Mouse Intestine.a
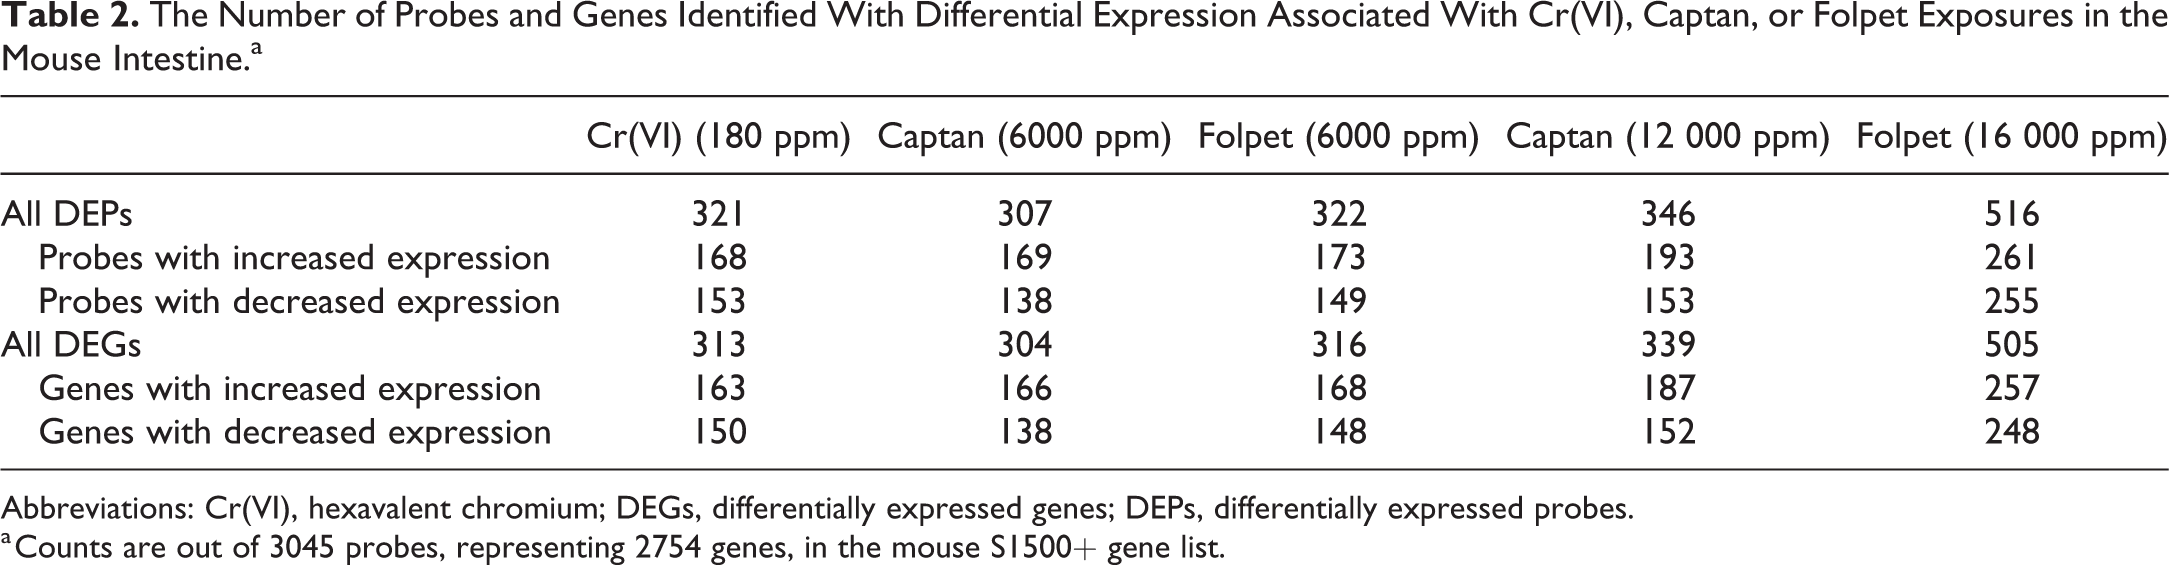
Abbreviations: Cr(VI), hexavalent chromium; DEGs, differentially expressed genes; DEPs, differentially expressed probes.
a Counts are out of 3045 probes, representing 2754 genes, in the mouse S1500+ gene list.
Comparative Analysis Between All Transcriptional Responses to Cr(VI), Captan, and Folpet
A global comparison (ie, considering all genes measured together whether significantly differentially expressed or not) at the probe level revealed that the overall transcriptomic profile for each compound was similar between agents (Figure 1, Supplemental Figure S1). In other words, the magnitude of change (including those without change) across all probes relative to that of the controls was overall similar between all the treatment groups (Supplemental Figure S1). The overall Pearson correlation coefficients were ≥ 0.60 for each possible comparison between chemical agents and doses (Figure 2), with P values <.001 for all correlation pairs, Overall, Cr(VI)-induced transcriptomic responses showed slightly higher correlation with the responses to the lower doses of captan and folpet than the higher doses, with the following correlation coefficients: Cr(VI) vs 6000 ppm captan (0.66) and 12 000 ppm captan (0.60); Cr(VI) vs 6000 ppm folpet (0.63) and 16 000 ppm folpet (0.62). Additionally, the total number of unique DEGs between any 2 treatment groups was relatively low (eg, statistical comparison between expression levels in the captan 12 000 ppm exposure group vs folpet 16 000 ppm exposure group showed only 46 DEGs; Supplemental Figure S2).
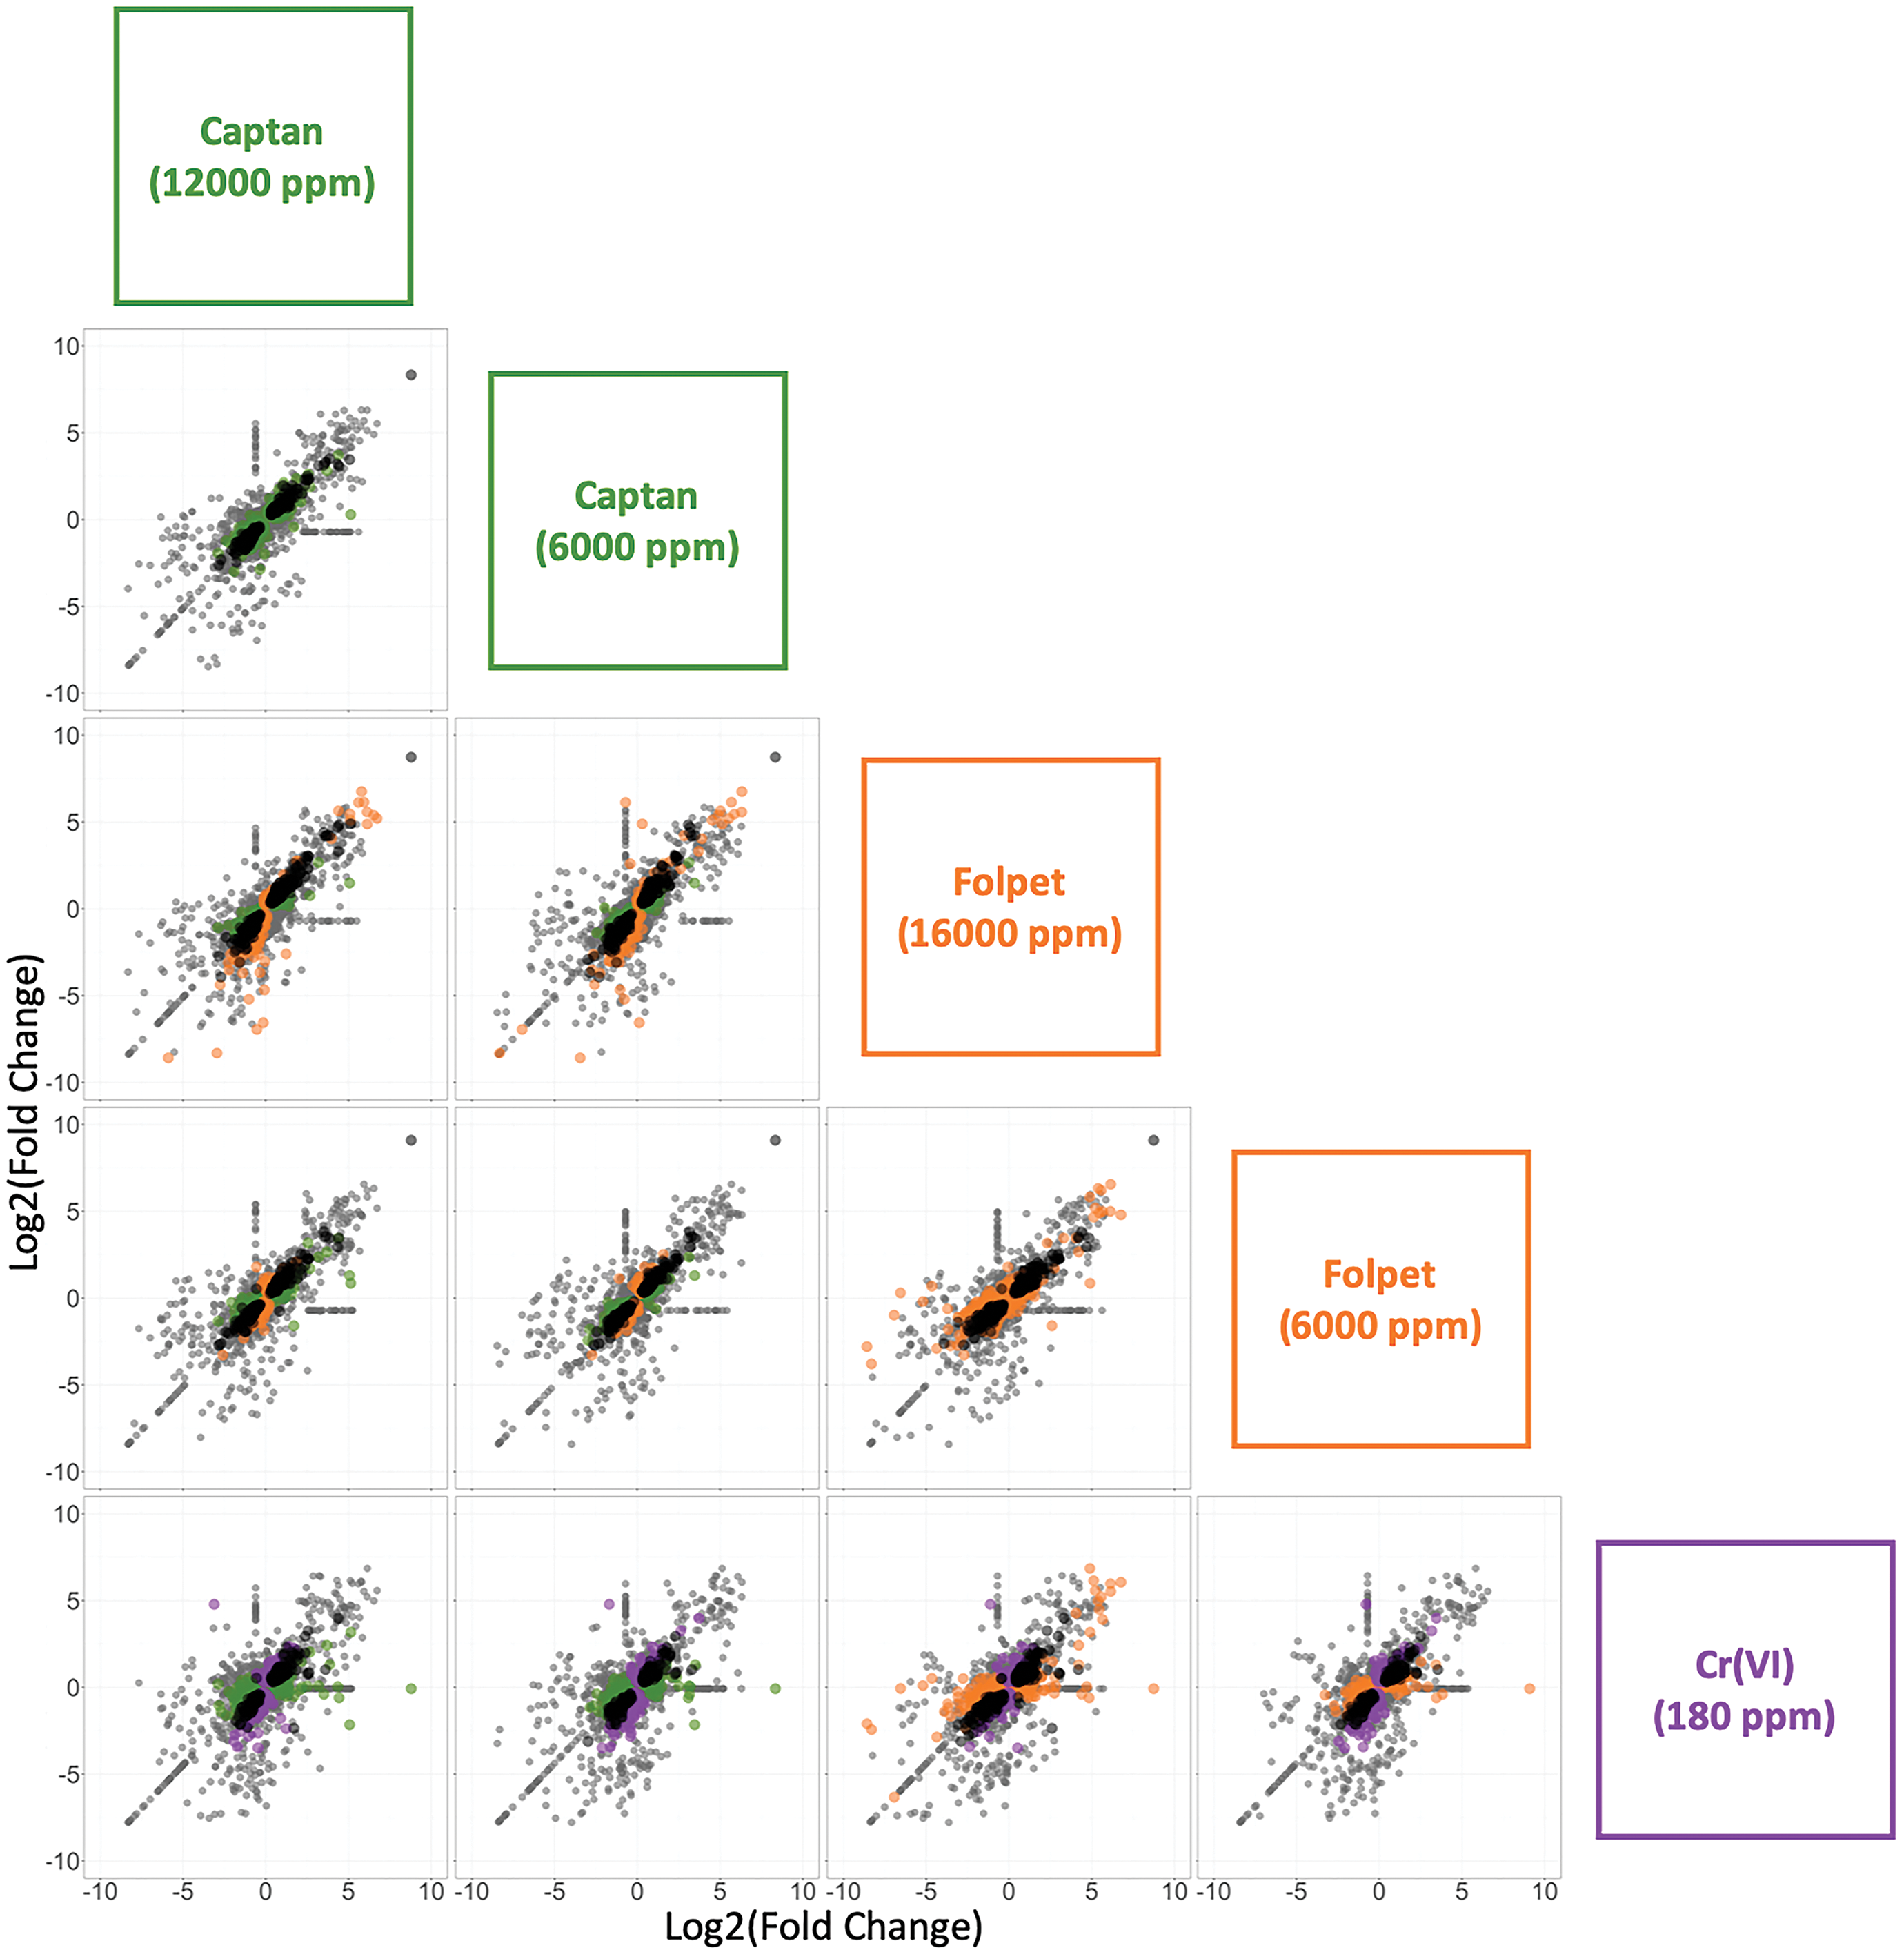
Comparison of differentially expressed genes (DEGs) associated with Cr(VI), captan, or folpet in the mouse intestine. The fold change (exposed/control) in expression for all genes are plotted on the x and y axes according to the labels in the boxes on the right side of the matrix. Significant DEGs (relative to controls) are shown in different colors by agent, according to the following: green (captan), orange (folpet), and purple (Cr[VI]). All of the genes that were significantly differentially expressed (relative to controls) by both treatments in a given comparison are represented by black points in each plot. All genes that were not significantly differentially expressed in either treatment group are represented by grey points.
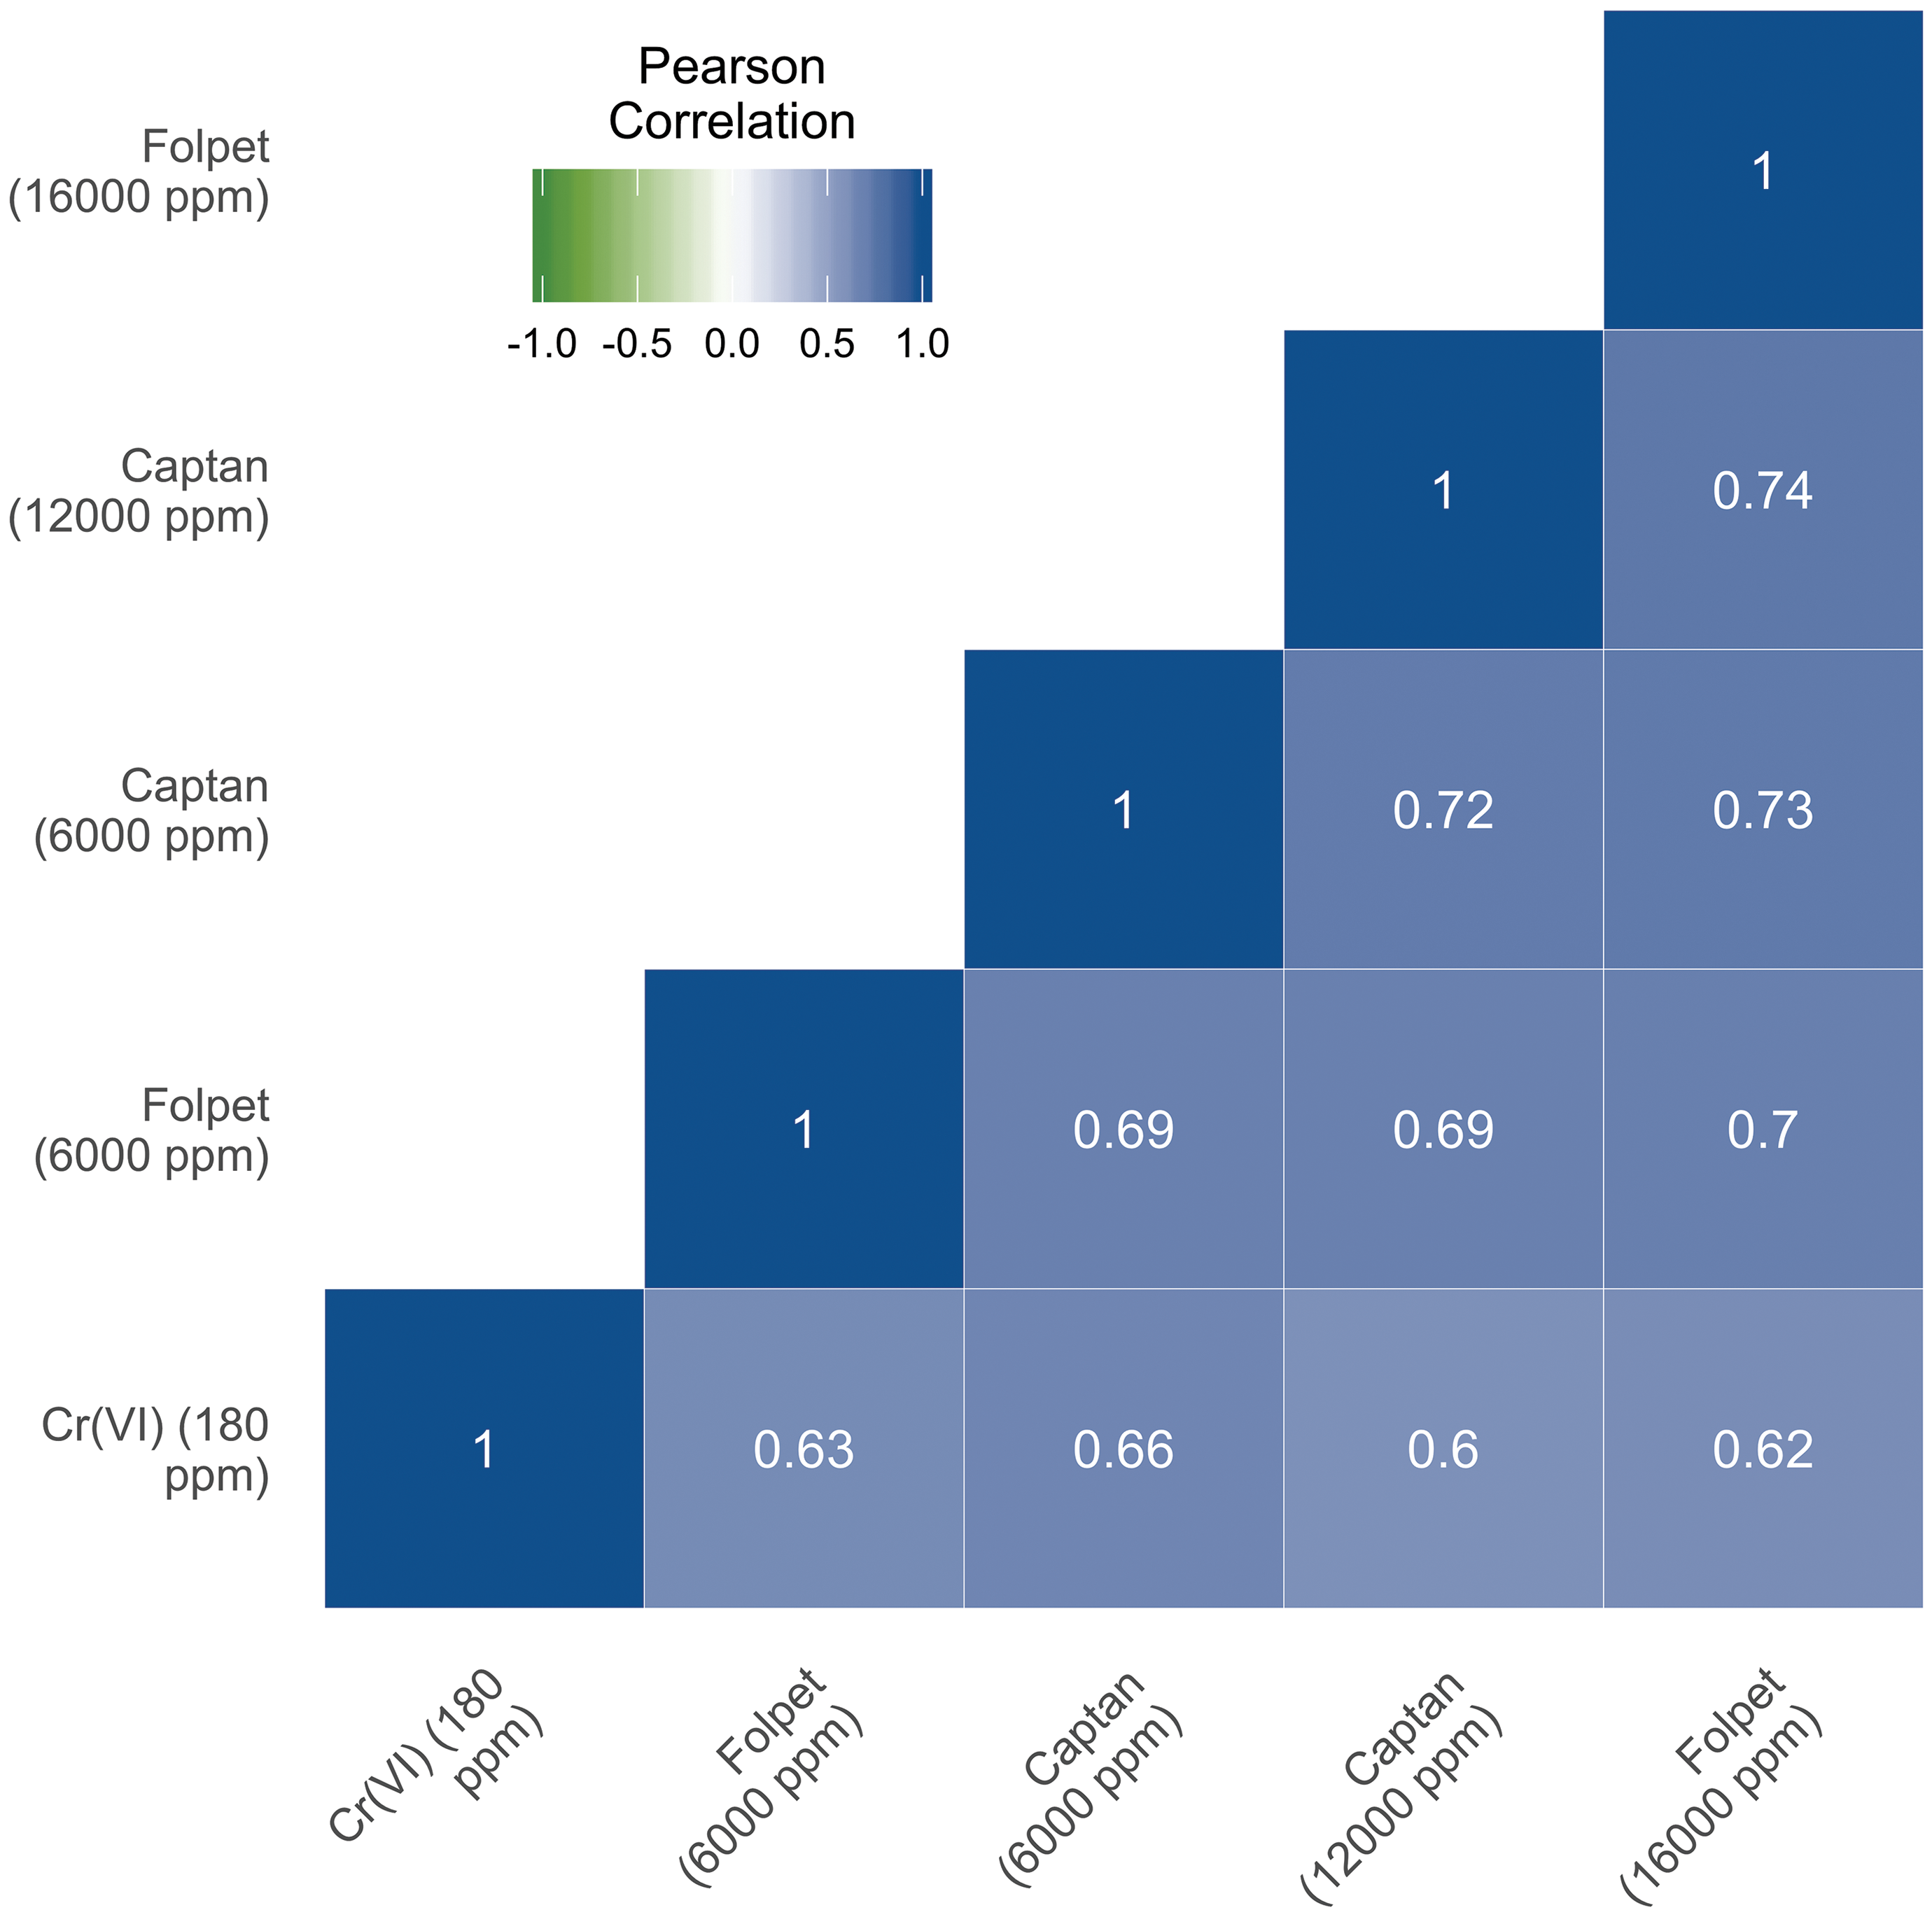
Correlations between exposure-induced changes in gene expression profiles across the entire S1500+ gene set. Pearson correlations were calculated based on the mean log2(fold change) of each gene between each treatment group. Treatment groups are ordered in the matrix according to unsupervised clustering based on similarity.
Comparative Analysis Between Genes With Significant Differential Expression Across Substances
The lists of DEGs associated with each exposure condition were compared both visually and statistically. Visual comparisons using scatter plots, MA plots, and Venn diagrams demonstrate a high degree of overlap between genes with differential expression associated with each exposure condition (Figures 1 and 3, Supplemental Figures S1-S3). For example, there were a total of 748 DEGs across all exposures, and 98 of these were altered in every treatment group (Supplemental Figure S3). Hexavalent chromium associated responses had a slightly higher global concordance with the responses observed in the low-dose captan and folpet exposure groups than in the high-dose groups (Pearson correlation coefficients of 0.67 vs 0.61 for captan and 0.64 vs 0.62 for folpet). However, when looking strictly at the genes with statistically significant changes in expression, the high-dose group had greater overlap with Cr(VI). For the low-dose captan and folpet comparison to Cr(VI), 180 DEGs are common between at least 1 of the 2 pesticides and Cr(VI), with 126 of those being common to all 3 exposure groups (Figure 3, upper panel). For the higher concentrations of captan and folpet, a total of 209 DEGs are common between Cr(VI) and either captan or folpet, and 140 of those genes are differentially expressed by all 3 agents (Figure 3, lower panel). Notably, all of these overlapping genes showed differential expression in the same direction across all 3 exposure conditions (Figure 3).
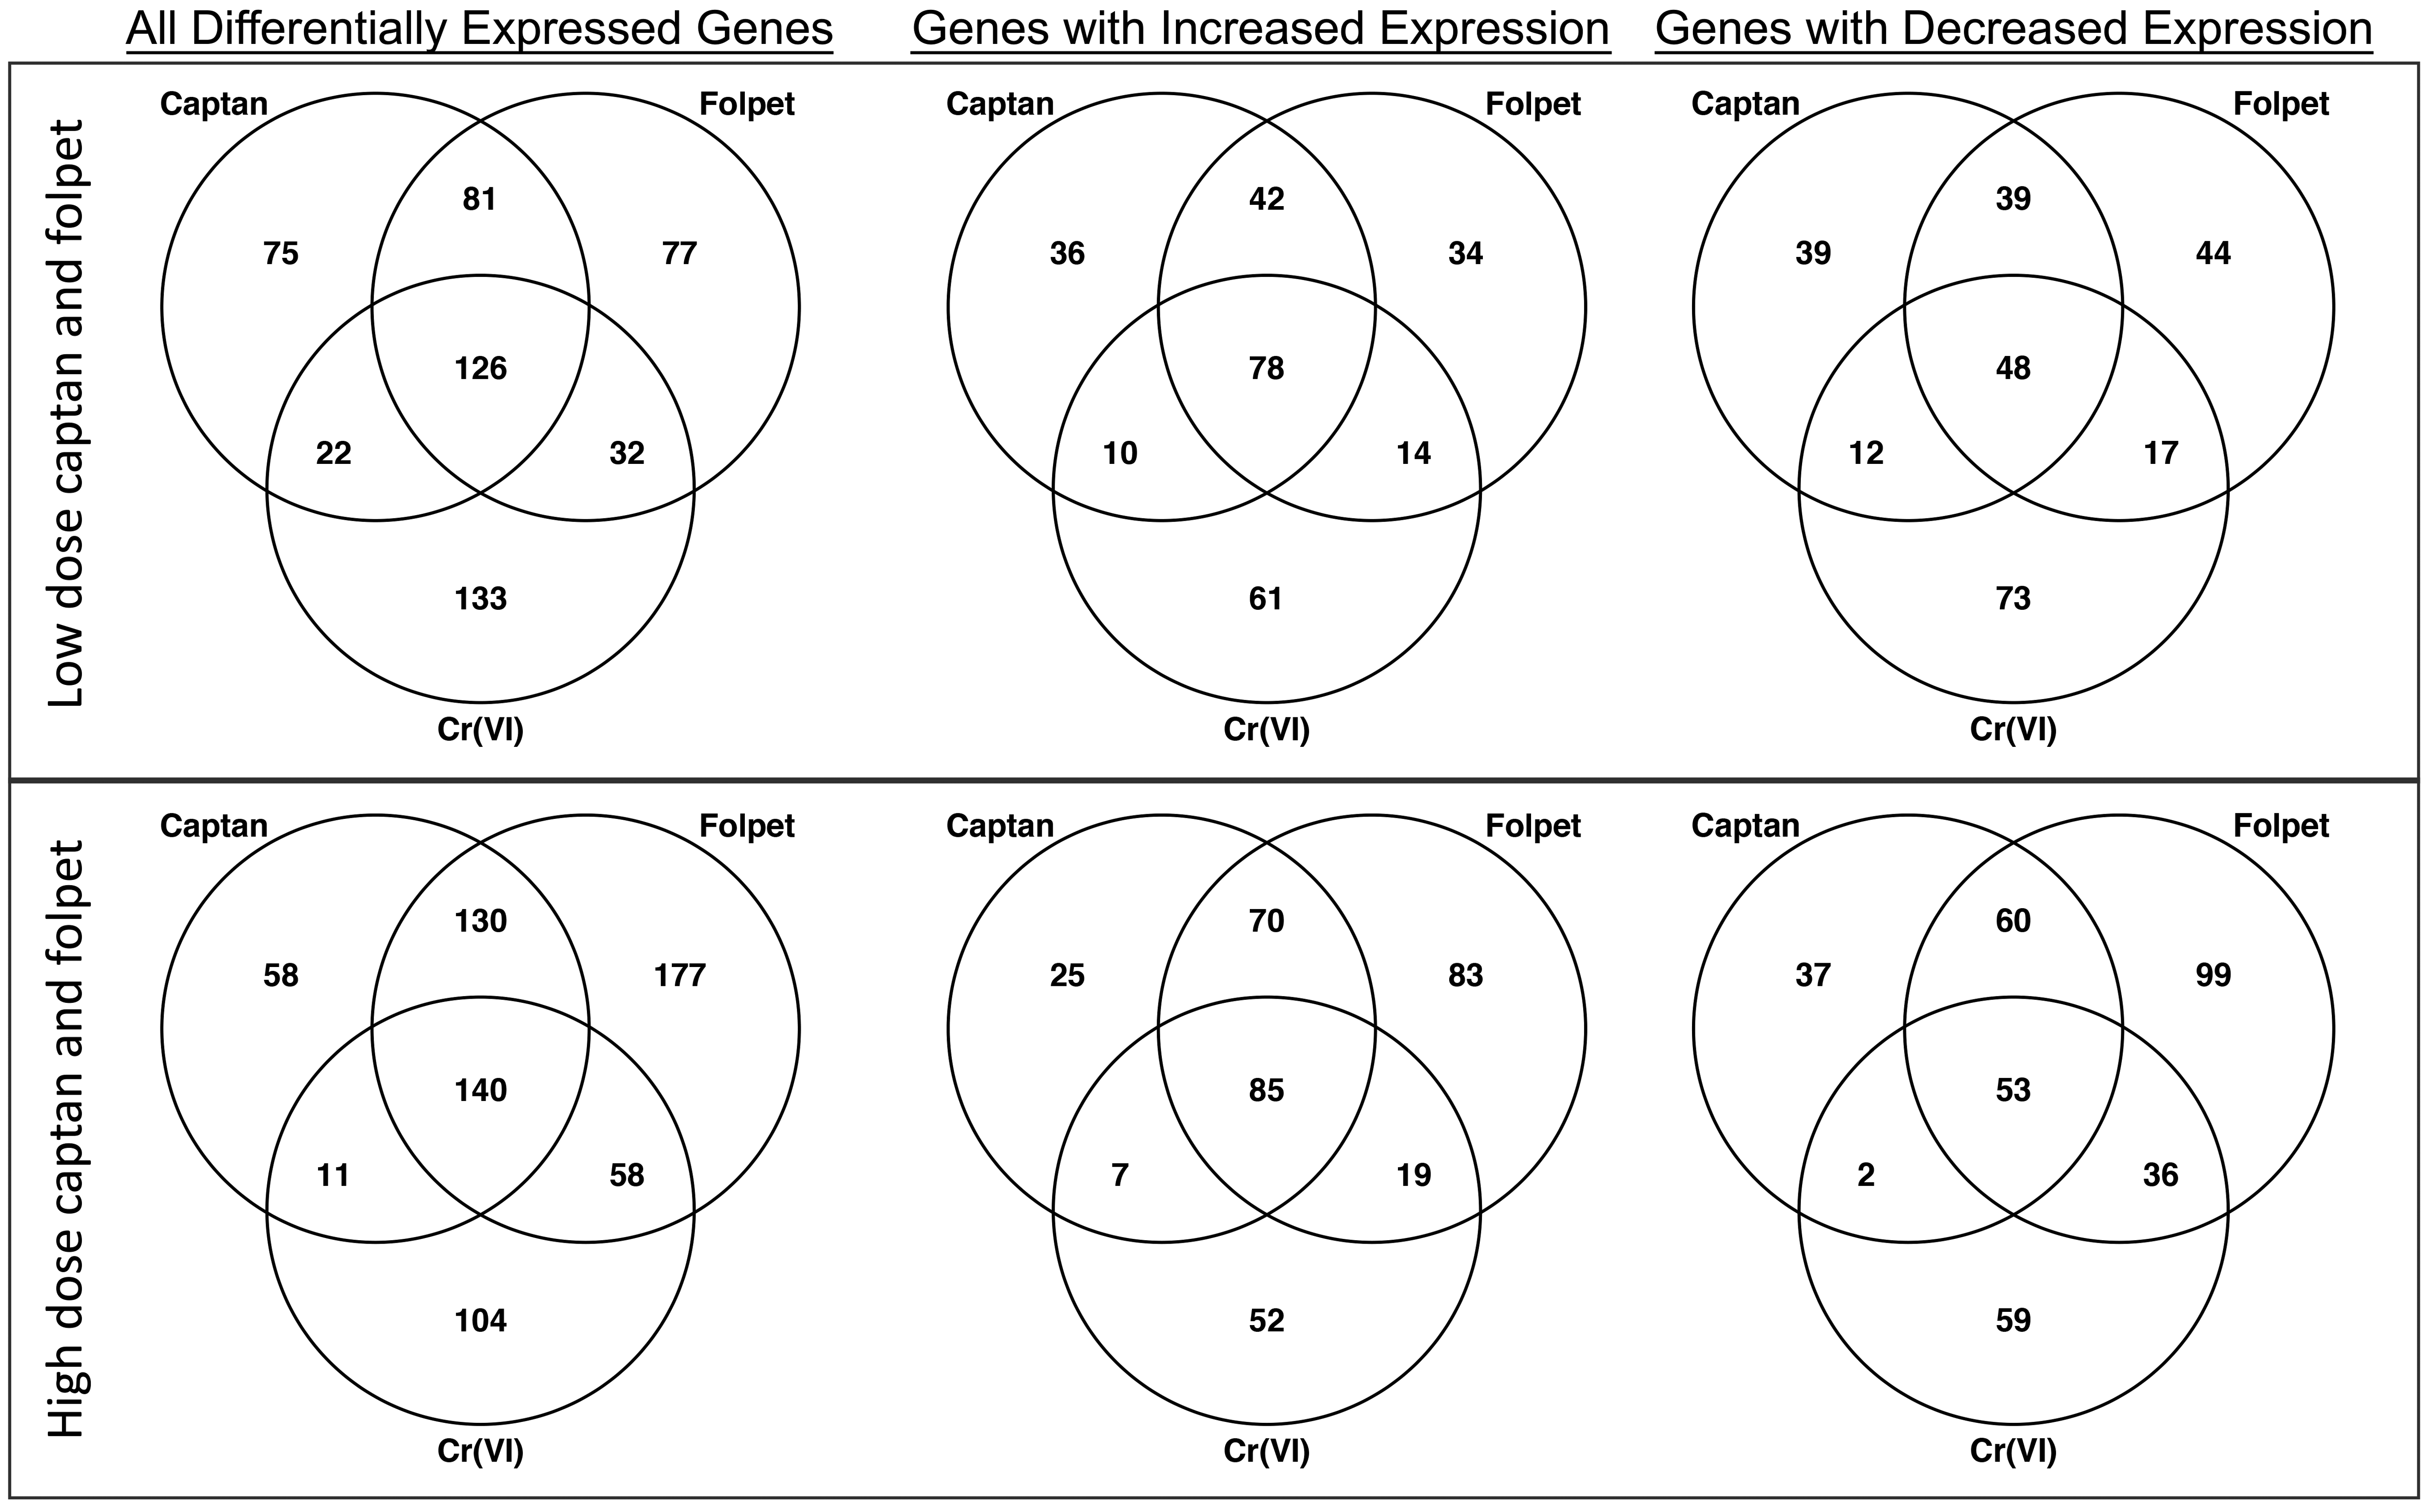
Comparison of the numbers of genes identified as differentially expressed by Cr(VI), captan, and folpet in the mouse intestine. Counts are out of a total of 2754 genes that were measured from the S1500+ gene set. The top panel shows a comparison between the Cr(VI) (180 ppm in drinking water) and the lower dose captan and folpet groups (6000 ppm in the feed). The bottom panel shows the comparison between the Cr(VI) (180 ppm in drinking water) and the higher dose captan and folpet groups (12 000 and 16 000 ppm, respectively, in feed). Note that all overlapping gene counts between all chemicals at all concentrations were significantly higher than those expected by chance (Fischer exact test P < .001).
Statistical comparisons were also carried out to compare the number of intersecting genes among the lists of DEGs associated with each exposure condition, out of the 2754 total genes evaluated. Every gene list comparison had intersecting gene numbers significantly greater (Fisher exact test, P < .001) than those expected by chance (Supplemental Table S3). Not surprisingly, the most significant number of intersecting genes was observed between mice treated with the same substances at 2 different doses; that is, the transcriptomic responses resulting from captan at 6000 ppm versus 12 000 ppm, as well as folpet at 6000 ppm versus 16000 ppm, had the highest significance in gene list similarities.
Comparative Analysis of Exposure-Induced Pathway Alterations
Transcriptomic response profiles for each exposure condition were evaluated for enrichment of biological and molecular pathways. An enrichment analysis across 1327 canonical pathways identified 143 upregulated pathways associated with Cr(VI) and/or captan and/or folpet at the lower concentrations, and 145 upregulated pathways associated with Cr(VI) and/or captan and/or folpet at the higher concentrations (Supplemental Table S4). Of these, 21 pathways were commonly modulated between Cr(VI) and the higher concentrations of captan and folpet (Figure 4, Table 3), and 25 were common between Cr(VI) and the 6000 ppm captan and folpet groups (data not shown). In several cases, similarly named pathways were identified in separate gene pathway databases, further confirming the findings and the methodology (eg, the very similar gene sets “Glycolysis Gluconeogenesis” in the KEGG database, “Glycolysis” in the Reactome database, and “Glycolysis Pathway” in the Biocarta database were all enriched). Global and gene-level transcriptomic changes related to captan and folpet in the 12 000 and 16 000 ppm dose groups, respectively, were the focus of the comparative analysis, as these higher doses represent the concentrations where the majority of duodenal tumors occurred in 2-year cancer bioassays. 7,2 However, it is notable that the overall transcriptomic changes were not significantly different between the different dose levels for each individual compound according to a Fischer exact test (Supplemental Table S3). Many of the upregulated pathways that were common for Cr(VI) and captan and folpet at the higher concentrations were involved in cellular metabolic processes. The peroxisome proliferator activated receptor (PPAR) and hypoxia inducible factor 1 (HIF1) pathways were identified among the most significantly enriched gene sets for all 3 agents. Also relevant to the HIF1 pathway was the enrichment of a related pathway containing overlapping genes: the induction of the activator protein 1 (AP1) family of transcription factors (ie, AP1 signaling), which are involved in cell growth, proliferation, and apoptosis (Table 3). The HIF1 and AP1 pathways included the following genes that were statistically significantly increased for all 3 agents at the higher concentrations: ATP-binding cassette, subfamily B (MDR/TAP), member 1A (Abcb1a), aldolase A, fructose-bisphosphate (Aldoa), BCL2/adenovirus E1B interacting protein 3 (Bnip3), carbonic anhydrase 9 (Car9), cAMP responsive element binding protein 3-like 3 (Creb3l3), Basic Helix-Loop-Helix Family Member E40 (Bhlhe40), mitogen-activated protein kinase 3 (Mapk3), and phosphofructokinase, liver, B-type (Pfkl; Figure 5). Other members of these signaling gene sets that were significantly upregulated by all 3 agents, but not at all concentrations, were FBJ osteosarcoma oncogene (Fos) and Jun proto-oncogene, AP-1 transcription factor subunit (Jun; data not shown).
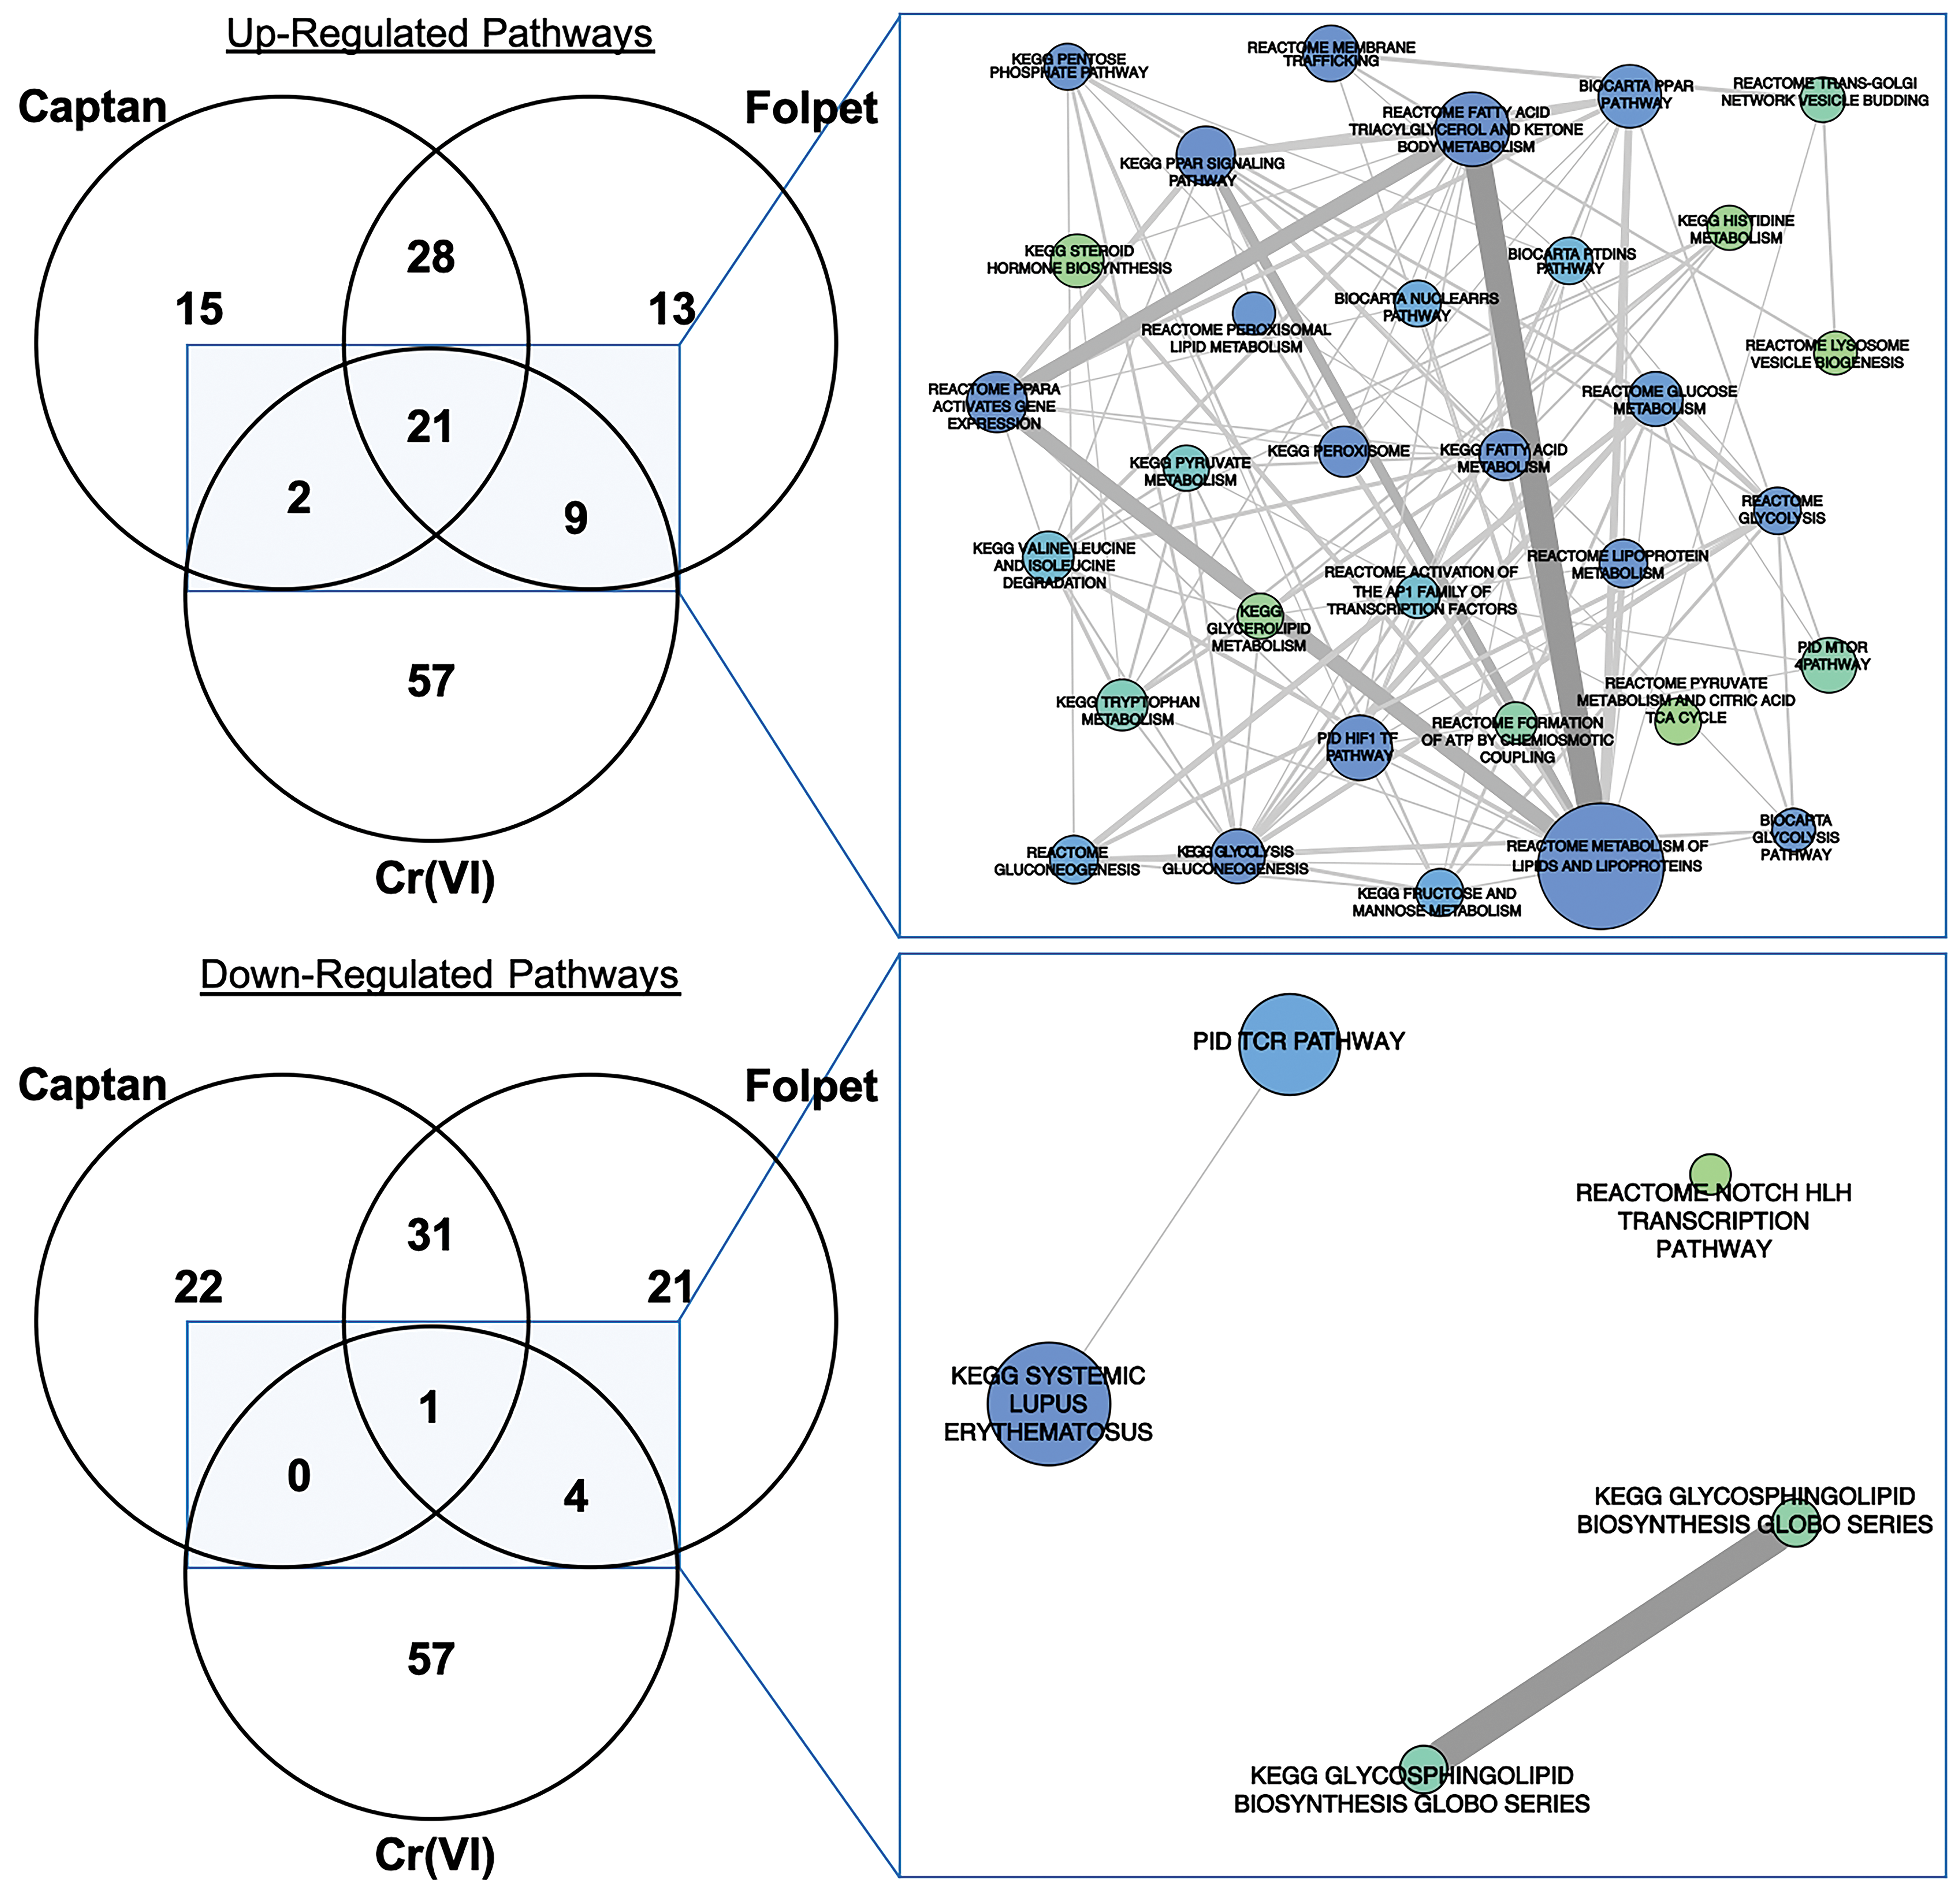
Comparison of pathways identified as associated with Cr(VI) (180 ppm via drinking water) and the high doses of captan and folpet (ie, 12 000 and 16 000 ppm, respectively, in feed) in the mouse intestine. On the left, Venn Diagrams show the comparisons between the numbers of enriched pathways, among the total of 1327 analyzed canonical pathways. On the right, the 32 overlapping upregulated pathways and the 5 downregulated pathways identified as associated with Cr(VI) and captan and/or folpet are illustrated a network plot. Circle sizes are proportional to the number of differentially expressed genes in each pathway (min = 3, max = 40), and colors represent enrichment P values specific to Cr(VI)-induced transcriptional responses (from green [P = .05] to blue [P = .0002]).
Upregulated Pathways (P value <.05) That Were Commonly Associated With Cr(VI) (180 ppm via Drinking Water), Captan (12 000 ppm via feed), and/or Folpet (16 000 ppm via feed) Exposures in the Mouse Intestine.
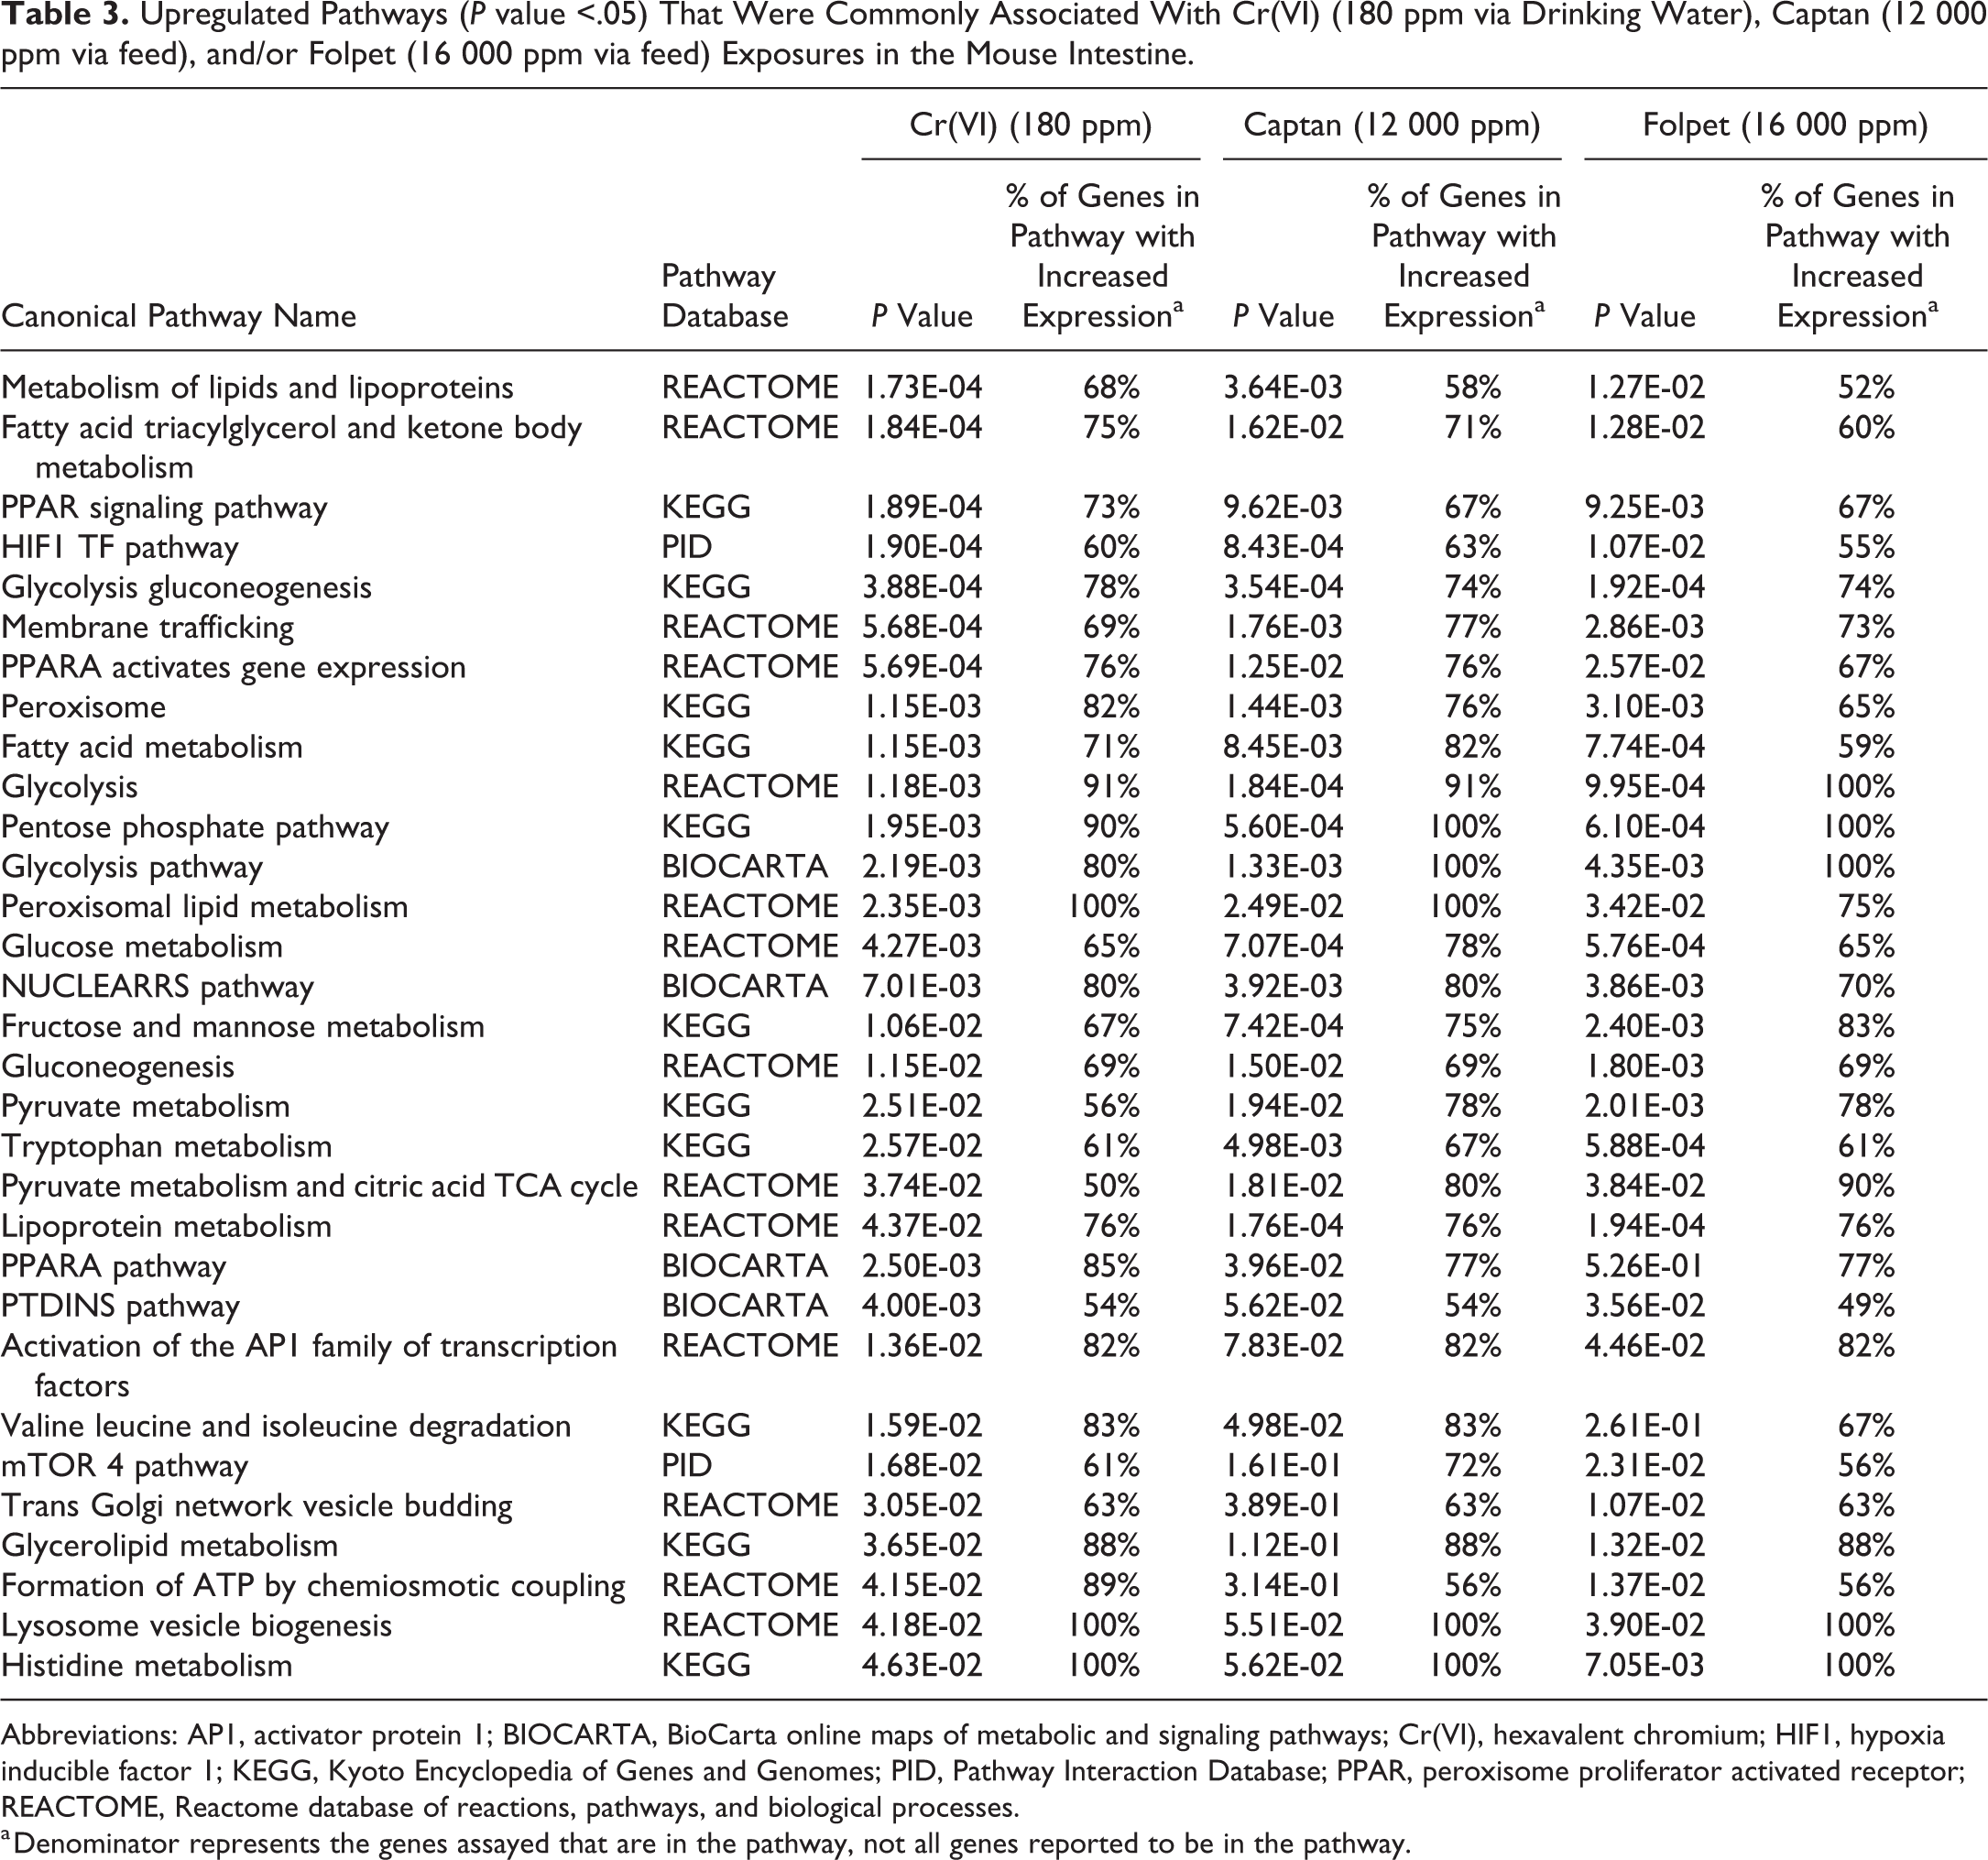
Abbreviations: AP1, activator protein 1; BIOCARTA, BioCarta online maps of metabolic and signaling pathways; Cr(VI), hexavalent chromium; HIF1, hypoxia inducible factor 1; KEGG, Kyoto Encyclopedia of Genes and Genomes; PID, Pathway Interaction Database; PPAR, peroxisome proliferator activated receptor; REACTOME, Reactome database of reactions, pathways, and biological processes.
a Denominator represents the genes assayed that are in the pathway, not all genes reported to be in the pathway.
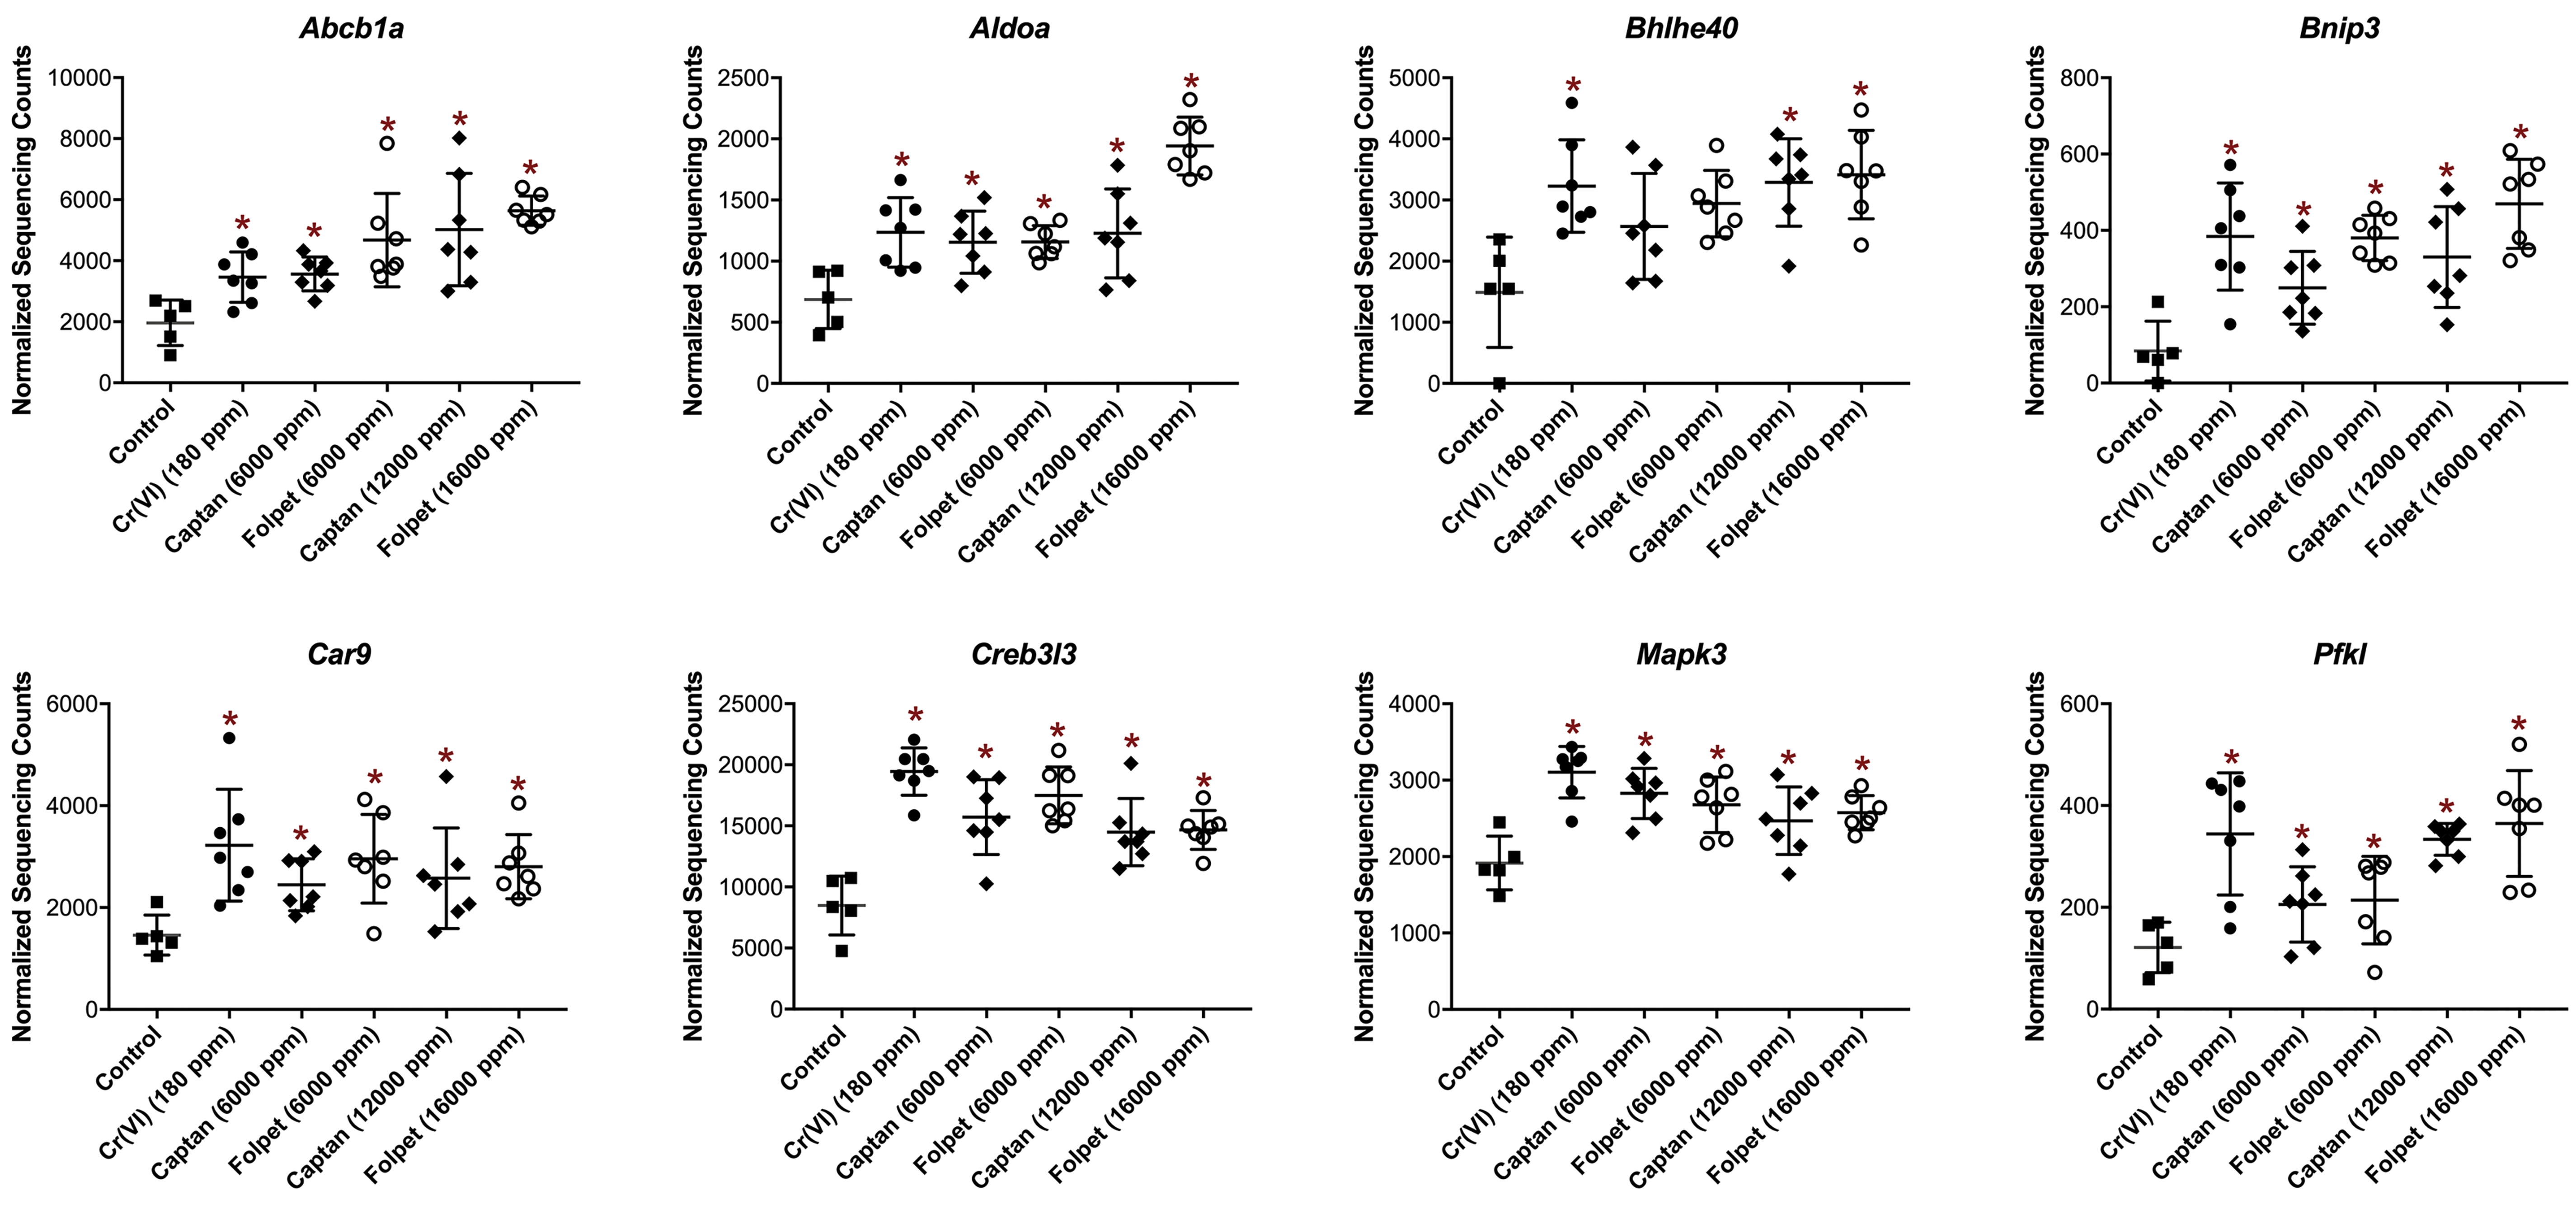
Expression levels of select genes driving the upregulation of the HIF1 and AP1 signaling pathways. (*) represents significant (FDR < 0.10) changes in expression compared to the control group. AP1 indicates activator protein 1; FDR, false discovery rate; HIF1, hypoxia inducible factor 1.
A total of 28 pathways were identified as enriched in the captan and folpet groups (high concentration), but not Cr(VI) (Supplemental Table S4). Almost all of these pathways were related to metabolism, including xenobiotic metabolism pathways, which are not known to be related to Cr(VI)-induced responses (eg, “Biological Oxidations” and “Glutathione Metabolism”, among others). These specifically included pathways involved in phase I metabolism (eg, multiple cytochrome P450 metabolism pathways), phase II metabolism (eg, phase II conjugation pathway), and general drug/xenobiotic metabolism pathways. Despite these effects, captan and folpet metabolism is primarily driven by chemical (nonenzymatic) reactions. 7,8 No clear group of pathways were upregulated specific to Cr(VI); however, there were more pathways relevant to inflammatory and immune response associated with Cr(VI) than the other agents (Supplemental Table S4).
Many of the pathways associated with the higher doses of captan and folpet overlapped with those identified when analyzing the lower doses of captan and folpet, with 47 and 40 pathways overlapping between the captan and folpet dose groups, respectively. Comparing the higher doses of captan and folpet versus Cr(VI) also identified similar pathways altered across agents, including HIF1 and AP1 pathways (Supplemental Table S4).
A total of 138 downregulated pathways were identified as associated with Cr(VI), captan (12000 ppm), or folpet (16000 ppm; Supplemental Table S5). Of these, 5 were modulated by Cr(VI) and captan/folpet (Figure 4, Table 4). There were an additional 28 canonical pathways identified with downregulation associated with the lower doses of captan (6000 ppm) and folpet (6000 ppm), bringing the total number of downregulated pathways to 166 (Supplemental Table S5). Many of these downregulated pathways were related to transfer RNA and mRNA processing. Many of the pathways associated with the higher doses of captan and folpet overlapped with those identified when analyzing the lower doses of captan and folpet, with 25 and 15 pathways overlapping between the captan and folpet dose groups, respectively.
Downregulated Pathways (P Value <.05) That Were Commonly Associated With Cr(VI) (180 ppm via Drinking Water), Captan (12 000 ppm via Feed), and/or Folpet (16 000 ppm via Feed) Exposures in the Mouse Intestine.
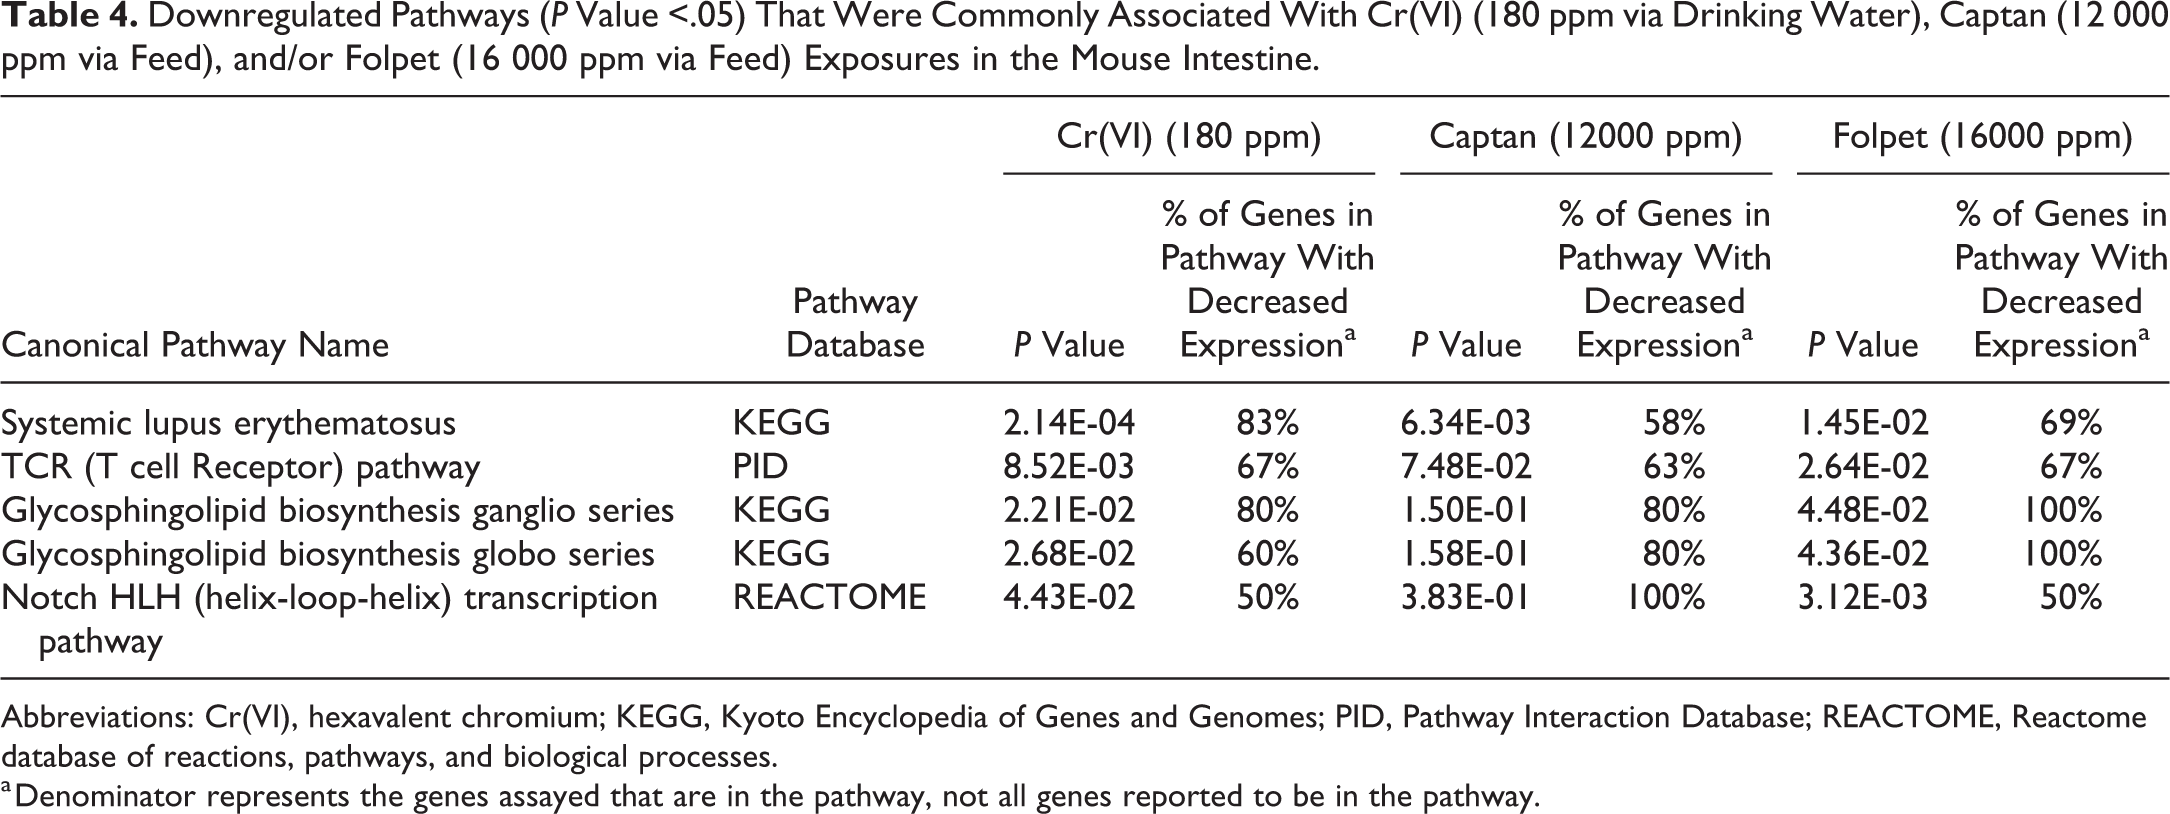
Abbreviations: Cr(VI), hexavalent chromium; KEGG, Kyoto Encyclopedia of Genes and Genomes; PID, Pathway Interaction Database; REACTOME, Reactome database of reactions, pathways, and biological processes.
a Denominator represents the genes assayed that are in the pathway, not all genes reported to be in the pathway.
Anchoring Transcriptomic Findings to Histopathological Data
The tissue slides used for transcriptomic evaluation in this study were collected from mouse duodenal tissue blocks previously evaluated via H&E staining, 6 thereby allowing for the direct phenotypic anchoring of transcriptomic changes resulting from Cr(VI), captan, and folpet exposure. Within these intestinal tissues, Cr(VI), captan, and folpet were all shown to cause crypt epithelial hyperplasia, villus enterocyte hypertrophy, increased villus enterocytes, and increased villus mononuclear cell infiltrate after 28 days of exposure. Pathways related to these phenotypic observations were enriched, specifically in the upregulated direction, for Cr(VI) and either or both captan and folpet (Table 5). Specifically, pathways involved in cell growth, proliferation, and cell cycle signaling (eg, HIF1, AP1, mTOR (mammalian target of rapamycin), and PPAR pathways) were upregulated.
Phenotypic Anchoring of Biological Pathway Alterations Identified as Commonly Associated With Exposure to Cr(VI), Captan, or Folpet.a
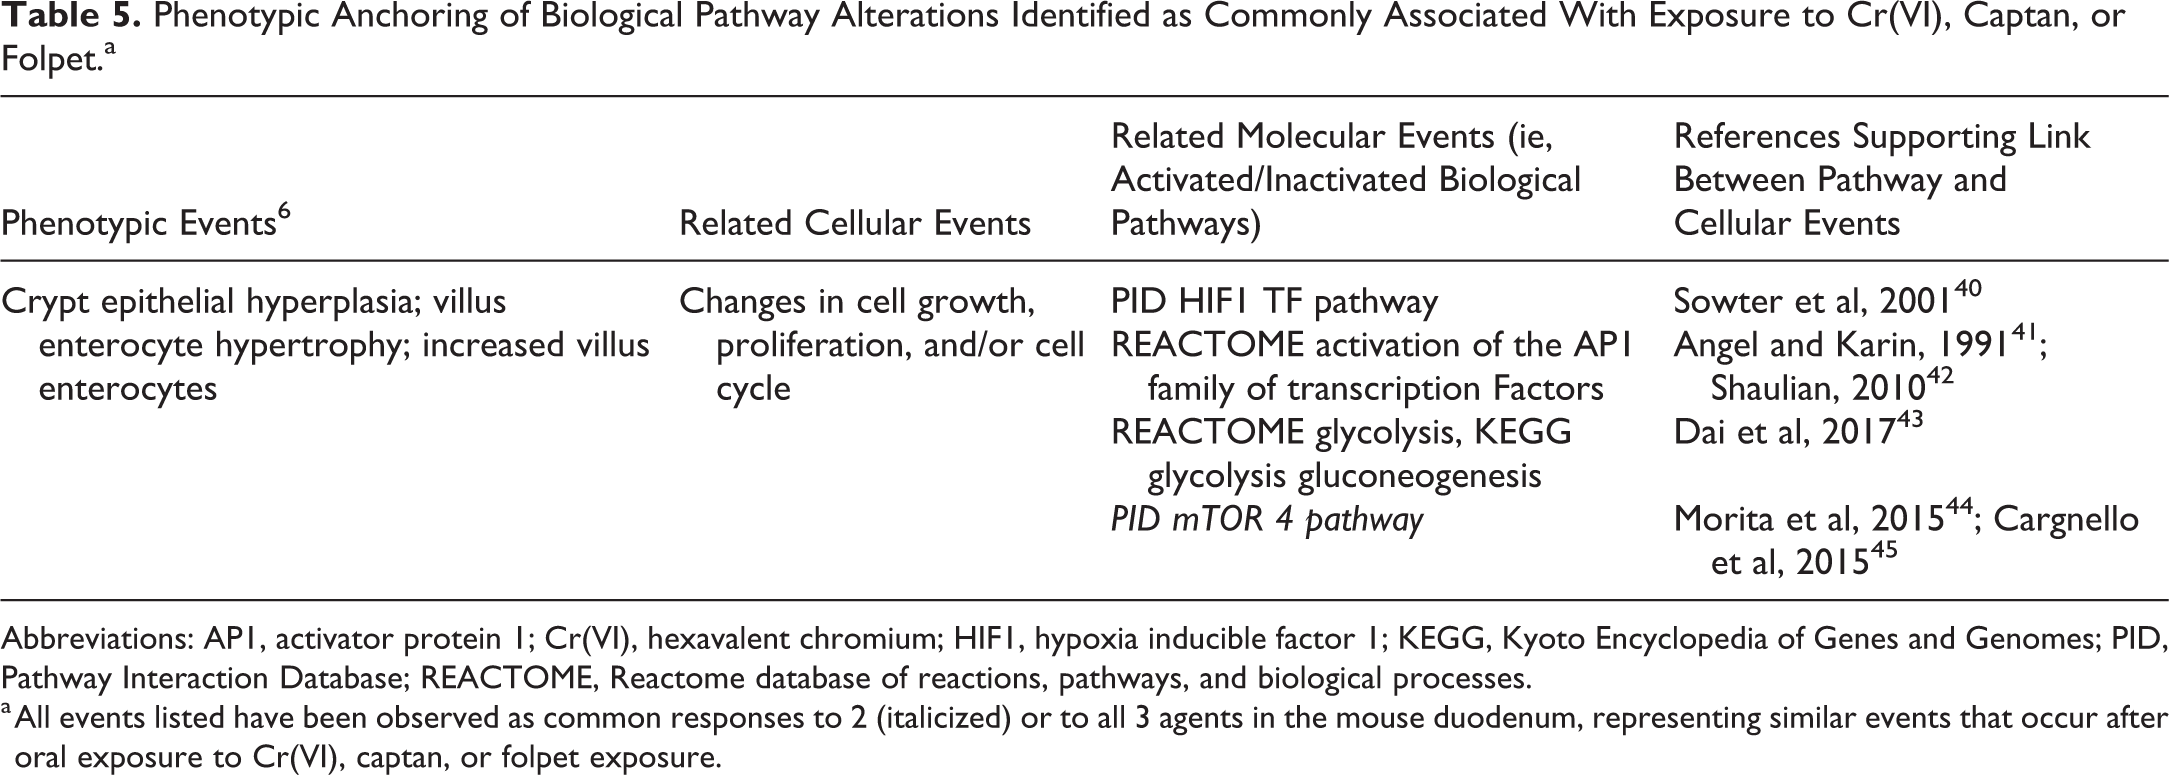
Abbreviations: AP1, activator protein 1; Cr(VI), hexavalent chromium; HIF1, hypoxia inducible factor 1; KEGG, Kyoto Encyclopedia of Genes and Genomes; PID, Pathway Interaction Database; REACTOME, Reactome database of reactions, pathways, and biological processes.
a All events listed have been observed as common responses to 2 (italicized) or to all 3 agents in the mouse duodenum, representing similar events that occur after oral exposure to Cr(VI), captan, or folpet exposure.
Discussion
The interpretation of intestinal tumors in rodents in regard to human health risk assessment is complicated by the paucity of case examples, as these tumors are rare in 2-year cancer bioassays. By examining similarities in the toxicity of 3 mouse intestinal carcinogens, we have identified commonalities across the chemicals that might inform the risk assessment of the agents by providing information relevant to molecular events potentially relevant to an AOP. Hexavalent chromium, captan, and folpet are all hypothesized to cause intestinal carcinogenesis as a result of chronic irritation and regenerative hyperplasia. 7 –10 Similar histopathological lesions in the duodenum have been demonstrated for the 3 agents in a single study that used carcinogenic oral doses, 6 and herein we demonstrate that transcriptomic analyses of the same intestinal sections exhibit a high degree of correlation for global changes in transcriptional profiles, with significant overlap between the genes identified as differentially expressed by each agent.
Hexavalent chromium, captan, and folpet induced similar changes in several signaling pathways, including those related to stress and injury. The results thereby show similar transcriptomic responses associated with Cr(VI), captan, and folpet at the global-, gene-, and pathway-level. This similarity in overall transcriptomic profiles, as well as in the previously published pathological characteristics, suggests that these substances may share common key events involved in intestinal tumorigenesis. Importantly, the 28-day exposure used in this study is mechanistically relevant for MOA and AOP analyses because the responses are neither acute nor confounded by neoplasia. Moreover, 28-day studies are included in OECD guidelines such as the 28-day repeated dose toxicity study (OECD TG 407) and the in vivo transgenic rodent mutation assay (OECD TG 488). The doses selected are relevant as they are known to be carcinogenic under 2-year bioassay exposure conditions. 2,3
Evaluation of transcriptomic responses at the pathway-level identified alterations in several canonical pathways, including those potentially related to intestinal injury. The HIF1 signaling pathway and the AP1 transcription factor family gene set were among those identified as significantly enriched within transcriptional responses across all agents. Hypoxia inducible factor 1 signaling was previously identified as being associated with Cr(VI)-induced transcriptional responses in the mouse duodenum after 7 and 90 days of exposure (≤180 ppm Cr[VI]) using complementary DNA microarray-based technologies. 46 Hypoxia inducible factor 1 has been shown to play a role in intestinal injury; for example, partially HIF1a-deficient mice exhibited attenuated reperfusion injury compared to wild-type mice, as characterized by reduced villus injury scores and measures of intestinal permeability, lipid peroxidation, and inflammation. 47 Markers of HIF1 and AP1 activation have also been identified in the duodenal epithelium concomitant with hypoxia-induced oxidative stress in a rat model of chronic intermittent hypoxia. 48 Specifically, increased expression levels of nicotinamide adenine dinucleotide phosphate oxidase 2 (Nox2), a marker of oxidative stress, corresponded to increased expression levels of Hif1a, a marker of hypoxia, and c-fos, a marker of AP1 activation. These changes in gene expression were observed in combination with duodenal injury, including disintegration of the mucosal villi and increased villous injury scores in intermittent hypoxia-exposed rats. 48 These co-occurring phenotypic and molecular changes support the role of HIF1 and AP1 signaling in intestinal tissue injury.
Gene sets related to glycolysis and gluconeogenesis were also upregulated in all treatment groups, a molecular phenomenon that has previously been shown to be mediated by Cr(VI)-induced reduction in fructose-1,6-bisphosphatase, a gluconeogenesis regulatory enzyme, in human bronchial epithelial BEAS-2B cells in vitro. 43 The loss of the enzyme results in lower reactive oxygen species and decreased apoptosis. 43 Notably, the same study reported an increase in AP1 protein level in Cr(VI)-transformed cells.
Genes that were among the most significantly differentially expressed within the HIF-1 and AP-1 pathways in all or nearly all treatment groups included Abcb1a, Aldoa, Bnip3, Car9, Fos, Jun, and Mapk3. These genes are known to play important roles in stress response and cell death/proliferation, events that are consistent previous histopathological findings (Table 1). 6 For example, BNIP3 is a member of the Bcl-2 proapoptotic family, and is upregulated during hypoxic conditions, including hypoxia specifically induced through HIF1. 40 BNIP3 and HIF1 were also measured at increased expression levels in multiple types of cancer. 40 FOS and JUN family proteins dimerize to form the AP1 complex, which in turn, regulates cell proliferation, differentiation, and transformation. 41,42 Upregulated signaling involving JUN has specifically been shown to regulate intestinal cancer in mice. 49
Interestingly, HIF-1α activity is suppressed by prolyl hydroxylases that hydroxylate and target HIF-1 for proteasomal degradation. 50,51 These enzymes are dependent on molecular oxygen, 2-oxoglutarate, Fe2+, and ascorbate. Depletion of cellular ascorbate has been shown to decrease hydroxylase activity and increase HIF-1 activity in normoxic cells. 52 –54 Ascorbate is well-known to reduce Cr(VI), 55 and we have previously demonstrated that exposure to Cr(VI) causes dose-dependent decreases in duodenal iron levels. 56 These biochemical changes, by inhibiting hydroxylation and degradation of HIF-1α, might explain the increase in HIF-1 activity, ultimately leading to stress responses.
One potential limitation of this study is that molecular changes were measured in tissue sections that included both the crypt and villus regions of the mucosa. Histopathological differences in response to all 3 agents have been observed between these 2 regions, with the villus exhibiting marked signs of stress and injury, and the crypt showing signs of tissue regeneration. Chromium has been visualized/mapped in the duodenum of mice exposed to Cr(VI) in drinking water for 90 days by X-ray fluorescence microscopy. In 2 independent studies showed that Cr was present in intestinal villi but not the crypt region where stem cells reside—highlighting the need for future work to compare responses in crypts and villi. 57,58 Additional future work may include whole transcriptome sequence of tissues from one or more of the treatment groups; this would enable validation of the S1500+ gene set as employed herein and would also allow for a deeper analysis into the drivers of the enriched gene sets. Further, an additional study employing the same analytical methods using tissues from animals exposed to other known to be intestinal carcinogens (with and without intestinal injury), as well as compounds that do not cause intestinal cancer, would enhance the understanding of transcriptomic signatures using the S1500+ gene list for captan, folpet, and Cr(VI) relative to other compounds.
Although the full development of an AOP is beyond the scope of present work, the data reported herein provide evidence that structurally diverse intestinal carcinogens can cause toxicity through similar underlying processes at the molecular, cellular, and tissue level. Activator protein 1 and HIF1 signaling, which have direct relevance to intestinal injury and carcinogenesis, specifically in regard to proliferation, were among the pathways perturbed by all 3 agents. Additional pathways related to cell proliferation, growth, and signaling were phenotypically anchored to histopathological changes observed in the same tissues, including crypt epithelial hyperplasia, villus enterocyte hypertrophy, increased villus enterocytes, and increased villus mononuclear cell infiltrate. Future efforts can focus on constructing a formal AOP using established methods for organizing and documenting such pathways (OECD, 2017). Because AOPs are “living” documents, new evidence streams (eg, epigenetic modifications) in target tissues can be incorporated into and expand upon such an AOP for intestinal cancer. Further, an advantage of the current study is that the use of a standard exposure regimen (28 days), standard tissue preparation (FFPE sections), commercially available sample preparation method (TempO-Seq), the S1500+ gene set, standard analysis methodology (GSEA), and data repository (GEO) allows for comparison of gene expression signals for other known or potential intestinal carcinogens in future (or past) studies.
Supplemental Material
Supplemental Material, DS1_TPX_10.1177_0192623319873882 - Comparison of Gene Expression Responses in the Small Intestine of Mice Following Exposure to 3 Carcinogens Using the S1500+ Gene Set Informs a Potential Common Adverse Outcome Pathway
Supplemental Material, DS1_TPX_10.1177_0192623319873882 for Comparison of Gene Expression Responses in the Small Intestine of Mice Following Exposure to 3 Carcinogens Using the S1500+ Gene Set Informs a Potential Common Adverse Outcome Pathway by Grace A. Chappell, Julia E. Rager, Jeffrey Wolf, Milos Babic, Kyle J. LeBlanc, Caroline L. Ring, Mark A. Harris and Chad M. Thompson in Toxicologic Pathology
Supplemental Material
Supplemental Material, DS2_TPX_10.1177_0192623319873882 - Comparison of Gene Expression Responses in the Small Intestine of Mice Following Exposure to 3 Carcinogens Using the S1500+ Gene Set Informs a Potential Common Adverse Outcome Pathway
Supplemental Material, DS2_TPX_10.1177_0192623319873882 for Comparison of Gene Expression Responses in the Small Intestine of Mice Following Exposure to 3 Carcinogens Using the S1500+ Gene Set Informs a Potential Common Adverse Outcome Pathway by Grace A. Chappell, Julia E. Rager, Jeffrey Wolf, Milos Babic, Kyle J. LeBlanc, Caroline L. Ring, Mark A. Harris and Chad M. Thompson in Toxicologic Pathology
Supplemental Material
Supplemental Material, DS3_TPX_10.1177_0192623319873882 - Comparison of Gene Expression Responses in the Small Intestine of Mice Following Exposure to 3 Carcinogens Using the S1500+ Gene Set Informs a Potential Common Adverse Outcome Pathway
Supplemental Material, DS3_TPX_10.1177_0192623319873882 for Comparison of Gene Expression Responses in the Small Intestine of Mice Following Exposure to 3 Carcinogens Using the S1500+ Gene Set Informs a Potential Common Adverse Outcome Pathway by Grace A. Chappell, Julia E. Rager, Jeffrey Wolf, Milos Babic, Kyle J. LeBlanc, Caroline L. Ring, Mark A. Harris and Chad M. Thompson in Toxicologic Pathology
Supplemental Material
Supplemental Material, Supplemental_Tables_091019 - Comparison of Gene Expression Responses in the Small Intestine of Mice Following Exposure to 3 Carcinogens Using the S1500+ Gene Set Informs a Potential Common Adverse Outcome Pathway
Supplemental Material, Supplemental_Tables_091019 for Comparison of Gene Expression Responses in the Small Intestine of Mice Following Exposure to 3 Carcinogens Using the S1500+ Gene Set Informs a Potential Common Adverse Outcome Pathway by Grace A. Chappell, Julia E. Rager, Jeffrey Wolf, Milos Babic, Kyle J. LeBlanc, Caroline L. Ring, Mark A. Harris and Chad M. Thompson in Toxicologic Pathology
Footnotes
Authors’ Note
Grace A. Chappell and Julia E. Rager contributed equally.
Declaration of Conflicting Interests
The author(s) declared no potential conflicts of interest with respect to the research, authorship, and/or publication of this article.
Funding
The author(s) disclosed receipt of the following financial support for the research, authorship, and/or publication of this article: This work was supported by The Hexavalent Chromium Panel of the American Chemistry Council.
Supplemental Material
Supplemental material for this article is available online.
References
Supplementary Material
Please find the following supplemental material available below.
For Open Access articles published under a Creative Commons License, all supplemental material carries the same license as the article it is associated with.
For non-Open Access articles published, all supplemental material carries a non-exclusive license, and permission requests for re-use of supplemental material or any part of supplemental material shall be sent directly to the copyright owner as specified in the copyright notice associated with the article.