
Abstract
To identify the molecular profiles of islets from alloxan (ALX)- and streptozotocin (STZ)-treated rats, a microarray-based global gene expression analysis was performed on frozen islets isolated via laser capture microdissection. At 6 weeks old, rats were injected with ALX (40 mg/kg) or STZ (50 or 100 mg/kg) and then euthanized 24 hr later. Histopathological analysis showed β-cell necrosis, macrophage infiltration, and islet atrophy. The extent of these changes was more notable in the STZ groups than in the ALX group. Transcriptome analysis demonstrated a significant up- or downregulation of cell cycle arrest–related genes in the p53 signaling pathway. Cyclin D2 and cyclin-dependent kinase inhibitor 1A, mediators of G1 arrest, were remarkably altered in STZ-treated rats. In contrast, cyclin-B1 and cyclin-dependent kinase 1, mediators of G2 arrest, were remarkably changed in ALX-treated rats. Genes involved in the intrinsic mitochondria-mediated apoptotic pathway were upregulated in the ALX and STZ groups. Moreover, heat-shock 70 kDA protein 1A (Hspa1a), Hsp90ab1, and Hsph1 were upregulated in ALX-treated rats, suggesting that ALX treatment injures β cells via endoplasmic reticulum stress. These results contribute to a better understanding of gene expression in the pathogenesis of islet toxicity.
Endocrine pancreatic islets play a crucial role in regulating fuel metabolism, particularly circulating glucose (Rosol et al. 2013). Further, insulin-secreting β cells are more sensitive to chemical attacks than glucagon-secreting α cells and somatostatin-secreting δ cells (Hoyer and Flaws 2013). The clinical consequence of insulin deficiency is more severe than that of other hormone deficiencies involved in glucose metabolism, attributable to a lack of hormones that compensate for the loss of insulin action (Hoyer and Flaws 2013). Alloxan (ALX) and streptozotocin (STZ) are the most prominent chemicals used to induce pancreatic islet injury in experimental animals. These glucose analogs are selectively taken up into β cells via the glucose transporter 2; however, they injure the cells by means of different mechanisms (Gorus, Malaisse, and Pipeleers 1982; Karunanayake et al. 1976; Lenzen 2008). As such, reactive oxygen species (ROS) and DNA alkylation mediate the toxic action of ALX and STZ, respectively (LeDoux et al. 1986; Winterbourn, Cowden, and Sutton 1989; Winterbourn and Munday 1989).
Studying the molecular profiles of pancreatic islets in both ALX and STZ chemical toxicity models is essential to elucidate the mechanism of islet toxicity and to search for islet toxicity markers. The extremely high RNase content of the exocrine pancreas necessitates care in sample processing (Bynum and Ronzio 1976; Erickson et al. 2009); therefore, little is known about islet gene expression profiles in these toxicity models. Recently, laser capture microdissection was used to easily isolate islet RNA of sufficient quantity and quality for use in an expression study (Szulawski et al. 2016). Unlike the collagenase perfusion method of isolating pancreatic islets, laser capture microdissection allows both pathological and gene expression analyses to be performed with the same animal (Tonne et al. 2013). Further, the use of costly reagents is minimized, and multiple samples can be processed in a single day when using the laser capture microdissection method (Szulawski et al. 2016).
In this study, to identify the molecular profiles of pancreatic islets in ALX- and STZ-treated rats, a microarray-based global gene expression analysis was performed on frozen islets isolated via laser capture microdissection. We compared gene expression between the two models based on pathological characteristics and discuss the mechanistic differences associated with islet toxicity. Furthermore, the utility of this method for elucidating islet disorders is discussed.
Materials and Method
Chemicals, Animals, and Experimental Design
ALX monohydrate and STZ were purchased from Sigma-Aldrich Chemical Co. (St. Louis, MO) and Wako Pure Chemical Industries, Ltd. (Osaka, Japan), respectively. All other chemicals used in this study were of the highest purity available. Five-week-old male Crl: CD(SD) rats were obtained from Charles River Laboratories Japan, Inc. (Kanagawa, Japan) and were acclimated for 1 week. All animals were housed with a 12-hr lighting period and were allowed free access to food (CRF-1, Oriental Yeast Co., Ltd., Tokyo, Japan) and water. At 6 weeks old, rats were allocated to four groups composed of five animals each: a control group (saline), an ALX-treated group, a low-dose STZ-treated group, and a high-dose STZ-treated group. ALX and STZ powders were dissolved in a saline solution at the required concentration just prior to use. A single dose of 40 mg ALX per kg body weight or 50 or 100 mg STZ per kg body weight was administered intravenously based on the weight of the animal (5 ml/kg). All animals were sacrificed 24 hr after administration. All experimental procedures were conducted after the study was approved by the Institutional Animal Care and Use Committee in our facility.
Body Weights and Serum Glucose Measurements
Blood from non-fasted rats was sampled from the posterior vena cava under isoflurane anesthesia using a tube containing heparin sodium. Plasma was obtained via centrifugation (3,000 rpm, 4°C, 15 min) and was then subjected to glucose analysis using an automatic analyzer (Hitachi 7180; Hitachi High-Technologies Co., Tokyo, Japan). Statistical significance was determined using GraphPad Prism 7 (San Diego, CA). Body weight gain and serum glucose are expressed as means ± standard deviation in the table. Statistical significance was evaluated using one-way analysis of variance (ANOVA) followed by Tukey’s multiple comparison testing. If p values were <.05, differences from the control group were considered significant.
Tissue Sampling, Histopathology, Immunohistochemistry, and Terminal Deoxynucleotidyl Transferase dUTP Nick End Labeling (TUNEL) Assay
We removed the pancreas from the rats under isoflurane anesthesia. The tissues were washed with cold physiological saline, lightly dried with a paper towel, and randomly sectioned into two pieces. One piece was embedded in optimum cutting temperature compound and frozen in −80°C acetone for microarray analysis. The elapsed time from excision of the pancreas to freezing was no longer than 1 min. The other tissue piece was fixed in 10% neutral-buffered formalin and embedded in paraffin. A 3-µm section of the pancreas was stained with hematoxylin and eosin using a routine method. Tissues were scored semiquantitatively for degree of pathology on a scale and graded into five categories: none (score 0), minimal (score 1), mild (score 2), moderate (score 3), and marked (score 4).
To investigate the target cells of pancreatic islet injury and to confirm the type of infiltrating inflammatory cells, immunohistochemical staining was conducted with insulin, glucagon, somatostatin, ionized calcium-binding adapter molecule 1 (Iba1), and cluster of differentiation 3 (CD3). Serial 3-µm sections were labeled using the peroxidase-conjugated immune-polymer method (Kato et al. 2013). The immunohistochemical staining conditions are detailed in Table 1; these specimens were qualitatively evaluated.
Immunohistochemical Methods for the Analysis of ALX- and STZ-induced Islet Toxicity.
Note: ALX = alloxan; CD = cluster of differentiation; Iba1 = ionized calcium-binding adapter molecule 1; STZ = streptozotocin.
a Abcam Inc., Cambridge, MA, USA.
b Wako, Osaka, Japan.
c NICHIREI BIOSCIENCE INC., Tokyo, Japan.
Pancreatic islet cells with DNA fragmentation were visually detected using a TUNEL in situ apoptosis detection kit (Takara Bio, Inc., Shiga, Japan). Quantitative analysis was performed by manually counting the pyknotic and TUNEL-positive cells among 10 islets selected randomly. Statistical analyses of the pyknotic and TUNEL-positive cells were performed as indicated in Body Weights and Serum Glucose Measurements section.
Laser Capture Microdissection
Frozen tissue specimens were sectioned (10–20 μm thick), and serial sections were transferred to MembraneSlides NF 1.0 PEN (Carl Zeiss, Göttingen, Germany); 20 to 40 islet tissue sections were required to obtain sufficient numbers to conduct a microarray analysis. Frozen sections on MembraneSlides were stored at −80°C until staining. Sections were stained with cresyl violet using the Ambion laser capture microdissection staining kit (Applied Biosystems, Carlsbad, CA). After staining, the sections were air-dried under the fume hood for 10 min to evaporate residual xylene and stored in a sealed container with dry silica gel until isolated via laser capture microdissection. Islets of the stained sections were isolated on the same day using a PALM laser-dissecting microscope (Carl Zeiss, Göttingen, Germany). Pancreatic islets were collected in RLT lysis buffer containing β-mercaptoethanol stored on ice.
RNA Isolation of Normal Islets and Proliferative Islet Lesions in Rats
Microarray analyses were conducted on five samples per group. Total RNA was prepared from the isolated pancreatic islet cells using the miRNeasy mini Kit (Qiagen, Valencia, CA) according to the manufacturer’s instructions. The concentration and quality of RNA were assessed using a Multiskan GO (Thermo Fisher Scientific, Yokohama, Japan) and a 2100 Bioanalyzer (Agilent Technologies, Santa Clara, CA). RNA extraction and amplification yielded rRNA ratios with an 18S:28S of 1.2 to 2.3 (mean: 1.75). RNA integrity number (RIN) values were 6.0 to 8.1 (mean: 7.23) for the samples (Online Supplemental Figure 1). RNA concentrations were 14 to 48 ng/µl, and the RIN values tended to be good in the samples with high RNA concentrations.
Processing of Microarrays
The procedure was conducted according to the manufacturer’s instructions using a 3’ IVT Express Kit (Affymetrix, Santa Clara, CA). In brief, 150 ng total RNA was used as the template in each reaction. Fragmented biotin-labeled cRNA (10 μg) was hybridized to a Rat Genome 230 2.0 Array (Affymetrix) for 17 hr at 45°C and 60 rpm. The array was then washed and stained with streptavidin-phycoerythrin using a Fluidics Station 450 (Affymetrix) and scanned with a Gene Array Scanner GCS3000 7G (Affymetrix). Microarray Analysis Suite 5.0 (MAS, Affymetrix) was used to quantify the microarray signals.
Microarray Data Analysis
The microarray data were first imported into Spotfire® DecisionSite for functional genomics (Spotfire, Göteborg, Sweden), and all signal intensities for each chip were normalized to the global mean. Following statistical filtering among three groups using a t test for the ALX-treated group (p < .01) or one-way ANOVA for the STZ-treated groups (p < .01), probes that were upregulated or downregulated more than 2-fold that of vehicle control islets were selected as significantly changed genes. In this step, the Affymetrix Detection Call algorithm was also used, and probes that were upregulated, showing all present calls in treated rats, and probes that were downregulated, showing all present calls in control rats, were selected. To classify these selected genes into groups with a similar pattern of expression, each gene was assigned to an appropriate category according to its main cellular function. To determine significantly overrepresented gene ontology (GO) categories and significant enrichment of pathways, GO and pathway analyses were performed using the Database for Annotation, Visualization, and Integrated Discovery functional annotation tool (http://david.abcc.ncifcrf.gov/); a p value of <.001, determined by means of Fisher’s exact test, was considered statistically significant. A level 5 analysis was adopted for the GO terminology. Pathway analyses were conducted by referring to the pathway diagram and constituent genes downloaded from the Kyoto Encyclopedia of Genes and Genomes database.
Results
Body Weight Changes and Serum Glucose Levels
Mean body weight gain was significantly lower in the STZ-treated groups than in the vehicle control and ALX-treated groups (Table 2). Serum glucose levels were significantly higher in the ALX- and STZ-treated groups than in the controls (Table 2).
Body Weight Gain and Serum Glucose Levels in the Control, ALX, and STZ Groups.
Note: Data are expressed as means ± SD. ALX = alloxan; BW = body weight, Glu = serum glucose level; STZ = streptozotocin.
a p < .01 versus vehicle controls.
b p < .01 versus ALX group.
c p < .05 versus STZ 50 mg/kg group.
Histopathology and Immunohistochemistry of Pancreatic Islets
Normal pancreatic islet cells were in small clusters and in contact with acini or ducts (Figure 1). The α cells (containing glucagon) and δ cells (containing somatostatin) were observed at the periphery of the islets, whereas the β cells (containing insulin) were in the center. A few Iba1-positive macrophages were sporadically observed in the islets.
Representative photomicrographs of islet sections from control, ALX, low-dose STZ, and high-dose STZ groups. Images of H&E staining and immunostaining for glucagon, insulin, and Iba1 are shown. Original objective, 400×. ALX = alloxan; STZ = streptozotocin; H&E = hematoxylin and eosin; Iba1 = ionized calcium-binding adapter molecule 1.
Mild vacuolar degeneration and necrosis were noted in the center of islets 24 hr after ALX dosing (Figure 1). The number of α and δ cells rarely differed from that of vehicle controls; however, the number of β cells was slightly decreased. The number of macrophages in the treated islets was slightly higher than the number of macrophages in the vehicle controls.
In the STZ-treated groups, mild to moderate degeneration/necrosis of the islet cells in the center and atrophy of islets with irregular borders were noted 24 hr after dosing (Figure 1). There were fewer β cells in the STZ-treated groups than in the vehicle controls, whereas the number of α or δ cells was relatively higher. Iba1-positive foamy macrophages were present in the center of islets to phagocytize the necrotic islet cells. These changes were more remarkable in the high-dose STZ-treated rats than in the low-dose STZ-treated rats. Islet atrophy and infiltration of macrophages were notable in the STZ-treated but not the ALX-treated rats (Figure 2A). CD3-positive T cells were rarely observed in the islets of rats treated with ALX or STZ (data not shown).
Histopathological phenotypes of islets from controls, ALX, and STZ groups. Top line: total histopathological score, colors reflect individual findings (the following scoring system was utilized: 0, within normal limits; 1, minimal; 2, mild; 3, moderate; 4, marked). Second line: the number of pyknotic cells per 10 islets is shown. Bottom line: TUNEL-positive cells per 10 islets are shown. Data for the pyknotic and TUNEL-positive cells are expressed as means ± SD. a p < .01 versus vehicle controls; b p < .05 versus vehicle controls; c p < .05 versus STZ low group; d p < .01 versus STZ high group. ALX = alloxan; SD = standard deviation; STZ = streptozotocin; TUNEL = terminal deoxynucleotidyl transferase-mediated dUTP nick end labeling.
Pyknotic and TUNEL-positive cells were counted to evaluate the degree of apoptosis, and the average number of cells in 10 islets per rat was calculated (Figure 2B and C). The number of pyknotic cells in the ALX- and STZ-treated groups was significantly higher than that in vehicle controls. However, the number of TUNEL-positive cells in ALX-treated rats was significantly higher than that in STZ-treated rats and the vehicle controls (Figure 3).
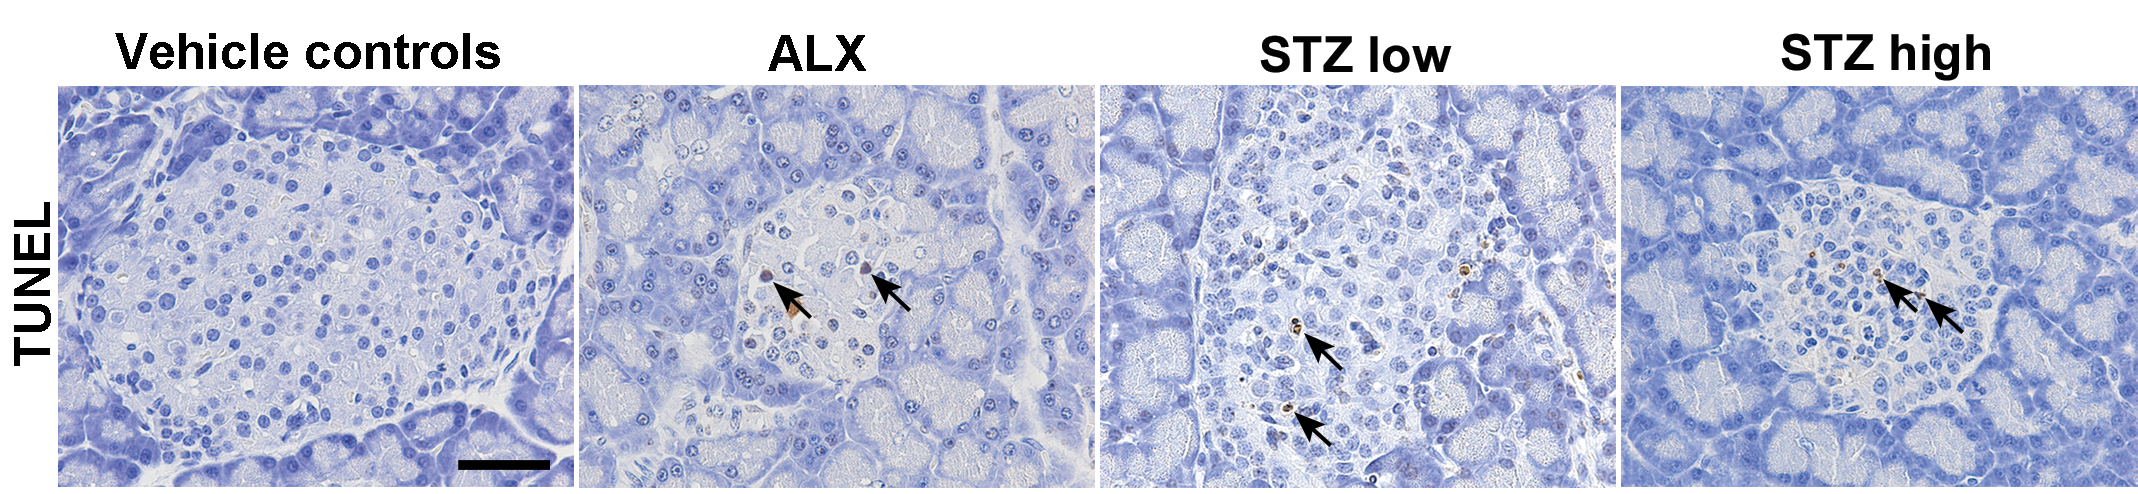
Representative images of TUNEL-stained islet sections. Arrows denote TUNEL-positive cells. Scale bar, 50 μm. ALX = alloxan; STZ = streptozotocin; TUNEL = terminal deoxynucleotidyl transferase-mediated dUTP nick end labeling.
Microarray-based Gene Expression Profiles of Isolated Islets from Rats Treated with ALX or STZ
Following statistical filtering for gene selection, the ALX-treated group had 568 upregulated and 507 downregulated genes. In contrast, the STZ-treated groups showed more expression changes, with 1,052 upregulated and 1,475 downregulated genes in the low-dose group, and 2,039 upregulated and 1,801 downregulated genes in the high-dose group. GO analysis was performed on the probes selected as commonly up- or downregulated in ALX- and STZ (low and high dose)-treated islet cells to elucidate biological profiles. Functional annotation indicated that large numbers of upregulated genes were involved in the immune system and inflammation. Further, large numbers of downregulated genes were involved in insulin secretion and cell morphogenesis (Table 3). GO analysis was also conducted on the probes selected as specifically upregulated in ALX- and STZ (low and high dose)-treated islet cells. Interestingly, functional annotation suggested that many upregulated genes were related to the apoptosis process in ALX-treated islet cells (Table 4). In contrast, functional annotation indicated that large numbers of upregulated genes specifically in STZ (low and high dose)-treated islet cells were involved in the immune system and inflammation; further, these genes were commonly upregulated in ALX- and STZ-treated islet cells.
Ten Top-ranked GO Term Categories (Biological Process; Level 5) for the Common Up- and Downregulated Genes in ALX- and STZ-treated Islets of Rat.
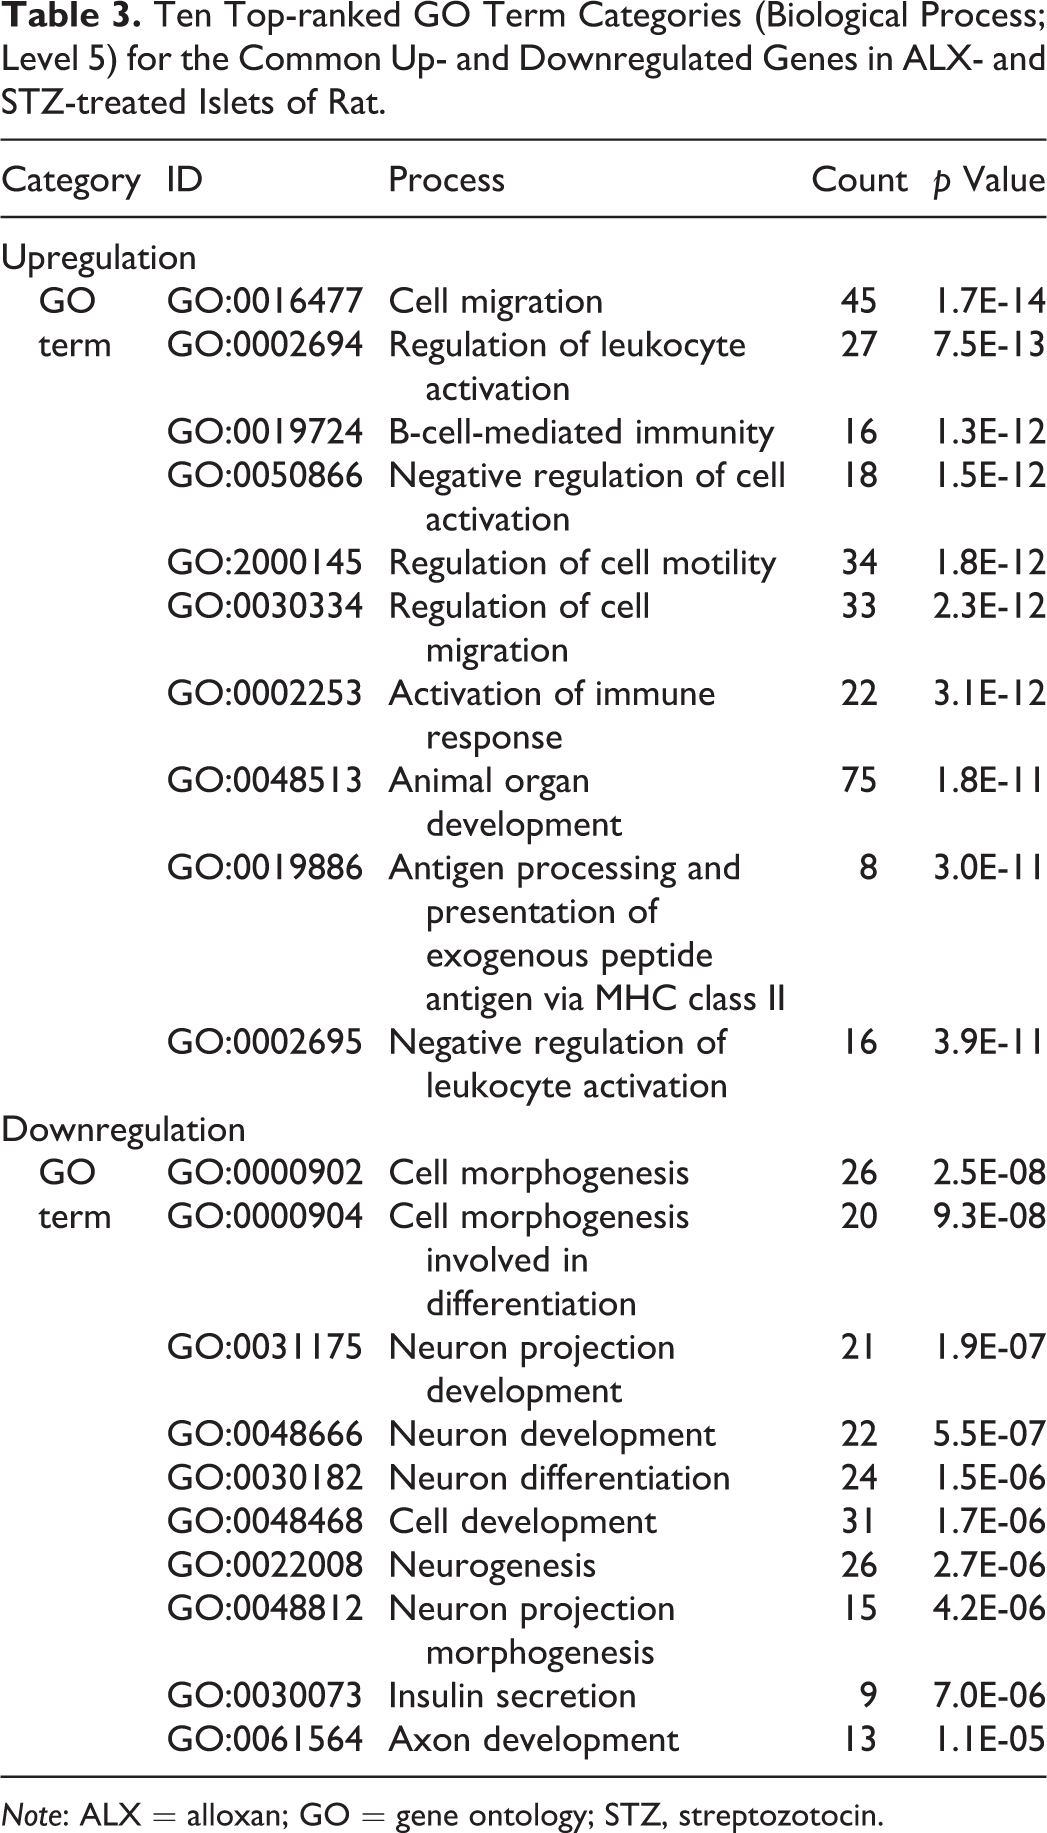
Note: ALX = alloxan; GO = gene ontology; STZ, streptozotocin.
Ten Top-ranked GO Term Categories (Biological Process; Level 5) for the Specifically Upregulated Genes in ALX and STZ-treated Islets of Rat.
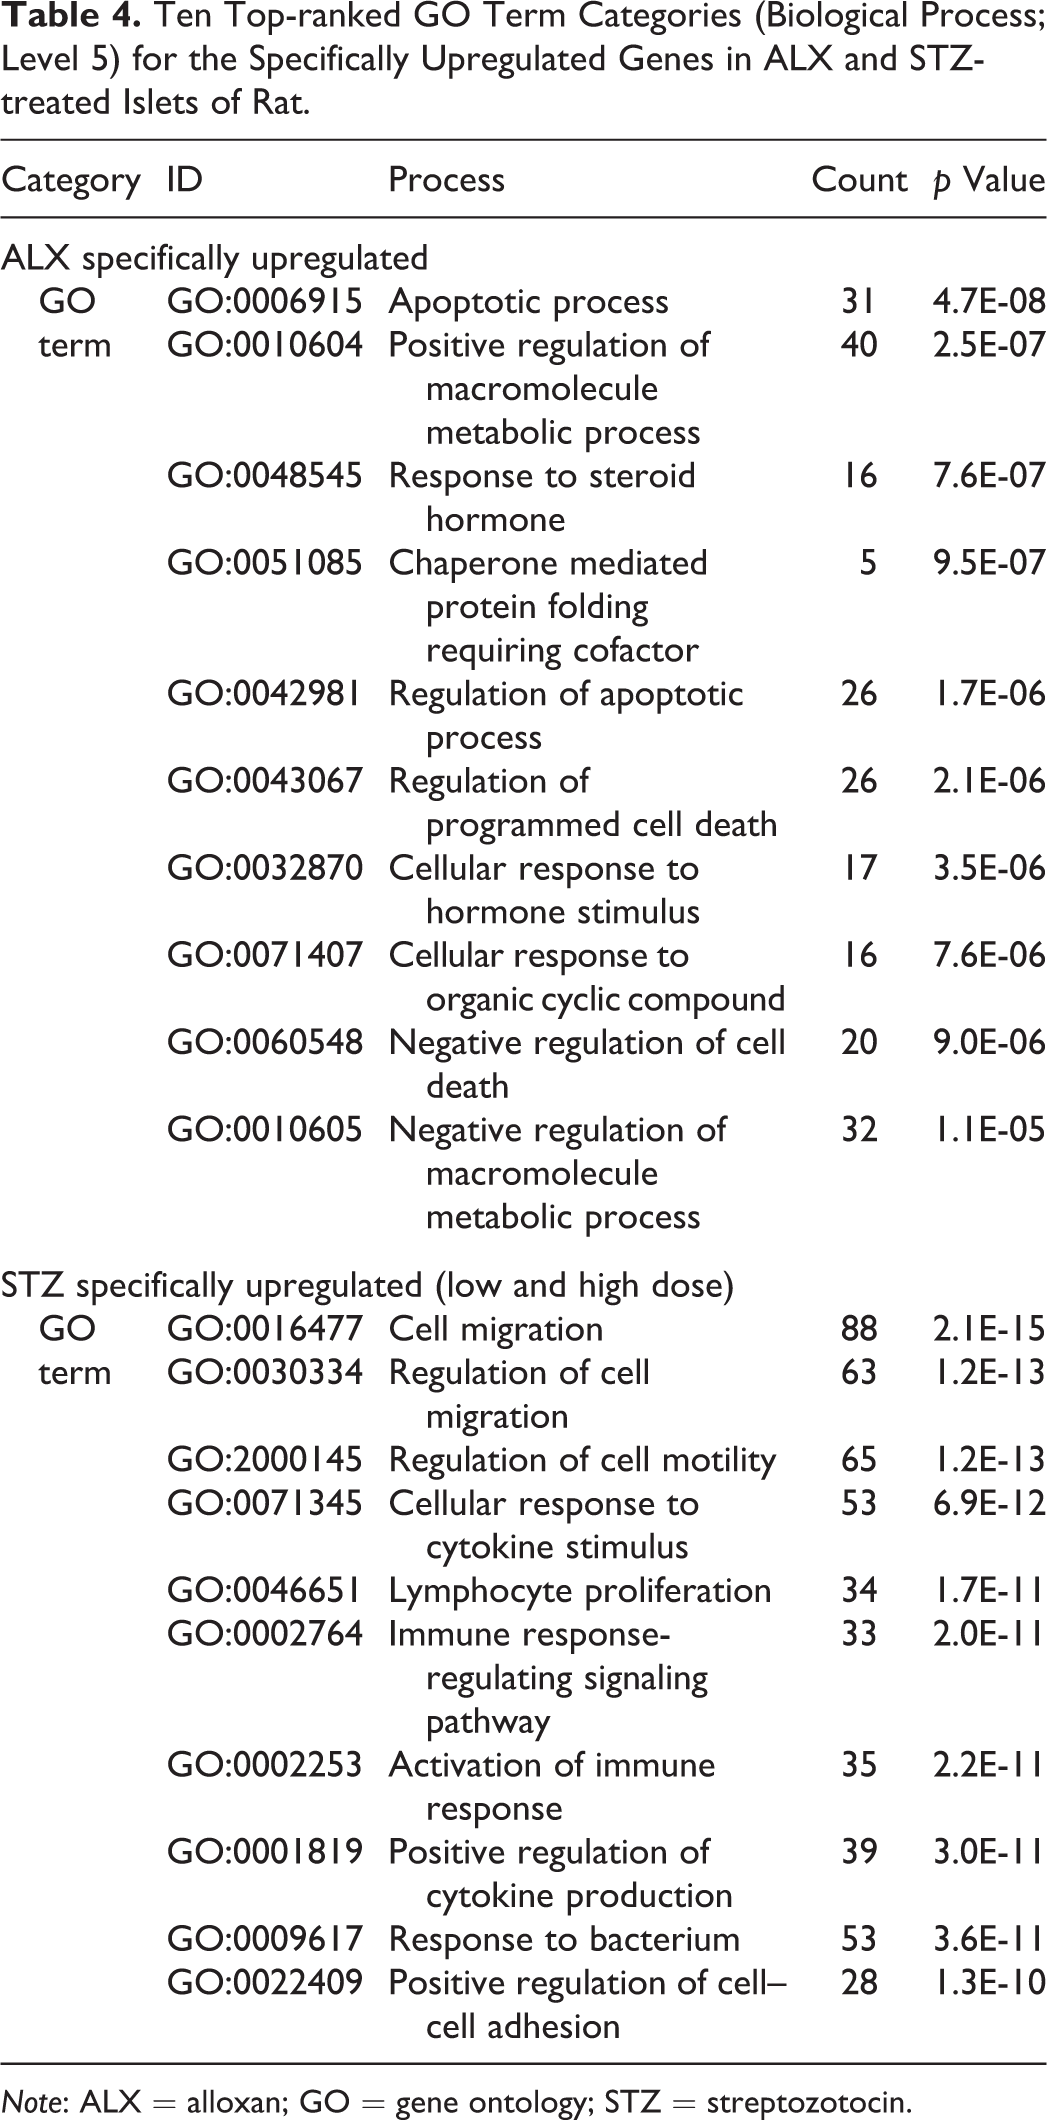
Note: ALX = alloxan; GO = gene ontology; STZ = streptozotocin.
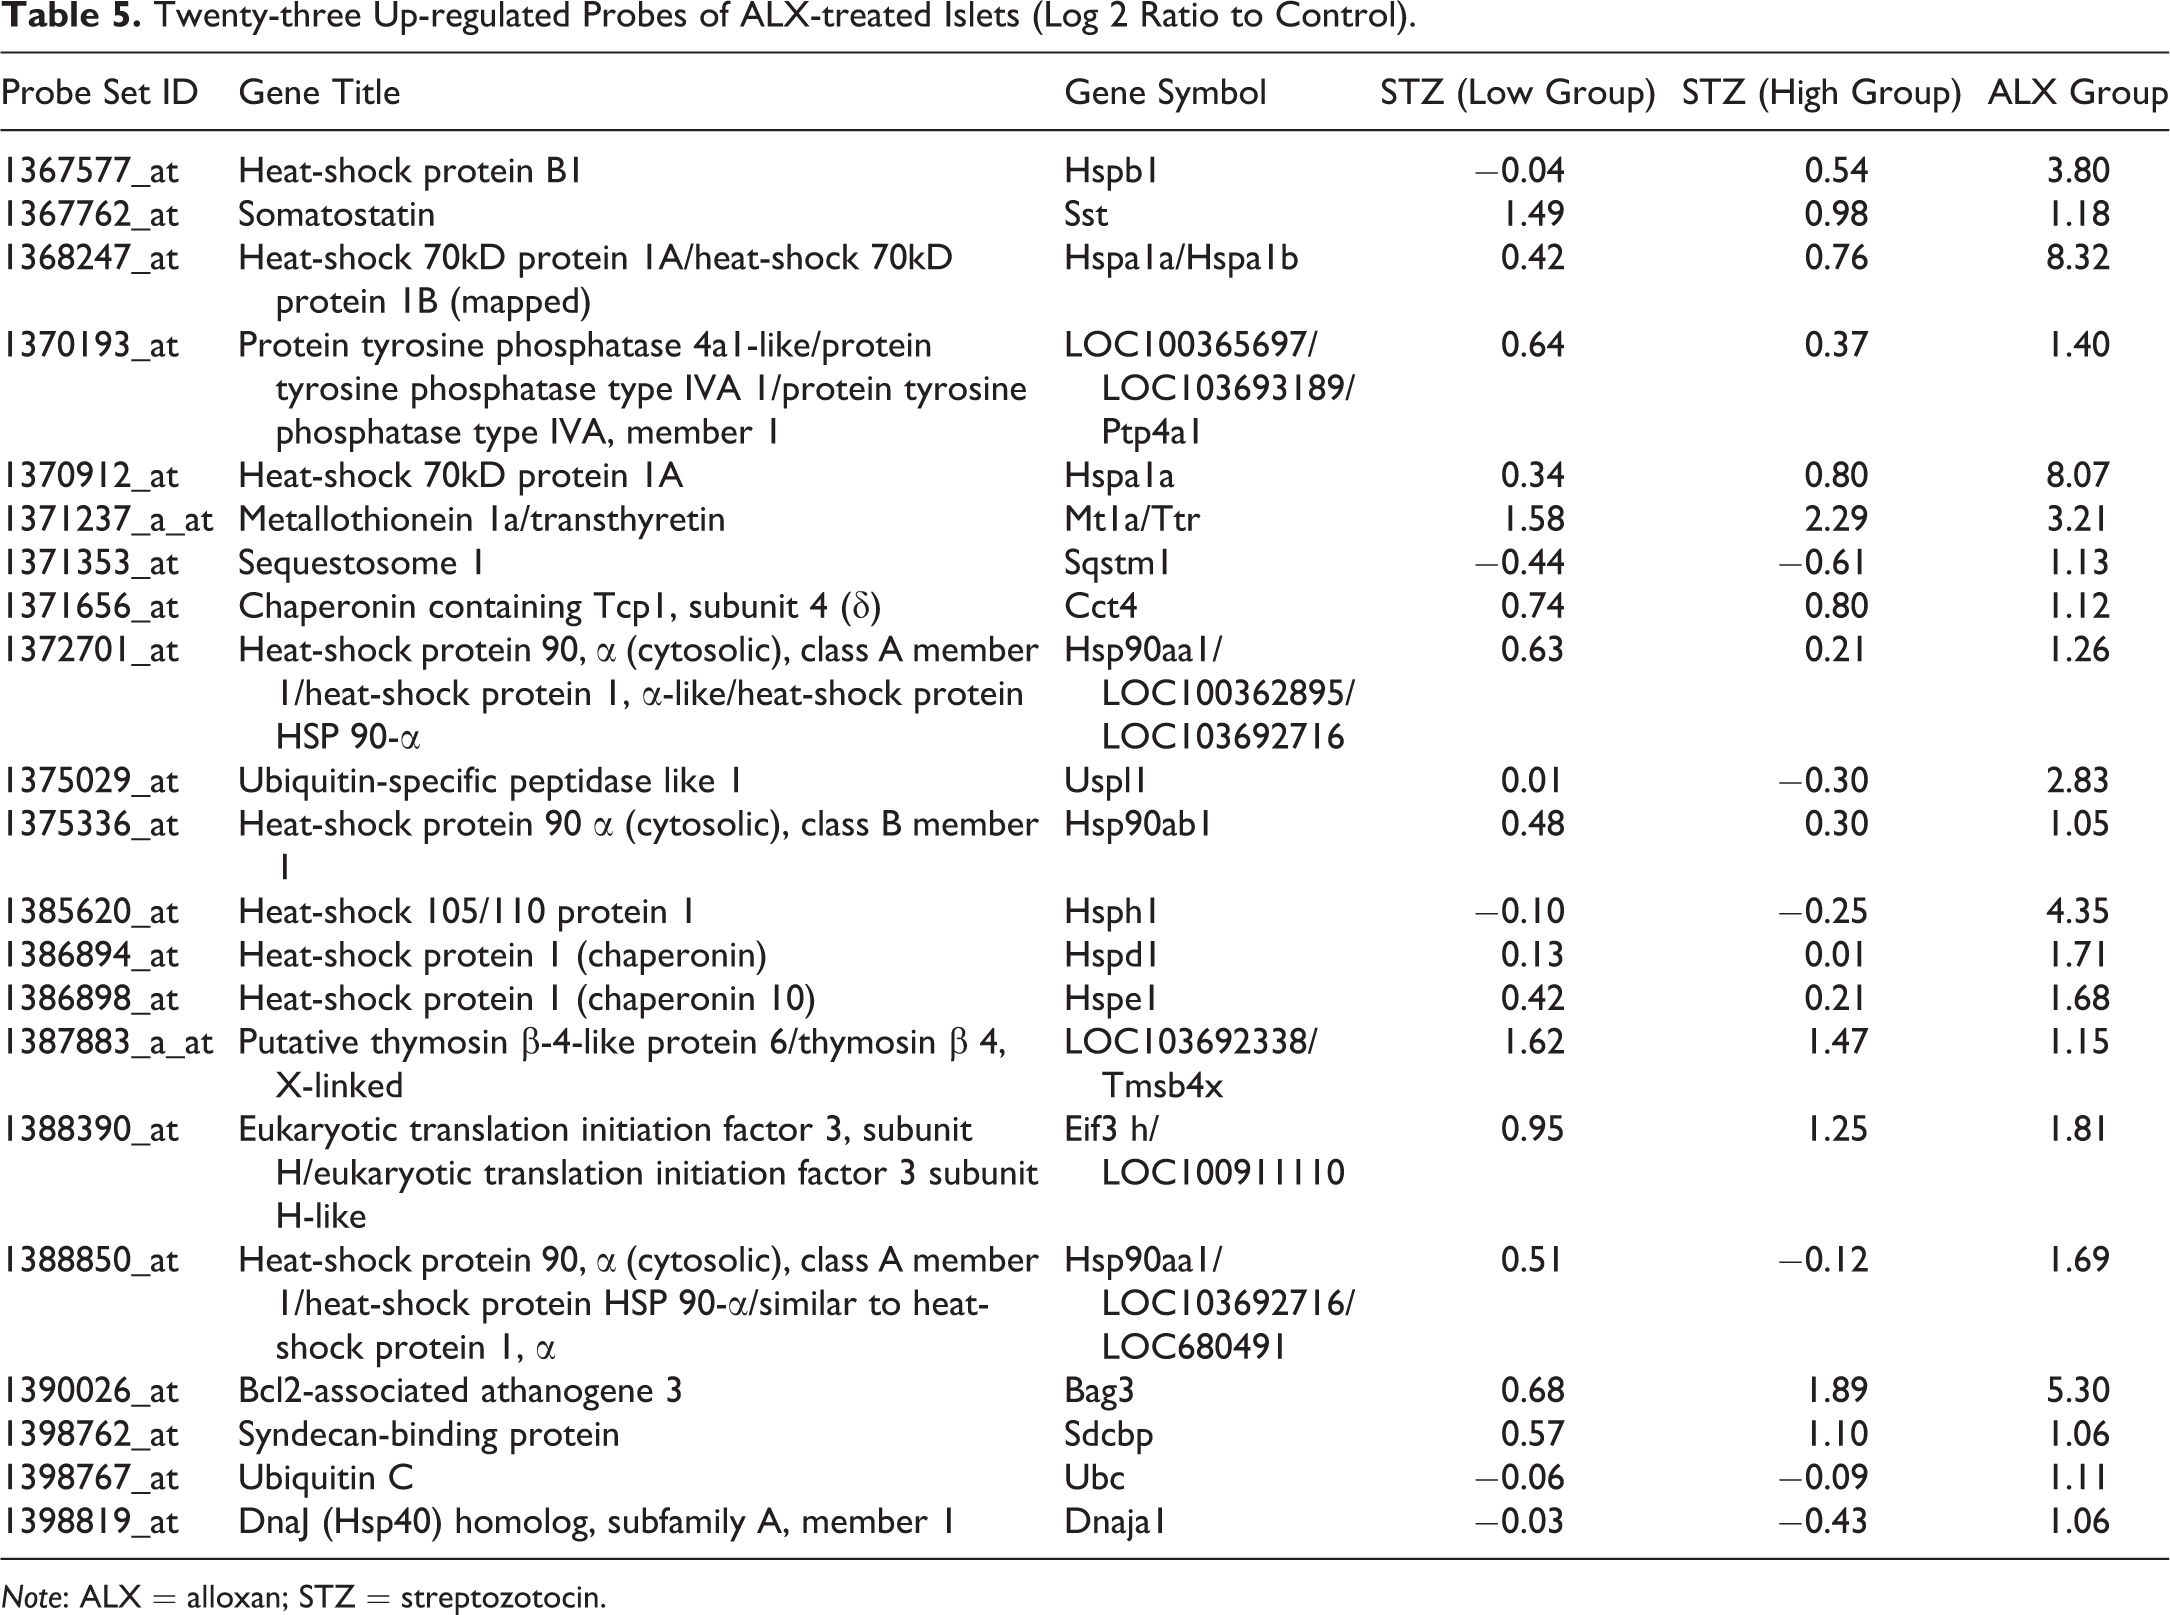
To analyze the pathological features of ALX-treated islets in more detail, we conducted hierarchical clustering analyses of significantly up- or downregulated genes in ALX-treated rats and compared them with the gene expression patterns of ALX- and STZ (low and high dose)-treated rats (Figure 4). Clustering analysis showed that individual differences in the same treatment group were small, and there was a clear separation in gene expression patterns between the ALX- and STZ-treated groups. In particular, expression was stronger in the ALX-treated group than in the STZ-treated groups, as shown by the 23 genes surrounded by the yellow frame (Figure 4). These genes included heat-shock 70 kDA protein 1A (Hspa1a), Hsp90ab1, Hsph1, ubiquitin C (Ubc), and Bcl2-associated athanogene 3 (Bag3), related to apoptosis and/or protein processing in the endoplasmic reticulum (ER; Table 5).Comparison of Gene Expression Patterns of Apoptosis and p53 Pathways between ALX and STZ
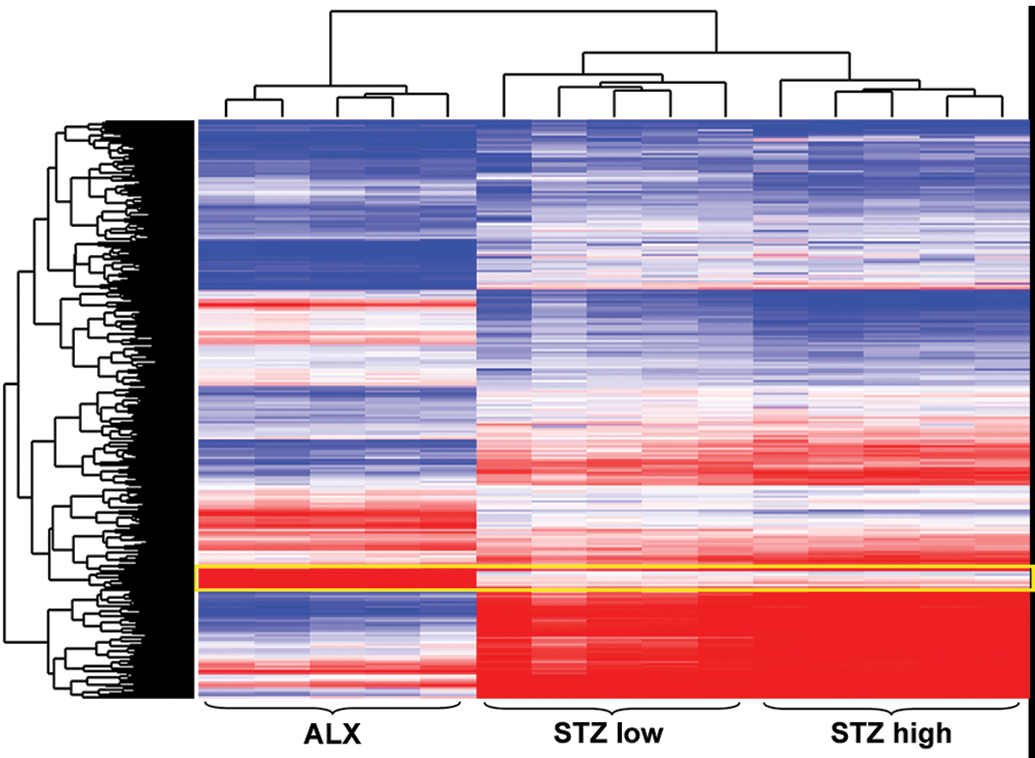
Heat map of the ALX- and STZ-treated groups using differentially expressed genes from the ALX-treated group. Clustering method: Ward’s method, similarity measure: half square Euclidean distance, and ordering function: average value. Heat map shows log ratio of base 2 to the individual values corresponding to the mean value of the vehicle controls (red: 3-fold higher and blue: 3-fold lower expression of log 2 ratio). ALX = alloxan; STZ = streptozotocin.
Figure 5 shows the hierarchical clustering analysis of genes involved in the apoptosis signaling pathway. Eleven genes were significantly changed in the ALX-treated group, and 19 genes were significantly changed in the STZ-treated groups. Genes that were commonly upregulated in the ALX- and STZ-treated groups included phorbol-12-myristate-13-acetate-induced protein 1, cathepsin (Ctsc, Ctsh, and Ctss), and BH3 interacting domain death agonist (Bid), all of which are genes involved in the intrinsic (mitochondria-mediated) apoptotic pathway. DNA-damage-inducible transcript 3 (Ddit3) was significantly upregulated in the ALX-treated group only. ER stress induces upregulation of Ddit3, which allows activation of the intrinsic apoptotic pathway by downregulating the apoptosis regulator Bcl-2 (Bcl2). However, gene expression patterns in the STZ-treated groups could not explain the mechanisms of apoptosis caused by STZ treatment.
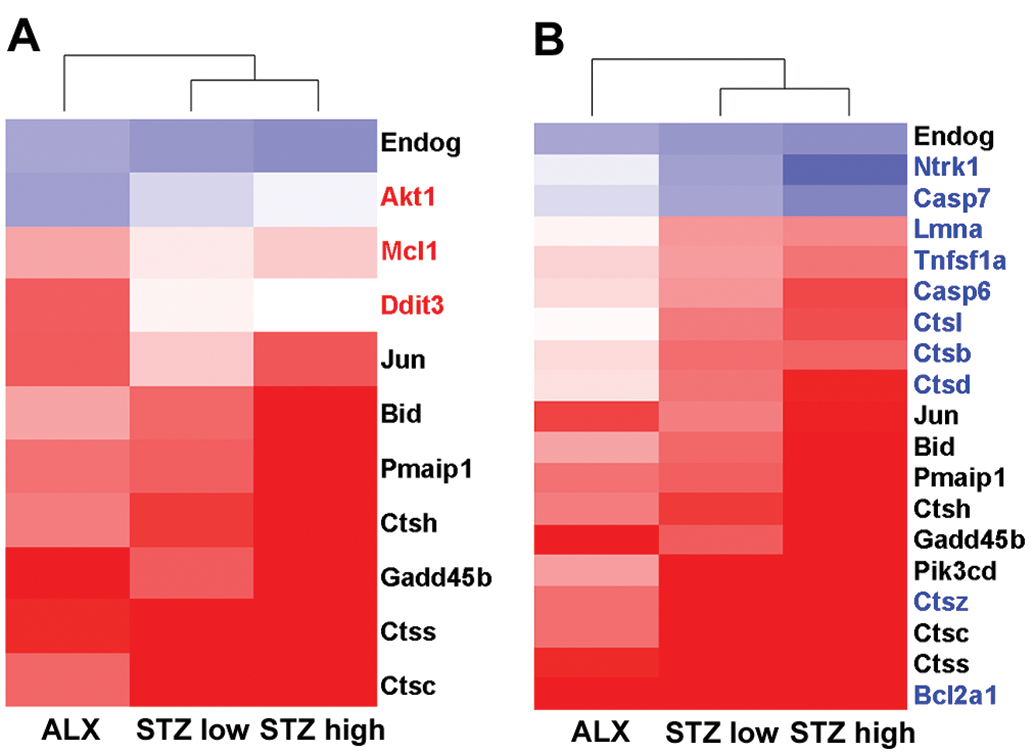
Heat maps of the ALX- and STZ-treated groups using genes involved in the apoptosis signaling pathway. (A) Eleven genes were differentially expressed in the ALX-treated group. (B) Nineteen genes were differentially expressed in the STZ-treated groups. Genes written in red ink show differential changes in the ALX-treated group only, and genes written in blue ink show differential changes in the STZ-treated groups only. Clustering method: Ward’s method, similarity measure: half square Euclidean distance, and ordering function: average value. The heat map shows the log base 2 ratio of the treatment mean value to that of the corresponding vehicle control (red: 3-fold higher and blue: 3-fold lower expression of log 2 ratio). ALX = alloxan; STZ = streptozotocin.
Twenty-three Up-regulated Probes of ALX-treated Islets (Log 2 Ratio to Control).
Note: ALX = alloxan; STZ = streptozotocin.
Significant upregulation of p53 pathway-related genes, including transcription factor AP-1 (Jun) and growth arrest and DNA-damage-inducible protein, were observed in both chemical-treated groups; therefore, hierarchical clustering was conducted with genes involved in the p53 signaling pathway, and the gene expression patterns were compared between ALX- and STZ-treated groups (Figure 6). Interestingly, there was a difference in the gene expression pattern of genes related to cell cycle arrest between ALX- and STZ-treated rats. Specifically, G2/mitotic-specific cyclin-B1 (Ccnb1) and cyclin-dependent kinase 1 (Cdk1), related to G2 arrest, were significantly downregulated in the ALX-treated rats. However, Cyclin D2 (Ccnd2) was downregulated more in STZ (low and high dose)-treated rats than in ALX-treated rats, although increases in the cyclin-dependent kinase inhibitor 1A (Cdkn1a), which suppresses Ccnd2, were comparable between the ALX- and STZ-treated rats. In addition, sestrin 1 (Sesn1), which is involved in DNA repair, was significantly increased in the STZ (low and high dose)-treated groups. Hierarchical clustering analyses were conducted with genes involved in the type 1 diabetes signaling pathway. Eight genes significantly changed in the ALX-treated group, and 15 genes significantly changed in the STZ (low and high dose)-treated groups (Figure 7). Most of these genes were related to inflammation and antigen presentation; however, no genes involved in autoantigen triggering of diabetes were upregulated.
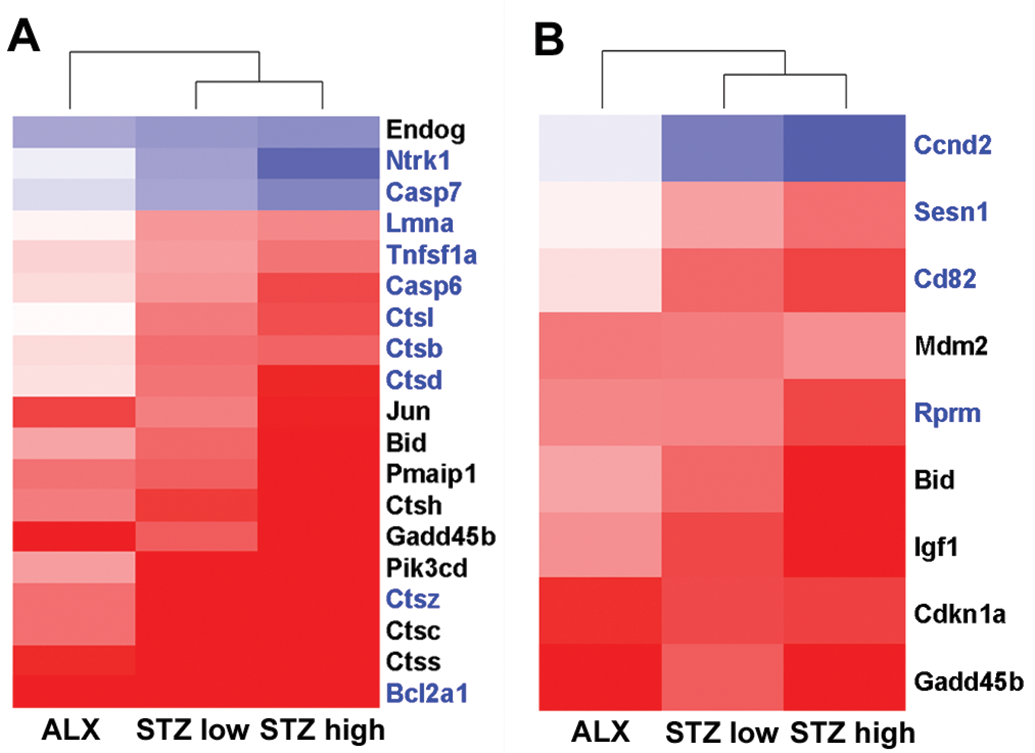
Heat maps of the ALX- and STZ-treated groups using genes involved in the p53 signaling pathway. (A) Nine genes were differentially expressed in the ALX-treated group. (B) Nine genes were differentially expressed in the STZ-treated groups. Genes written in red ink show differential changes in the ALX-treated group only, and genes written in blue ink show differential changes in the STZ-treated groups only. Clustering method: Ward’s method, similarity measure: half square Euclidean distance, and ordering function: average value. The heat map shows the log base 2 ratio of the treatment mean value to that of the corresponding vehicle control (red: 3-fold higher and blue: 3-fold lower expression of log 2 ratio). ALX = alloxan; STZ = streptozotocin.
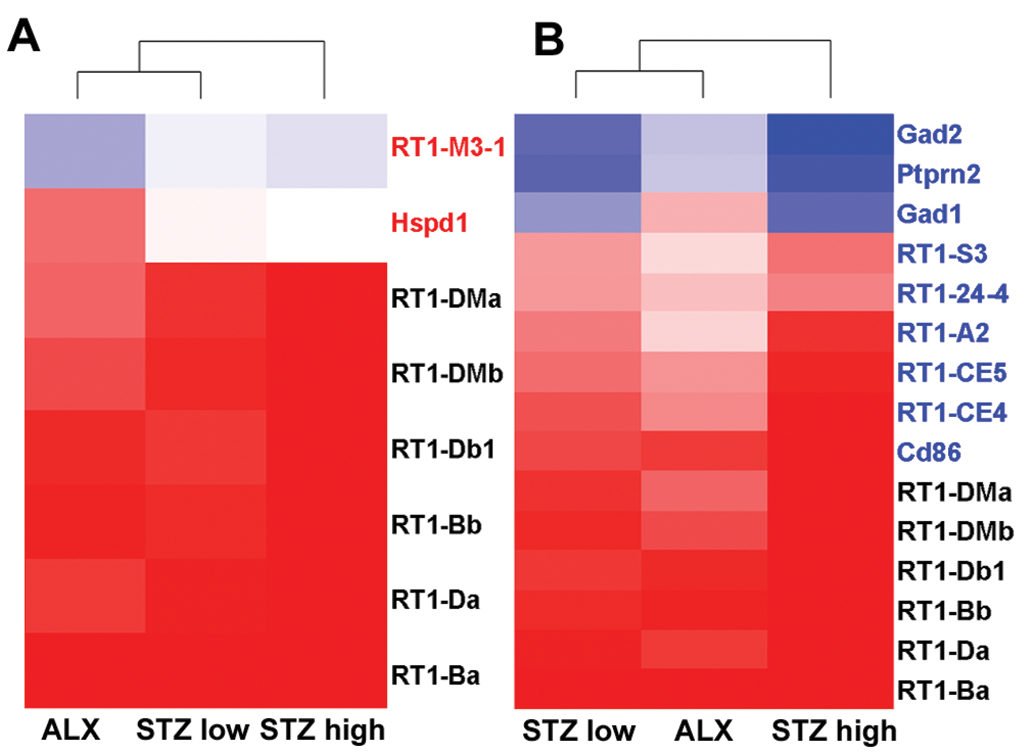
Heat maps of the ALX- and STZ-treated groups using genes involved in the type 1 diabetes signaling pathway. (A) Eight genes were differentially expressed in the ALX-treated group. (B) Fifteen genes were differentially expressed in the STZ-treated groups. Genes written in red ink show differential changes in the ALX-treated group only, and genes written in blue ink show differential changes in the STZ-treated groups only. Clustering method: Ward’s method, similarity measure: half square Euclidean distance, and ordering function: average value. The heat map shows the log base 2 ratio of the treatment mean value to that of the corresponding vehicle control (red: 3-fold higher and blue: 3-fold lower expression of log 2 ratio). ALX = alloxan; STZ = streptozotocin.
Discussion
Transcriptomic analysis using high-quality RNA from frozen islets isolated via laser capture microdissection provided unique information about gene expression in the pancreatic islets of ALX- and STZ-treated rats. RIN values (mean: 7.23) in this study were similar to those from previous reports using RNA isolated from rodent islets by means of microdissection (Butler et al. 2016; Szulawski et al. 2016). Moreover, the RIN values reported here align with RNA data isolated via microdissection from organ/tissues other than pancreatic islets (Boone et al. 2015; Catlin, Huse, and Boekelheide 2014; Torres Mena et al. 2014). It is very important to process the samples quickly to collect good-quality RNA by means of laser capture microdissection. Specifically, critical steps include freezing the excised pancreas quickly, storing the frozen sections at −80°C until staining, and staining and processing the sections on the same day. By adhering to these criteria, we were able to consistently isolate good-quality RNA from the pancreatic islets of ALX- and STZ-treated rats. When the pancreatic islets were highly atrophied, such as that observed in the STZ high-dose-treated group, the volume tended to be lower than that from normal islet samples; as such, the corresponding RIN values tended to be lower in this study. Therefore, researchers should adjust the amount of sample to be collected according to the size of the target islets.
Degeneration and necrosis of the islet cells in the center, as well as a decrease in insulin-positive cells, were observed in both the ALX- and STZ-treatment groups, suggesting that both chemicals injure β cells. However, macrophage infiltration and atrophy of the islets were prominent in the STZ-treated groups, suggesting that islet cells in the STZ-treated groups were damaged earlier than those in the ALX-treated group. These differences in pathology were consistent with the number of gene variations observed in the STZ-groups; there were more gene variations in the STZ-treated groups than in the ALX-treated group. Further, most of the genes specifically upregulated in the STZ-treated groups were related to inflammation and the immune response.
Apoptosis is a process of cell death that is induced by a tightly regulated suicide program (Kumar, Abbas, and Aster 2015). There are three main pathways involved in the apoptotic process, the intrinsic mitochondria-mediated pathway, the extrinsic (receptor-mediated) pathway, and the granzyme B pathway (Elmore 2007). Our gene expression analysis suggests that apoptosis in the islets following ALX treatment was induced mainly via the intrinsic pathway. Bhattacharya et al. (2011) reported that activation of the intrinsic mitochondria-mediated pathway in pancreatic islets of ALX-treated diabetic rats induced an increase in the expression levels of cytochrome c, apoptotic peptidase activating factor 1 (Apaf-1), and Caspase 9, leading to islet cell apoptosis (Bhattacharya et al. 2011). In this study, Ddit3, which is induced by ER stress, was specifically upregulated in the ALX-treated group. Genes related to ER-associated degradation (e.g., Hspa1a, Hsp90ab1, Hsph1, and Ubc) and the formation of ubiquitin ligase complexes were also specifically upregulated in the ALX-treated group. These results suggest that ER stress is involved in ALX-induced cytotoxicity (Figure 8). ALX-induced pancreatic β-cell damage is a result of cytotoxic ROS generation, reduced glucose oxidation and ATP generation by means of glucokinase inhibition, and the breakdown of DNA strands (Lenzen 2008; Takasu et al. 1991). However, there are no reports clarifying the association between ER stress and ALX-induced β-cell damage. In contrast, there are many studies examining the association between ER stress and pathogenesis of diabetes mellitus in human and mouse models (Marré and Piganelli 2017; Rieusset 2017; Wu et al. 2018).
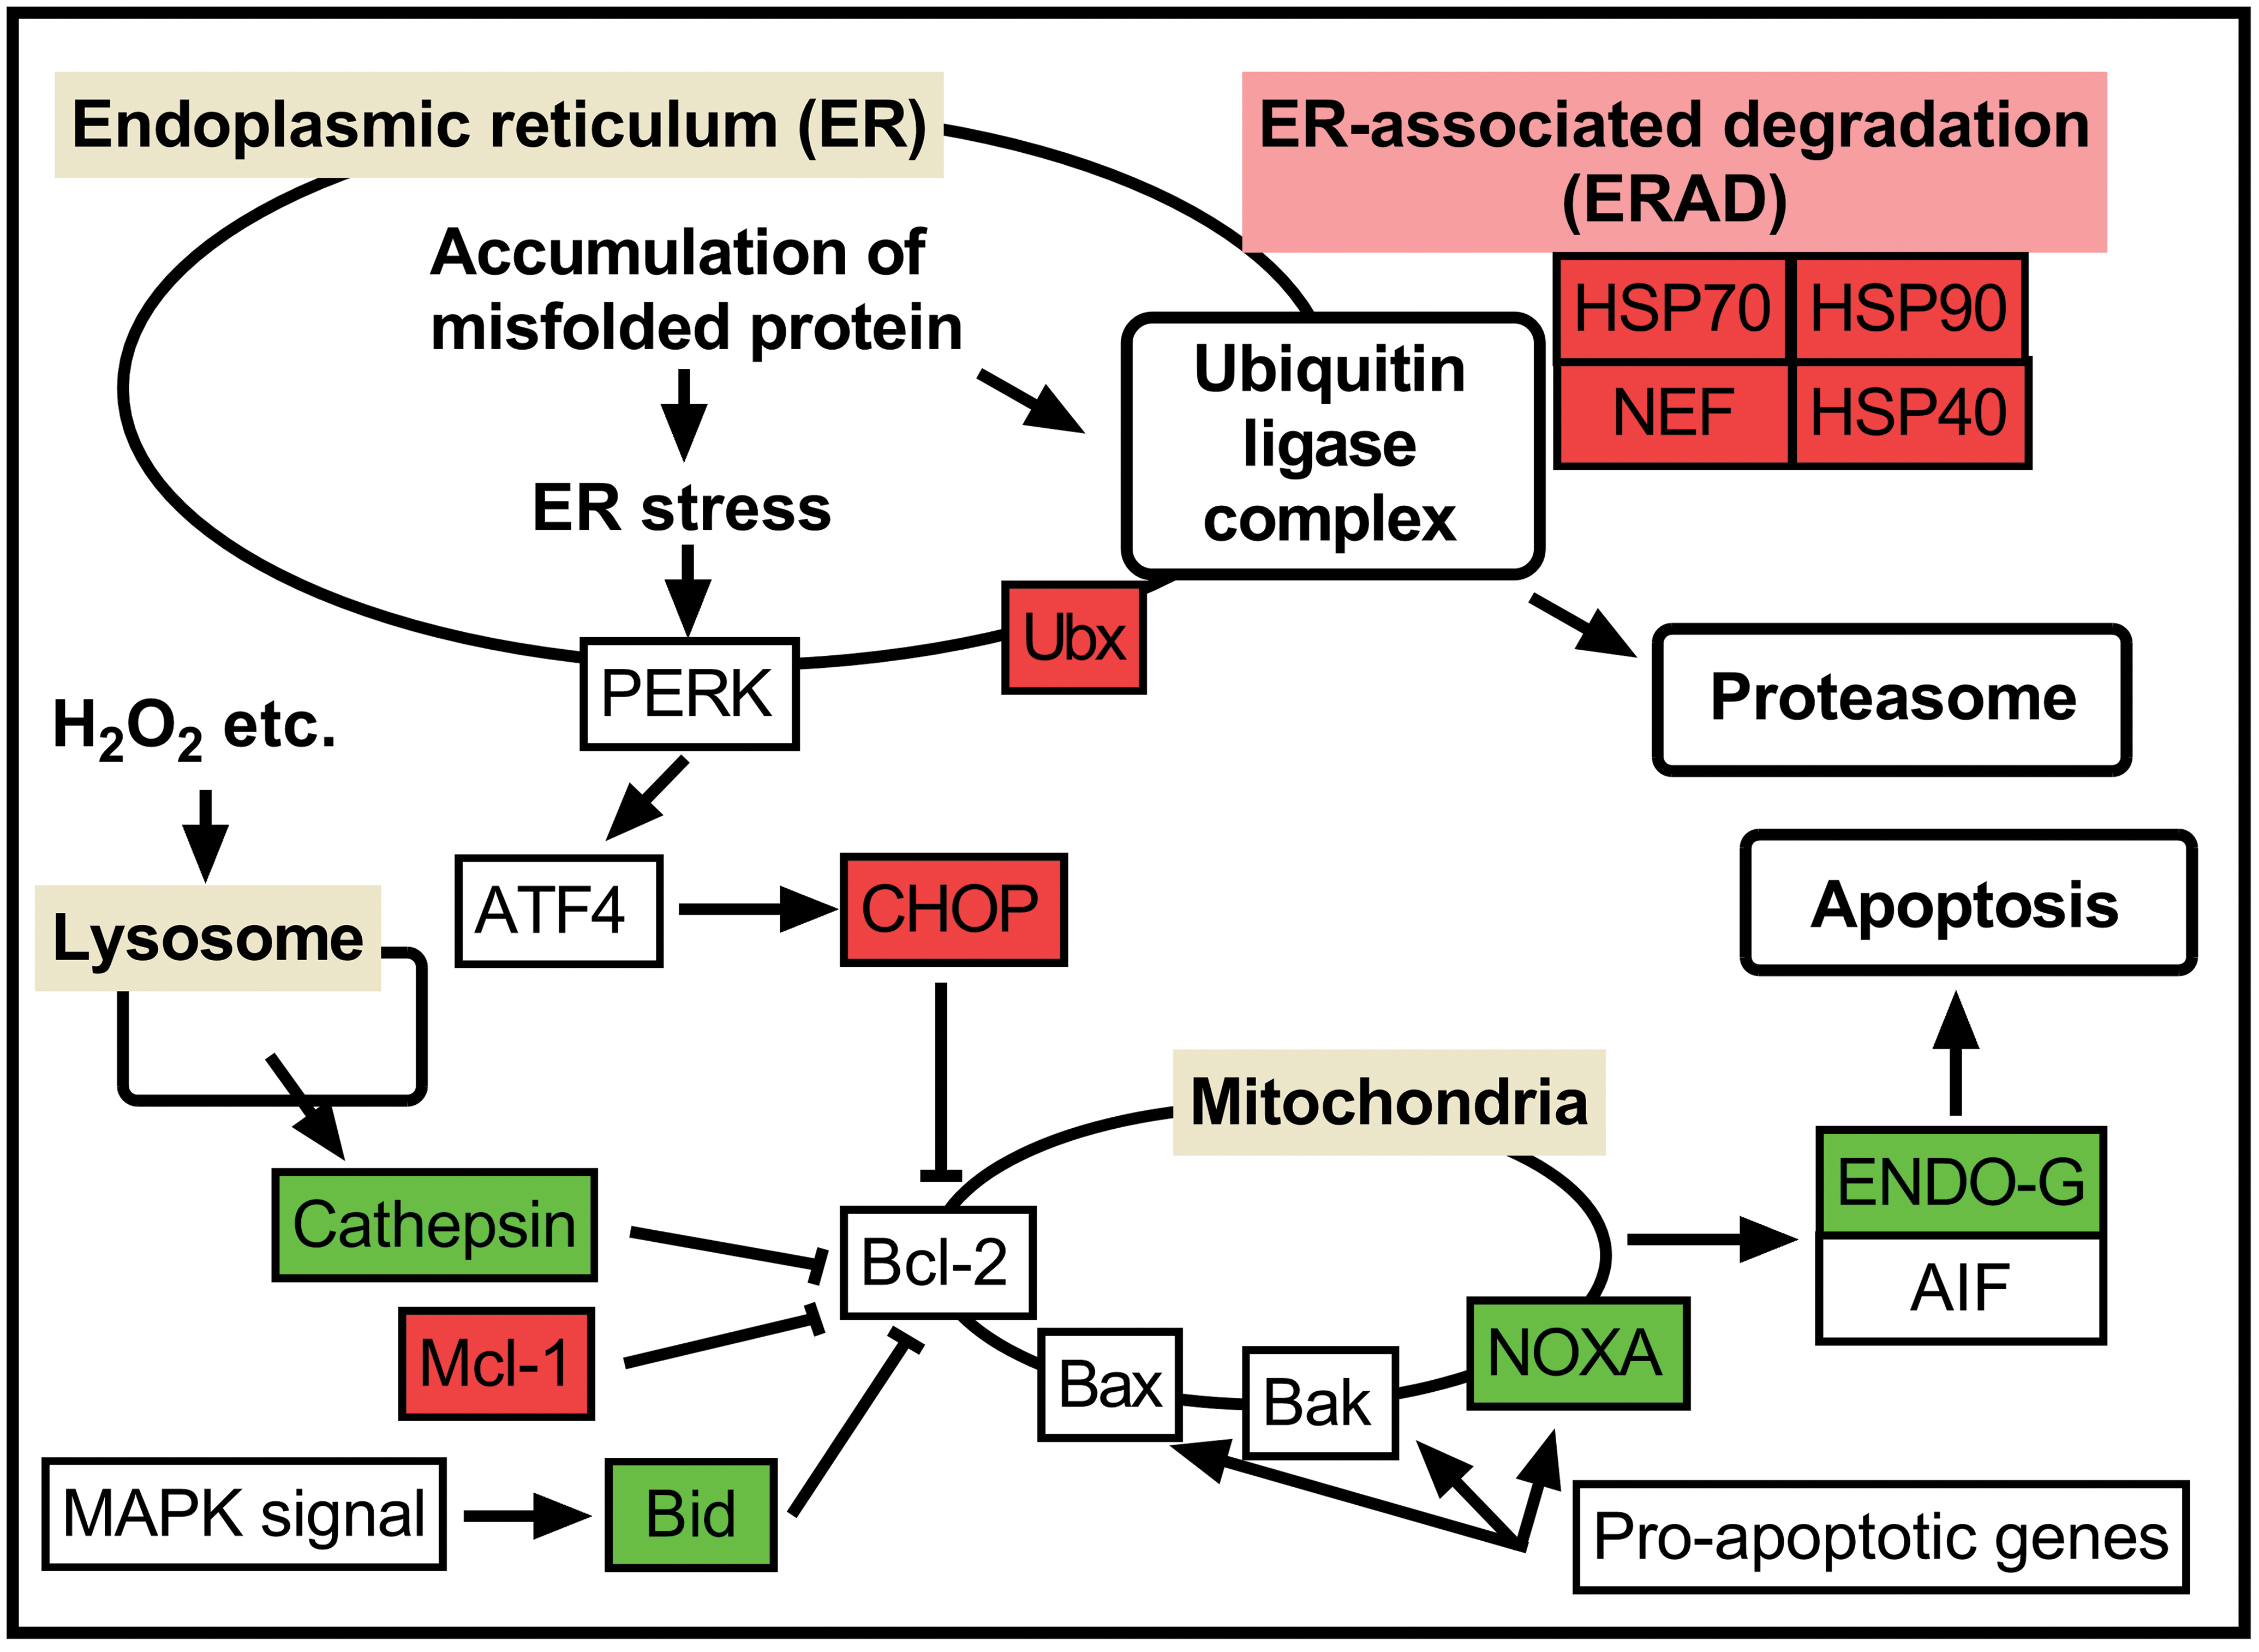
Protein processing in the endoplasmic reticulum and apoptosis signaling pathway of proapoptotic genes (partially extracted from the KEGG database). Genes painted with red show specific changes in ALX-treated rats, genes painted with blue show specific changes in STZ-treated rats, and genes painted with green show changes common to both ALX- and STZ-treated rats. ALX = alloxan; KEGG = Kyoto Encyclopedia of Genes and Genomes; STZ = streptozotocin.
A previous report showed that STZ induced significant apoptosis by increasing CASP8, CASP3, poly ADP-ribose polymerase, and BID protein expression, as well as decreasing BCL-2 expression in an insulin-secreting β-cell-derived cell line (Lee et al. 2017). These results suggest that STZ-induced apoptosis in islets is mediated via both the intrinsic mitochondria-mediated and extrinsic receptor-mediated pathways. The gene expression patterns reported here suggest that apoptosis in the islets following STZ treatment was induced via the intrinsic mitochondria-mediated pathway; however, there were few significant changes in genes involved in the extrinsic receptor-mediated pathway. In this experiment, activation of the apoptotic signal subsided in the STZ-treated rats, as the inflammatory cells had already infiltrated the islets. Therefore, it is possible that the expression of apoptosis-related genes was decreasing or was difficult to detect using the present methods after STZ treatment. These results are also supported by fewer nuclear-enriched and apoptotic cells in the high-dose STZ group than in the low-dose group.
Cell cycle arrest–related genes in the p53 signaling pathway showed notable expression in ALX- and STZ-treated rats. Our results suggested that STZ treatment causes G1 arrest in rat islets by downregulating Ccnd2. Further, ALX treatment caused G2 arrest by downregulating Ccnb1 and Cdk1 (Figure 9). These results are consistent with previous reports showing that p53-deficient mice are more susceptible to STZ-induced diabetes than control mice (Zheng et al. 2005). Further, STZ induces DNA damage through alkylation and fragmentation of DNA (LeDoux et al. 1986), and a previous genome-wide gene expression profiling study examining STZ-damaged islets in mice showed upregulation of Cdkn1a, a master regulator of growth arrest (Tonne et al. 2013). Our gene expression analysis also showed upregulation of Cdkn1a in STZ-treated islets; however, the magnitude of change was similar to that observed in ALX-treated islets. Our results corroborate previous reports regarding the genotoxicity of STZ, since the downregulation of Ccnd1, which is negatively regulated by Cdkn1a, was notable in STZ-treated islets (Tanaka et al. 2000). Expression of Sesn1, a DNA repair gene, was elevated in STZ-treated islets in our study, suggesting DNA damage attributable to STZ treatment. Further, ALX stimulated the generation of H2O2, which induced DNA strand breaks. These experiments suggest that the ALX-induced DNA damage was attributable to G2 arrest.
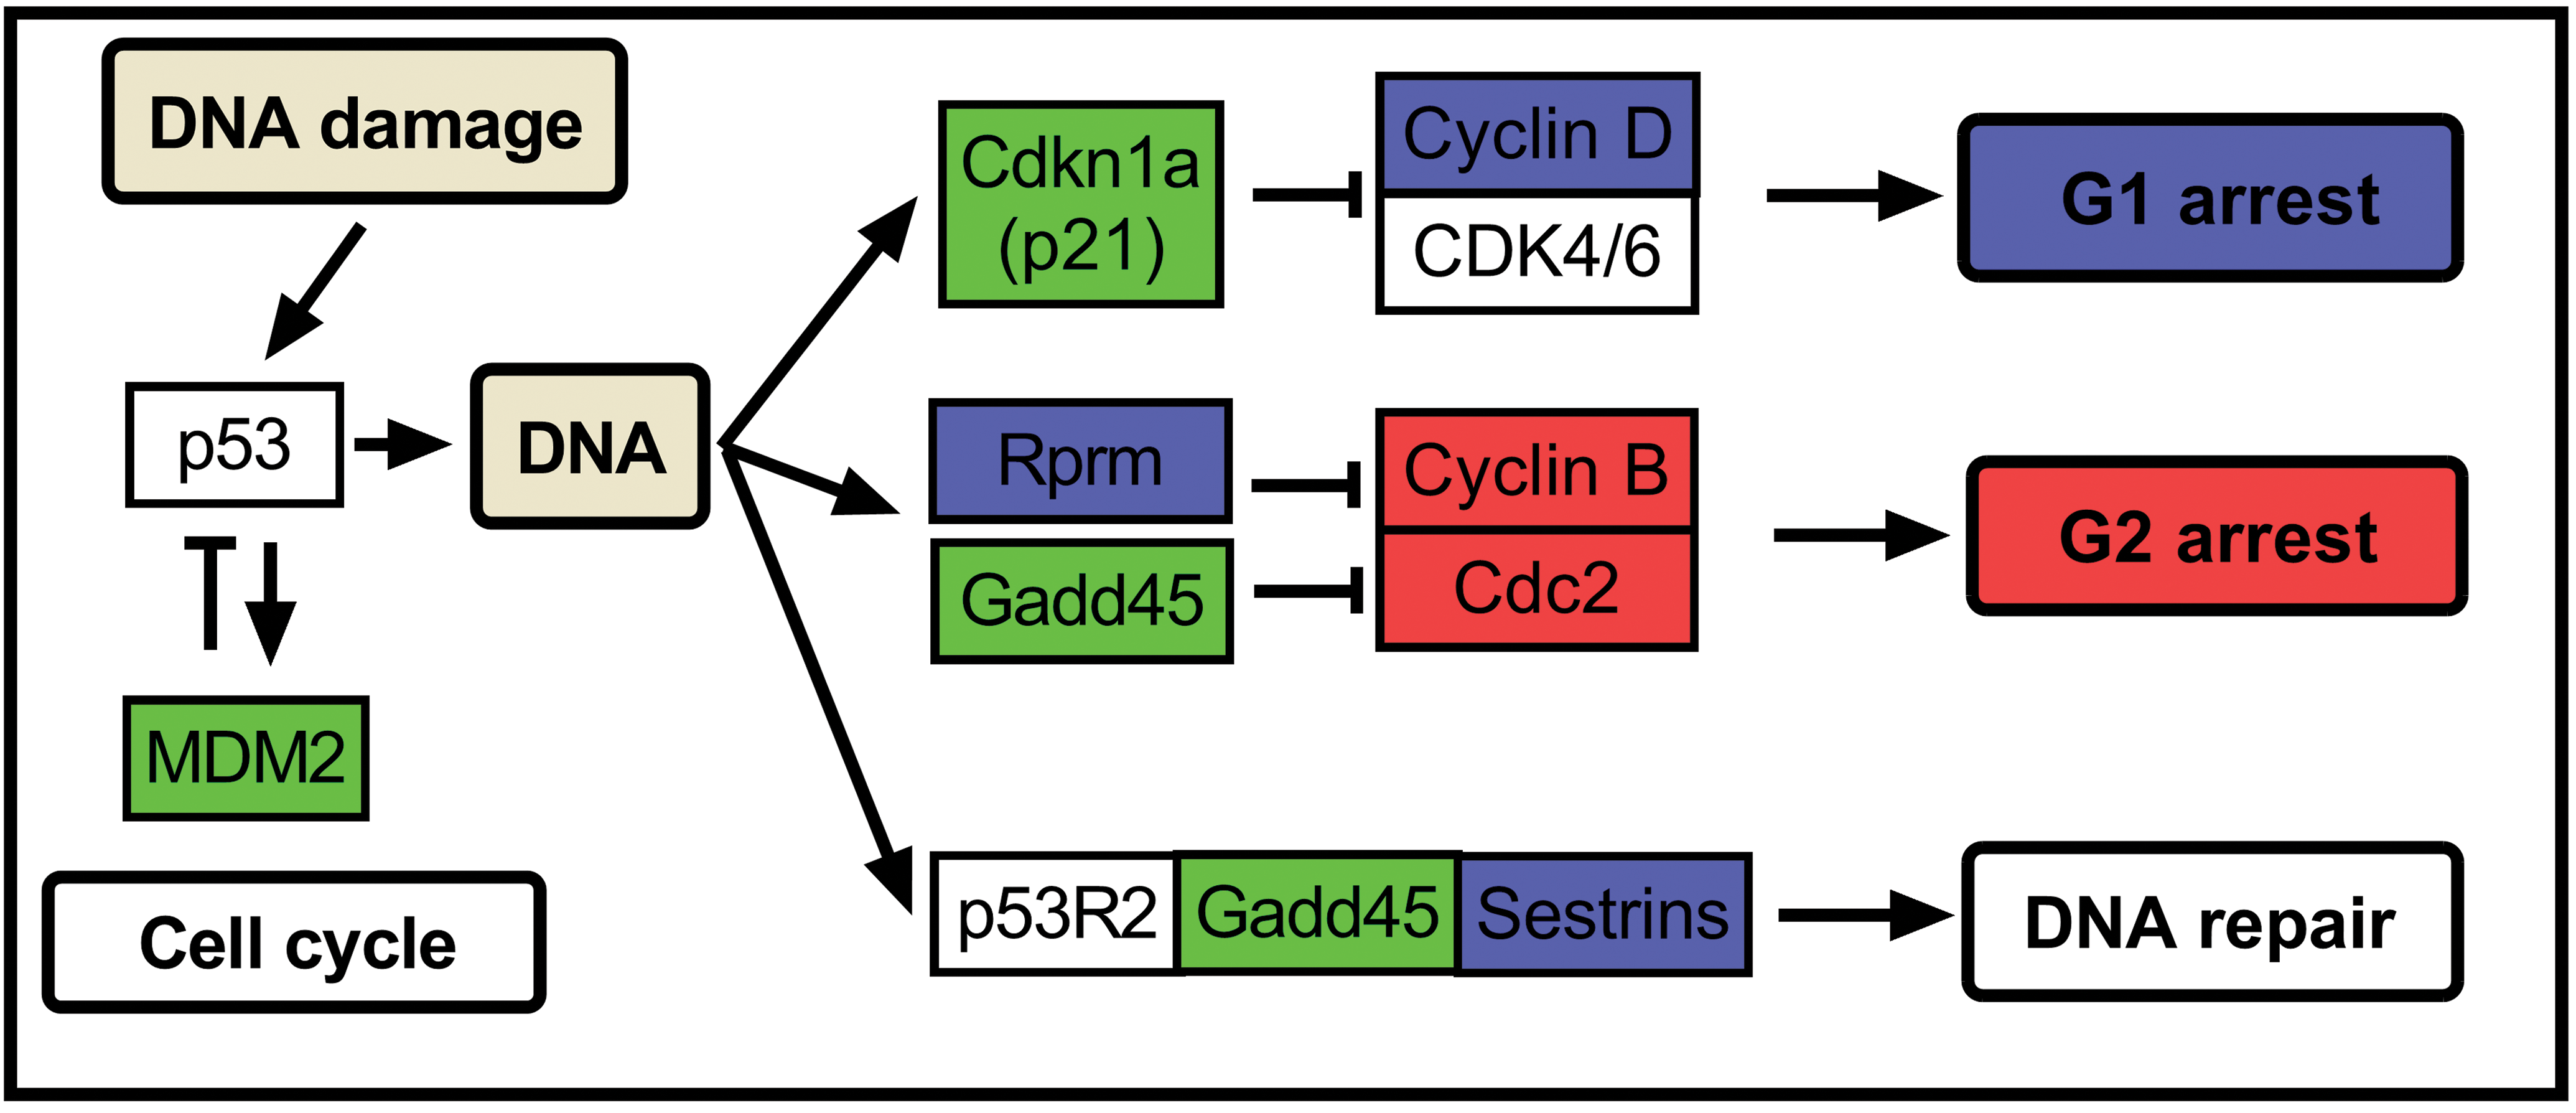
Cell cycle and DNA repair in the p53 signaling pathway (partially extracted from the KEGG database). Genes painted with red show specific changes in the ALX-treated rats, genes painted with blue show specific changes in the STZ-treated rats, and genes painted with green show changes common in both ALX- and STZ-treated rats. ALX = alloxan; KEGG = Kyoto Encyclopedia of Genes and Genomes; STZ = streptozotocin.
Type 1 diabetes is a disease in which autoimmune destruction of β cells occurs in response to various environmental factors on a background of unique genetic factors (Atkinson, Eisenbarth, and Michels 2014; Todd 2010). Viral infections, foods, and toxins have been cited as possible causative environmental factors (Akerblom et al. 2002; Christen and von Herrath 2011; Vehik and Dabelea 2011). Histopathologically, macrophages and T lymphocytes, responding to these antigens, infiltrate the pancreatic islets and cause β-cell-specific necrosis (Aida et al. 2011; Dotta et al. 2007; Richardson et al. 2009). As expected, no increase in the expression of self-antigen-related genes was observed in the rat islets, attributable to β-cell-specific necrosis induced by ALX or STZ treatment. Infiltration of macrophages into islets and upregulation of inflammation-related genes suggest a phagocytic reaction to necrotic β cells. These results are also supported by the paucity of infiltrating T lymphocytes. However, differences in the pathogenesis between humans and animal models of type 1 diabetes are always a concern and represent a limitation of animal model experiments.
In summary, we demonstrate notable gene expression changes involving p53, apoptosis (ER stress), and type 1 diabetes in the islets of ALX- and STZ-treated rats. These molecular profiles reflect the degree of damage in the islets induced by ALX and STZ treatments, as well as their different mechanisms of toxicity. In particular, ER stress contributing to ALX-induced islet injuries in rat is also a cause of human diabetes mellitus. Our results are important in selecting an optimal model to satisfy the research needs of both toxicology and diabetes studies. Since the amount of pancreatic islet samples obtained by microdissection was small, the gene expression results obtained from microarray analysis could not be confirmed using quantitative real-time polymerase chain reaction; however, our study strongly suggests that transcriptomic analysis using islets isolated via laser capture microdissection is a powerful tool for islet toxicity research. In future studies, we will examine the dose- or time-dependent changes of gene expression in the islets of these models to better understand the pathophysiology of islet injury.
Supplemental Material
Supplemental Material, DS1_TPX_10.1177_0192623318783957 - Comparison of Acute Gene Expression Profiles of Islet Cells Obtained via Laser Capture Microdissection between Alloxan- and Streptozotocin-treated Rats
Supplemental Material, DS1_TPX_10.1177_0192623318783957 for Comparison of Acute Gene Expression Profiles of Islet Cells Obtained via Laser Capture Microdissection between Alloxan- and Streptozotocin-treated Rats by Yuki Kato, Yusaku Masago, Chiaki Kondo, Erika Yogo, Mikinori Torii, Atsuko Hishikawa, Takeshi Izawa, Mitsuru Kuwamura, and Jyoji Yamate in Toxicologic Pathology
Footnotes
Acknowledgments
The authors would like to thank Takako Miyoshi for preparing and staining the frozen sections. The authors are also grateful to their toxicology team members for their support and scientific advice throughout the experiments.
Author Contributions
Authors contributed to conception or design (YK, KC, EY, AH, YM, MT, TI, MK, JY); data acquisition, analysis, or interpretation (YK, KC, EY, AH, YM, MT, TI, MK, JY); drafting the manuscript (YK); and critically revising the manuscript (YK, KC, EY, AH, YM, MT, TI, MK, JY). All authors gave final approval and agreed to be accountable for all aspects of work in ensuring that questions relating to the accuracy or integrity of any part of the work.
Declaration of Conflicting Interests
The authors declared no potential, real, or perceived conflicts of interest with respect to the research, authorship, and/or publication of this article.
Funding
The author(s) received no financial support for the research, authorship, and/or publication of this article.
Supplemental Material
Supplemental material for this article is available online.
References
Supplementary Material
Please find the following supplemental material available below.
For Open Access articles published under a Creative Commons License, all supplemental material carries the same license as the article it is associated with.
For non-Open Access articles published, all supplemental material carries a non-exclusive license, and permission requests for re-use of supplemental material or any part of supplemental material shall be sent directly to the copyright owner as specified in the copyright notice associated with the article.