
Abstract
This is the first utilization of advanced analytical electron microscopy methods, including high-resolution transmission electron microscopy, high-angle annular dark field scanning transmission electron microscopy, electron energy loss spectroscopy, and energy-dispersive X-ray spectroscopy mapping to characterize the organ-specific bioprocessing of a relatively inert nanomaterial (nanoceria). Liver and spleen samples from rats given a single intravenous infusion of nanoceria were obtained after prolonged (90 days) in vivo exposure. These advanced analytical electron microscopy methods were applied to elucidate the organ-specific cellular and subcellular fate of nanoceria after its uptake. Nanoceria is bioprocessed differently in the spleen than in the liver.
The long-term fate of nanomaterials is not well understood. Concerns about adverse human health impacts due to a single or repeated exposure may deter some nanotechnology developments from reaching commercial implementation. A greater understanding of the roles of nanoparticle biodistribution and fate, interactions with tissues, and in vivo effects is needed to alleviate some of the reservations related to their widespread use. For progress to be made in developing better safety assessment methodologies and understanding the toxicity of nanomaterials, it is necessary to recognize the fundamental processes occurring at the bio–nano interface and the mechanisms/chemistries involved (Nel et al. 2009; Graham, Jacobs, et al. 2017; Giri et al. 2013; Pulido-Reyes et al. 2017). One approach is the utilization of advanced high-resolution transmission electron microscopy (HRTEM) coupled with in situ spectroscopic methods (energy-dispersive X-ray spectroscopy [EDS] mapping) and electron energy loss spectroscopy (EELS). The beginnings of this field have been described (Graham, Jacobs, et al. 2017). Future strides in this area will be aided by improvements in EDS and EELS detection abilities (FEI Talos and NION UltraSTEM instruments and EELS resolution of 10 mV with spectral quality on the order of an X-ray synchrotron) and the online availability of new experimental and computational spectral databases. A comprehensive experimental and theoretical X-ray absorption and EELS database is currently being developed as part of the Materials Project at Lawrence Berkeley National Laboratory (Dozier et al. 2017). It provides online programs and tools to access structural and electronic information among a long list of properties for various nanoparticles and metastable phases that can be used to compare with experimental or analytical data sets. This is particularly important for the recently described in vivo transformation and subsequent formation of second-generation nanoparticles at the cellular and subcellular level (Graham et al. 2014; Graham, Jacobs, et al. 2017). Little is known about underlying mechanisms that control bioprocessing which modifies the physicochemical properties of the primary particles. We previously defined in vivo processing as the dynamic chemical and physical breakdown and subsequent transformation of nanoparticles at the cellular and subcellular levels, which occurs when particle stability is compromised (Graham et al. 2014). As a result, new reaction products are formed, and the released ions may be transported and form new nuclei and second-generation nanoparticles (Graham, Jacobs, et al. 2017).
Nanomaterials can be bioprocessed/biodegraded in vivo, most likely through dissolution, resulting in structural loss and change of their physicochemical properties and activity, including toxicity (Soenen et al. 2015). Transport of biosoluble constituents can result in the formation of new phases close by or remotely. Nanoscale barium sulfate (Konduru et al. 2014) and silver (J. H. Lee et al. 2013) undergo relatively rapid dissolution in vivo while carbon-based nanomaterials are quite biopersistent, although carbon nanotubes have been shown to undergo peroxidase-mediated degradation (Vlasova et al. 2016; Nunes et al. 2012; Shvedova et al. 2012). There is particular concern about biopersistent nanomaterials, their ultimate fate, and potential toxicity induced by their prolonged persistence (Arts et al. 2015; Laux et al. 2017) and following repeated exposure (Oberdörster et al. 2000).
Nanoceria has current applications and there is great interest in its potential as a therapeutic agent. It has industrial applications that capitalize on its abrasiveness and autocatalytic oxidation/reduction, mediated by reversible oxygen binding at its surface, interconverting reduced cerium (Ce) (III) and oxidized Ce(IV). It is used in chemical mechanical polishing/planarization (e.g., integrated circuit manufacture) and as a catalyst (in diesel fuel additives, solid oxide fuel cells, and other electrochemical devices; Reed et al. 2014). Capitalizing on its autocatalytic redox, antioxidant/anti-inflammatory, and enzyme-mimetic (nanozyme) activity, nanoceria has been assessed and shown, mostly in in vitro studies, to have many potential therapeutic applications (Walkey et al. 2015). Results of some in vivo studies follow as examples of nanoceria’s therapeutic potential. Repeated intravenous (iv) nanoceria reduced the progression of cardiac dysfunction in a transgenic murine (Monocyte Chemoattractant Protein 1 [MCP-1]) model of cardiomyopathy (Niu et al. 2007), reduced monocrotaline-induced increased ventricular hypertrophy and pulmonary arterial pressure (Kolli et al. 2014), and improved microvascular reactivity in spontaneously hypertensive rats (Minarchick et al. 2015). Nanoceria pretreatment (intraperitoneal [ip]) protected against hypobaric hypoxic–induced inflammatory lung response and lung injury in Sprague-Dawley rats (Arya et al. 2013). It reduced the number of tumor nodules in the peritoneum, bowel, and liver of nude mice after iv injection of A2780 (human ovarian carcinoma) cells (Hijaz et al. 2016), advancing in vitro observations of anticancer activity (Gao et al. 2014). Radiation protection was shown by ip nanoceria before gamma radiation to nude mice (Colon et al. 2010) and ip nanoceria injection before and after lethal X-ray radiation that increased survival of white outbred mice (Popov et al. 2016). Repeated ip nanoceria injections to Wistar rats reduced weight gain and reduced plasma insulin, leptin, glucose, and triglycerides, suggesting anti-obesity potential (Rocca et al. 2015). Antibacterial activity in vitro (Alpaslan et al. 2017) and attenuation of hepatic damage and systemic inflammation from lipopolysaccharide-induced sepsis in Sprague-Dawley rats suggest antimicrobial potential (Selvaraj et al. 2015). Nanoceria ip injection (60 mg/kg) abrogated some of the adverse effects of streptozotocin-induced diabetes in Wistar rats (Navaei-Nigjeh et al. 2012). Repeated iv nanoceria injections reduced carbon tetrachloride hepatotoxicity end points in rats, suggesting therapeutic potential in chronic liver disease (Oró et al. 2016). The potential for repeated iv injections of nanoceria to reduce neurodegenerative disease was demonstrated in a model of multiple sclerosis (experimental autoimmune encephalomyelitis) in -SJL/J-type mice (Heckman et al. 2013). Beneficial response was dose dependent up to a total of 185 mg/kg nanoceria. Nanoceria reduced postischemic stroke brain infarct volume in rats, but beneficial response was not dose linear (Kim et al. 2012). Beneficial retinal effects have been demonstrated by intravitreal nanoceria injection before and after damaging light exposure (reduced photoreceptor cells degeneration; Chen et al. 2006) and subsequent studies by this group. Topical nanoceria accelerated healing of biopsy punch–induced skin wounds in C57BL/6 mice (Chigurupati et al. 2013). Oral nanoceria after oral ethanol reduced gastric ulcers in Sprague-Dawley rats (Prasad et al. 2013).
Nanoceria was reported to be insoluble in water, physiological saline, cell culture medium, phagolysosomal simulant fluid, and artificial phagolysosomal fluid at pH 4.5 and 5.5, and only 0.02% solubilized in 0.1N HCl after 28 days (He et al. 2010; Cho et al. 2012; Geraets et al. 2012; Wohlleben et al. 2013; Keller et al. 2014). It persists in vivo for considerable time, although, with the exception of the liver, the structural integrity, size, and morphology after uptake and prolonged residence in vivo are not well defined, especially for different organs that harbor the majority of nanoceria after exposure. Following a single iv administration of an ∼30-nm ceria (aqueous dispersion) to rats, determination of Ce in 13 organs and 2 fluids 90 days later accounted for 60% of the dose (Yokel et al. 2012). The major sites of nanoceria clearance from blood included the liver and spleen, which contained 21% and 15% of the Ce, respectively (Yokel et al. 2012). Histology revealed adverse effects in the liver associated with micron-sized intracellular nanoceria agglomerations, including the formation of granuloma (first seen 30 days after nanoceria administration) that persisted without noticeable progression or regression to 90 days after the single nanoceria dose (Tseng et al. 2012; Tseng et al. 2014). The average spleen weight of nanoceria-treated rats was 20% greater than control rats.
Exactly how in vivo processing of nanoceria affects its toxicologic outcomes has yet to be determined. Important questions that need to be addressed are: (1) what are the in vivo processing variances of nanoceria in different organs, (2) which organ(s) forms secondary phases and to what extent, and (3) can dissolution phenomena, phase transformations, and second-generation particles/reprecipitation be distinguished for nanoceria in different organs using advanced analytical HRTEM applications? To address these issues, we investigated the in vivo processing of nanoceria in 2 organs, spleen and liver, which help address important questions about local environmental factors. Nanoceria in liver and spleen was investigated to assess the extent of particle transformation, including morphological and chemical changes, and to identify new reaction products as a result of bioprocessing. The main objectives were to identify differences that exist in organ-specific nanoceria processing mechanisms including particle breakdown, dissolution, and transformation and to establish relationships among nanoceria processing, biopersistence, and its in vivo stability. The study focused on determining the extent of bioprocessing in the 2 organs using analytical HRTEM/STEM (Scanning Transmission Electron Microscope) and EELS measurements with elemental mapping of Ce, oxygen, and phosphorus in select tissue regions.
Materials and Methods
Nanomaterial
Synthesis and characterization of the 5.2% citrate-stabilized cubic nanoceria sterile aqueous dispersion used for iv administration of a single high dose to rats was described (Yokel et al. 2012; Yokel et al. 2013). The synthesized nanoceria was crystalline. It had Miller indices of (100), (010), (200), and lesser amounts of (311), and a measured d-spacing of 0.27 nm for (100), as identified by HRTEM (Figure 1). The average primary particle diameter measured by transmission electron microscopy (TEM) was 31nm. Dynamic light scattering revealed an average particle size in water of 41 nm, with a bimodal distribution of peaks centered at 41 and 273 nm with peak percentages of 100:0% (number basis) and 36:64% (volume basis). The Brunauer-Emmett-Teller method (BET)-determined surface area was 15 m2/g. The zeta potential in water at pH ∼7.3 was −56 ± 8 mV. As synthesized the ceria particles had a slightly reduced valency (more Ce(III) on their surface outer rim and a more enhanced valency (less reduction, more Ce(IV)) in the central (core) region). The extent of surface citrate coating was ∼18%. The free Ce content was <<1%. The as-synthesized nanoceria is described in more detail in Graham et al. (2014).
High-resolution transmission electron microscopy image of a cubic ∼30-nm nanoceria particle from the dispersion given by iv infusion to rats and corresponding diffraction pattern. The dominant face is (100).
Animals
The animals (male Sprague-Dawley rats) and their housing, diet, and monitoring; nanoceria administration; samples collected at termination; and tissue preparation and histological evaluation procedures were described (Yokel et al. 2012). Nanoceria-treated rats received a 1hr iv infusion of 85 mg/kg nanoceria. This single high-dose nanoceria exposure was utilized following the toxicology/experimental pathology approach of first determining whether a novel substance produces effects (hazard identification) to be followed by lower exposures to determine the dose–response determination. The high dose was also used to maximize the possibility of quantifying Ce by ICP-MS and detecting nanoceria by microscopy up to 90 days later. Given the biopersistence of nanoceria, tissue levels achieved after the single high dose might be reached after repeated smaller doses. Initial studies showed the dose to be well tolerated (Yokel et al. 2012). Control rats received vehicle infusion. Three nanoceria and 3 control rats were terminated each of 1, 7, and 30 days after completion of the infusion. Six control and 7 nanoceria-treated rats were terminated 90 days after the infusion. They were anesthetized to lack of response to stimulus with 80 mg/kg ketamine and 10 mg/kg xylazine ip prior to termination. Tissues were harvested from the liver and spleen and were fixed in 10% neutral-buffered formalin and processed for histopathology analysis. Animal work was approved by the University of Kentucky Institutional Animal Care and Use Committee. The research was conducted in accordance with the Guiding Principles in the Use of Animals in Toxicology.
Microscopy for Histological Examination
Samples of liver and spleen were cut into 3 mm3 pieces, dehydrated, and embedded in Araldite 502. The blocks collected for histology were sectioned to 1 μm thickness and stained with toluidine blue for light microscopy screening. Selected blocks were further sectioned, mounted on Formvar/carbon-coated copper grids (200 mesh, Ted Pella Inc., Redding, CA), and examined with a Phillips CM-10 low-resolution electron microscope equipped with a LaB6 cathode (Phillips Electronic Instruments Co., Eindhoven, the Netherlands) operated at 60 kV. Nanoceria-containing Kupffer cells were detected by their enlarged size and sinusoidal location in the liver, while Ce-phosphate nanoneedles in the white pulp of the spleen were recognized at low resolution as dense agglomerates around lymphatic nodules.
HRTEM/STEM, EELS, and EDS Methods
For HRTEM tissue, sample blocks were cut to ∼50- to 70-nm thick sections and collected on 200 mesh Formvar/carbon-coated copper grids without staining. Instruments included a JEOL 2100F field emission TEM/STEM operated at 200 kV with an analytic pole piece. Images were recorded with a Gatan Ultrascan 4k × 4k CCD camera, and data analysis and processing used Gatan Digital Micrograph software. High Resolution Scanning Transmission Electron Microscopy (HRSTEM) imaging, EELS, and EDS were performed with a Gatan high-angle annular dark field (HAADF) detector, Digiscan II, and Gatan 2000 Image Filter. An Oxford Aztec EDS system was used for select elemental mapping. All HRSTEM images were acquired using an analytical probe with 0.17-nm resolution. The EELS measurements and EELS trace lines were obtained using a 1-nm probe, α of 12 mrad and β of 6 mrad. Select elemental intensity maps were obtained from core edge intensity obtained after background subtraction using an integration window ranging from 10 to 30 eV depending on the edge of interest (Ce, O, and P edges). A FEI Talos transmission and scanning electron microscope was used for fast EDS mapping with a high degree of sensitivity due to the wrap-around style EDS detector mounted on the objective lens. Maps generally took 1 to 2 min to acquire with a sensitivity great enough to detect elemental concentrations in 4-nm size particles. EDS provides the means to determine the relationship between elemental accumulation and tissue regions, particularly in a situation where dynamic processes may be in play such as in bioprocessing. This study focused on a high dose to obtain excellent EDS signal strength in different organ tissue, but low dose exposure of nanoparticles can also be traced using HRSTEM applications (Graham, Jacobs, et al. 2017).
Results
Rats intravenously infused with a single high dose (85 mg/kg) of ∼30-nm ceria displayed particle retention in the liver and spleen up to 90 days post infusion. Hepatic and splenic granulomas were dispersed throughout the liver as reported previously (Tseng et al. 2012). Agglomerates of densely packed nanoceria were found in engorged Kupffer cells (Figure 2A). Spleen cellular agglomerates are shown in Figure 2B and were comprised of intracellular retention of nanoparticles which were particularly abundant in the white pulp. Light microscopic examination also revealed that the spleen showed a much greater extent of granuloma formation at 90 days compared to the liver. Ce concentration differences in liver versus spleen for various time end points up to 90 days postinfusion are detailed elsewhere (Yokel et al. 2012). Ninety days postinfusion, the spleen had a much higher concentration of Ce (2,800 µg/g) than the liver (300 µg/g). At that time, histology of the liver revealed intracellular agglomerations up to micron size diameter made up of nests of closely packed particles (nanoceria and/or Ce-containing degradation products). The agglomerations could be linked to adverse effects in the liver, including the formation of granuloma seen in light microscopy (Figure 2A). The presence of Kupffer cells provided a “marker” for the identification of hepatic granuloma, as described in Tseng et al. (2012) and Tseng et al. (2014). Large cytoplasmic nanoceria-containing agglomerates were observed in macrophages throughout the red and white pulp splenic parenchyma, more abundantly found in the white pulp (Figure 2B). In light microscopy, we saw dense particles but could not determine whether the primary nanoceria particles displayed any transformation inside the organs.
Hepatic and splenic granulomas. (A) Agglomerates of densely packed nanoceria are shown in engorged Kupffer cells in the liver (circled area). (B) Cellular agglomerates with intracellular retention of nanoparticles are shown to occur abundantly in the spleen white pulp (circled areas).
HRTEM revealed structural evidence that nanoceria in the liver was not inert to bioprocessing but was degrading over 90 days (Figure 3A and B). This was evidenced by loss of some of the original structure of the as-dosed cubic nanoparticles that exhibited well-rounded corners after 90 days (Figure 3B) and formation of second-generation Ce-containing ultrafine (<3 nm) crystalline particles in the immediate vicinity of the partially degraded as-dosed nanoparticles (Figure 3B). The second-generation particles were significantly smaller than the as-dosed nanoparticles and had a different chemical composition (more reduced Ce(III) as determined by EELS) than the as-dosed nanoceria (Figure 3D compared to Figure 3C). In the EELS spectrum, the M4 peak is strongly influenced by Ce(III), while the M5 peak height is a relative measure of the presence of Ce(IV). The high M5/M4 ratio (Figures 3D) can be linked to high Ce(III) and to antioxidant properties, as was previously shown for nanoceria bioprocessing in the liver (Graham et al. 2014). The morphological and chemical differences between the as-dosed (Figure 1) and second-generation particles (Figure 3B shows morphology; C and D show composition) indicate a dissolution-reprecipitation process occurred. The possibility that nanoceria may also undergo bioprocessing in organs other than the liver prompted us to examine events in the spleen which contained the highest Ce concentration, and third greatest amount of Ce (after liver and bone marrow) that was sequestered after iv infusion (Yokel et al. 2012). Nanoceria translocated and accumulated in the spleen (Figure 3E). Initial scanning of spleen tissue sections in TEM and STEM modes using a high-resolution probe (0.2 nm) revealed localized areas with agglomerated, crystalline nanoceria which match the original morphologies and size range of the as-dosed particles (Figure 1), but displayed partially missing corners due to dissolution and bioprocessing (Figure 3E and F), which were seen with dark field STEM imaging. The degree of bioprocessing occurred to a lesser extent compared to nanoceria sequestered in the liver (Figure 3E and F compared to Figure 3B). Localized second-generation plumes of ultrafine (0.5–2.5 nm) nanoparticles formed close by, collecting as ultrafine particles next to the partially dissolving primary nanoceria (Figure 3F). Corresponding EELS analyses (small probe size [0.2 nm] to minimize beam/tissue interactions) were used to compare the redox state of the as-dosed primary nanoceria and in vivo precipitated ultrafines (Figure 3F–H). The Ce oxidation states were determined by the fine structures of M4 and M5 edges in EELS spectra as described elsewhere (Turner et al. 2011). They indicated that the formation of ultrafine particles was associated with a much improved free radical scavenging potential, evidenced by more surface Ce(III) (greater Ce M5 contribution). These results are in agreement with earlier findings for the liver (Graham et al. 2014). Although there were limited amounts of Ce-phosphate nanoneedles in the liver (typically in lysosomal regions; not shown here), both HRTEM and dark field STEM demonstrated significant quantities of Ce-phosphate particles in the spleen (Figure 4A and B). Higher magnification shows Ce-phosphate nanoneedles (Figure 4C–F). The nanoneedles were localized predominantly within the lymphoid region of the spleen white pulp and agglomerated around granules in subcellular regions (Figure 4A and B). The ultrafine Ce-phosphate nanoneedles are either part of a larger network that spanned across several hundred nanometer (Figure 4C) or coated the exterior of semispherical components that resemble lipid structures and granules (Figure 4B and D). In some cases, the nanoneedles spanned >20 nm in length (Figure 4E). At atomic resolution, it can be seen that the nanoneedles are composed of individual self-aligned crystallites (Figure 4F). The d-spacings (2.81 Å) correspond to CePO4. The diffraction pattern reveals the highly crystalline nature of these particles (Figure 4F). Biodistribution and structural details of the Ce-phosphate nanoneedles in the spleen are further demonstrated in a video (Online Supplementary File) that was obtained in STEM mode and with a high-resolution probe (0.2 nm).
Bioprocessing of nanoceria in liver and spleen. Figure (A) shows transmission electron microscopy and (B) shows HRSTEM of nanoceria in the liver. Figure (B) illustrates high degree of nanoceria rounding (circled area 1) and clouds of ultrafine particles (circled area 2). Figures (C) and (D) show electron energy loss spectroscopy (EELS) measurements with peak intensities for M4 and M5 at locations 1 and 2 in Figure (B), respectively.
Figures (E) and (F) show HRSTEM of nanoceria in the spleen with lesser degree of rounding in circled area 1 than seen in the liver (B); clouds of ultrafine particles are shown in circled area 2. Figures (G) and (H) show EELS measurements with peak intensities for M4 and M5 at locations 1 and 2 in Figure (F), respectively.
High-resolution transmission electron microscopy (HRTEM)/STEM images show retention of nanoceria and precipitation of Ce-phosphate nanoneedles in the spleen. (A) Transmission electron microscopy shows general location of nanoceria in spleen tissue. (B) HRSTEM illustrates formation of ultrafine precipitates as free networks in location 1 and as surface coatings around semispherical splenic structures in location 2. (C) HRTEM shows a network of ultrafine nanoneedles from location 1 in Figure (B). (D) HRTEM illustrates selective location of nanoneedles and single crystallites on splenic structures from location 2 in Figure (B). (E) HRSTEM shows select regions on splenic structures with larger nanoneedles. (F) HRTEM shows atomic resolution of nanoneedles with corresponding d-spacing and diffraction pattern.
A Talos F200 STEM with an ultrahigh resolution analytical beam at 200 kV energy was used to obtain better insight into the elemental components of the nanoneedle structures and the surrounding host cellular components in the spleen. A relatively larger area containing a network of nanoneedles spanning ∼1 micron in 3-D was used for EDS mapping (Figure 5). The high-angle annular dark field scanning transmission electron microscopy (HAADF-STEM) image (Figure 5A) illustrates the nanoneedle agglomerate. Corresponding EDS maps indicate a match for O, P, and Ce for each nanoneedle (Figure 5A), which corroborates the earlier findings that the nanoneedles represent Ce phosphate. Nanoneedles are very thin, giving a greatly reduced EELS signal. The mass of a single partially formed nanoneedle (Figure 5B) provided an EELS signal with a sufficient signal to noise ratio to assess the M5/M4 ratio. The M5 peak being even with the M4 peak is indicative of the presence of Ce(III) and a more reduced state of Ce (Graham, Jacobs, et al. 2017). Further work is required to assess the beam dose sensitivity of the nanoneedles, so that methods can be developed to further access the oxidation state of the needles in greater detail.
Talos—energy-dispersive X-ray spectroscopy (EDS) mapping. (A) EDS maps of spleen regions containing nanoneedles: high-angle annular dark field scanning transmission electron microscopy (HAADF-STEM) image shows nanoneedle networks with corresponding maps for O, P, and Ce in blue, green, and yellow, respectively. (B) HAADF-STEM image including a single nanoneedle in the spleen with corresponding electron energy loss spectroscopy spectrum of the nanoneedle.
A high-resolution elemental EDS map was also constructed for individual nanoneedles (Figure 5C). Individual crystallites that had self-aligned to form the nanoneedles can be seen in the higher-resolution EDS map (Figure 5C), which shows perfect overlap for Ce and P in each individual aligned crystallite, where the nanoneedles formed in the spleen. Oxygen was also identified but is not shown in the EDS maps. Iron, corresponding to a ferritin particle (biomineralized iron ∼5 nm), occurs in the immediate vicinity of the Ce-phosphate nanoneedles (Figure 5C). The importance of ferritin nanoparticle formation in regions next to invader nanoparticles was described by Graham, Jacobs, et al. (2017). The elemental spectra shown in Figure 5D for 2 select regions, spectrum 1 (green) taken directly from a selected nanoneedle from box 1 in Figure 5C and spectrum 2 (red) taken from the ferritin nanoparticle from box 2, clearly indicate that the nanoneedles are composed of Ce, P, and O and do not represent nanoceria that were iv infused into the rats; the ferritin is composed of only Fe and O and represents biomineralized iron. The coexistence of P and nanoneedles constitutes a clear difference between liver and spleen since Ce phosphate is characteristic for the spleen and plays a lesser role in the liver.
Talos—energy-dispersive X-ray spectroscopy (EDS) mapping. (C) HAADF-STEM image (with transmission electron microscopy [TEM] inset in left upper corner) showing accumulations of nanoneedles around splenic structure; red-lined box in TEM inset marks location where HAADF-STEM image was derived, which included only a few isolated nanoneedles. Corresponding EDS map for the nanoneedles shows Fe (red), Ce (yellow), and P (green). Red area corresponds to a 4-nm ferritin nanoparticle. Overlapping yellow and green areas correspond to nanoneedles. (D) Two select EDS spectra obtained for a nanoneedle at location 1 in Figure (C) and a ferritin nanoparticle at location 2 in Figure (C).
Discussion
Nanoceria persistence in both the liver and spleen has been shown previously to contribute to the observed toxicity in these organs (Tseng et al. 2012). Here, we report that the spleen shows even more granuloma formation than the liver 90 days after a single nanoceria infusion. The observed granulomas in both liver and spleen are the result of the high iv exposures and would not be expected in humans. The high dose was chosen to observe differences during microscopic analysis. The white pulp contained numerous foci where clusters of cells with nanoceria inclusion were observed (Figure 2). The splenic microanatomy can be analyzed through its vasculature. Once the lineal artery enters the spleen through the hilus, it branches into progressively smaller caliber arteries before entering the interior fibrous trabeculae. At that point, they become known as the central arteries surrounded by sheaths of enlarging lymphatic tissue to form splenic follicles known as the white pulp. The central arteries exiting from the white pulp branch to form the penicillar arteries before entering the red pulp of the spleen. While the splenic white pulp is essentially made of lymphatic tissue, the red pulp contains the sinuses and the splenic cords (Steiniger, Bette, and Schwarzbach 2011). Within the splenic cord cavities, mixtures of red and white cells are abundantly present in the red pulp. This is especially relevant for experimental treatment entities including nanoparticles. Through these structural features of the splenic microcirculation, invader nanoparticles may permeate throughout the splenic parenchyma. It has been reported that more than 90% of the splenic blood flow bypasses the red pulp in favor of the white pulp (Schmidt et al. 1993). It highlights the prevalent role of the spleen as a lymphoid organ and suggests that blood-borne entities, including nanoparticles (nanoceria), could preferentially affect the white pulp upon entering the spleen, as observed in the current study. In contrast, nanoceria uptake in the liver is mainly conducted by Kupffer cells and T cells leading to the formation of granuloma (Tseng et al. 2012) but not as pronounced as in the spleen.
Instability of nanoparticles after exposure, cellular uptake, in vivo processing, and transformation influence nanotoxicity (Graham, Jacobs, et al. 2017). The mechanisms that induce toxicity after exposure are poorly understood and thus hinder the building of predictive models. Electron microscopy has been fundamental in gaining knowledge about structural, compositional, and electronic information of nanoparticles in tissues and can provide information on nanoparticle uptake, biodistribution, and material characterization. We discuss below the importance and application of advanced HRTEM to identify the various processes involved during in vivo nanoparticle transformation and biodegradation to address the in vivo processing of nanoceria in the liver and spleen as a direct response to the uptake of invader 30-nm ceria nanoparticles.
Biodegradation of iron-containing nanoparticles has been described. Degradation of superparamagnetic iron oxide nanoparticles (SPIONs) in rat liver was suggested by reduction of the dark T2* Magnetic Resonance Imaging (MRI) signal intensity produced by these particles and a reduction in Prussian blue staining over 4 weeks (P.-W. Lee et al. 2010). Using inductively coupled plasma optical emission spectrometry (ICP-OES) to quantify total iron and ferromagnetic resonance and a superconducting quantum interference device magnetometer to measure magnetization (intact SPIONs), Levy et al. (2011) found a decrease in Superparamagnetic Iron Oxide Nanoparticles (SPION) iron in mouse liver, and to a lesser extent the spleen, and increase in non-SPION iron in the spleen over 90 days. These results suggest SPION degradation in the liver and release of iron-containing degradation products that accumulate in the spleen. TEM showed a reduction in electron-dense particle size with less-defined contours after 30 days compared to the dosed SPIONs and a lack of nanoparticles at 90 days. Using a magnetophoresis technique to measure magnetization in tissue composed of human mesenchymal cells, Mazuel et al. (2016) observed a decrease in citrate-coated iron oxide nanoparticles over 27 days. Their results suggested dissolution of some particles, which was confirmed by TEM.
The present study applied sophisticated electron microscopy methods to the study of nanomaterial bioprocessing. This is the first utilization of advanced, analytical electron microscopy methods, HRTEM, HAADF-STEM, EELS, and EDS mapping, to characterize the effects of bioprocessing on the physicochemical properties of nanomaterials in different organs. Specifically, we compare bioprocessing effects of intravenously administered nanoceria in liver and spleen samples after a 90-day exposure. These methods were applied to elucidate the organ-specific cellular and subcellular fate of nanoceria after its uptake. As noted by Mazuel et al. (2016, pg. 4), “Transmission Electron Microscopy (TEM) is the method of choice for in situ nanoscale location of nanoparticles within the model tissue and its component cells, and for monitoring their individual fate as a function of tissue-maturation.” We demonstrated that the in vivo processing, transformation, and cellular effects of nanoceria are different in the spleen compared with the liver. In the liver, this is characterized by primary nanoceria agglomerates with strong dissolution effects including rounded surfaces and ultrafine nanoceria (<3 nm) in clouds. The spleen also contains nanoceria agglomerates that were sequestered from the blood, but the individual particles show less dissolution effects (less rounding of the surfaces). HRTEM revealed remnants in the liver of the as-dosed nanoceria but also significant quantities of clouds made up of much smaller Ce-containing particles within close proximity to the as-dosed, albeit bioprocessed (rounded), nanoceria agglomerates. This suggests that bioprocessing of the primary nanoceria and formation of second-generation particles in the liver are linked both spatially (close distance) and temporally (clouds formed after dissolution of the primary particles). It was shown earlier that nanoceria uptake in the liver followed by in vivo processing presents with corresponding effects on oxidative stress increases and subsequent decreases and coincides with the release of clouds containing ultrafine nanoceria which have a greatly improved Reactive Oxygen Species (ROS) potential compared with the primary particles (Graham et al. 2014; Hardas et al. 2014). Changes in numerous oxidative stress, antioxidant, cytokine, autophagy, and apoptotic markers occurred in the hippocampus over the 90 days after the ∼ 30-nm nanoceria administration; a progression through the 3 tiers of hierarchical oxidative stress model for the first 30 days, then a general return to baseline levels 90 days after nanoceria administration, a fourth tier (Hardas et al. 2014). This was based on coinciding temporal changes in both liver and brain, but there is no direct evidence that second-generation nanoceria with high Ce(III) activity were translocated to the brain to affect the reversal in oxidative stress (Graham et al. 2014; Hardas et al. 2014).
The spleen, unlike the liver, has a very high concentration of Ce-phosphate nanoneedles, as shown in Figure 4. Sisler et al. (2016) reported that La2O3 nanoparticle conversion to La-phosphate nanoparticles (LaPO4) was associated with chronic pulmonary inflammation and mild fibrosis in mice. The formation of second-generation Ce- and P-containing nanoneedles in large 3-D networks in the current study is indicative of a precipitation mechanism involving Ce ion containing supersaturated solution and ion transport. We also observed nearly spherical structures in the spleen (Figure 4B) that are surrounded/coated by Ce-phosphate nanoneedles, which further indicates the nanoneedles formed when Ce ions interacted/reacted with a P-containing surface or membrane. This also requires a Ce-ion transport mechanism as indicated in the bioprocessing model in Figure 6. The source for the abundant Ce-phosphate nanoneedles in the spleen would require that a large fraction of the primary nanoceria was bioprocessed (dissolved) providing abundant Ce ions. However, in the spleen, the primary nanoceria shows little evidence for dissolution. Therefore, the Ce-phosphate nanoneedles in the spleen (Figures 4 and 5) must have formed from Ce ions transported to the spleen rather than via bioprocessing of the primary nanoceria that were initially cleared by the spleen after iv infusion. Major bioprocessing of nanoceria in the liver via dissolution processes and a lack of accumulation of Ce phosphate in the liver indicates that some transport of Ce ions from liver to the spleen occurs, as schematically illustrated in Figure 6. The decrease of Ce in the liver from 30 to 90 days after a single iv nanoceria infusion paired with the concomitant lack of decrease, or increase, in the spleen (Table 1) is consistent with Ce-ion transport from liver to spleen. Availability of Ce “ions” for complexation with regionally accessible phosphate groups in phosphate-rich or depleted regions may govern the amount of Ce-phosphate nanoneedles that can form. Some metal complexing without nanoparticle precipitation (ion adsorption) may take place even before (yellow zone in Figure 6) the Ce ions arrive at phosphate-rich regions (green zone in Figure 6). Therefore, local ion transport rates will have some control on the rate of formation of Ce nanoneedles. Ion transport rates will be most likely affected by the local environment. This may explain why we observe second-generation nanoparticles in both liver and spleen but with very different amounts. This, in part, is due to the translocation of Ce from liver to spleen (Figure 6). Our findings are consistent with previous data that show a decrease of Ce in the liver for 2 doses of nanoceria (6 mg/kg, Yokel et al. 2014; 85 mg/kg, Yokel et al. 2012) 30 and 90 days after iv administration that was accompanied by an increase in Ce in the spleen. A considerable increase in Ce was seen in the spleen by Yokel et al. (2012) after the greater dose (85 mg/kg) which is the same dose used in this study (Table 1).
Schematic comparison of nanoceria bioprocessing in liver and spleen.
Total Cerium in the Liver and Spleen 30 and 90 Days after a Single iv Nanoceria Infusion.
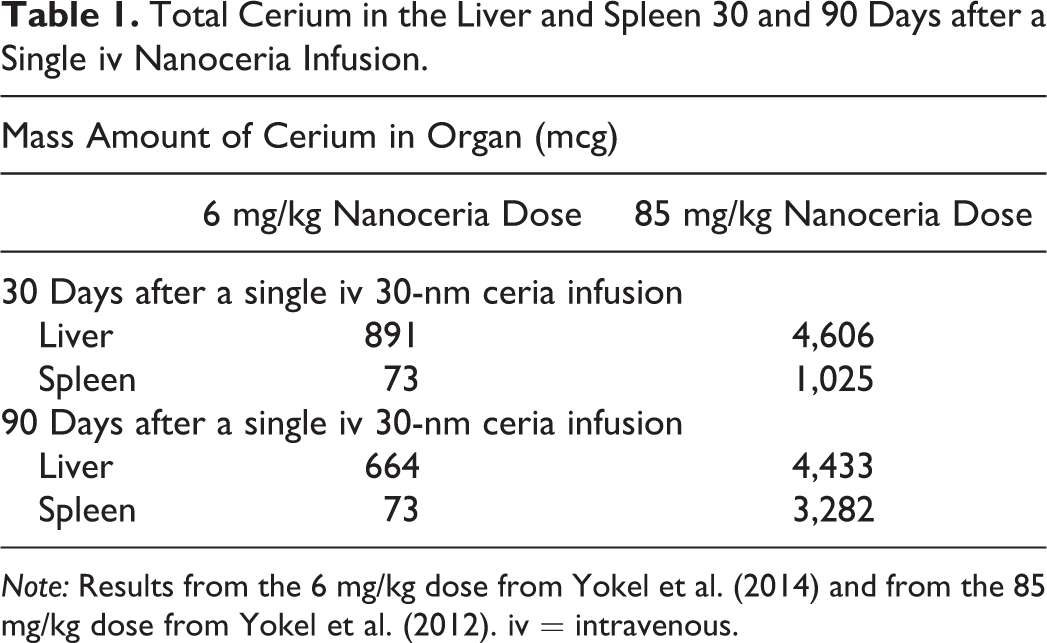
Note: Results from the 6 mg/kg dose from Yokel et al. (2014) and from the 85 mg/kg dose from Yokel et al. (2012). iv = intravenous.
Comparing the toxicological response of nanoceria to its ion form, it was demonstrated using Ce-ion instillation into lungs that ion uptake induced a greater initial toxicity than the metal nanoparticles and resulted in a high retention of Ce in the lung (Molina et al. 2014). The high retention of Ce (75–92% at 28 days) in the lung after Ce-ion instillation was unexpected. Follow-up HRTEM and EELS revealed that in vivo formation of Ce phosphates had occurred (Graham, Wang, et al. 2017). Ce-phosphate precipitation observed in the spleen in the current study also requires a source of Ce ions, which we suggest is a result of the in vivo breakdown and dissolution of nanoparticles in the liver (Figure 6). Environmental conditions in organ-specific regions where nanoparticles become initially sequestered play a significant role in determining the rate of in vivo processing, nanoparticle transformation, and ion release rates and diffusion to other locations/organs that results in second-generation phases. Phosphate serves central biological functions as part of nucleic acids, phospholipids, and adenosine triphosphate; as a metabolite involved in energy transfer; as a component of signal transduction cascades; and in the regulation of enzymes and metabolic processes (Gu et al. 2016). Importantly, phosphate functions as an intracellular buffer and plays a central role in cellular metabolic pathways (Crook 2012). It is a critical biochemical, and subtle concentration changes can profoundly alter cellular growth. A high-sensitivity methodology that would allow for dynamic analysis of inorganic phosphate in subcellular compartments is still lacking, but we can clearly see the effects of phosphate availability in the formation of the Ce-phosphate nanoneedles in the spleen. Furthermore, we show that available phosphate seems to limit the location where nanoneedles are formed (Figure 4) by inducing metal precipitation as Ce phosphate. Nanoceria may adsorb to the phosphate group of phosphocholine, a precursor to phosphatidylcholine, a major component of eukaryotic cell membranes (Liu and Liu 2016), which could contribute to the observed distribution of nanoceria around membrane-bound intracellular structures. Nanoceria has phosphatase mimetic activity, the ability to release terminal phosphate from nucleotides and related compounds (Janoš et al. 2017), which may provide some of the phosphate groups seen in the Ce-phosphate nanoneedles. Although nanoceria may act as a phosphatase to release phosphate, other regions where nanoceria undergoes greater bioprocessing/solubility, such as inside the liver (Graham et al. 2014), may favor ion transport over phosphate precipitation. The formation of Ce-phosphate precipitates that form from available metal ions in tissue was previously demonstrated (Berry et al. 1997; Graham, Wang, et al. 2017) and is independent of nanoceria’s phosphatase mimetic activity, suggesting there are several pathways to form Ce-phosphate precipitates. We suggest that Ce-phosphate nanoneedle formation may counteract the toxicity caused by free Ce ions derived from dissolving (bioprocessing) nanoparticles. EELS analysis demonstrates that the Ce-phosphate nanoneedles are composed of reduced Ce(III) (Figure 5B), which may contribute to antioxidant properties in vivo. Based on the current findings, we propose that the interplay between nanoceria dissolution, ion transport to select regions/organs, and reprecipitation as phosphates may influence the availability of various metals including Ce for cellular uptake. The fact that the spleen after 90 days in this study was observed to have more granuloma than the liver may be due to a higher Ce-ion transport into the spleen, since Ce-ion exposure was previously shown to induce a greater initial toxicity (Molina et al. 2014).
Biopersistence of nanoparticles typically refers to the elemental concentrations retained in tissues rather than the actual nanoparticles, their concentration, structural and morphological integrity, chemical composition, redox characteristics, size, or reactive surface area. Elemental concentrations cannot distinguish between solids (nanoparticle concentration) or released ions which can be readily transported, absorbed, or precipitated after dissolution of the primary particles (Figure 6). This limitation/shortfall highlights the importance of analytical HRTEM which can determine the dynamic physiochemical changes of nanoparticles in tissue sections as a function of residence time and for different organs. In vivo processing can affect the transport phenomena and location of primary and second-generation nanoparticles and their ion counterparts (Graham et al. 2014). Based on the findings in the current study, we suggest that a first-principle understanding of nanoparticle phase stability in cellular and subcellular environments can help to explain structural and physicochemical data that are gathered from HRTEM/EELS and serve as a guideline for nanoparticle bioprocesses. The current findings further reveal that nanoscale materials considered to be biopersistent may undergo bioprocessing in both liver and spleen but have different underlying mechanisms. For nanoceria, this does not result in elimination from the mammal, but the formation of new, second-generation particles that have different morphology and chemical composition than the parent materials, and likely, different biological properties.
Footnotes
Authors’ Note
The content of this article is solely the responsibility of the authors and does not necessarily represent the official views of the National Institutes of Health or National Institute for Occupational Safety and Health (NIOSH). Mention of any company name or product does not constitute endorsement by NIOSH.
Author Contribution
Authors contributed to conception or design (UG, RY, AD, LD, KM, MT, MB, JF); data acquisition, analysis, or interpretation (UG, RY, AD, LD, KM, MT, MB, JF); drafting the manuscript (UG, RY); and critically revising the manuscript (UG, RY, AD, LD, KM, MT, MB, JF). All authors gave final approval and agreed to be accountable for all aspects of work in ensuring that questions relating to the accuracy or integrity of any part of the work are appropriately investigated and resolved.
Declaration of Conflicting Interests
The author(s) declared no potential conflicts of interest with respect to the research, authorship, and/or publication of this article.
Funding
The author(s) disclosed receipt of the following financial support for the research, authorship, and/or publication of this article: Research reported in this publication was supported by U.S. Environmental Protection Agency Science to Achieve Results (grant number RD-833772) and the National Institute of General Medical Sciences of the National Institutes of Health under Award Number R01GM109195. Although the research described in this article has been funded wholly or in part by the United States Environmental Protection Agency through STAR Grant RD-833772, it has not been subjected to the Agency’s required peer and policy review and therefore does not necessarily reflect the views of the agency, and no official endorsement should be inferred.
Supplemental Material
Supplementary material for this article is available online.
References
Supplementary Material
Please find the following supplemental material available below.
For Open Access articles published under a Creative Commons License, all supplemental material carries the same license as the article it is associated with.
For non-Open Access articles published, all supplemental material carries a non-exclusive license, and permission requests for re-use of supplemental material or any part of supplemental material shall be sent directly to the copyright owner as specified in the copyright notice associated with the article.