
Abstract
Histopathology is a widely used approach to evaluate effects of endocrine-active chemicals in the thyroid. However, effects at an ultrastructural level have hardly been examined in fish thyroids. In the present study, zebrafish was exposed to sublethal concentrations of propylthiouracil (PTU; 0–50 mg/L) and perchlorate (PER; 0–5,000 µg/L) for 5 weeks in a modified early life–stage test. None of the treatments caused significant mortality (no observed effect concentrations for survival ≥50 mg/L [PTU] and ≥5,000 µg/L [PER]). PTU induced dose-dependent alterations in the rough endoplasmic reticulum (rER) in all exposure groups, whereas only the 2 highest PER exposure groups (500 and 5,000 µg/L) resulted in alterations of the rER. Both substances caused an increase in the numbers of lysosomes and mitochondria, with mitochondria displaying distorted cristae. Increased mitochondrial diameters were only observed in the PTU treatment. PER-exposed samples displayed an increase in apical microvilli. The highest PTU concentration (50 mg/L) showed first signs of cellular degeneration. Ultrastructural changes in zebrafish thyrocytes thus appear specific for different chemicals, most likely depending on their specific modes of action. Additional knowledge of subcellular changes in thyrocytes can help to better understand and interpret existing histological data in the future.
The thyroid system of vertebrates is essential for controlling growth and development as well as certain aspects of reproduction (Cyr and Eales 1988; Leatherland 1994; Power et al. 2001; Brown et al. 2004). For the detection of adverse effects of thyroid-active substances, an Organization for Economic Cooperation and Development (OECD) guideline has been established in 2009, which uses South African clawed frog Xenopus laevis as test organism. One crucial end point in this guideline is thyroid histology, a powerful and sensitive tool for evaluating adverse effects of chemicals on thyroid functionality (Grim et al. 2009).
As a test organism, Xenopus laevis is perfectly suited. However, the most versatile and heterogeneous vertebrate group regarding anatomy, physiology, reproduction behavior, and ecology are fish (Lagler et al. 1977; Janz 2000; Damstra et al. 2002). For today’s chemical regulatory purposes, zebrafish, Danio rerio, is one of the most important test organisms. Consequently, the number of studies dealing with histological alterations in the thyroid of zebrafish is increasing (Jianjie et al. 2016; Pinto, Guerreiro, and Power 2013; Sharma and Patino 2013; Sharma, Grabowski, and Patino 2016; van der Ven et al. 2006). Compared to Xenopus, the zebrafish thyroid is challenging to investigate due to the loose distribution of follicles around the ventral aorta in the pharyngeal region. Follicle size and number can vary between individuals. Thus, small changes in follicular cell height, colloid consistency, or other parameters caused by sectioning or histologic artifacts can easily be overinterpreted as treatment-related effects.
In contrast to light microscopical analyses, subcellular effects have not been widely documented, even though they usually precede the manifestation of histologically observable alterations in terms of both sensitivity (Braunbeck, Storch, and Nagel 1989) and time (Braunbeck and Storch 1992). The present study was conducted to investigate ultrastructural alterations in the thyroid gland of zebrafish after exposure to propylthiouracil (PTU) and perchlorate (PER), two well-characterized thyroid-active substances. For both substances, histopathological alterations in zebrafish thyroids have been described in our previous studies from the same experiments as presented here (Schmidt and Braunbeck 2011; Schmidt et al. 2012). This allows further comparisons between histopathological and ultrastructural effects.
In the present study, PTU and PER were used to induce alterations in zebrafish thyrocytes. PTU blocks thyroid peroxidase, whereas PER is a competitive inhibitor of the sodium–iodide symporter (NIS; Elsalini and Rohr 2003; Cooper 2005; Opitz et al. 2005; van der Ven et al. 2006; Tietge et al. 2010; Wolff 1998). Due to its specific use as pharmaceutical, PTU is a popular reference substance for thyroid toxicity testing. PER is frequently detected in the environment due to both natural and anthropogenic sources (Kumarathilaka et al. 2016). Both substances have adverse effects on different biological processes regulated by thyroid hormones (TH) in fish, for example, the immune system (Quesada-Garcia et al. 2016), eye development and function (Baumann et al. 2016), swim bladder infiltration (Thienpont et al. 2011), embryonic development and behavior (Jomaa et al. 2014; X. Zhao et al. 2013; J. Zhao, Xu, and Yin 2014), and gonad development (Mukhi and Patino 2007; van der Ven et al. 2006; Sharma and Patino 2013; Petersen et al. 2015). At light microscopical level, PTU induces hyperemia, proliferations in epithelial cell height, and stratification, while PER causes severe colloid depletion and proliferations of average-sized thyroid follicles in exposed zebrafish (Schmidt and Braunbeck 2011; Schmidt et al. 2012). Ultrastructural studies in mammals showed that exposure to methimazole and PTU leads to cuboidal and columnar epithelial cells, with numerous microvilli in the apical region of the cells. Additionally, alterations in mitochondria, proliferations in the rER, and accumulation of moderately dense vesicles could be detected (Fujita, Machino, and Nakagami 1963; Tsujio et al. 2007). After PER exposure, tadpoles of sand toad, Bufo arenarum, displayed conspicuous proliferations of the endoplasmic reticulum and Golgi complex as well as increasing numbers of mitochondria and colloid droplets (Miranda, Pisano, and Casco 1996).
The primary objective of the present study was to determine ultrastructural alterations in zebrafish thyrocytes after exposure to PTU and PER. Samples originated from our previous light microscopical studies on PTU and PER exposure of zebrafish (Schmidt and Braunbeck 2011; Schmidt et al. 2012). This allowed further comparisons between electron and light microscopy. To the best of our knowledge, this is the first study exploring ultrastructural alterations in thyroid follicles of fish after exposure to substances with known thyroid-active capacities. The results are expected to improve our understanding and facilitate the interpretation of existing histological data on alterations of the thyroid in zebrafish.
Material and Method
Chemicals
Unless stated otherwise, all chemicals were purchased from Sigma-Aldrich (Deisenhofen, Germany).
Experimental Context and Setup
The experiments in the present study have partly been described in our previous communications (Schmidt and Braunbeck 2011; Schmidt et al. 2012). Thus, the following comparison of histological and ultrastructural investigations refers to fish from the same experiments.
Animal Husbandry
Fertilized zebrafish (Danio rerio, Westaquarium strain) eggs were obtained from in-house breeding facilities of the Aquatic Ecology and Toxicology Group at the Centre for Organismal Studies, University of Heidelberg. All experiments were conducted in compliance with institutional guidelines for the care and use of animals and with permission by the regional animal welfare commission (AZ 35-9185.81/G-144/07). Fertilized eggs were initially raised in 20 cm Petri dishes in a KB 115 incubator (Binder, Tuttlingen, Germany) at a temperature of 27 ± 1°C and 12:12-hr light:dark cycle under exposure to the different test solutions. Three days after fertilization, embryos were transferred into 10 L flow-through tanks (triplicate water change per day, 27 ± 1°C, 12:12-hr light:dark cycle, oxygen saturation >80%). Flow-through conditions guaranteed ammonia, nitrite, and nitrate levels below detection limits (0–5, 0.025–1, and 0–140 mg/L, respectively). After hatching, larvae were fed twice daily with Sera Micron (Sera, Heinsberg, Germany) for 1 week. Afterward, larvae were fed freshly raised Artemia nauplii (Sanders, Mountain Green, UT) ad libitum. Excessive food and feces were regularly removed from the aquaria.
Exposure to Thyroid-active Chemicals
Exposures were carried out under flow-through conditions with daily triplicate water exchange over a period of 5 weeks. Sixty embryos were placed in each of the 2 replicate tanks per exposure concentration and per treatment substance (PTU: 0, 2.5, 10, 25, and 50 mg/L; PER: 0, 62.5, 125, 250, 500, and 5,000 µg/L). In total, 1,320 fish were used. Both substances are known to be stable over time, as shown in former experiments including an interlaboratory study on Xenopus laevis performed in the framework of the validation of the amphibian metamorphosis assay (OECD, 2004, 2007). For this reason, verification of nominal concentrations was not performed. Throughout the exposure, tanks were inspected daily for dead embryos, which were removed immediately. Mortality was below 10% in all tanks, and no significant differences among tanks could be observed. After 5 weeks, fish were euthanized in a saturated solution of 4-ethylaminobenzoate (benzocaine). Before further processing, weight and length of each fish were measured.
Ultrastructure
For ultrastructural studies, samples of the pharyngeal region from 10 arbitrarily chosen individuals of each tank were fixed in a solution of 2.5% glutardialdehyde in 0.1M sodium cacodylate buffer (pH = 7.4) at 4°C for a minimum of 24 hr and postfixed with 1% osmium ferrocyanide for 2 hr (Karnovsky 1971). After triplicate rinsing in 0.1M sodium cacodylate buffer (pH = 7.4), tissues were stained en bloc with 1% uranyl acetate in 0.05M maleic buffer (pH = 5.2) overnight at 4°C, dehydrated in a graded series of ethanol and embedded in Spurr’s (1969) medium. For localization of the thyroid area, semithin sections (≥5 µm) were prepared on a Reichert-Jung Ultracut microtome (Leica Microsystems, Nussloch, Germany) and stained with methylene blue/azur II (Richardson, Jarett, and Finke 1960). After verification, 60 nm ultrathin sections were counterstained with alkaline lead citrate (Reynolds 1963) and examined in an EM 10 transmission electron microscope (Carl Zeiss, Oberkochen, Germany).
Qualitative and Quantitative Morphometric Evaluation and Data Analysis
Ten fish of each treatment were examined in a blinded, randomized manner for ultrastructural alterations. Only follicles adjacent to the ventral aorta close to its most anterior branching were selected from semithin sections to account for heterogeneity of follicles in the zebrafish thyroid gland. For both qualitative and quantitative analyses, 3 follicles sectioned at the equatorial midline were selected. In each of these 3 follicles, 3 centrally sectioned thyrocytes were picked for further ultrastructural analyses.
For qualitative analyses, the following parameters were evaluated: (1) irregular outline of the nucleus; (2) the amount of nuclear heterochromatin; (3) lipofuscinogenesis in lysosomes; (4) colloid inclusions; (5) electron density of the colloid; (6) appearance of apical vesicles protruding into the colloid; (7) proliferations, fenestrations, and dilations of the rER; (8) increased endo- or exocytotic activity; (9) the appearance of microvilli; (10) necrotic thyrocyte;, and (11) alterations in cell shape.
For quantification of the major alterations after exposure to PTU and PER, 5 parameters were measured: (1) total number of mitochondria, (2) number of mitochondria with distorted cristae, (3) diameters of the mitochondria, (4) total number of lysosomes, and (5) height of the apical part of the cell. The latter was chosen as sensitive parameter for the proliferation of cell organelles, which are mostly located in the apical part of thyrocytes. The diameters of mitochondria were calculated as the longest distance in ovoid and elongated mitochondria. Apical cell height was defined as the direct distance from the apical border of the nucleus to the apical cell membrane. All measurements were performed using the free software tool ImageJ (version 1.44; National Institutes of Health, Bethesda, MD).
For statistical analyses of quantitative measurements, lysosome count data were normally distributed for both PTU and PER exposures and analyzed, following significant analysis of variance results, using pairwise t-test comparisons with Holm’s p value adjustment. All other data sets were not normally distributed and analyzed, following significant Kruskal–Wallis rank sum tests, using pairwise Wilcoxon rank sum tests with Holm’s p value adjustment. All statistical analyses were performed using open-source statistical software R (version 3.2.4; R Core Team 2016). Differences were considered significant at *p < .05, highly significant at **p < .01, and highest significant at ***p < .001.
Results
Controls
Thyrocytes of control zebrafish in both treatment groups were morphologically comparable to each other (Table 1; Figure 1). The epithelium enclosed a homogeneously stained colloid without any inclusions (Figure 1A) and the flat to cuboidal thyrocytes displayed a basally located nucleus with evenly dense chromatin and regularly shaped nucleoli (Figure 1B). Overall, the number of organelles was small; most organelles were located in the apical part of the cells with an average height of approximately 1 µm (Figure 1C; Online Supplementary Table 1). At the border to the follicle lumen, few short microvilli were present (Figure 1C). Under higher magnification, most mitochondria appeared in spherical shapes with occasional ovoid and elongated shapes. The average diameter of mitochondria was approximately 500 nm (Figure 1E, D; Online Supplementary Table 1). In both experimental groups, cross sections of exposure control thyrocytes contained approximately 2 mitochondria, with occasionally distorted cristae (Online Supplementary Table 1). The endoplasmic reticulum comprised slightly branched cisternae, and Golgi fields were regularly present (Figure 1D, E). In addition to Golgi vesicles, electron-dense vesicles (most probably lysosomes) were visible in the apical part of the cells (Figure 1B, D, E). An average of approximately 18 lysosomes could be detected (Online Supplementary Table 1).
Semiquantitative Results of Ultrastructural Changes in ZebraFish (Danio rerio) Thyroid Organelles after Exposure to PTU and PER.
Note: n = 10 per treatment. + = little developed; ++ = moderately developed; +++ = markedly developed; ES = evenly stained; C = cloudy; SL = slightly lighter; L = lighter; VL = very light; PTU = propylthiouracil; PER = perchlorate.
Ultrastructure of thyroidal tissue in control zebrafish (Danio rerio). The epithelium encloses an evenly stained colloid devoid of inclusions (A). The nucleus is basally located and most organelles can be found in apical position (B, E). Mitochondria appear spherically to ovally shaped; the rough endoplasmic reticulum and Golgi fields (*) are of cistern-like appearance (D, E). At the apical pole of thyrocytes, few electron-dense lysosomes are detectable (▸), and at the border to the colloid, some microvilli are detectable (B, C, D, E). Magnifications: A: 2,000×; B: 10,000×; C: 12,500×; D: 40,000×; E: 31,500×.
PTU Exposure
Both weight and length of zebrafish showed a biphasic response pattern to PTU exposure. A significant decrease in body length was observed in fish exposed to 50 mg/L, whereas a slight increase in weight was observed at 2.5 mg/L (Schmidt and Braunbeck 2011).
At the ultrastructural level, thyrocytes displayed numerous dose-dependent effects (Tables 1 and 2; Figure 2A, B; Online Supplementary Table 1). Apical cell height increased with significant alterations in concentrations ≥10 mg/L (Table 2, Figure 2A, B; Online Supplementary Table 1). At 50 mg/L, condensed thyrocytes with electron-dense cytoplasm and shrunken nuclei were visible (Figure 3A), which could be regarded as a first sign of cell degeneration. The nuclei appeared irregular (Figure 3A, B), and the amount of heterochromatin was increased at 50 mg/L. Alterations of the rER included massive proliferation, fenestration, and dilation (Figures 3A and 4A). This was evident in all exposure groups and markedly increased in exposure groups ≥25 mg/L (Figure 3A, B). Mitochondria showed proliferations with significant increase in exposure groups ≥25 mg/L (Table 2). Furthermore, the diameter of mitochondria was significantly increased in all exposure groups; however, this effect did not seem to be dose-dependent (Figure 4A, B; Online Supplementary Tables 1 and 2). The mitochondria were characterized by extremely distorted cristae, associated with a strong inflation of the intercristae space with significant increases in exposure groups ≥25 mg/L, where the majority of mitochondria were affected (Table 2; Figures 2B and 4A, B).
Comparative Statistical Analyses of Quantitative Morphometric Data of Thyroid Cells in PTU- and PER-exposed ZebraFish.
Note: n = 10 per treatment. Lysosome count data were analyzed using pairwise t-test comparisons. All other data sets were analyzed using pairwise Wilcoxon rank sum test comparisons (both with Holm’s p value adjustment method). For ruptured mitochondria proportion data of PTU-exposed zebrafish, the latter test was applied without pooling of standard deviations. Details of additional statistical parameters are given in Online Supplementary Table 2. p values are given against the respective control groups. PTU = propylthiouracil; PER = perchlorate. *p < .05.; **p < .01; ***p < .001.
Selected results of quantitative morphometric analyses of thyroid cells in propylthiouracil (PTU)- and perchlorate (PER)-exposed zebrafish. For PTU exposure, a dose-dependent increase in apical cell height (A) and fraction of ruptured mitochondria (B) could be observed. In PER exposures, a monotonous increase in lysosome numbers was determined (C). Full statistical results are given in Table 2 and Online Supplementary Table 2. Ctrl: control; SEM: standard error; *p < .05; **p < .01; ***p < .001.
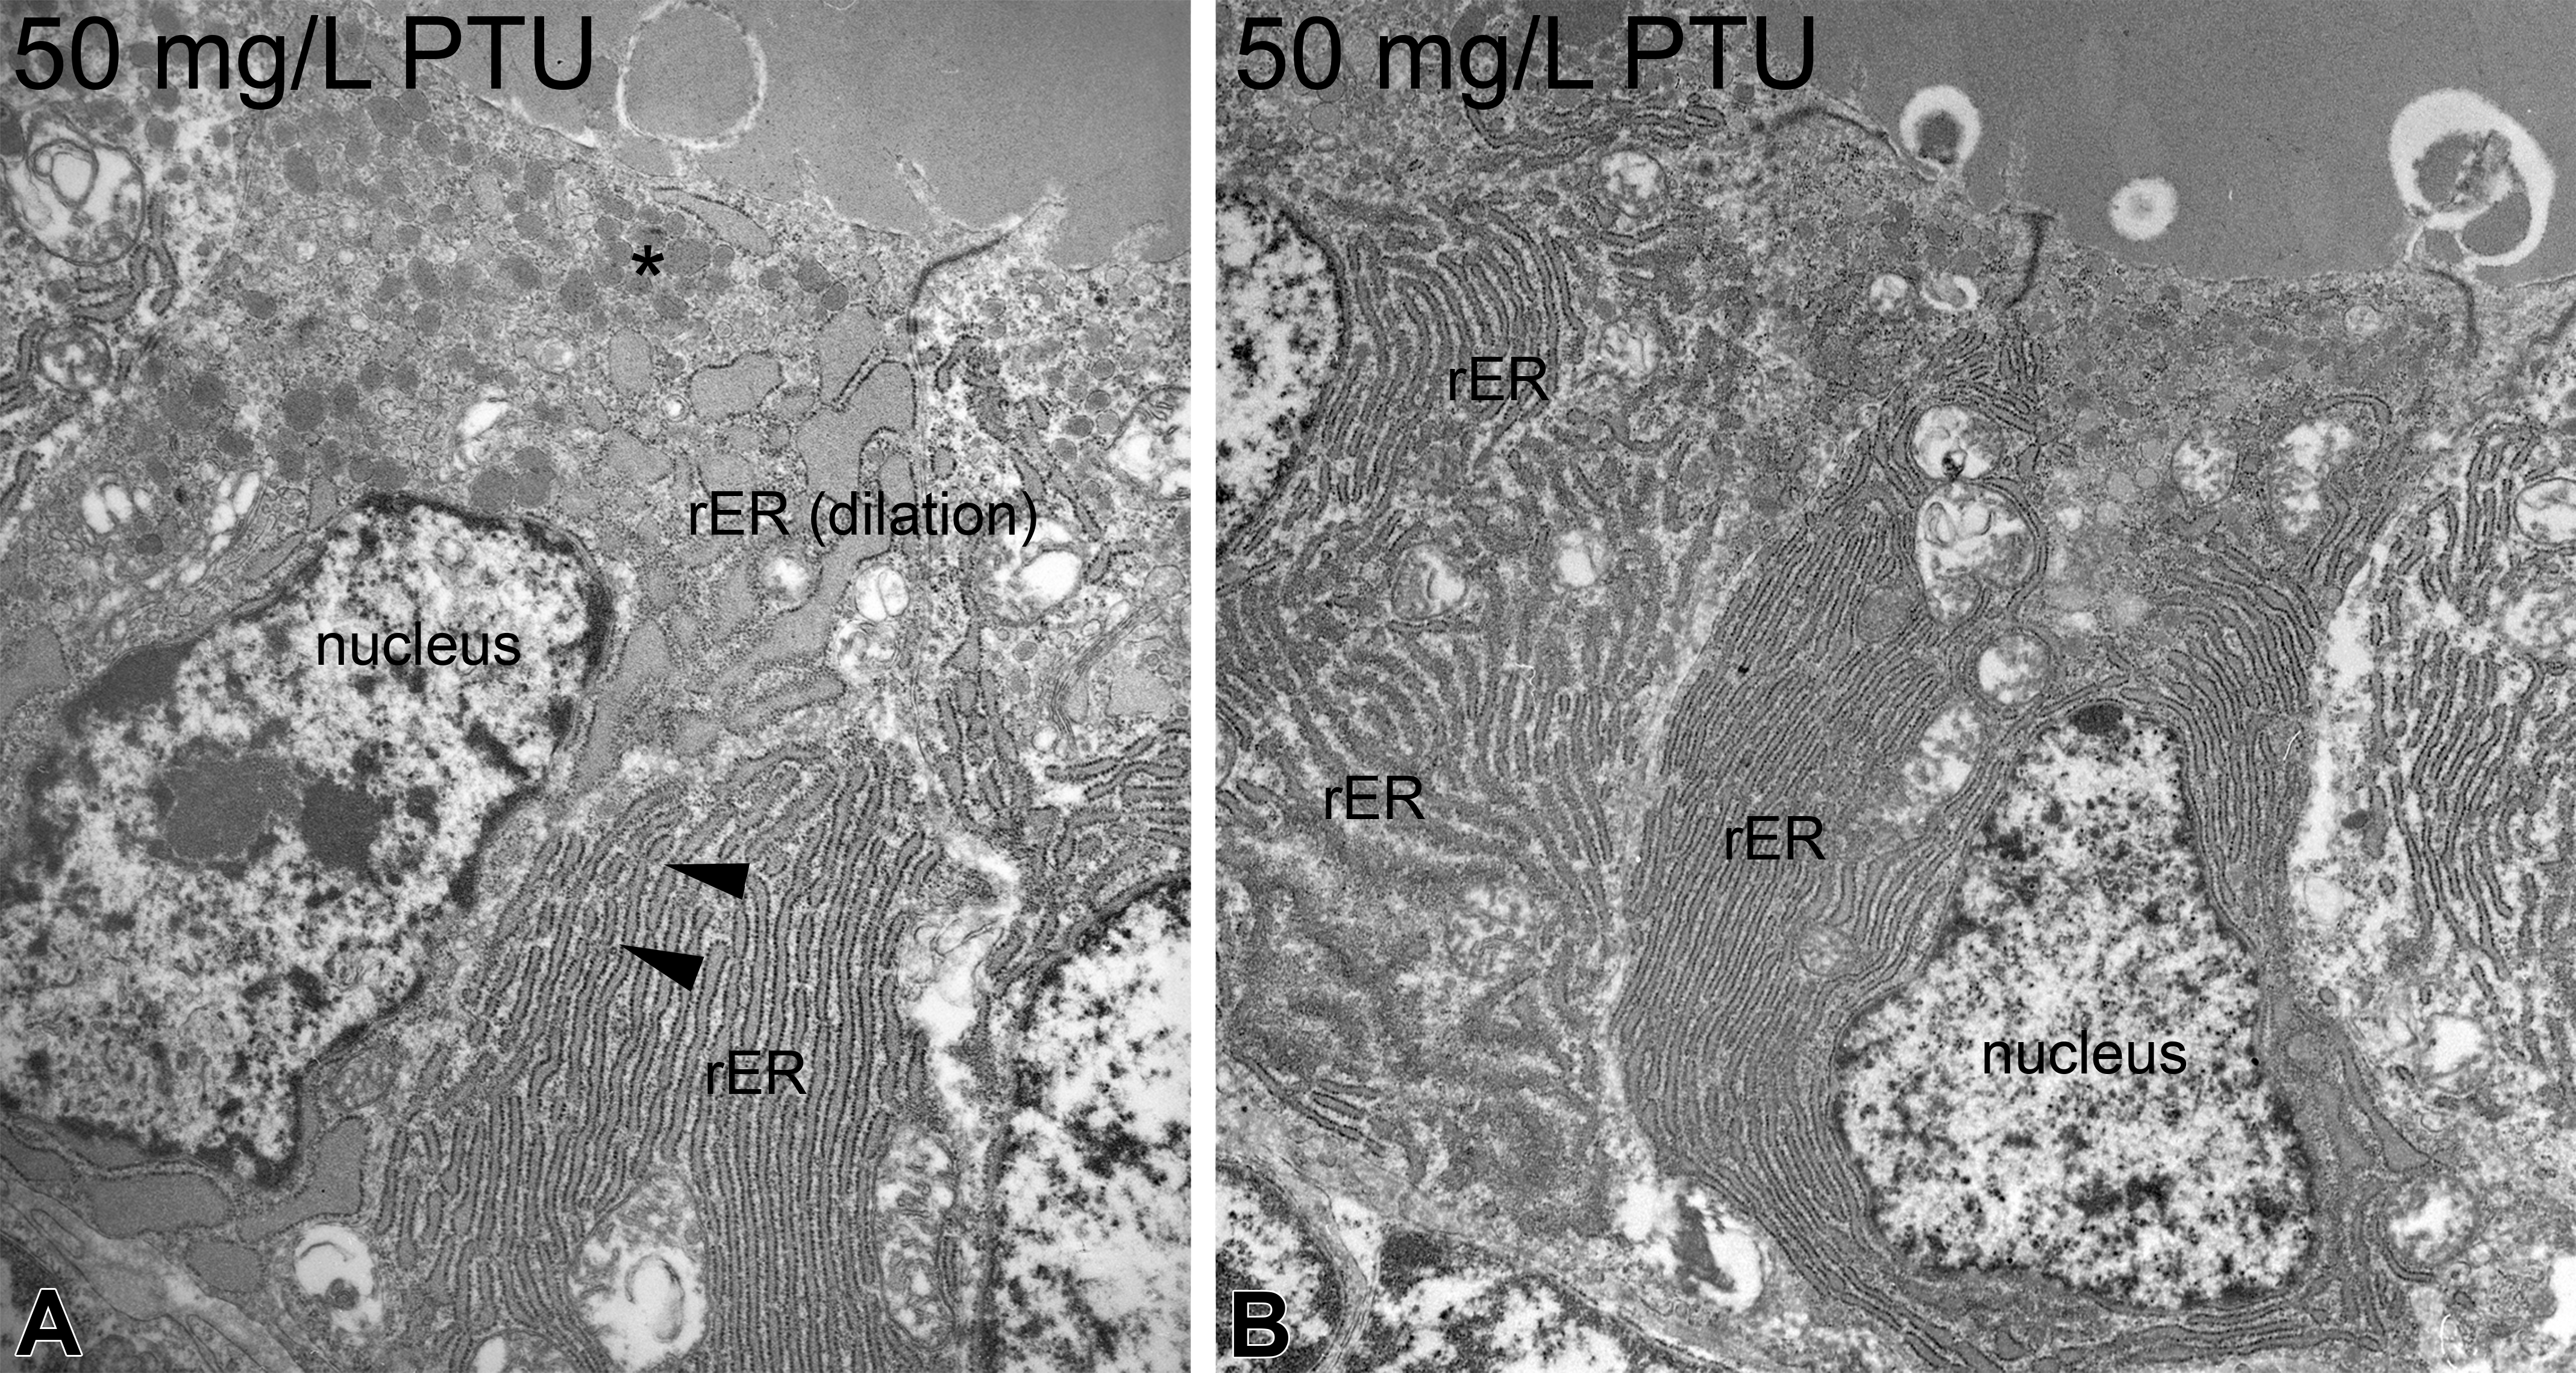
Ultrastructure of propylthiouracil-exposed zebrafish thyroids. At 50 mg/L, an electron-dense cytoplasm and shrunken nuclei present first symptoms of degeneration (A). Increased amounts of heterochromatin are visible (A, B). Marked proliferation, dilation, and fenestration in the rough endoplasmic reticulum (▸) are further alterations (A). The apical regions display proliferations of lysosomes (*; A). Magnifications: A: 10,000×; B: 4,000×.
Mitochondrial alterations in zebrafish exposed to propylthiouracil. Already at 2.5 mg/L, mitochondria showed irregular swelling of the intercristae space (C). Higher exposure groups displayed proliferations and extensive swellings (*; A, B). Furthermore, dilation of the rough endoplasmic reticulum is visible (A). Magnifications: A: 10,000×; B and C: 40,000×.
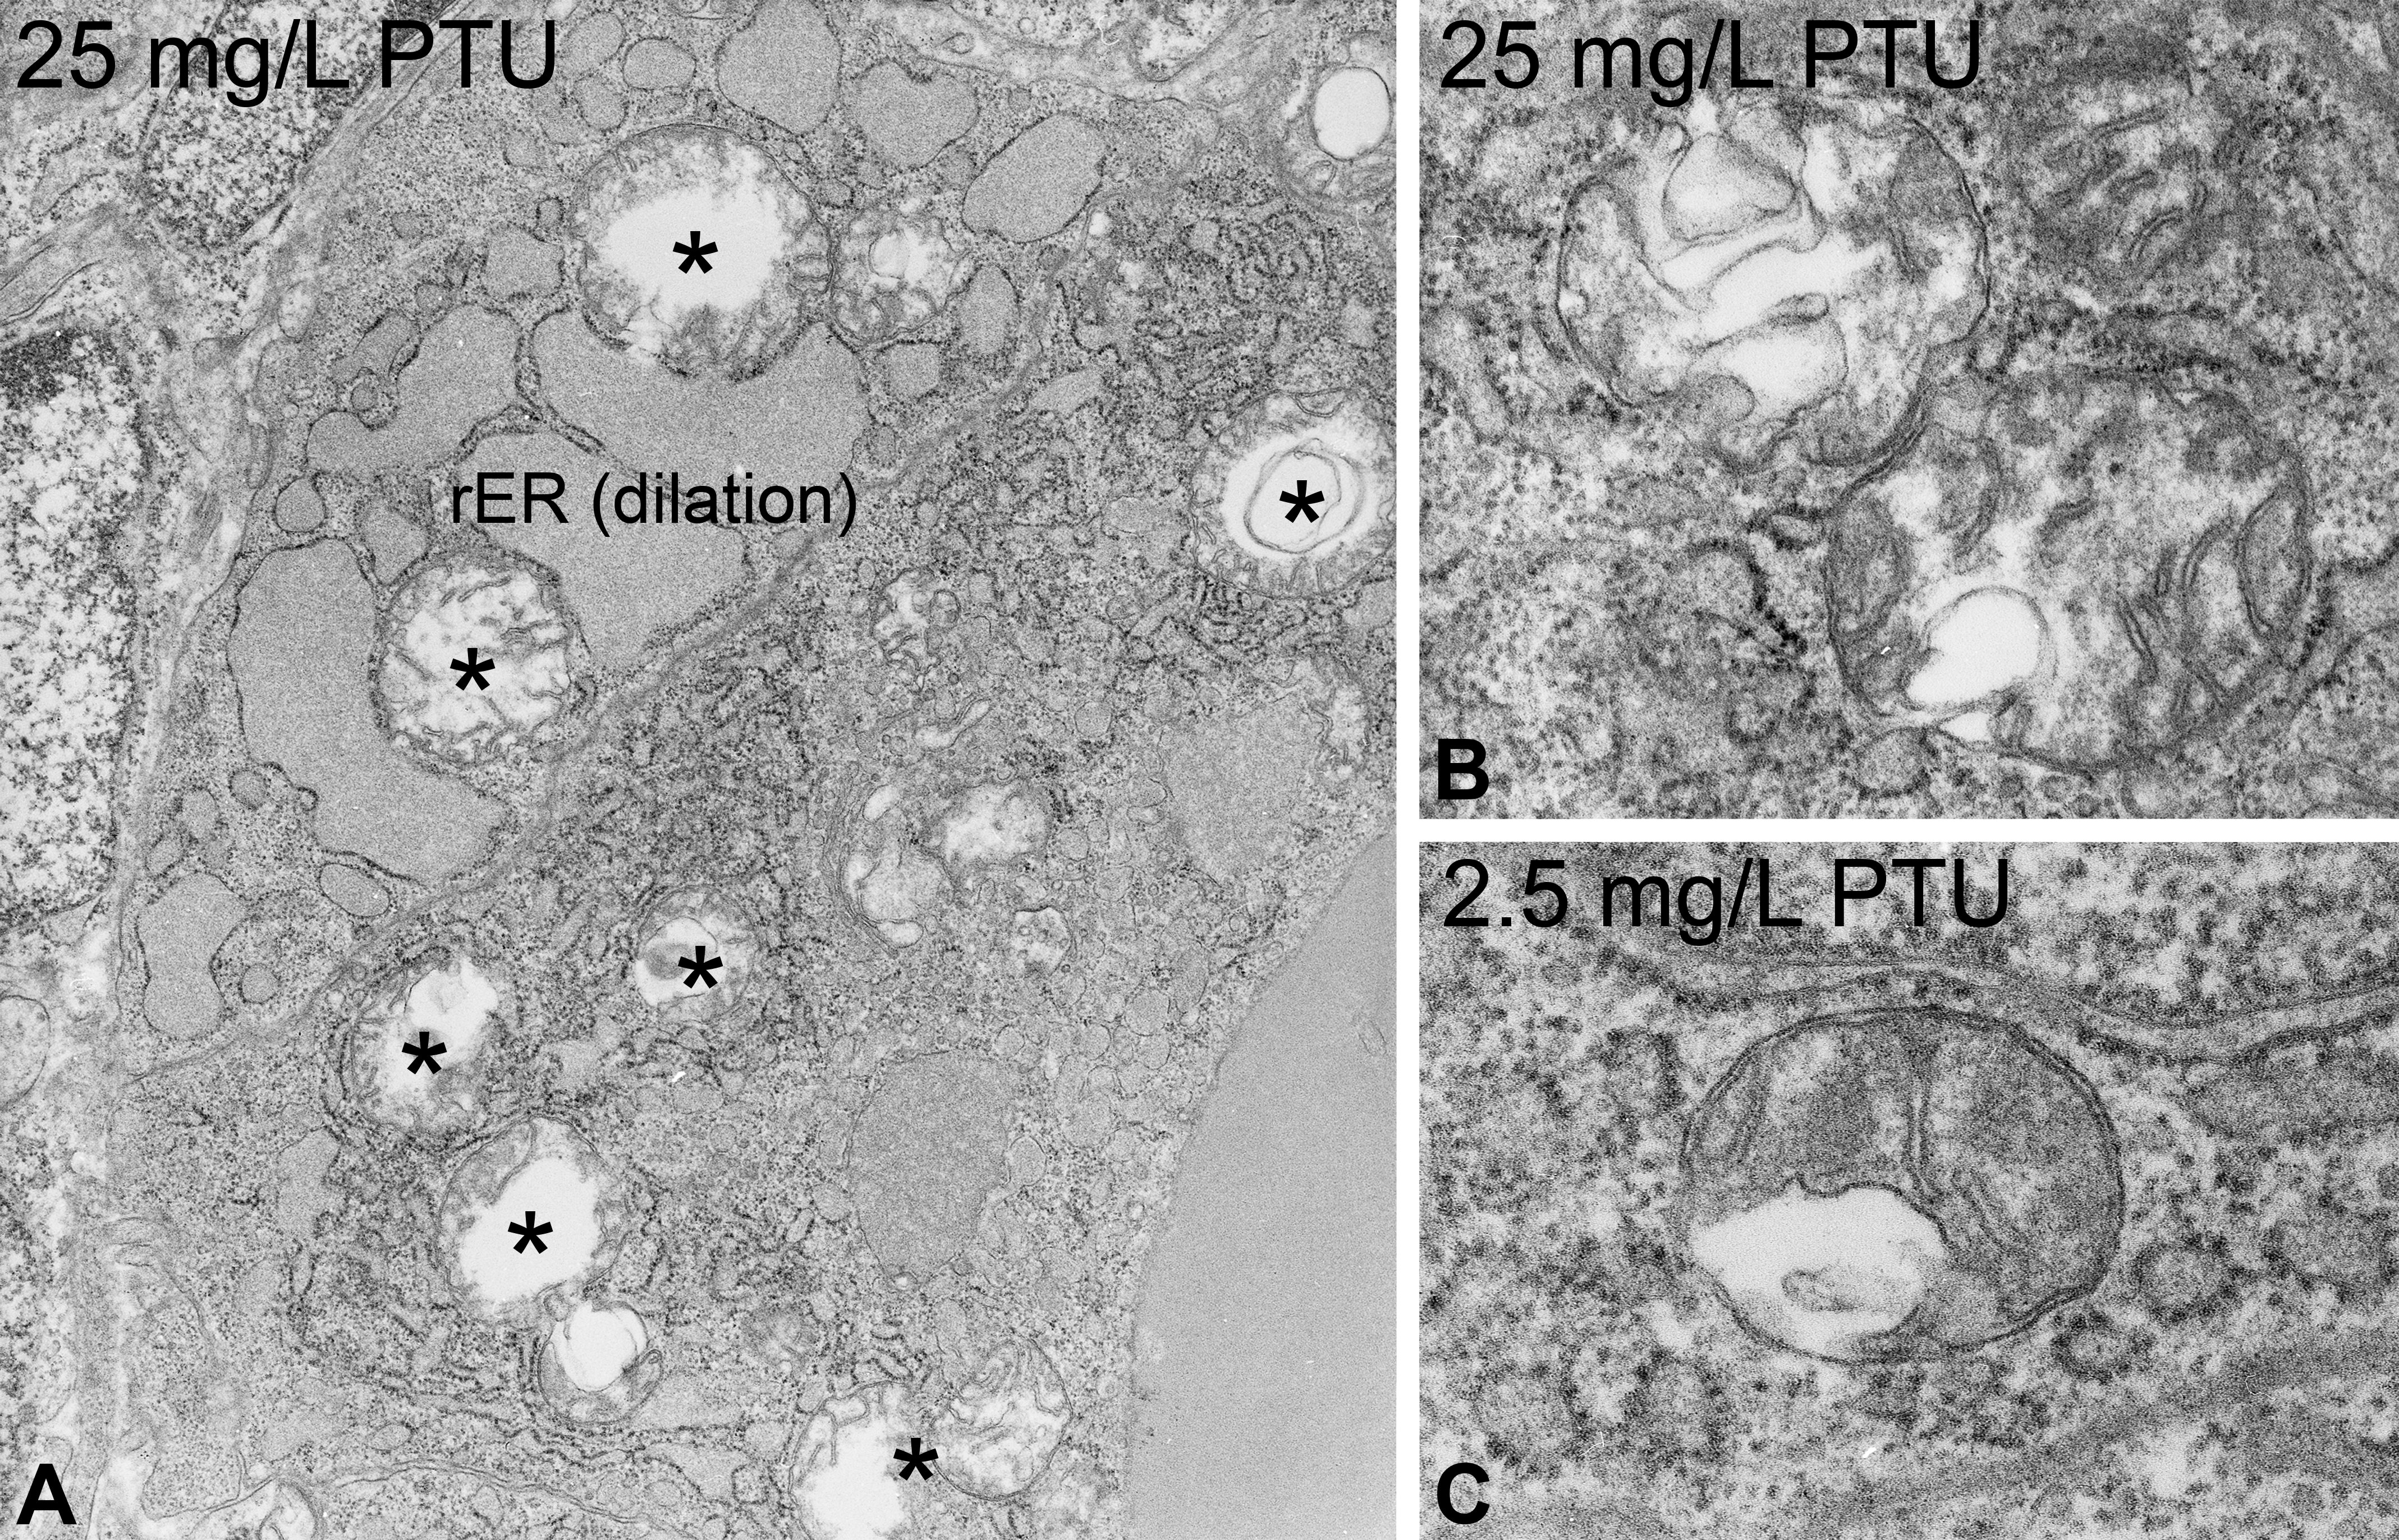
In apical cell regions, moderate proliferations of electron-dense bodies (most probably lysosomes) could be detected (Figure 3A; Table 1). These proliferations did not reveal a clear dose-dependency; however, the highest exposure group (50 mg/L) showed a significant increase. In exposure groups ≥10 mg/L, the colloid was interspersed with cytoplasmic inclusions (Figure 5A). The electron density of the colloid remained intermediate, but cloudy tinctorial properties were visible in the highest exposure group (50 mg/L). In exposure groups ≥2.5 mg/L, protrusions of apical vesicles into the follicular lumen were observed, most prominently at 50 mg/L (Figure 5B). Together with the occurrence of apical vesicles, endo- or exocytosis was detected in exposure groups ≥10 mg/L (Figure 5B, C). Furthermore, the apical part of thyrocytes displayed short microvilli, which moderately increased with PTU concentrations (Figure 5B). Only at 10 mg/L, microvilli appeared slightly elongated.
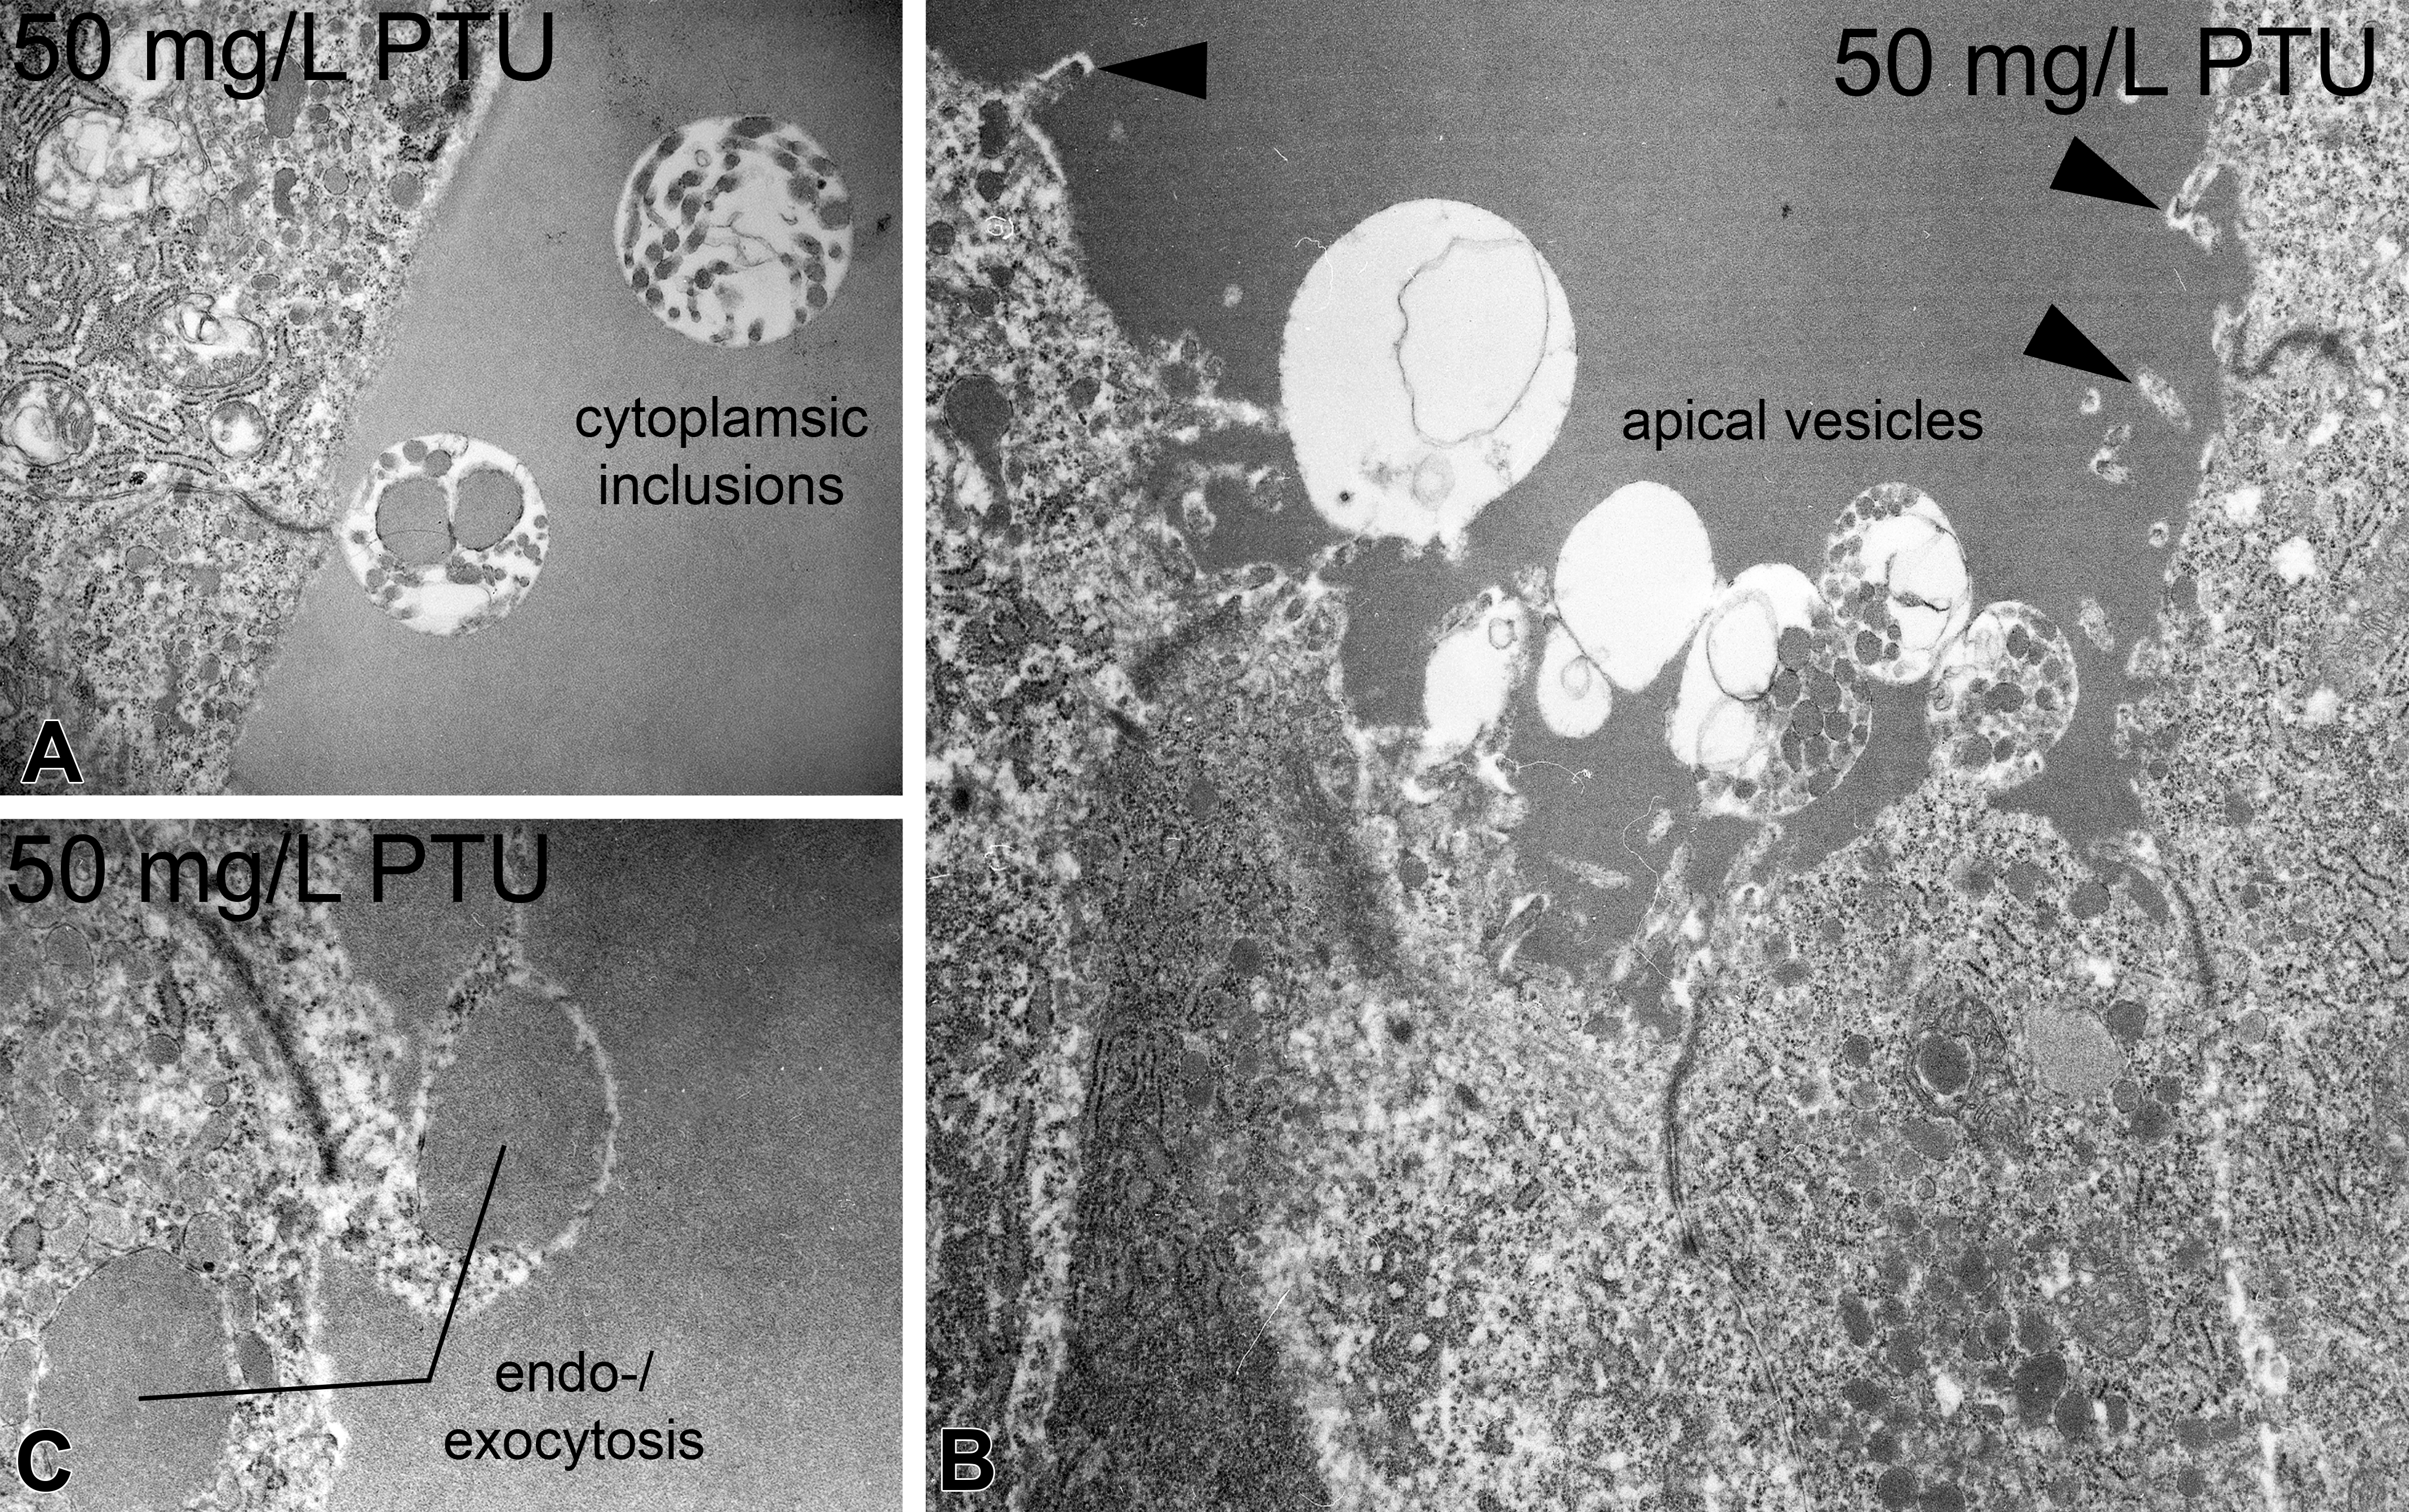
Apical alterations in zebrafish thyrocytes caused by propylthiouracil exposure. At concentrations ≥10 mg/L, cytoplasmic inclusions were evident (A). At concentrations ≥2.5 mg/L, numerous apical vesicles were seen protruding into the follicular lumen (B). Bleb-like structures indicate endo- or exocytotic processes at concentrations ≥10 mg/L (B, C). Moderate proliferation of microvilli can be observed at concentrations ≥10 mg/L (▸; B). Magnifications: A: 12,500×; B: 8,000×; C: 20,000×.
PER Exposure
The weight of fish did not show any significant changes. Only in exposure groups ≥500 µg/L, a slight decrease in weight was observed, which was statistically not significant. The length of fish was significantly increased at 125 µg/L, whereas other exposure groups were not affected. However, the condition factor (100 × weight/length3) decreased throughout exposure groups with significant alterations in exposure groups ≥125 µg/L (Schmidt et al. 2012).
Regarding ultrastructure, exposure to PER led to numerous, partially dose-dependent effects (Tables 1 and 2). Epithelial cell height monotonously increased to columnar in the highest exposure group. Measurements of the apical cell height revealed slight increases in exposure groups ≥62.5 µg/L, with the highest exposure group (5,000 µg/L) showing a significant increase (Online Supplementary Table 1). The nuclei showed structural changes in exposure groups ≥125 µg/L, with an irregular outline and little increases in heterochromatin. These effects increased monotonously (Figure 6B) but were less evident at the highest exposure group (5,000 µg/L). The rER was only affected in exposure groups ≥500 µg/L, showing moderate proliferations and fenestrations (Figure 7D). Additionally, slight dilations of the rER were observable in exposure groups of 250 and 5,000 µg/L. In exposure groups ≥62.5 µg/L, approximately 50% of the mitochondria showed distorted cristae (Figure 7A; Online Supplementary Table 1). This effect was significant in exposure groups ≥250 µg/L. Moreover, the total number of mitochondria monotonously increased with significant differences in exposure groups ≥250 µg/L (Online Supplementary Tables 1 and 2). In contrast to thyrocytes of PTU-exposed zebrafish, the diameter of mitochondria was not affected by PER exposure. Electron-dense bodies, most likely lysosomes, showed a monotonous increase with significant differences in exposure groups ≥125 µg/L (Figures 2C and 7B, C, D). Above 62.5 µg/L, the number of lysosomes with lipofuscin agglomerations was increased (Figure 6A). This effect did not seem to be dose-dependent and was absent in the controls. In exposure groups ≥125 µg/L, large vesicles appeared in apical locations. At 125 µg/L, these vesicles showed rod-like shapes, and at 250 µg/L, some fiber-like inclusions were present. Exposure groups ≥62.5 µg/L showed a monotonous increase in the number and length of apically located microvilli (Figure 7B, C). Exposure ≥500 µg/L PER induced small amounts of colloid inclusions. The electron density of the colloid dose-dependently decreased in exposure groups ≥62.5 µg/L (Figure 7C). Apical vesicles were not present.
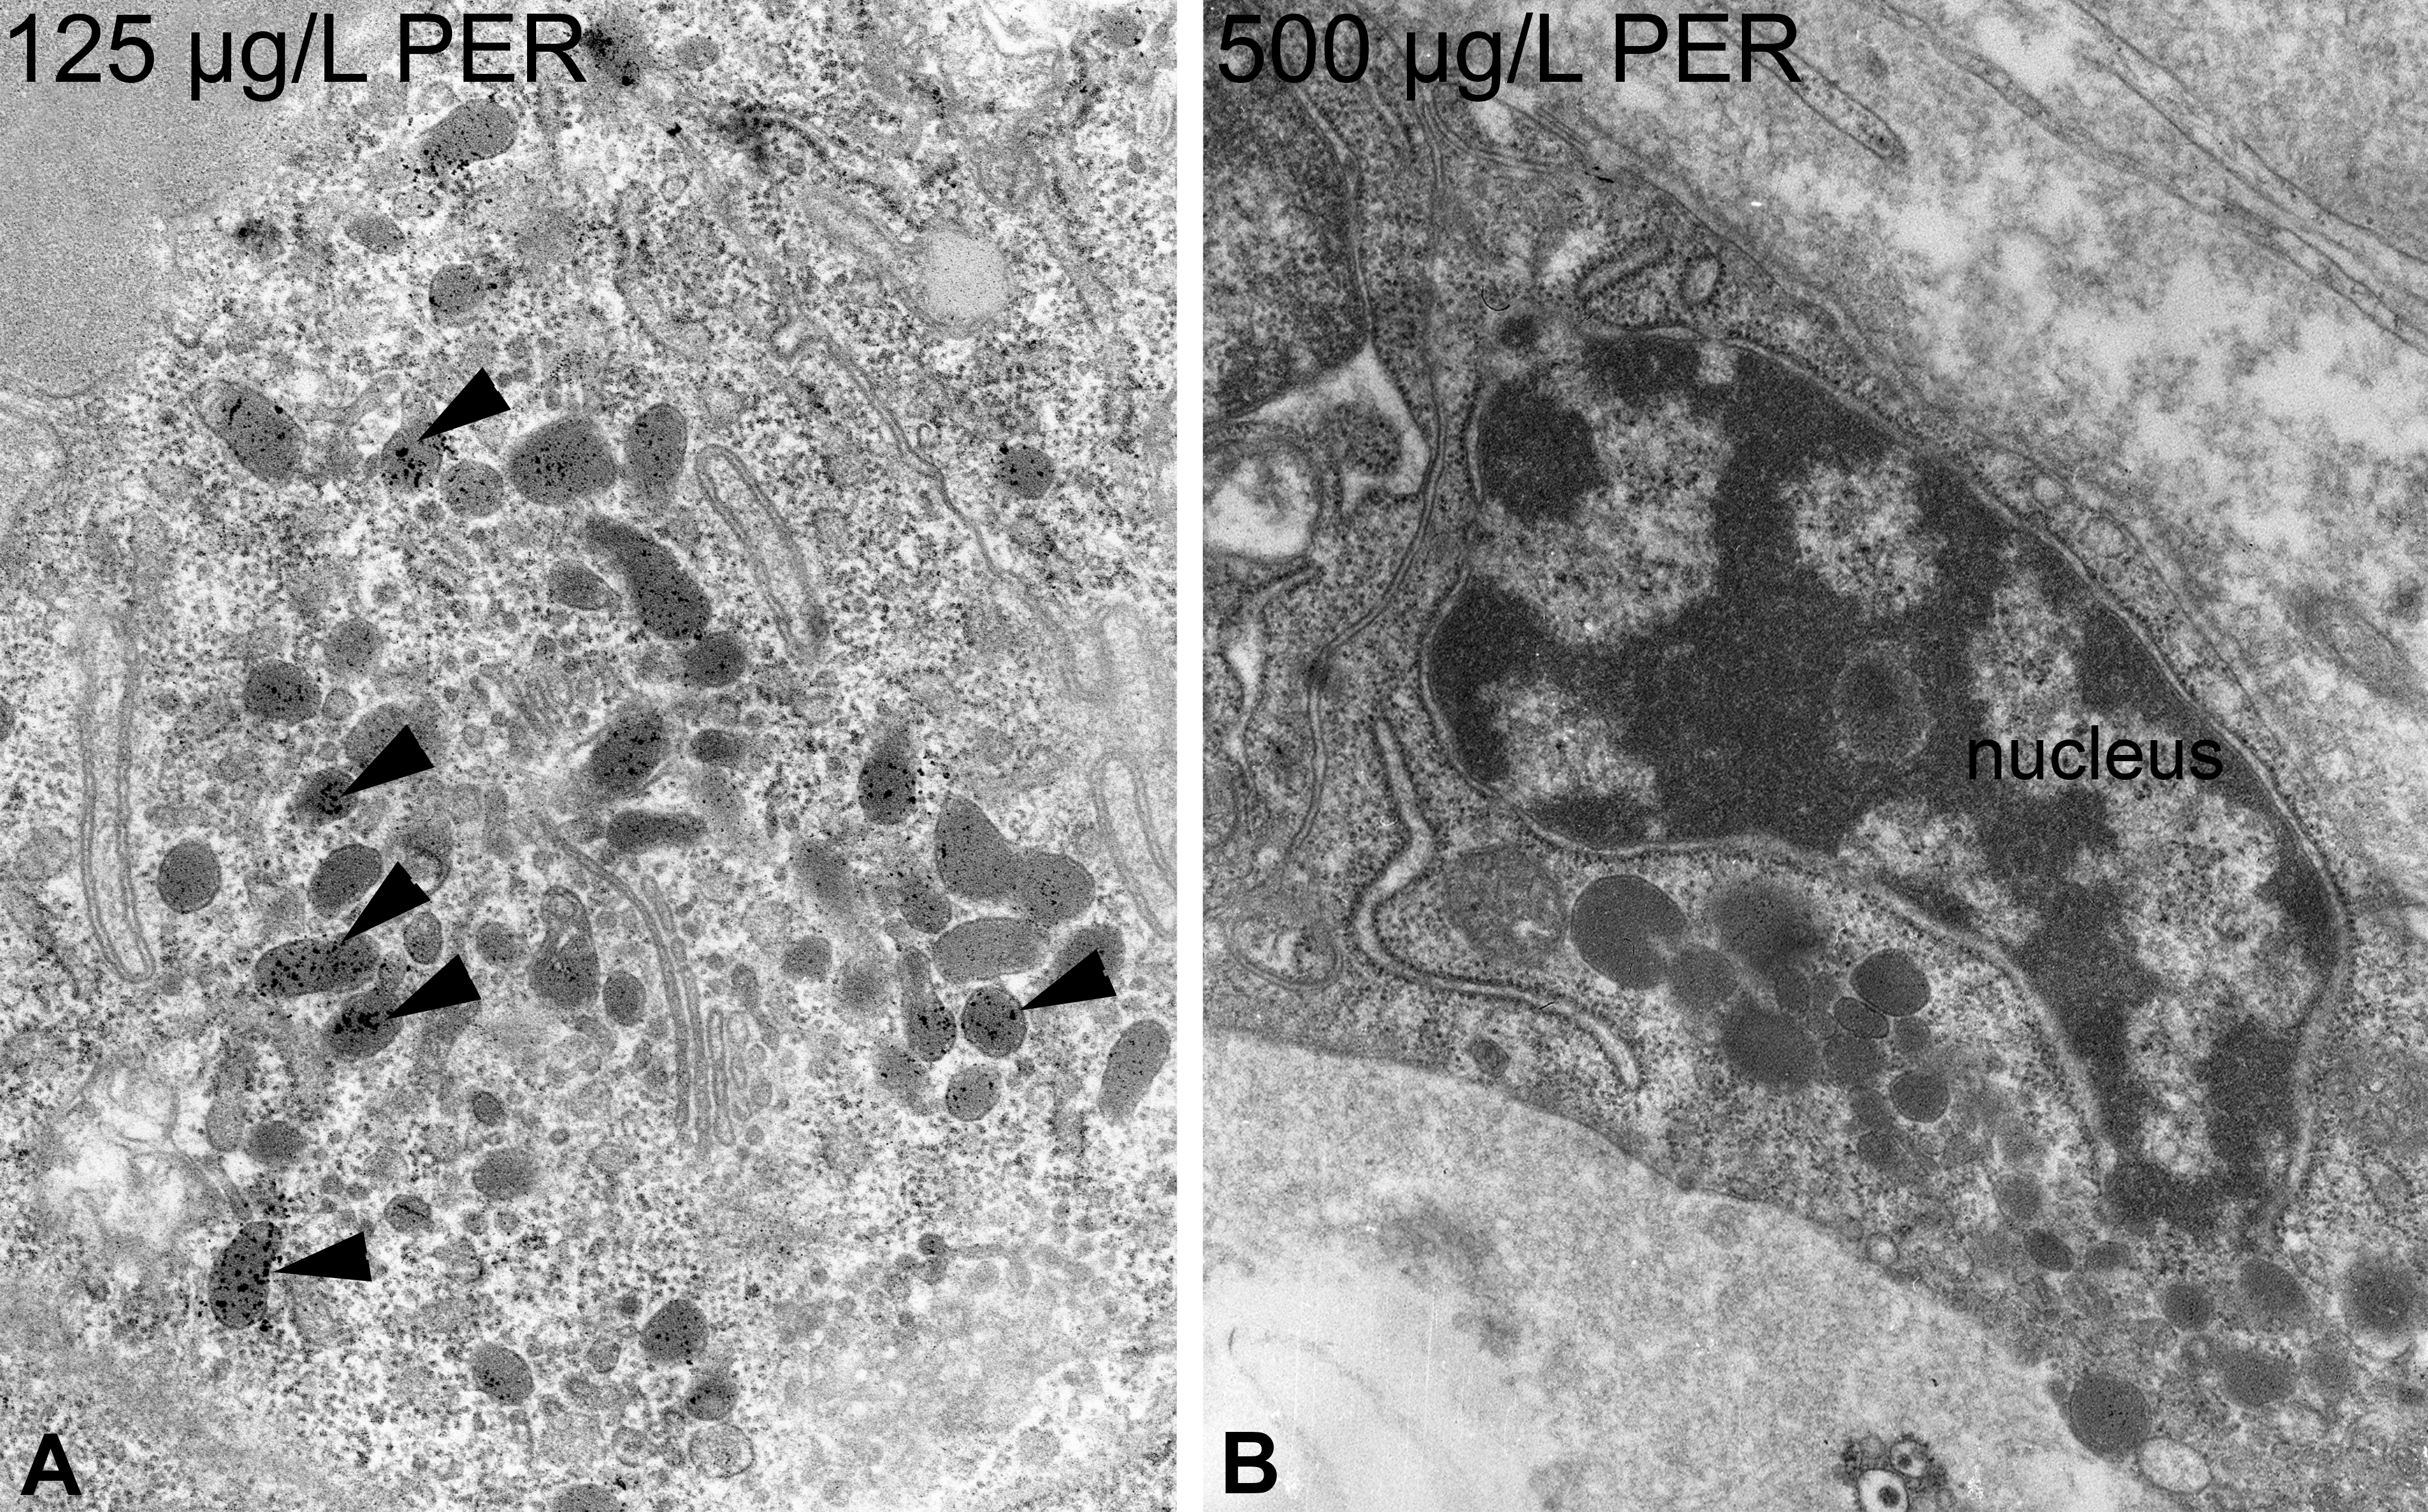
Further alterations of perchlorate-exposed zebrafish thyrocytes comprise a moderate increase in lipofuscin within lysosomes (▸; A). Moreover, the nucleus showed increased amounts of heterochromatin and an irregular outline, especially at 125 and 500 µg/L (B). Magnification: A: 20,000×; B: 12,500×.
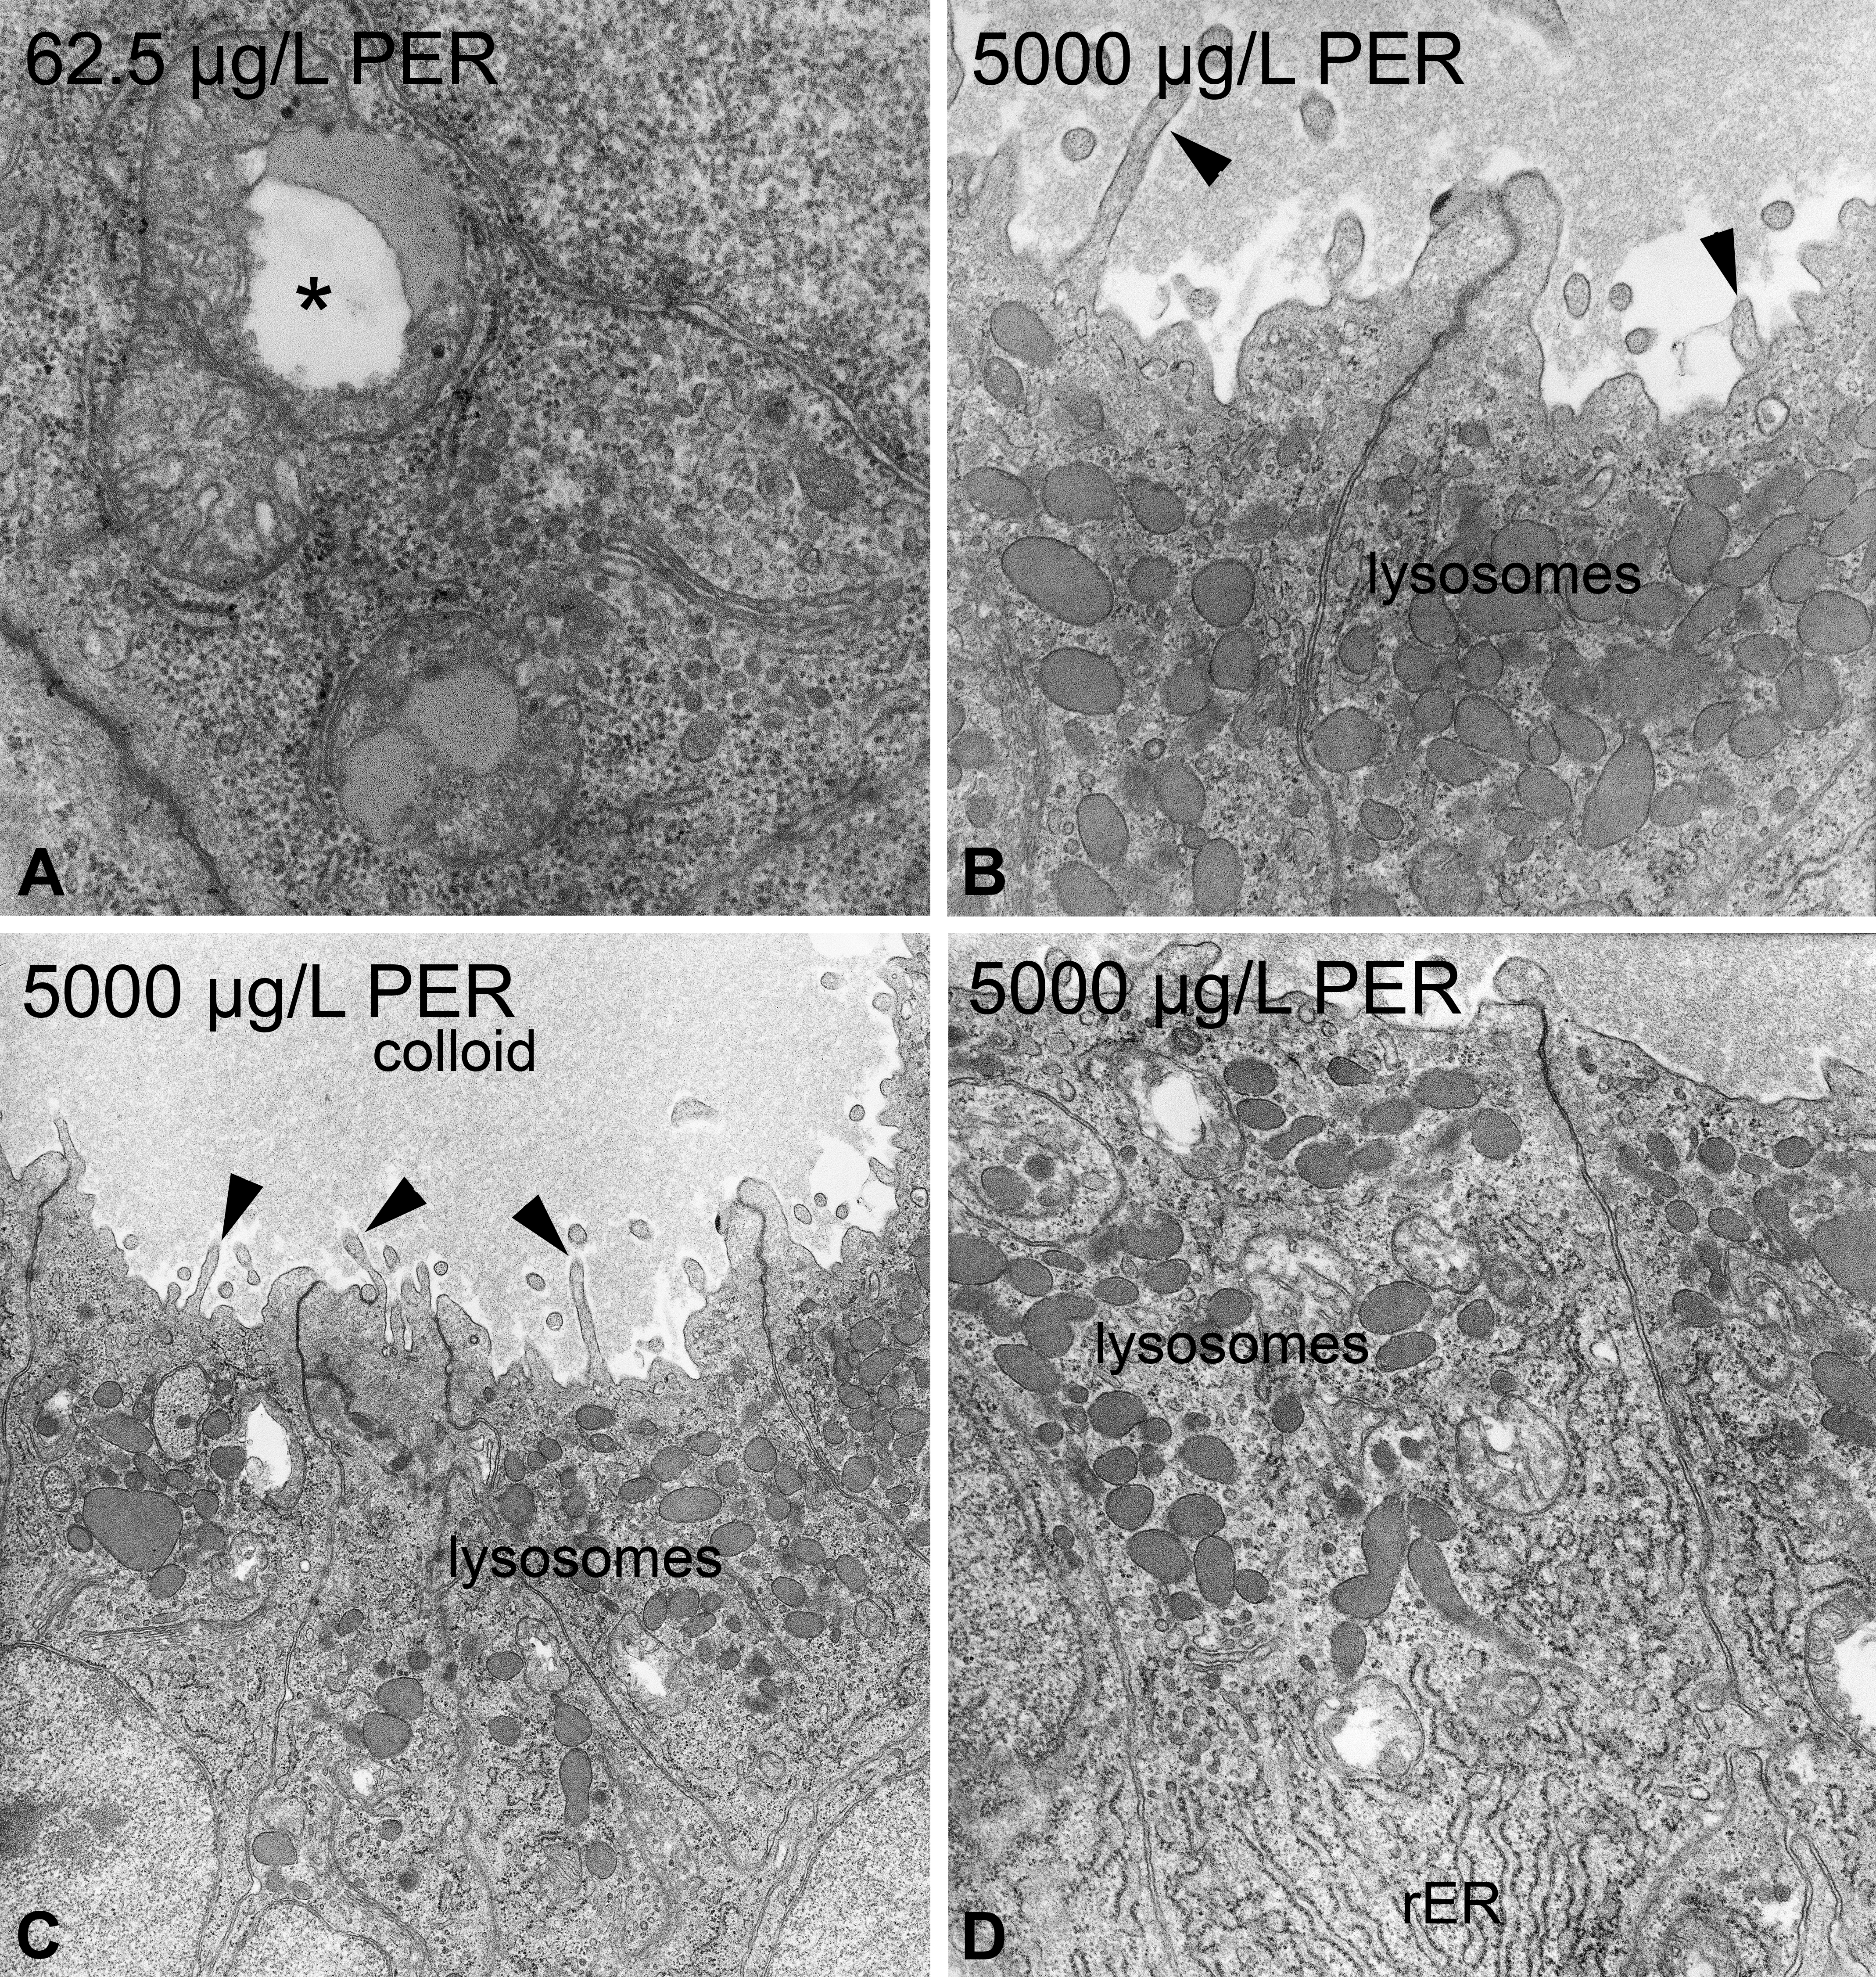
Perchlorate-induced ultrastructural alterations in zebrafish thyrocytes. At concentrations ≥62.5 µg/L, mitochondria are swollen and display irregular swellings of the intercristae space (*; A). At concentrations of 5,000 µg/L, a marked increase in lysosomes mostly located in the apical part of thyrocytes was visible (B, C, D). The rough endoplasmic reticulum showed moderate proliferation and some fenestration (D). The electron density of the colloid markedly decreased in higher concentration groups (C). Proliferations of microvilli are observable in concentrations ≥62.5 µg/L (▸; B, C). Magnification: A: 31,500×; B: 20,000×; C: 10,000×; D: 16,000×.
Discussion
The aim of our study was to investigate ultrastructural changes in zebrafish thyrocytes after exposure to PTU and PER. Light microscopical alterations of thyroid follicles after exposure to both substances have already been addressed in our previous communications (Schmidt and Braunbeck 2011; Schmidt et al. 2012), and will be further commented on below, based on the findings described in this study.
Our two previous communications indicated that both substances lead to an overall activation of the thyroid gland. This was likely due to enhanced stimulation by the thyroid signaling hormone (TSH), as a feedback to lowered levels of thyroxin (T4; Schmidt and Braunbeck 2011; Schmidt et al. 2012). Despite similar stimulation, distinct differences were detected at the light microscopical level. More specifically, PTU exposure induced hyperemia, proliferations in epithelial cell height, and stratification, while PER exposure resulted in severe colloid depletion and proliferation of average-sized follicles (Schmidt and Braunbeck 2011; Schmidt et al. 2012). Besides stimulation by TSH, it may be expected that the molecular modes of action of the substances play an important role. A recent study showed that exposure of zebrafish larvae to comparable levels of PTU (see previous communication: Schmidt and Braunbeck 2011) resulted in upregulated messenger RNA expression of thyroperoxidase, TSH, and deiodinase 2 (dio2), while thyroid receptors α and β and deiodinase 3 (dio3) were downregulated (Baumann et al. 2016). Exposure to PER leads to upregulation of dio2 and NIS and downregulation of dio1 and dio3 genes in rare minnow Gobiocypris rarus (W. Li et al. 2011), which underlines the different modes of action of the 2 substances.
Our results document that both PTU and PER exposures lead to clear ultrastructural alterations, however, with distinct qualitative discrepancies. The effects were observed in both treatment groups; that is, increased numbers of electron-dense bodies, microvilli, apically located luminal vesicles, and significant exo- and endocytotic activity are well-defined indicators of colloid reabsorption and thyroidal activation, likely due to increased TSH levels (French and Hodges 1977; Fujita 1975; Henderson and Gorbman 1971; Olen 1969). The electron-dense bodies observed were also reported in other studies (Fujita and Machino 1965; Henderson and Gorbman 1971; Leatherland, Moccia, and Sonstegard 1978; Leatherland and Sonstegard 1980) but are still not fully characterized. Usually, smaller electron-dense droplets located in the apical or subapical regions are regarded as lysosomes, especially with the appearance of lipofuscin. Larger droplets are regarded as colloid reabsorption from the follicle lumen. Occurrences of fiber-like inclusions in some droplets of PER-exposed fish have also been described for Japanese amberjack Seriola quinqueradiata, where they are believed to be associated with old or altered droplets (Fujita and Machino 1965).
Lysosomal architecture and microvilli appearance differed between fish of the 2 treatment groups; PER exposure caused stronger lysosomal alterations than PTU exposure. The number of follicles with electron-lucent colloid (i.e., colloid depletion) was elevated after PER exposure. The occurrence of lysosomes is important for the digestion of reabsorbed colloid, and TSH leads to increased colloid reabsorption by endocytosis (Eales and Brown 1993). Studies from Scranton and Halm (1965) and Surks (1967) revealed that PER exposure leads to iodide efflux from thyroid glands in rats. In mice, PER exposure rapidly increased the secretory response of the thyroid to TSH, including both iodide and iodothyronines (Rousset, Orgiazzi, and Mornex 1977). We conclude that the elevated number of lysosomes detected in PER-exposed thyrocytes is likely due to an interplay of 3 processes: (1) the ongoing stimulation by TSH, (2) the increasing secretory response to TSH, and (3) the efflux of iodide and iodothyronines. Hence, the increase in lysosomes could lead to decreased levels of colloid in the follicular lumen, a phenomenon we reported in our previous communication (Schmidt et al. 2012).
In contrast to PER, PTU exposure did not increase the number of lysosomes. The abovementioned increase in TSH-producing cells, which was detected in PTU-exposed zebrafish (Schmidt and Braunbeck 2011), could be responsible for this. A comparable depletion of colloid storage deposits could not be detected, only alterations in tinctorial properties. Studies by Anderberg et al. (1981, 1980) on human thyroids revealed that the colloid is composed of 19S thyroglobulin, larger iodoproteins, and smaller protein fractions (an albumin-like protein and a prealbumin fraction). In these studies, exposure to carbimazole (which, together with PTU and methimazole, belongs to the group of thioamides) leads to a decrease in larger thyroglobulin aggregates most likely due to an insufficient capacity to iodinate thyroglobulin. This could provide an explanation for the different tinctorial properties of the colloid observed in our light and electron microscopical studies.
Interestingly, the staining properties of the colloid coincide with the appearance of apical microvilli. The latter showed proliferation and elongation, especially under PER exposure. This proliferation supports colloid depletion due to surface multiplication. Additionally, PER exposure groups ≥250 µg/L revealed enhanced endo- or exocytotic activity, which could also be found in PTU exposure groups ≥2.5 mg/L. The temporal responses to TSH seemed to be dependent on the mode of action of the test substance, since PTU induces endo- and exocytotic activity prior to microvilli elongation, whereas in PER-exposed samples, microvilli elongation occurred first.
In addition to the mere increase in lysosomes, PER exposure led to pronounced lipofuscin agglomerations within lysosomes. Lipofuscin is known as “age pigment,” progressively accumulating within lysosomes in long-lived postmitotic cells (Brizzee et al. 1969; Donato and Sohal 1981; Strehler 1964a, 1964b). In zebrafish, thyroid cell turnover times are not known; however, eventually, the turnover times might be long enough to allow accumulations of lipofuscin inside lysosomes of zebrafish thyrocytes. On the other hand, lipofuscin is formed within secondary lysosomes (i.e., primary lysosomes fused with colloid droplets) due to the interplay of 2 processes: (1) the production of partially reduced oxygen species by mitochondria and (2) the autophagocytotic degradation within lysosomes (Brunk, Jones, and Sohal 1992). Although lipofuscin agglomerations could only be detected in PER-exposed fish, both exposure groups revealed mitochondrial alterations such as dose-dependent increases and proliferations of mitochondria with distorted cristae. PTU-exposed fish displayed increased mitochondrial diameters. Similar effects were observed in white leghorn chicken after exposure to PTU and methimazole (Handa and Chiasson 1980) and in iodide-treated BB/W rats (M. Li and Boyages 1994). Based on reviews by Hotchkiss et al. (2009), Skulachev (2006), Tsujimoto and Shimizu (2007), and Ulivieri (2010), the observed effects could be interpreted as first signs of necrosis, at least degeneration, which was most evident in the highest PTU exposure group (50 mg/L). Interestingly, PER-exposed fish revealed around 50% of mitochondria with distorted cristae. This proportion was independent of exposure groups, as the numbers of both normal and affected mitochondria increased simultaneously. On the other hand, PTU-exposed fish revealed increasing fractions of affected mitochondria with rising exposure groups. Throughout, the percentage of affected mitochondria rose from 20% to 93%.
Mitochondrial damage is regarded as an indicator of oxidative stress. This could overcharge the capacity of the antioxidant defense system, thus leading to damaged cellular functions (Gille et al. 1989). PER is known to be actively taken up by thyrocytes (Dohan et al. 2007; Tran et al. 2008) but not to be metabolized (Anbar, Guttmann, and Lewitus 1959). In rat thyrocytes, PER causes an iodide efflux (Scranton and Halm 1965; Surks 1967). It might be hypothesized that PER accumulation could interfere with the intracellular antioxidant defense system, which could cause mitochondrial distortion. It is also known that PER inhibits iodide uptake by the NIS resulting in decreased TH levels (Schmidt and Braunbeck 2011; Schmidt et al. 2012).
Similarly to the mitochondrial damages in PER-exposed fish, the PTU-induced effects could be an indicator of oxidative stress. The mode of action of PTU is the blockade of thyroid peroxidases, which prevents TH synthesis. The subsequent activation of thyroidal tissue via TSH could lead to an increased influx of iodide and sodium into thyrocytes via the NIS. As shown by M. Li and Boyages (1994), both iodide excess and PTU exposure affected mitochondria. It is known that mitochondria show a sudden increase in permeability of the inner mitochondrial membrane for solutes smaller than 1,500 Da, which can result in mitochondrial swelling (Halestrap, McStay, and Clarke 2002; Zoratti and Szabo 1995). Under these stress conditions, it is likely that mitochondria were not capable of producing sufficient amounts of ATP, which would eventually guide the cell toward necrotic death (Crompton 1999; Halestrap, McStay, and Clarke 2002).
PTU exposure resulted in alterations of the rER. Proliferation, fenestration, and dilation are common reactions of thyrocytes exposed to thyroid peroxidase inhibitors. Similar reactions were observed in Wistar rats after exposure to methimazole (Tsujio et al. 2007) and white leghorn chicken after exposure to PTU (Handa and Chiasson 1980). In TH production, the rER plays an important role, as it is essential in the synthesis of thyroglobulin and thyroid peroxidases. The mode of action PTU is the inhibition of peroxidases resulting in lowered TH levels. This could lead to a higher demand to synthesize these peroxidases in order to adequately maintain TH production. This would lead to a proliferation of the rER, as observed in PTU-exposed fish. As only PTU-exposed fish showed proliferations of the rER, the specific mode of action seems to be of great importance.
We observed an increase in apical cell height revealed in PTU-exposed fish. Apical cell height represents an indirect parameter to detect proliferations of organelle contents, whose main location is the apical part of the cell. Thus, the observed proliferations of lysosomes, mitochondria, and the rER could contribute to the increase in apical cell height. This correlates with our previous light microscopical findings (Schmidt and Braunbeck 2011). PER exposure caused only a slight increase in apical cell height at exposure groups ≥62.5 µg/L and a significant increase in the highest exposure group (5,000 µg/L). Again, this correlates with our previous histological observations (Schmidt et al. 2012). Although a marked proliferation of mitochondria and lysosomes could be detected, the effect on overall apical cell height was moderate. This suggests that the proliferation of the rER (as observed in PTU-exposed fish) is the major contributor to the increased apical cell height. Consequently, this increase in epithelial cell height would also be histologically detectable.
Alterations in nuclear morphology cannot be considered as a suitable end point due to its low sensitivity in PTU-exposed fish. Thyrocytes of PER-exposed zebrafish showed an increasingly irregular outline of the nucleus in exposure groups ≥125 µg/L. The amount of heterochromatin moderately increased in higher exposure groups of both substances. Despite the relatively moderate extent, the nuclear changes could be interpreted as first reactions of the thyrocytes leading to cellular death seen at the highest PTU concentration. The appearance of degenerated cells could also be a first sign of cellular necrosis by the test substances (due to high intracellular concentrations) and should not be overestimated. No signs of general toxicity were observed at light microscopical level (Schmidt and Braunbeck 2011; Schmidt et al. 2012) and the applied substance concentrations in the exposure groups were far from known lethal ranges (Jomaa et al. 2014; Park et al. 2006). This further supports that ultrastructural investigations represent a very sensitive tool for the detection of effects of thyroid-active substances.
When dealing with effects of thyroid-active substances, the feedback mechanism responsible for thyroid homeostasis has to be taken into account. The thyroid is regulated by a negative feedback loop with the pituitary acting as the main control organ, excreting TSH. If the concentration of THs decreases due to inhibiting substances, elevated concentrations of TSH are responsible for activating the TH synthesis. Numerous studies have addressed this aspect in, for example, tadpoles (Neuenschwander 1972), chicken (Fujita 1963), and rats (Fujita and Suemasa 1968; Lupulescu et al. 1968; Roos 1960; Seljelid 1965, 1967a, 1967b, 1967c, 1967d, 1967e; Wetzel, Spicer, and Wollman 1965; Wissig 1963). These studies show remarkable similarities to the effects observed in this study, for example, increases in cell height, dilation of rER cisternae, and alterations of microvilli. The influence of TSH on the ultrastructural appearance of thyrocytes is significant; however, this influence alone cannot explain differences in effects between the 2 test substances. As mentioned above, both PER and PTU lead to increased stimulation by TSH due to lowered TH levels. Thus, alterations of thyrocytes should not deviate much. The fact that thyrocytes of zebrafish exposed to PER differ from their PTU-exposed counter parts can only be explained with the specific modes of action of the test substances.
In the context of endocrine disruption, histopathology provides a powerful and sensitive tool for the detection of thyroid-active substances (Grim et al. 2009). However, histopathological end points in the thyroid are usually limited to rather general end points such as hyperplasia and hypertrophy (see histopathology criteria in OECD test guideline 231; OECD 2009), which does not exploit the full opportunities that histology can offer. In contrast, ultrastructural investigations not only confirm histopathological observations but also provide additional and more detailed information about specific cellular changes induced by chemical exposure. Closer inspection of morphological processes revealed that fundamental cellular parameters and functions displayed distinct differences between the 2 substances likely due to the unique underlying modes of action. Thus, light and electron microscopical investigations are 2 methods that should complement each other in toxicological studies.
Conclusions
In conclusion, the present study highlights the value of zebrafish as sensitive test organism for thyroid-active substances. This provides a great opportunity to improve our understanding of (fish) thyroid function and histopathological alterations. For the first time, goitrogen-induced alterations in zebrafish thyrocyte ultrastructure were evaluated to further our understanding of existing histopathological data. Proliferation of microvilli, large electron-dense droplets, apically located luminal vesicles, and significant exo- and endocytotic activity are common features of thyroidal activation via TSH. Different modes of action of goitrogens lead to different changes in thyrocyte architecture. Beside massive proliferation of the rER in PTU-exposed zebrafish thyrocytes, the most striking effect was strong alterations in mitochondrial morphology in both PTU- and PER-exposed zebrafish. Distinct differences in mitochondrial morphology, likely due to the mode of action of the 2 substances, were also observed. In the future, the combination of cytopathological observations and histopathological investigations can be of crucial importance. It can document effects on thyroid development in fish larvae, which is essential for embryonic, larval, and juvenile development. The list of ultrastructural effects under different exposure conditions provides a valuable resource for further comparative studies. Together, specific subcellular aspects of thyroid pathology and the evaluation and interpretation of existing histopathological end points can greatly improve the detection of substances with thyroid-active properties in fish.
Footnotes
Author Contribution
Authors contributed to conception or design (FS); data acquisition, analysis, or interpretation (FS, RW, LB, TB); drafting the manuscript (FS, LB); and critically revising the manuscript (FS, RW, LB, TB). All authors gave final approval and agreed to be accountable for all aspects of work in ensuring that questions relating to the accuracy or integrity of any part of the work are appropriately investigated and resolved.
Declaration of Conflicting Interests
The author(s) declared no potential conflicts of interest with respect to the research, authorship, and/or publication of this article.
Funding
The author(s) received no financial support for the research, authorship, and/or publication of this article.
Supplementary Material
Supplementary material for this article is available online
References
Supplementary Material
Please find the following supplemental material available below.
For Open Access articles published under a Creative Commons License, all supplemental material carries the same license as the article it is associated with.
For non-Open Access articles published, all supplemental material carries a non-exclusive license, and permission requests for re-use of supplemental material or any part of supplemental material shall be sent directly to the copyright owner as specified in the copyright notice associated with the article.