
Abstract
N, N-dimethyl-p-toluidine (DMPT; Cas No. 99-97-8), an accelerant for methyl methacrylate monomers in medical devices, is a nasal cavity carcinogen according to a 2-yr cancer study of male and female F344/N rats, with the nasal tumors arising from the transitional cell epithelium. In this study, we exposed male F344/N rats for 5 days to DMPT (0, 1, 6, 20, 60, or 120 mg/kg [oral gavage]) to explore the early changes in the nasal cavity after short-term exposure. Lesions occurred in the nasal cavity including hyperplasia of transitional cell epithelium (60 and 120 mg/kg). Nasal tissue was rapidly removed and preserved for subsequent laser capture microdissection and isolation of the transitional cell epithelium (0 and 120 mg/kg) for transcriptomic studies. DMPT transitional cell epithelium gene transcript patterns were characteristic of an antioxidative damage response (e.g., Akr7a3, Maff, and Mgst3), cell proliferation, and decrease in signals for apoptosis. The transcripts of amino acid transporters were upregulated (e.g., Slc7a11). The DMPT nasal transcript expression pattern was similar to that found in the rat nasal cavity after formaldehyde exposure, with over 1,000 transcripts in common. Molecular changes in the nasal cavity after DMPT exposure suggest that oxidative damage is a mechanism of the DMPT toxic and/or carcinogenic effects.
Introduction
N, N-dimethyl-p-toluidine (DMPT; Figure 1) is a high production chemical used as an accelerant in methyl methacrylate monomers in medical devices. DMPT exposure is of concern because it can leach out from medical devices and dental materials (L. Wang et al. 2013). DMPT has other commercial uses and is listed in over 900 patents with the U.S. Patent Office (U.S. Patent and Trademark Office 2015). According to a 2-yr cancer study (National Toxicology Program [NTP] 2012), oral exposure to DMPT, a nongenotoxic chemical, produced liver cancer in rats (at 60 mg/kg) and mice (at 20 and 60 mg/kg) and nasal cavity cancer in rats (at 60 mg/kg). The State of California has listed DMPT as a chemical known to cause cancer (Office of Environmental Health Hazard Assessment 2014) based on the results of the DMPT rodent cancer study (NTP 2012).
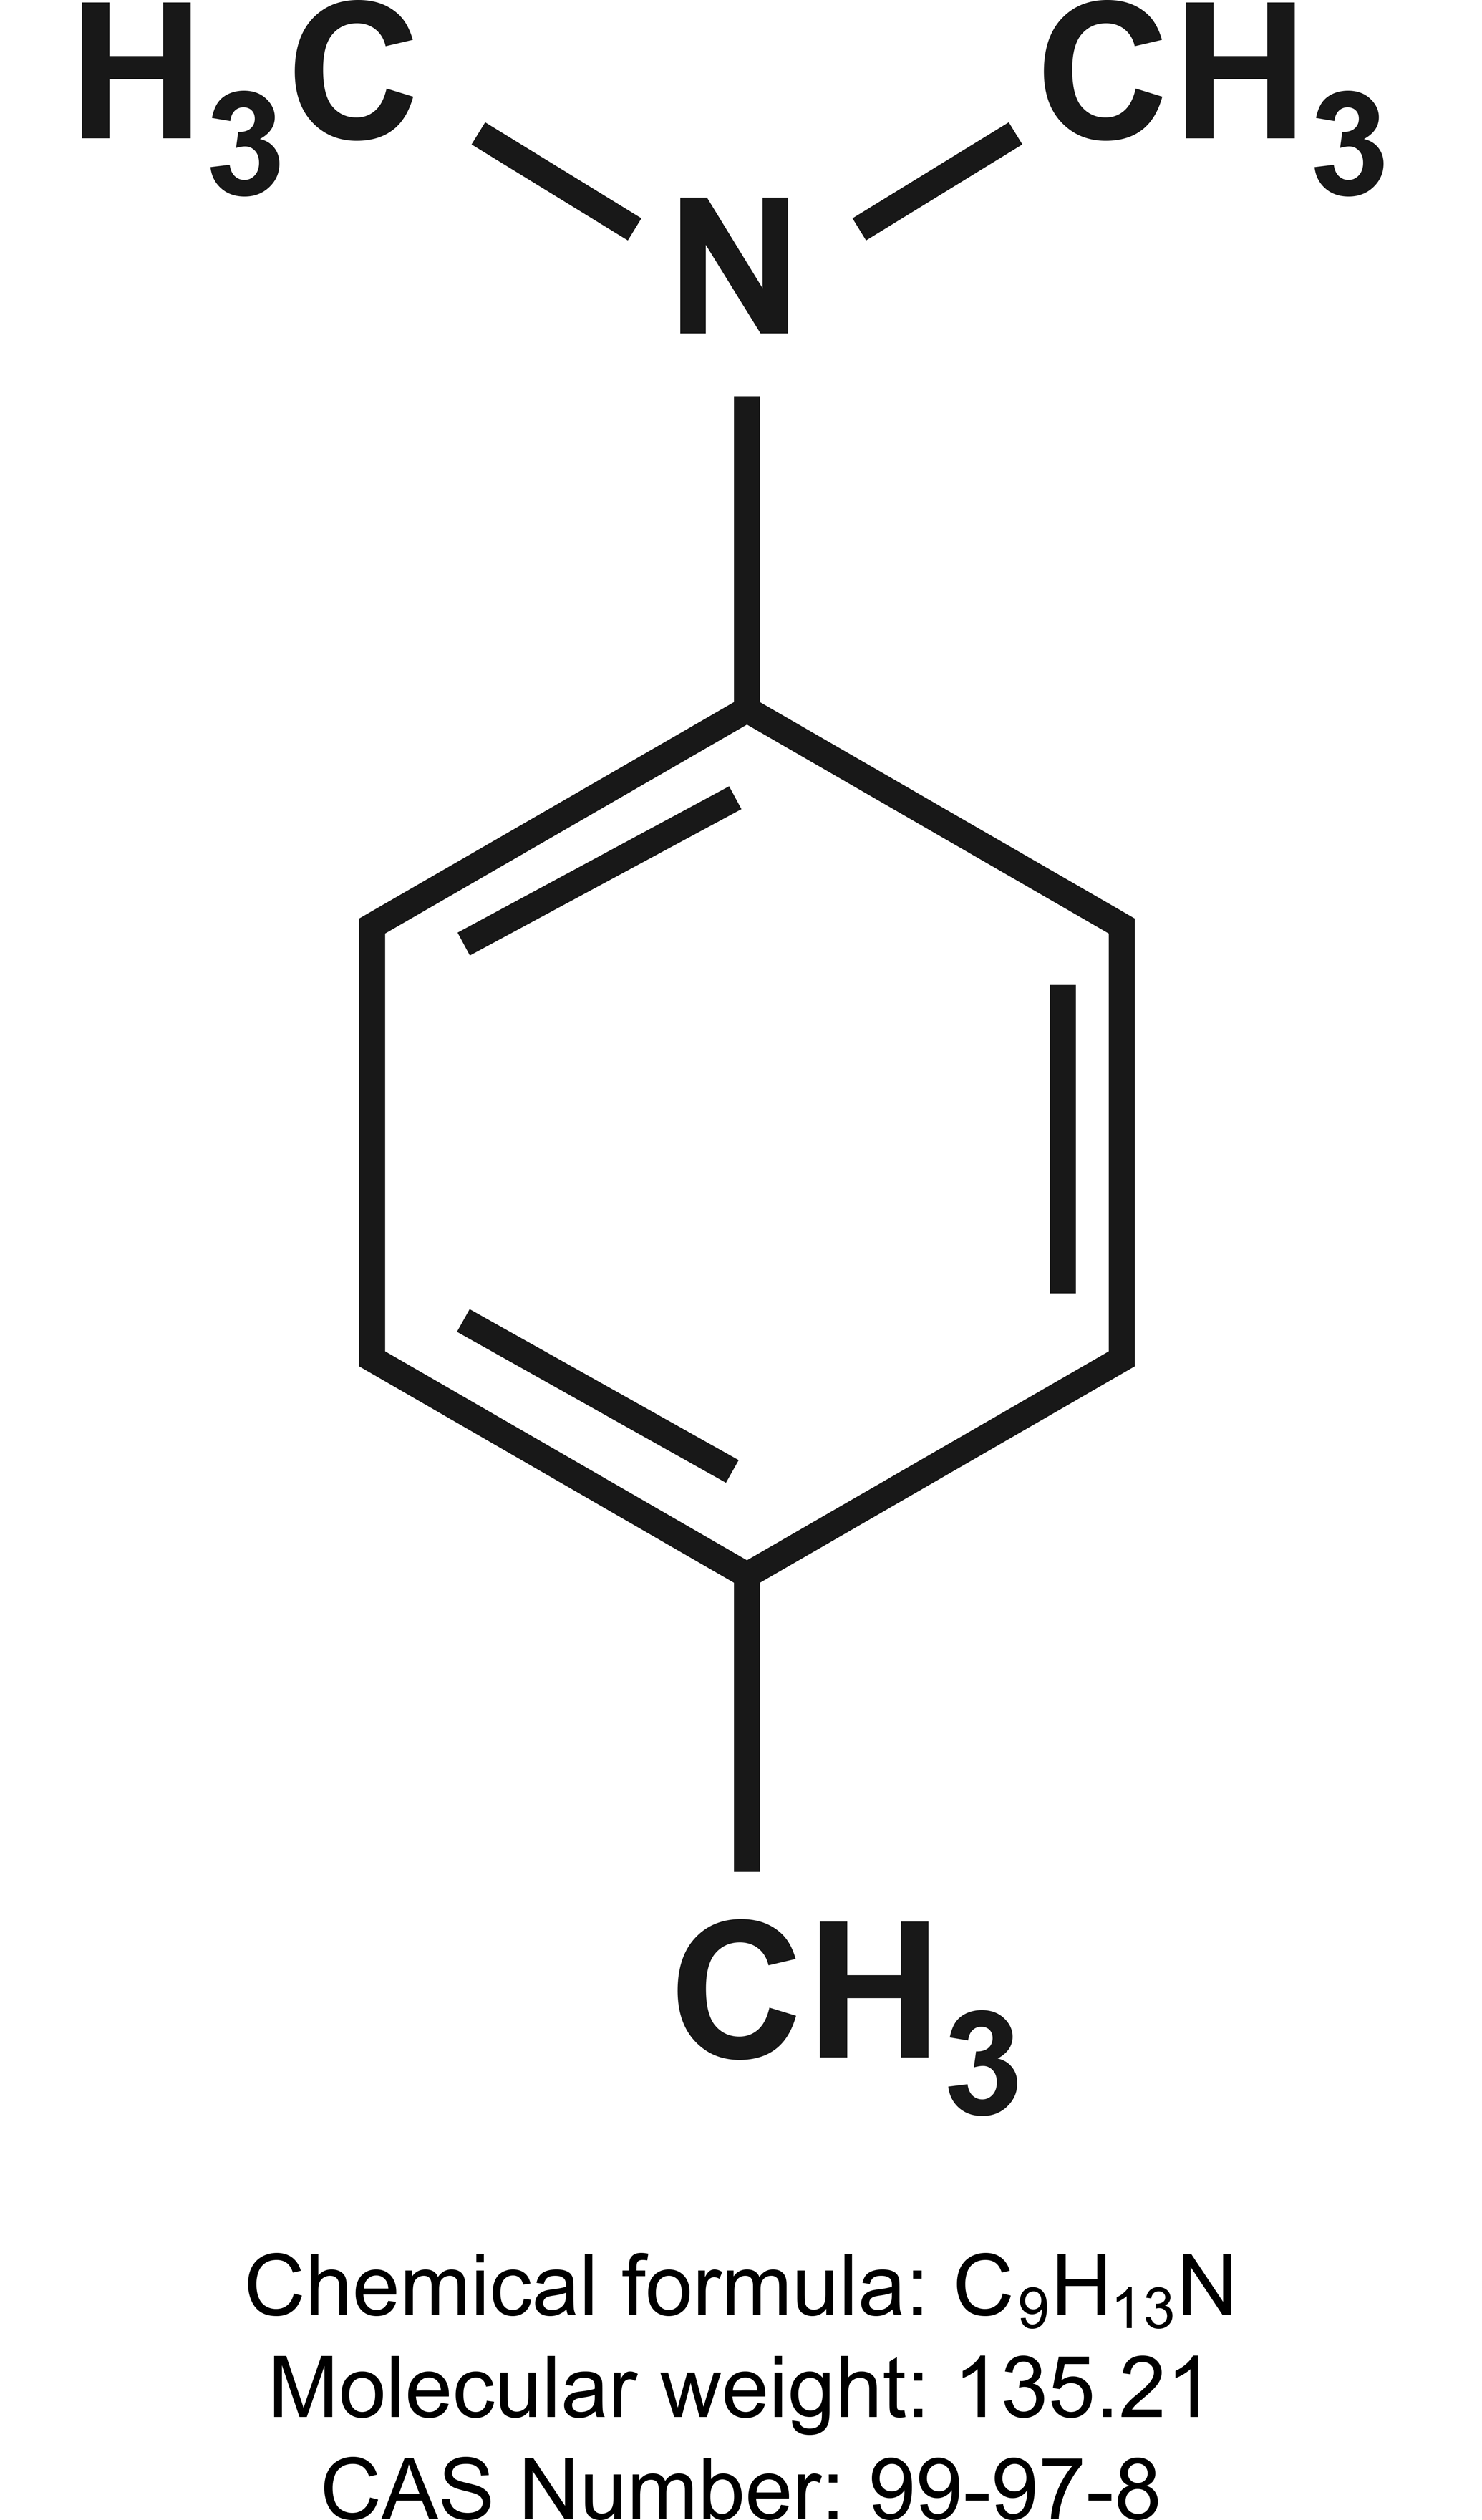
N, N-dimethyl-p-toluidine structure.
After oral administration, DMPT is rapidly absorbed in the rat and is excreted in the urine (Dix, Ghanbari, and Hedtke-Weber 2007). The major DMPT metabolite in the urine is p-(N-acetylhydroxyamino) hippuric acid. Two lesser metabolites are DMPT N-oxide and N-methyl-p-toluidine (Kim et al. 2007). After oral administration, DMPT is carcinogenic in the nasal cavity and liver of the rat. The DMPT toxicity and carcinogenic response in the nasal cavity occurred in the transitional epithelium (NTP 2012). The transitional cell epithelium is composed of 2 cell layers of nonciliated cuboidal or columnar surface cells and basal cells with a scarcity of mucous secretory cells (Hardisty et al. 1999; Harkema, Carey, and Wagner 2006). It is found on the lateral walls of the nasal cavity and on turbinate tips. In a series of NTP cancer studies, other chemicals were also found to cause nasal tumors. Often the origin of the nasal cavity tumors in rats is not specified or apparent. Compounds investigated by NTP that cause nasal cavity epithelial tumors include cumene (TR 542; inhalation study), 1,2-dibromo-3-chloropropane (TR 206; inhalation study), 1,2-dibromoethane (TR 210; inhalation study), 2,3-dibromo-1-propanol (TR 400; dermal study), dimethylvinyl chloride (TR 306; oral gavage study), 1,4-dioxane (TR 80; drinking water study), 1,2-epoxybutane (TR 306; inhalation study), naphthalene (TR 410; inhalation study), 2,6-xylidine (TR 278; feed study), and propargyl alcohol (TR 552; inhalation study; NTP 2014).
The current work describes molecular changes in the rat nasal cavity transitional epithelium after 5 days of DMPT oral exposure. Rapid dissection was used to capture and preserve a sample of nasal tissue for subsequent laser capture microdissection (LCM) to obtain transitional cell epithelium tissue for RNA extraction and toxicogenomic evaluation. Methemoglobin was added as an end point because DMPT has previously been shown to cause methemoglobinemia in rodents (NTP 2012). This article expands our knowledge on the use of transcriptomic findings to identify early changes in the nasal cavity that can elucidate mechanisms or identify early disease biomarkers. While this study focuses on early exposure transcriptomic patterns, other human exposure scenarios may involve longer-term exposure to DMPT. The objective of this study was to evaluate if early molecular changes in the nasal cavity transitional cell epithelium in rats after a 5-day DMPT oral exposure would help to elucidate pathways and mechanisms leading to toxicity.
Material and Method
Experimental Design
DMPT (lot #C15Y012, >99% pure; Alfa Aesar, Ward Hill, MA) was prepared for oral gavage administration in corn oil (Lot# 12-542; Welch, Holme & Clark Co., Inc. Newark, NJ) to deliver DMPT at doses of 0, 1, 6, 20, 60, or 120 mg/kg/day for 5 consecutive days to male F344/N rats in a volume of 2.5-ml/kg body weight. The high dose of 120 mg/kg was selected as a 5-day maximum tolerated dose based on the findings from a 13-week DMPT study, in which the body weights of male F344/N rats at the end of a 125 mg/kg exposure were 12% lower than body weights of controls (NTP 2012). The lower doses (1–60 mg/kg) were selected to give a response over a broad dose range. Male F344/N rats (5 animals/dose level) were obtained from Taconic Laboratory, Germantown, NY. Five male rats were added to the high-dose and control groups for frozen nasal tissue collection and RNA extraction. At the start of the study, the animals were 5–6 weeks of age. The animals were housed 2 per cage. Tap water and NTP-2000 diet (Zeigler Brothers, Inc. Gardners, PA) were made available ad libitum.
The care of animals on this study was according to National Institutes of Health (NIH) procedures as described in the “The U.S. Public Health Service Policy on Humane Care and Use of Laboratory Animals,” available from the Office of Laboratory Animal Welfare, NIH, Department of Health and Human Services, RKLI, Bethesda, MD or online at http://grants.nih.gov/grants/olaw/olaw.htm#pol. The protocol was approved by the laboratory where the animals were housed and dosed (Alion Science and Technology Animal Care and Use Committee).
Methemoglobin Assay
Blood was collected from the retroorbital plexus for methemoglobin determination from the core rats according to the methods of Evelyn and Malloy (1938). Disodium hydrogen phosphate, potassium dihydrogen phosphate, acetic acid, aqueous sodium cyanide, and aqueous potassium ferricyanide were purchased from Sigma Chemical Company, St. Louis, MO.
Nasal Cavity Tissue Collection
Animals were euthanized 24 hr after the last dose under CO2 gas. After decapitation, the skin, mandible, and nasal vestibule were removed from the head. Animals not designated for LCM were infused with 10% neutral-buffered formalin through the nasopharyngeal groove and immersed in the fixative for 72 hr. Following fixation, the heads were decalcified in a 3:1 Formical 2000™ (Decal Chemical Corporation, Tallman, NY)/1× phosphate-buffered saline (HyClone™ Laboratories Inc., Logan, UT) solution for 60 hr. Following a rinse in water, the nasal cavities were trimmed to obtain representative sections of levels 1, 2, and 3. For level 1, a cut was made directly behind the upper incisor teeth as described in traditional rat nasal cavity trimming (Boorman, Morgan, and Uriah 1990). Level-2 trimming was modified from the traditional protocol. Instead of cutting directly behind the incisive papilla, the cut was made between the incisive papilla and the first palatal ridge. For level 3, the tissue trimming was modified to section directly in front of the first molar and not the traditional method of sectioning through the second molar. These modifications were made to obtain improved sections of the respiratory and ethmoid turbinates, respectively. Representative sections of the nasal cavity at levels 1, 2, and 3 were routinely processed and paraffin embedded.
Nasal Cavity LCM
For the additional control and high-dose group animals designated for frozen nasal cavity tissue, transitional epithelium from level 1 was collected by LCM and RNA extracted. Nasal cavity tissue was collected within 5 min to preserve RNA integrity. For LCM studies, the skin, mandible, and nasal vestibule were removed from the head. A cut along the sagittal suture at the anterior and posterior ends initiated the splitting of the calvarium. Placing the head on the dorsal surface, a disposable razor blade was placed between the incisors, along the palatine suture of the hard and soft palate. A cut through the hard and soft palate divided the head into 2 sagittal sections. Each half of the head was placed with the cut surface up in a self-made styrofoam mold. Naso- and maxilloturbinates were removed, and the epithelium along with submucosal tissue stripped from the inner wall of the calvarium at levels 1 and 2 of the nasal cavity. Tissue strips were placed in a cryomold on dry ice, filled with optimal cutting temperature compound (OCT; Sakura Finetek U.S.A., Inc., Torrance, CA) and stored at −80°C. Tissue strips were collected and frozen within 5 min after euthanasia.
The nasal cavity membrane strips were sectioned at 8 μm on the cryostat, with hematoxylin and eosin (H&E) stains performed on every fifth section. Unstained sections were placed on polyethylene terephthalate foil slides (ACSS, Lenior, TN) for LCM. The H&E-stained MAP sections were examined microscopically, and the transitional epithelium identified and marked on the coverslip as a guide for the laser microdissection. Laser microdissection of the transitional epithelium was done on cresyl violet-stained sections.
The presence of transitional epithelium varied from one section to the next, with the epithelium often absent from early sections and sometimes depleted from the deeper sections of the frozen block. Transitional epithelium was identified by the cuboidal nature of the epithelium, as opposed to the taller, columnar appearance of the respiratory epithelium. Other features used for identification of transitional epithelium included no or rare ciliated cells and goblet cells and the usual appearance of 2 cell layers (basal cell and cuboidal cell). Only transitional epithelium on the outer surface of the stripped membranes was labeled and microdissected to facilitate both the labeling and the microdissection process. Transitional epithelium from approximately 40 sections per sample was pooled for the microarray analysis. The amount of RNA obtained for each nasal cavity was 5.7–12.6 ng.
Nasal Cavity RNA Extraction and Analysis
After LCM of the nasal cavity transitional cell epithelium, RNA was extracted from the control and 120 mg/kg groups, according to the NTP protocol for laser capture microdissected samples (http://www.niehs.nih.gov/research/resources/protocols/extraction/picoscale/index.cfm). The RNA was analyzed for quantity and purity by ultraviolet analysis using the NanoDrop ND-1000 (NanoDropTechnologies, Wilmington, DE). Samples were concentrated using Microcon filters (Millipore, Billerica, MA). All samples were evaluated for RNA integrity by gel electrophoresis using the Flash Gel RNA cassette system (Lonza, Rockland, ME).
Microarray Analysis
Gene expression analysis was conducted using Affymetrix Rat Genome 230 2.0 GeneChip® arrays (Affymetrix, Santa Clara, CA). Four nanograms (4 ng) of total RNA was amplified as directed in the WT-Ovation Pico RNA Amplification System protocol and labeled with biotin following the Encore Biotin Module. Five micrograms (5 μg) of amplified, biotin-labeled RNAs were fragmented and hybridized to each array for 18 hr at 45°C in a rotating hybridization. Array slides were stained with streptavidin/phycoerythrin utilizing a double-antibody staining procedure and then washed for antibody amplification according to the GeneChip® Hybridization, Wash and Stain Kit, and user manual following protocol FS450-0004. Arrays were scanned in an Affymetrix Scanner 3000.
Data Normalization
Probe intensity data from all Rat Genome 230 version 2 Affymetrix GeneChip® arrays were read into the R software environment (http://www.R-project.org) directly from .CEL files using the R/affy package (Gautier et al. 2004). Probe-level data quality was assessed using image reconstruction, histograms of raw signal intensities, and hierarchical clustering of samples. Normalization was carried out using the robust multiarray average (RMA) method using all probe intensity data sets together (Irizarry et al. 2003). The RMA method adjusts the background intensities of perfect match probes, applies a quantile normalization, and calculates final expression measures using the Tukey median polish algorithm. RMA scatter plots were used as an additional quality control measure.
Statistical Assessment of Differential Gene Expression
Gene expression between control and treated nasal cavities was made for each probe set using a bootstrap t-test approach. Pairwise tests were conducted while controlling the false discovery rate (FDR) at the 5% level. All statistical calculations were performed in the ORIOGEN, version 4.01, software package using 10,000 bootstrap samples (Peddada et al. 2005).
Data were analyzed using the ingenuity pathway analysis database of biologic networks (www.ingenuity.com) and Nextbio (www.nexbio.com), a web-based tool that can be used to compare an experimental gene expression signature to thousands of genomic signatures derived from published microarray data sets in public databases (Kupershmidt et al. 2010). This data mining approach is based on rank-based statistical procedures and is analogous to the gene set enrichment method (Subramanian et al. 2005). NextBio uses a Running Fisher algorithm that can accommodate information from both the query and target sequences and can incorporate data of different sizes and filter thresholds in order to find the most significant signal in a ranked gene expression signature. The resulting correlation scores describe the association between a given gene set and an extensive set of publicly available studies (Kupershmidt et al. 2010).
The upstream regulator analysis presented here is based on known relationships between transcriptional factor molecules and targets stored in the ingenuity knowledge base. For each transcription factor, an overlap p value is used to compare the overlap between the number of known transcription factor targets and the number of targets found in the DMPT gene list.
Nanostring Analysis
Nanostring nCounter is a hybridization-based platform for multiplexing gene expression from total RNA (NanoString©; Seattle, WA; www.nanostring.com). Non-cross-reactive probes are custom synthesized and mixed for validation transcripts and normalization (e.g., housekeeping) transcripts. Microarray results were confirmed for nasal epithelium RNA samples using the nCounter platform by utilizing a Custom CodeSet consisting of 12 DMPT transcripts found to be significantly altered from control after microarray analysis that included Sprr1a, Slc7a11, Akr7a3, Cyp3a13, Maff, Psca, Krt4, Ngfr, Nrgn, Ermn, Ccno, and GP2. Seven housekeeping genes (Gapdh, Hprt1, LOC100365008, Med15, Rpl7, Spire1, and ZNF91 L) and a gene that was not significantly increased with DMPT (Agm) were used for normalization. For nasal cavity RNA samples in Nanostring analysis, 100 ng of amplified complementary DNA were obtained utilizing the Nugen™ Ovation Pico WTA System (v2; Nugen Technologies, Inc., San Carlos, CA). Gene expression was quantified on the nCounter Digital Analyzer™, and raw and normalized counts were generated with nSolver (version 2.5)™ software. All data passed nSolver’s quality analysis/quality control. Data were normalized utilizing the manufacturer’s positive and negative control probes as well as the housekeeping genes. Subsequently, the data were imported into Partek™ Genomic Suite (6.6), quantile normalized, and further inspected for separation of control and DMPT groups.
Results
Survival and Body Weights
There was no effect on survival at any DMPT exposure level in this study (all animals lived until the end of the 5-day exposure). Mean body weights for the 1, 6, 20, 60, and 120 mg/kg exposure groups were 104%, 103%, 92%, 94%, and 90% of control mean body weight at the end of the 5-day exposure. Methemoglobin levels were not increased in treated rats (data not shown).
Nasal Tissue Histopathology
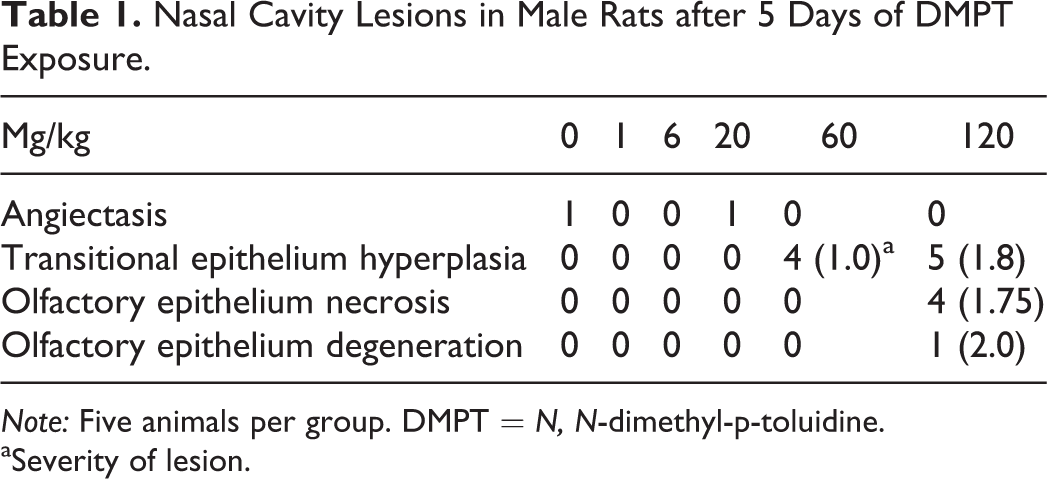
Hyperplasia of the nasal cavity transitional epithelium was observed in the 60 and 120 mg/kg dose groups (Table 1 and Figure 2A and B). Hyperplasia of the transitional epithelium was characterized by an increase in cell layers and an increase in the disorganization of the cells. Control transitional epithelium was typically 1–2 cell layers thick, whereas hyperplastic epithelium was 3 or more layers thick and the cells appeared jumbled and disorganized, with irregular piling. Only minimal to mild severity hyperplasia of the transitional epithelium was recorded; minimal lesions tended to involve less area than mild lesions. Typically, mild lesions would involve the tips of the nasoturbinates and most of the lateral wall, while minimal lesions might be restricted to the tips of the nasoturbinates, or involve the tips of the nasoturbinates and just a small focal area of the lateral wall. Also, mild lesions tended to be thicker, typically 4 cell layers, whereas the minimal lesions were usually only 3 cell layers thick. None of the lesions had more than 4 or 5 cell layers. The disorganization of the hyperplastic transitional epithelium made determining the exact number of cell layers difficult. The hyperplastic epithelium also contained clear vacuoles within some cells, and occasionally there was a shrunken, eosinophilic cell present within the epithelial layer.
Nasal Cavity Lesions in Male Rats after 5 Days of DMPT Exposure.
Note: Five animals per group. DMPT = N, N-dimethyl-p-toluidine.
aSeverity of lesion.
(A) Lateral wall region of nasal level I from a young, male F344/N rat exposed to vehicle control corn oil by gavage for 5 days. The transitional epithelium is 1–2 cell layers thick and fairly well organized (arrows). Hematoxylin and eosin stain. (B) Lateral wall region of nasal level I from a young, male F344/N rat exposed to 120 mg/kg N, N-dimethyl-p-toluidine by gavage for 5 days. The transitional epithelium is characterized by a thickened, disorganized epithelium (arrows), with occasional vacuoles (arrowheads). Hematoxylin and eosin stain.
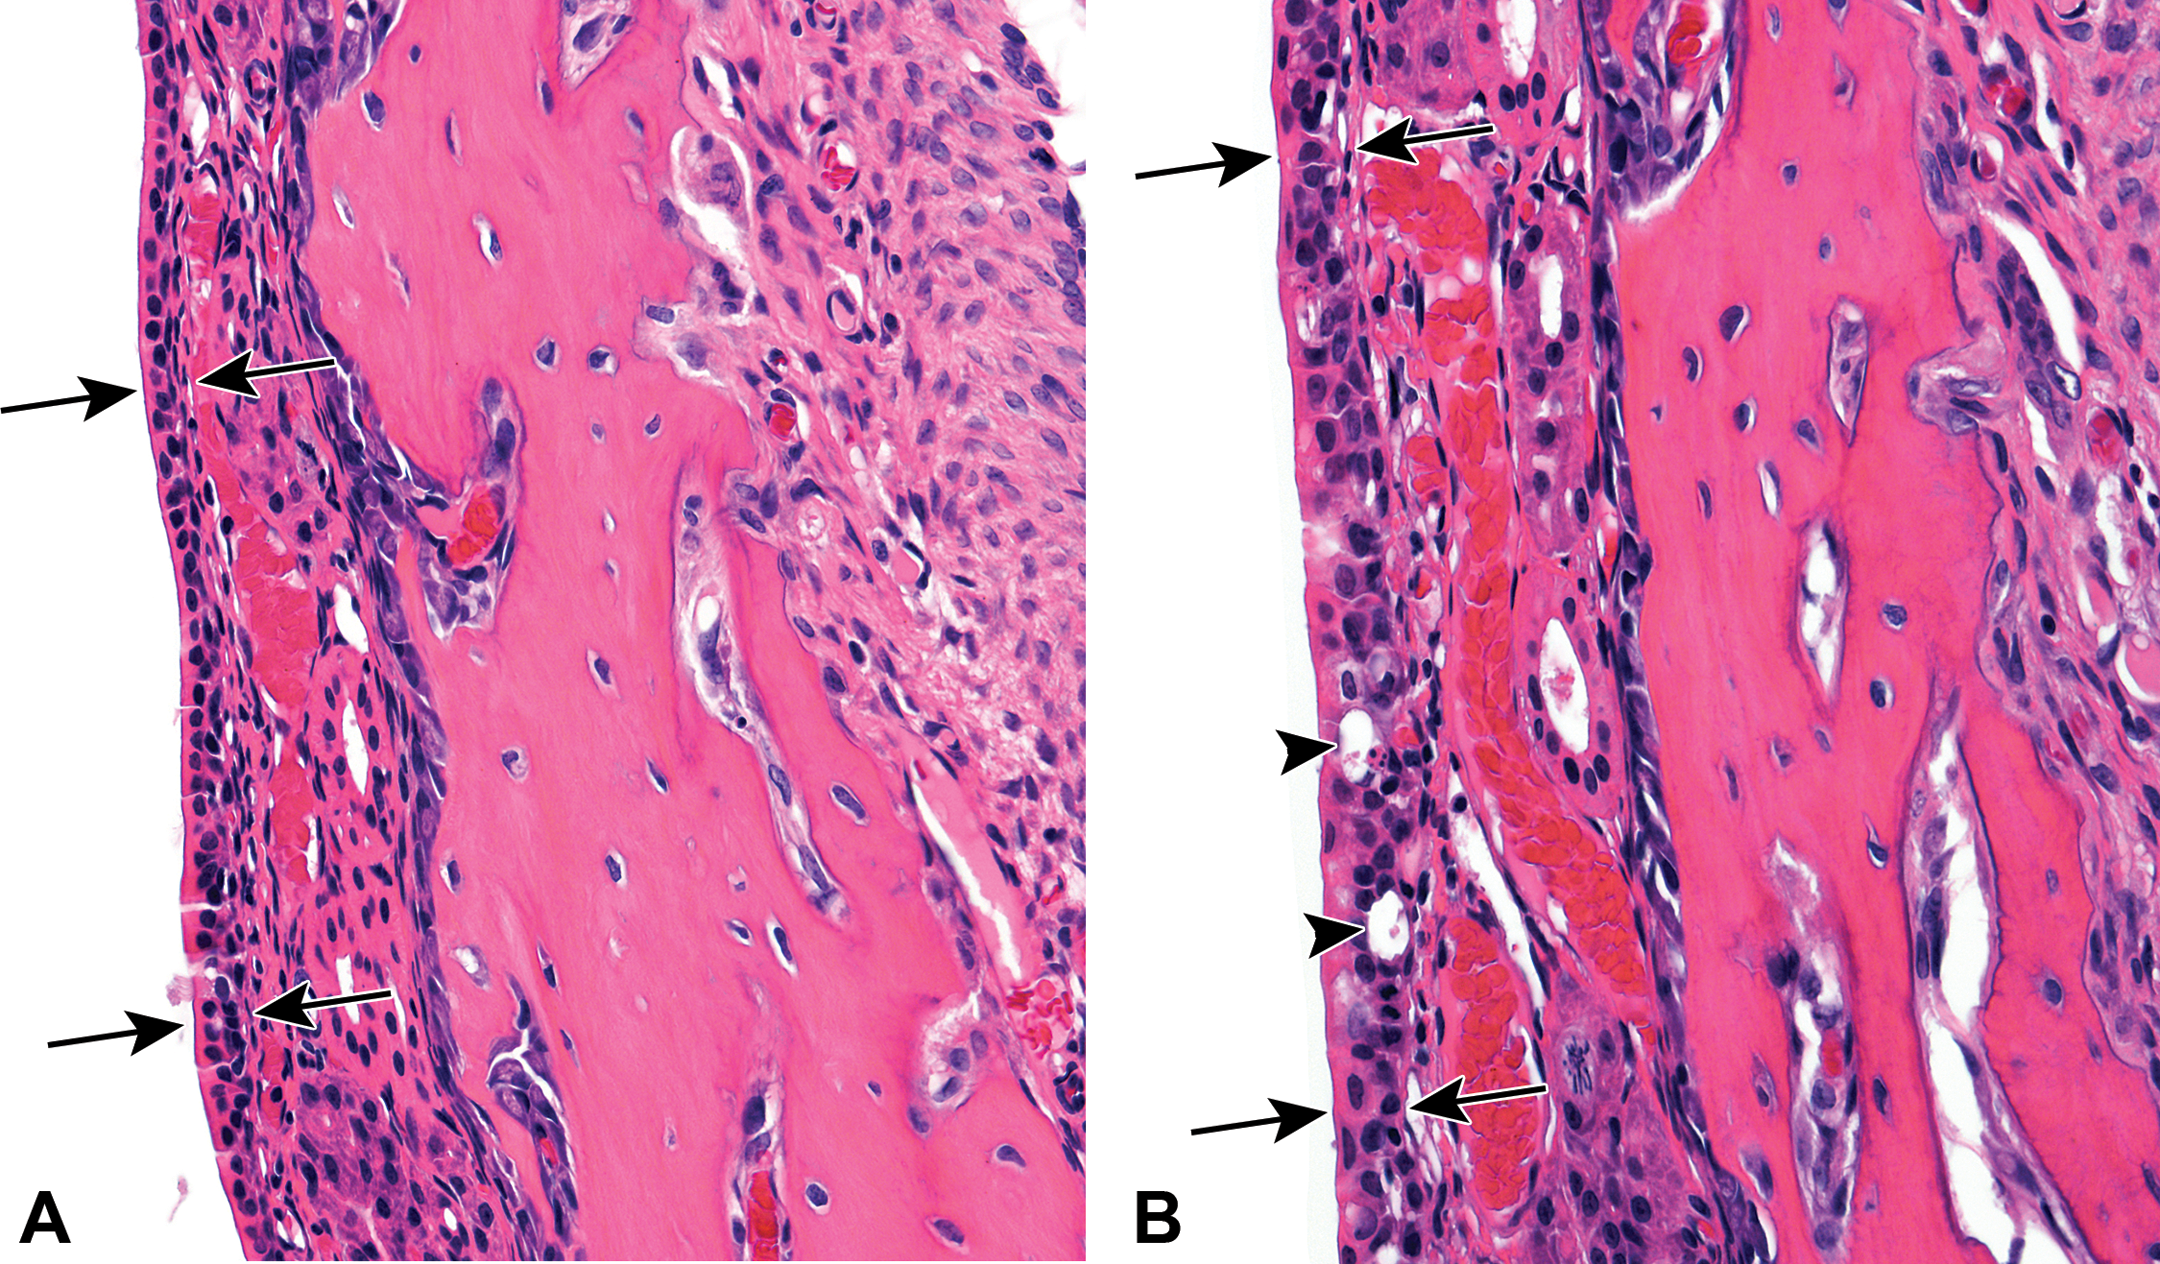
In nasal level 3, olfactory epithelial necrosis was characterized by a layer of proteinaceous substance and cell debris overlying a thin, disorganized layer of olfactory epithelium (Figure 3A–E). The remaining olfactory epithelium was hypocellular, disorganized, vacuolated, and contained individual dead cells, which were characterized by shrunken, eosinophilic round bodies. There were focal areas of attenuated epithelium in affected locations, indicative of epithelial cell loss. The dorsal meatus and immediately adjacent areas were most commonly and severely affected. Severity of olfactory epithelium necrosis was based upon the extent of the lesion as well as the amount of changes seen in the affected area. Minimal lesions consisted of small areas of dorsal meatus olfactory epithelium characterized by a slight disorganization and vacuolation of the epithelium, which contained decreased numbers of cells within the epithelium. There was a thin layer of proteinaceous and cell debris overlying affected areas. Mild lesions involved a larger area of the dorsal meatus, and the epithelium contained obviously fewer cells. Moderate necrosis involved most of the dorsal meatus and immediately adjacent areas. There was a thick layer of debris overlying the epithelium, which was moderately attenuated in areas. The remaining epithelium was disorganized and vacuolated. The one occurrence of mild olfactory degeneration that was recorded differed from necrosis in that the epithelium appeared normal in thickness and better organized than that in the animals with necrosis. The epithelium contained numerous vacuoles but lacked evidence of cell death and overlying debris (Figure 3F). One animal exposed to 20 mg/kg DMPT had mild dilation of the vessels in the lamina propria in nasal level 3; this was recorded as angiectasis. Angiectasis was not seen in any other animals in this study.
(A). Normal olfactory epithelium in the dorsal meatus region of nasal level 3 from a young, male F344/N rat exposed to vehicle control corn oil by gavage for 5 days. The olfactory epithelium is organized and uniform in height (arrows). Hematoxylin and eosin stain H&E. (B). Higher magnification of Figure 3A. The cells are densely packed and uniform in size, and the epithelium is uniform in height. H&E (25×). (C). Dorsal meatus region of nasal level 3 from a young, male F344/N rat exposed to120 mg/kg N, N-dimethyl-p-toluidine (DMPT) by gavage for 5 days. Olfactory epithelial necrosis, characterized by irregularity and decreased cellularity of the olfactory epithelium, is present (arrows). There is cellular debris on the surface of the epithelium (arrowheads) and in the lumen of the nasal cavity. H&E. (D). Olfactory epithelial necrosis in the dorsal meatus region of nasal level 3 in a young, male F344/N rat exposed to120 mg/kg DMPT by gavage for 5 days. The olfactory epithelium is decreased in cellularity, vacuolated (arrows) and irregular. H&E. (E). Dorsal meatus region of nasal level 3 from a young, male F344/N rat
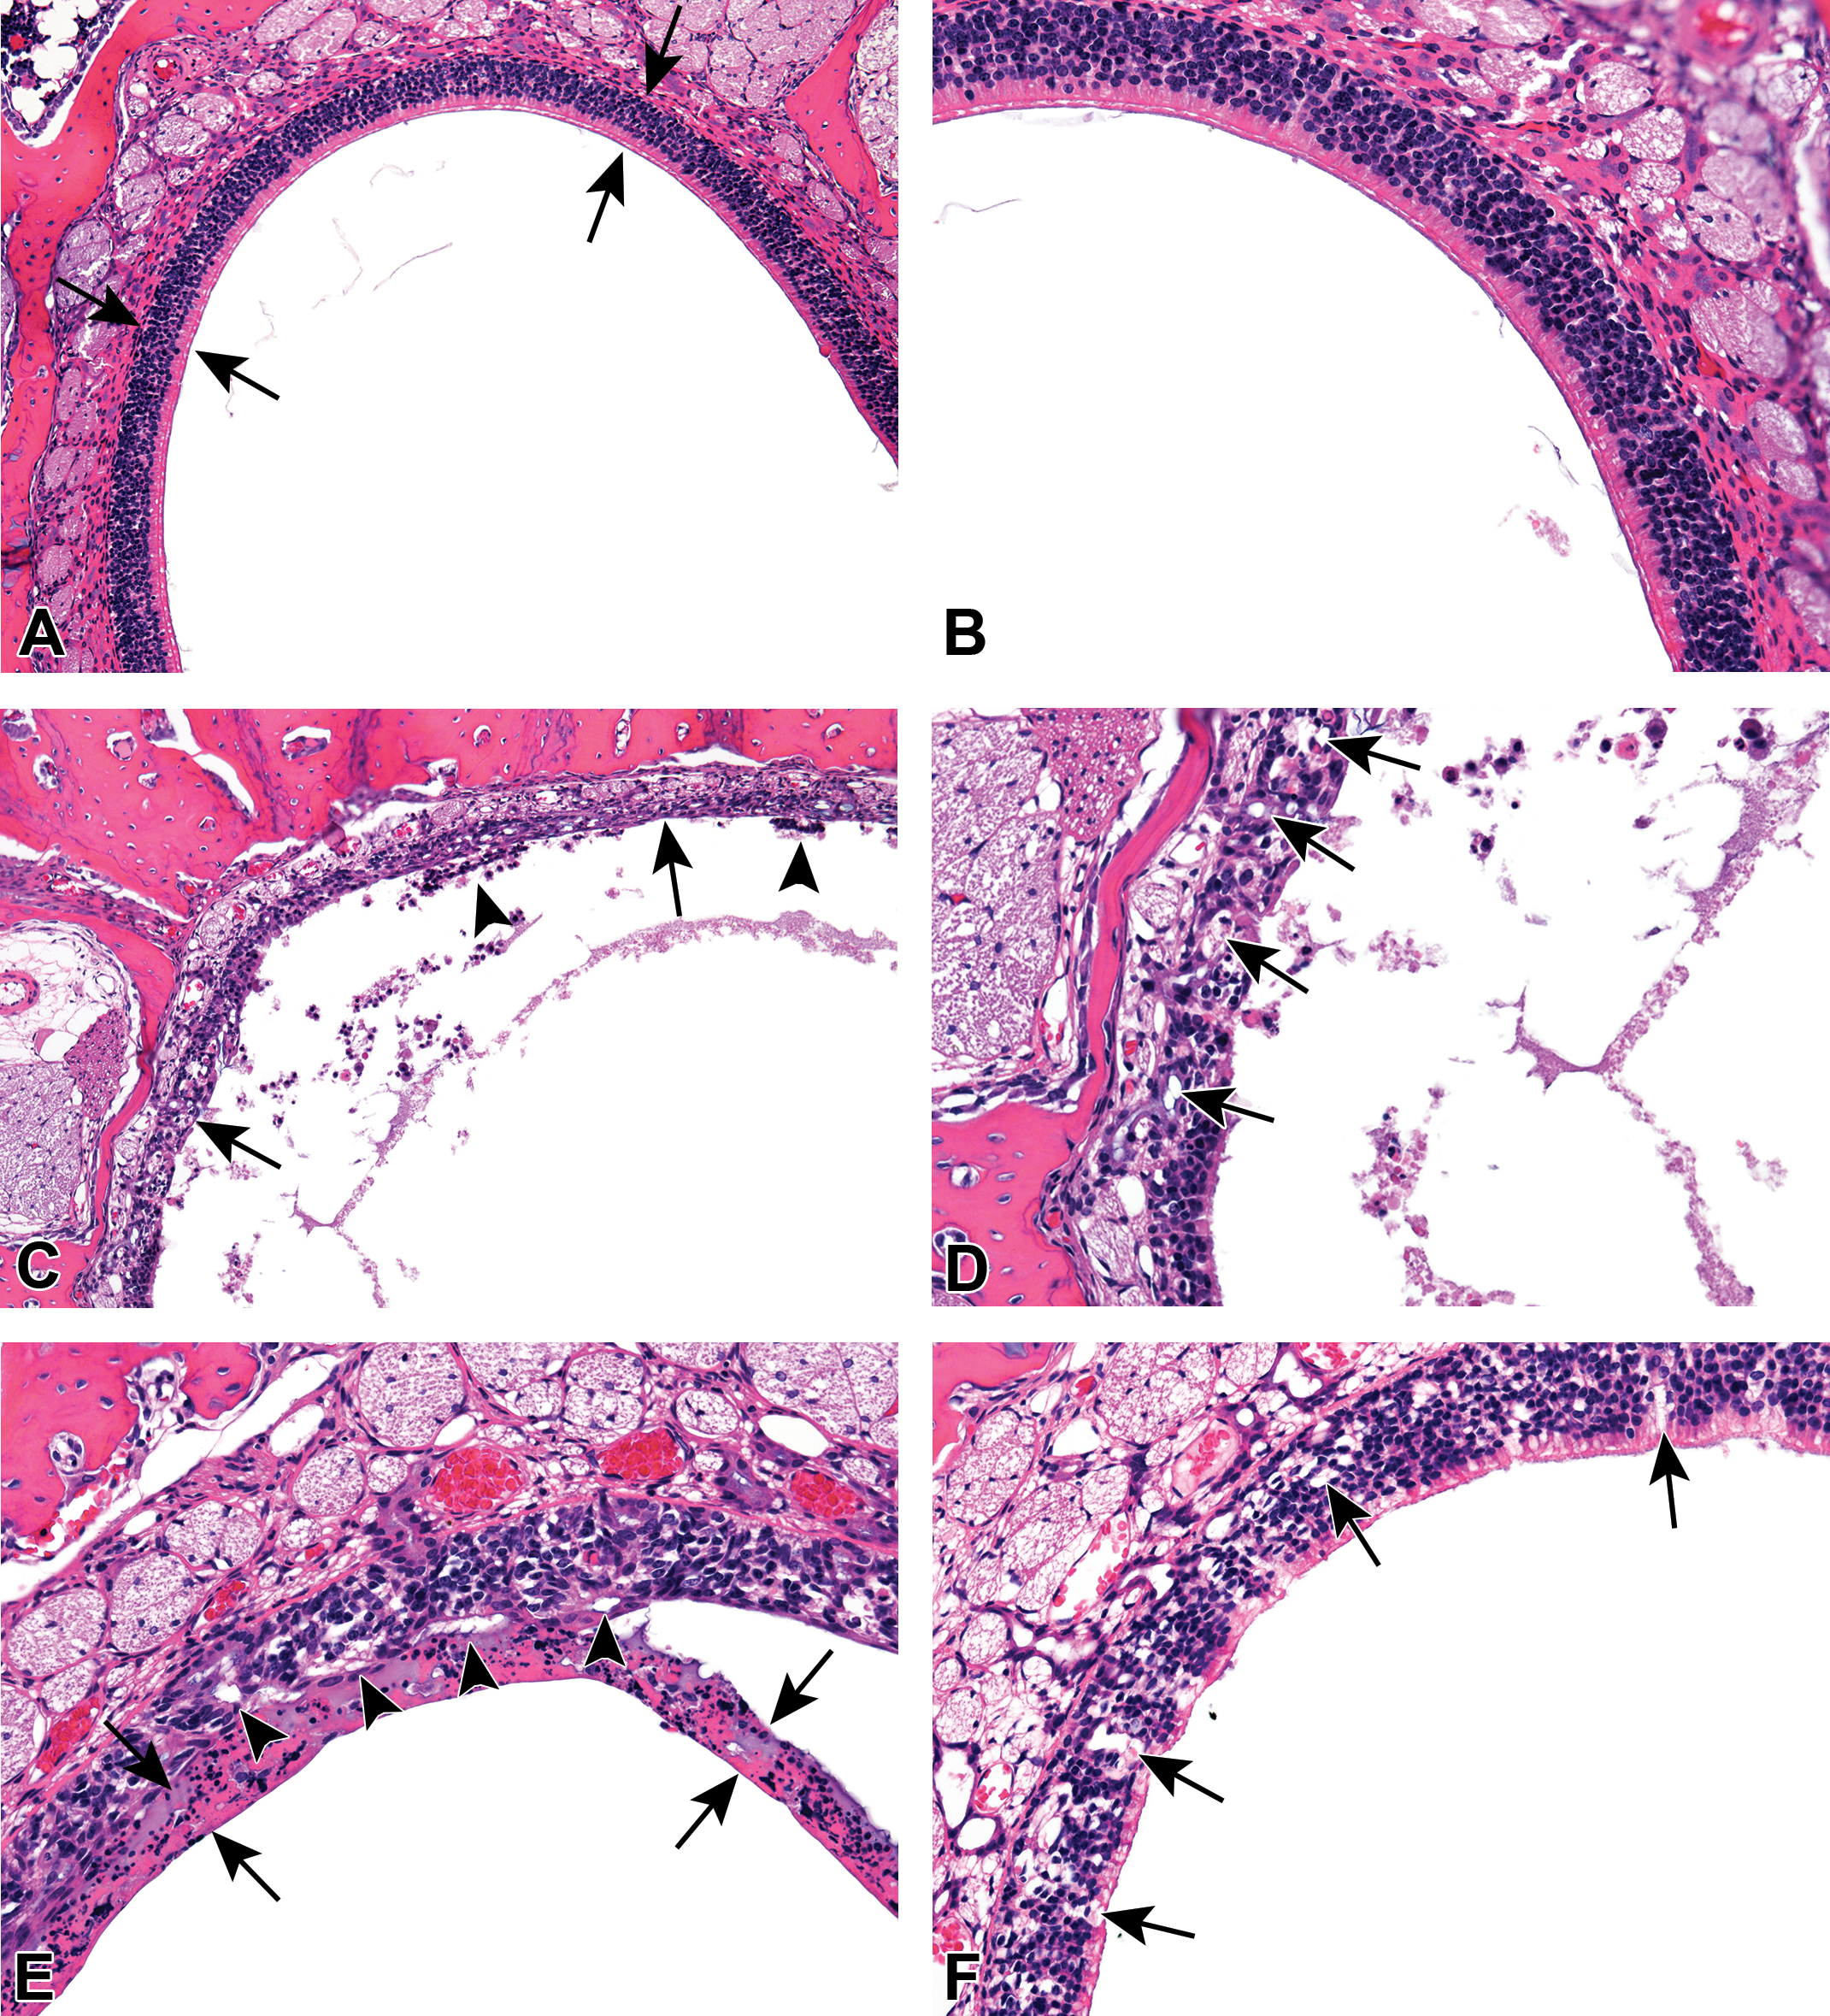
Nasal Tissue Dissection from Frozen Specimens
Each of the 10 nasal specimens (5 control and 5 DMPT treated 120 mg/kg specimens) contained both transitional and respiratory epithelium, which varied from one section to the next (Figure 4A and B). However, enough transitional epithelium was laser microdissected in each of the 10 specimens to allow for sufficient RNA to be extracted from the harvested material. For each specimen, the frozen sections were examined blindly, and the epithelium could be correctly identified as either control or treated on the basis of changes seen in the transitional epithelium. These changes in the transitional epithelium of the treated animals included karyomegaly, crowding of nuclei, loss of basal polarity of the nuclei, and sometimes 3 layers of cells indicative of mild hyperplasia.
(A). Frozen nasal section from control rat showing transitional cell epithelium. (B). Frozen nasal section from treated rat showing transitional cell epithelium, which is thickened by an increase in number and size of the cells.
Nasal Tissue Significant Gene Transcripts in the Nasal Cavity Transitional Cell Epithelium
Principal component analysis across the control and 120 mg/kg samples separated the samples into control and treated groups (Figure 5). Moreover, global gene expression patterns showed a clear difference between treated and control samples. Using a FDR threshold of 0.05, there were 2,561 differentially expressed transcripts (corresponding to 1,730 genes) in the 120 mg/kg group (vs. control). Nanostring analysis of selected transcripts confirmed the direction of the DMPT-induced transcript change (upregulated: Sprr1a, Slc7a11, Akr7a3, Maff, Cyp3a13, Psca, Krt4, and Ngfr; or downregulated: Nrgn, Ermn, Ccno, and GP2; Figure 6).
Principal component analysis. The first 3 principal components comparing global gene expression profiles of rats exposed to vehicle control and N, N-dimethyl-p-toluidine treatment in the nasal cavity. Samples cluster within group (vehicle or treated), indicating that there are differences in expression between the 2 treatment conditions.
Nanostring and microarray platform comparison of gene transcript fold change. Bars represent n = 10 rats/group.
Using Ingenuity Pathway Analysis the differentially expressed transcripts mapped to 1,730 genes, with a total of 994 upregulated genes and 736 downregulated genes (Supplement 1). There were 32 transcripts upregulated > 10-fold, and 38 transcripts downregulated more than 5-fold (Table 2; Supplement 1). Genes predicted to be upstream regulators of the DMPT molecular response were Myc (↑2.1, MYCT1; Fu et al. 2011), E2F (↑1.7, E2F1; ↑2.0, E2F8), and Rb pathways (Table 3; Ma et al. 2013).
DMPT Induction of Significant Transcripts in the Nasal Cavity Transitional Cell Epithelium.
Note: NAD(P)H = nicotinamide adenine dinucleotide phosphate. DMPT = N, N-dimethyl-p-toluidine.
aRed is an upregulated transcript; blue is a downregulated transcript.
bFold change: DMPT versus control.
Transcription Regulators (|z| > 3).
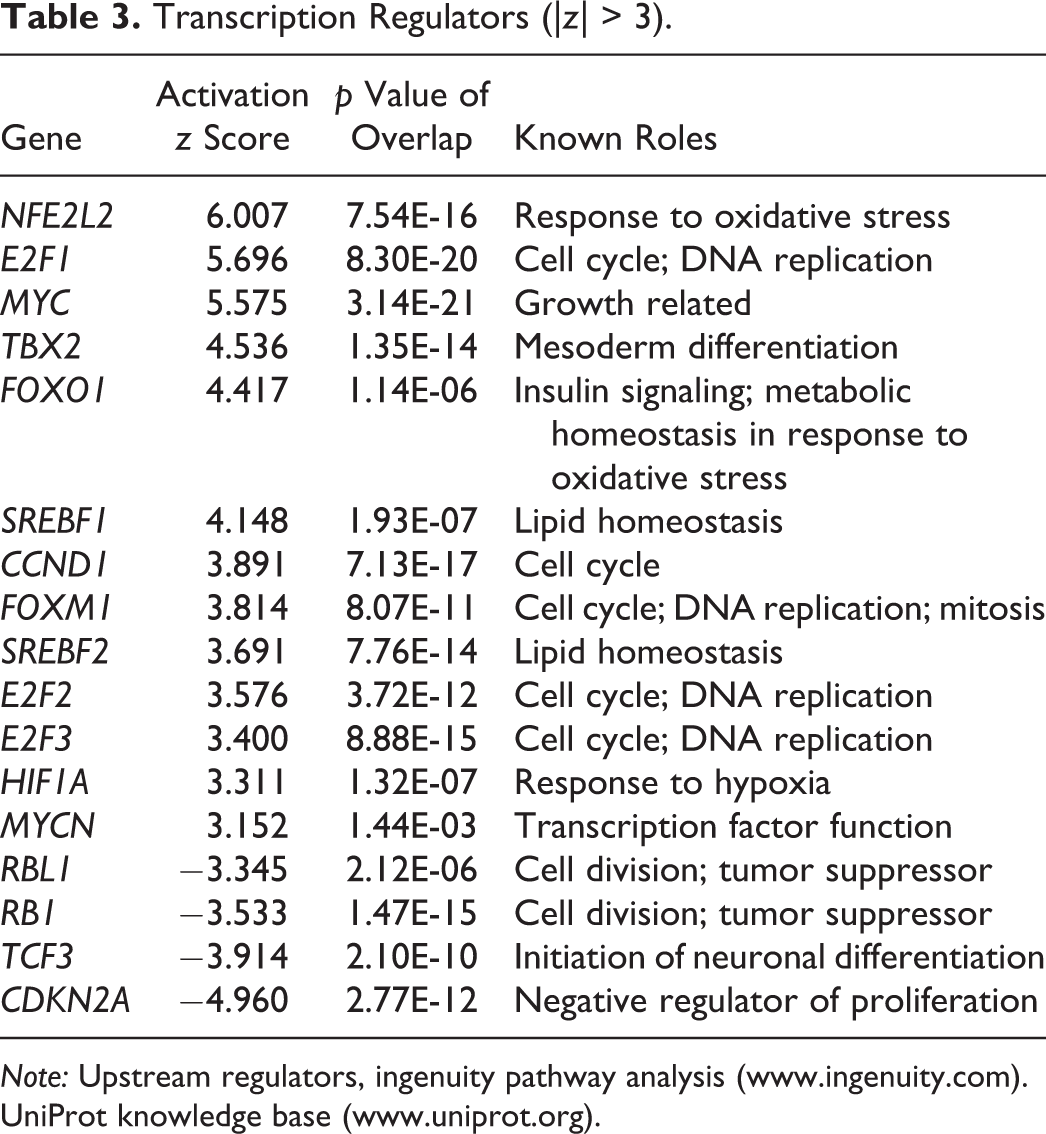
Note: Upstream regulators, ingenuity pathway analysis (www.ingenuity.com). UniProt knowledge base (www.uniprot.org).
DMPT exposure caused upregulation of 35/180 transcripts (e.g., Akr7a3, Maff, and Mgft3) in the NrF2 pathway (Supplement 2), a primary regulator of antioxidant response (Franco et al. 2014; Johnson et al. 2008). Expression of other antioxidant response genes was also increased (e.g., Srxn1, G6pd, and Prdx4; Bensellam et al. 2015).
Transcripts characteristic of epithelial-derived cancers (e.g., Slc7A11, Maff, Igfb3, and Igfb6) were upregulated more than 1.5-fold (Supplement 3). Cell proliferation signals were also upregulated (Supplement 4). DMPT gene transcript changes were predicted to alter cell death, necrosis, and/or apoptosis processes (e.g., ↓Gp2 and Ccno; Supplement 5).
In addition to upregulation of the protein transporter Slc7a11 (↑17.4), other membrane transporters were upregulated including Slc14a1 (↑4.6), Slc4a7 (↑3.2), Slc4A4 (↑3.0), Slc6a9 (↑2.9), Slcba1 (↑2.6), and Slc1a5 (↑2.5; Supplement 1).
NextBio software (accessed May 15, 2015) was used to compare the DMPT transcript changes with thousands of other microarray data sets accessed by algorithm. NextBio analysis showed the transcriptional changes induced by DMPT were most similar to those in the nasal cavity of adult male F344CrlBR rat following formaldehyde exposure (Supplement 6; Andersen et al. 2010). There were over 1,000 shared transcripts that were significantly changed by both DMPT and formaldehyde exposure. This included upregulation of Sprr1a, SLC7a11, Akr7a3, Scin, Maff, Psca, and Cyp3a9 and downregulation of Fhit, Nrgn, and Ace. The DMPT nasal cavity used for this transcriptomic analysis was transitional epithelium, while the nasal sample in the formaldehyde transcriptomic analysis contained transitional cell epithelium and other portions of the nasal cavity (e.g., respiratory epithelium; Andersen et al. 2010).
Discussion
After a 5-day DMPT exposure, nasal cavity lesions developed in male F344/N rats, including hyperplasia of the transitional epithelium and degeneration/necrosis of the olfactory epithelium (at 60 and 120 mg/kg). Nasal lesions observed in this 5-day study occurred at the same target site of nasal cancer (transitional cell epithelium) as found in the 2-yr DMPT rat study (NTP 2012). In previous studies, after 13 weeks of DMPT exposure, there was treatment-related methemoglobinemia formation (NTP 2012), which occurs by oxidation of the heme moiety (Pallais, Mackool, and Pitman 2011). Data from the current study support a hypothesis that DMPT nasal toxicity and carcinogenicity effects are the result of oxidative damage (Dunnick et al. 2014; El-Gebali et al. 2013; NTP 2012).
The nasal cavity contains a low level of antioxidant-associated mucosubstances (Harkema, Carey, and Wagner 2006), making it susceptible to DMPT-induced oxidative damage. While 5 days of DMPT exposure were not sufficient for methemoglobin formation, it was sufficient for induction of nasal cavity transitional epithelium toxicity and gene transcript changes. This included activation of an Nrf2 antioxidant response, a process that protects from oxidative stress-induced cell death (Johnson et al. 2008) and provides antioxidant defense and maintenance of cellular redox potential (Franco et al. 2014). Upregulation of transcripts in the Nrf2 pathway included Mgst3 (microsomal glutathione S-transferase 3), G6pd (glucose-6-phosphate dehydrogenase), and Txnrd1 (thioreductase), whose protein products can function to reduce oxidative stress (Johnson et al. 2008). In addition, Nq01 (nicotinamide adenine dinucleotide phosphate dehydrogenase, quinone 1), a major cellular detoxification transcript, was upregulated (Nguyen, Nioi, and Pickett 2009).
Other transcripts induced by DMPT were Slc7a11 and Akr7a3 (Katsuoka et al. 2005). Slc7a11 protein regulates cysteine–glutamate exchange and maintenance of glutathione levels (Y. Huang et al. 2005). Akr7a3 expression occurs in the liver after aflatoxin treatment of rats and is a common defense mechanism after free radical generation in several tissue types (Merrick et al. 2012, 2013).
DMPT-induced transcripts included those associated with promoting and sustaining cell proliferation. This included increased expression of transcripts for Maff (a fibrosarcoma oncogene), Ras-related oncogene (Rhov), Psca (prostate oncogene), Casc (cancer susceptibility candidate 3), and Krt4 (an epithelial structural protein). Other transcripts upregulated are involved in xenobiotic metabolism (Cyp3a13; Anakk et al. 2003; Liu et al. 2013) or fatty acid transport (Fabp5; Fang et al. 2010). After long-term exposure, the upregulation of Ngfr (nerve growth factor receptor) may also enable cell proliferation (Jobling et al. 2015). Upstream regulators of the DMPT-induced nasal transcripts were predicted (based on Ingenuity Pathway Analysis) to be involved in carcinogenesis (e.g., MYC; Ng et al. 2011).
DMPT increased solute carrier transcripts that code for membrane transporters of various cell nutrients (El-Gebali et al. 2013; Hediger et al. 2013). An increase in the ability to transport nutrients into the cell can provide energy and building blocks for cell proliferation (Bhutia et al. 2015). Blocking membrane transporters has been proposed as a potential target for cancer therapy (El-Gebali et al. 2013).
DMPT transcript changes created a pattern consistent with changes that could eventually lead to a decrease in cell death and apoptosis including upregulation of (1) Scin, a transcript coding for the scinderin protein, which renders cells resistant to cytotoxic T-lymphocyte-associated lysis (Hasmim et al. 2013), (2) Srxn1 (sulfiredoxin), which codes for an enzyme that catalyzes the reduction of free radicals and prevents apoptosis (Baek et al. 2012), (3) Igfbp6 whose protein promotes cell survival and inhibits apoptosis (Xu et al. 2009), and (4) Acaa whose protein promotes attenuation of the activity of BNIP3, a proapoptotic protein (Cao et al. 2008).
DMPT-induced transcript changes suggest that events leading to apoptosis could eventually be suppressed. This included decreased expression of transcripts for (1) Ccno (cyclin) involved in apoptosis induction (Roig et al. 2009), (2) Gp2 (glycoprotein 2) coding for a structural protein reported to decrease cell proliferation (Werner et al. 2012), (3) Fhit (fragile histidine triad gene transcript) whose protein promotes apoptosis and suppresses cell proliferation (Q. Huang et al. 2014), and (4) Ace (angiotensin converting enzyme transcript), an enzyme which converts angiotensin I to the physiologic active peptide angiotensin II, a proapoptotic protein (X. Wang et al. 2015; Yi et al. 2014). Two other transcripts downregulated were Ermn, whose protein is an oligodendrocyte-specific protein surrounding myelin axons necessary for action potentials (Brockschnieder et al. 2006), and Nrgn involved in promoting synaptic transmission (Zhong et al. 2009).
Some of the DMPT-induced transcripts have multiple functions. For example, Nrgn (Parsi et al. 2012) and BcL2L11 (Kuan et al. 2000; Petrocca, Vecchione, and Croce 2008) have both a proapoptotic function and a tumor suppressor function (Parsi et al. 2012).
The DMPT transcript patterns were similar to those in the rat nasal cavity after formaldehyde exposure (Andersen et al. 2010), a nasal cavity carcinogen in both rats and humans (International Agency for Research on Cancer 2012). DMPT and formaldehyde both induced transcripts characteristic of an antioxidant response (e.g., Akr7a3 and Srxn1), transcripts in cancer (e.g., Maff and Psca), and transcripts in cell proliferation and differentiation (e.g., Sprr1a). PSCA is usually associated with prostate cancer (Yang et al. 2014) but now appears to also be an important transcript in the nasal cavity. Sprr1a (small proline-rich protein 1a) is considered to be an early biomarker of epithelial cell differentiation and is also upregulated after tobacco smoke exposure (Tesfaigzi et al. 1996). Downregulation of Fhit was seen with both formaldehyde and DMPT and also reported to be downregulated after other carcinogen exposures (Merrick et al. 2012). Additional transcriptomic studies with other nasal carcinogens would add to our knowledge on the use of early molecular makers for identifying toxic and carcinogenic processes in the nasal cavity (e.g., ↑Akr7a3, Srxn, Maff; Psca; and ↓Fhit). Development of such biomarkers would help facilitate the use of fewer animals and shorter-term studies for hazard identification.
DMPT transcript changes included upregulation of antioxidative stress pathways. Other studies show that oxidative stress can eventually lead to DNA damage (Klaunig et al. 2011) and promote disease pathways. This is a possible mechanism for DMPT-induced disease (Figure 7). DMPT nasal cavity molecular changes were characteristic of events leading to increased cell proliferation and decreased apoptosis often considered to be hallmarks of cancer (Hanahan and Weinberg 2011). Molecular changes in the nasal cavity after DMPT exposure suggest that oxidative damage is a contributory mechanism for the DMPT toxicity and/or carcinogenic effects.
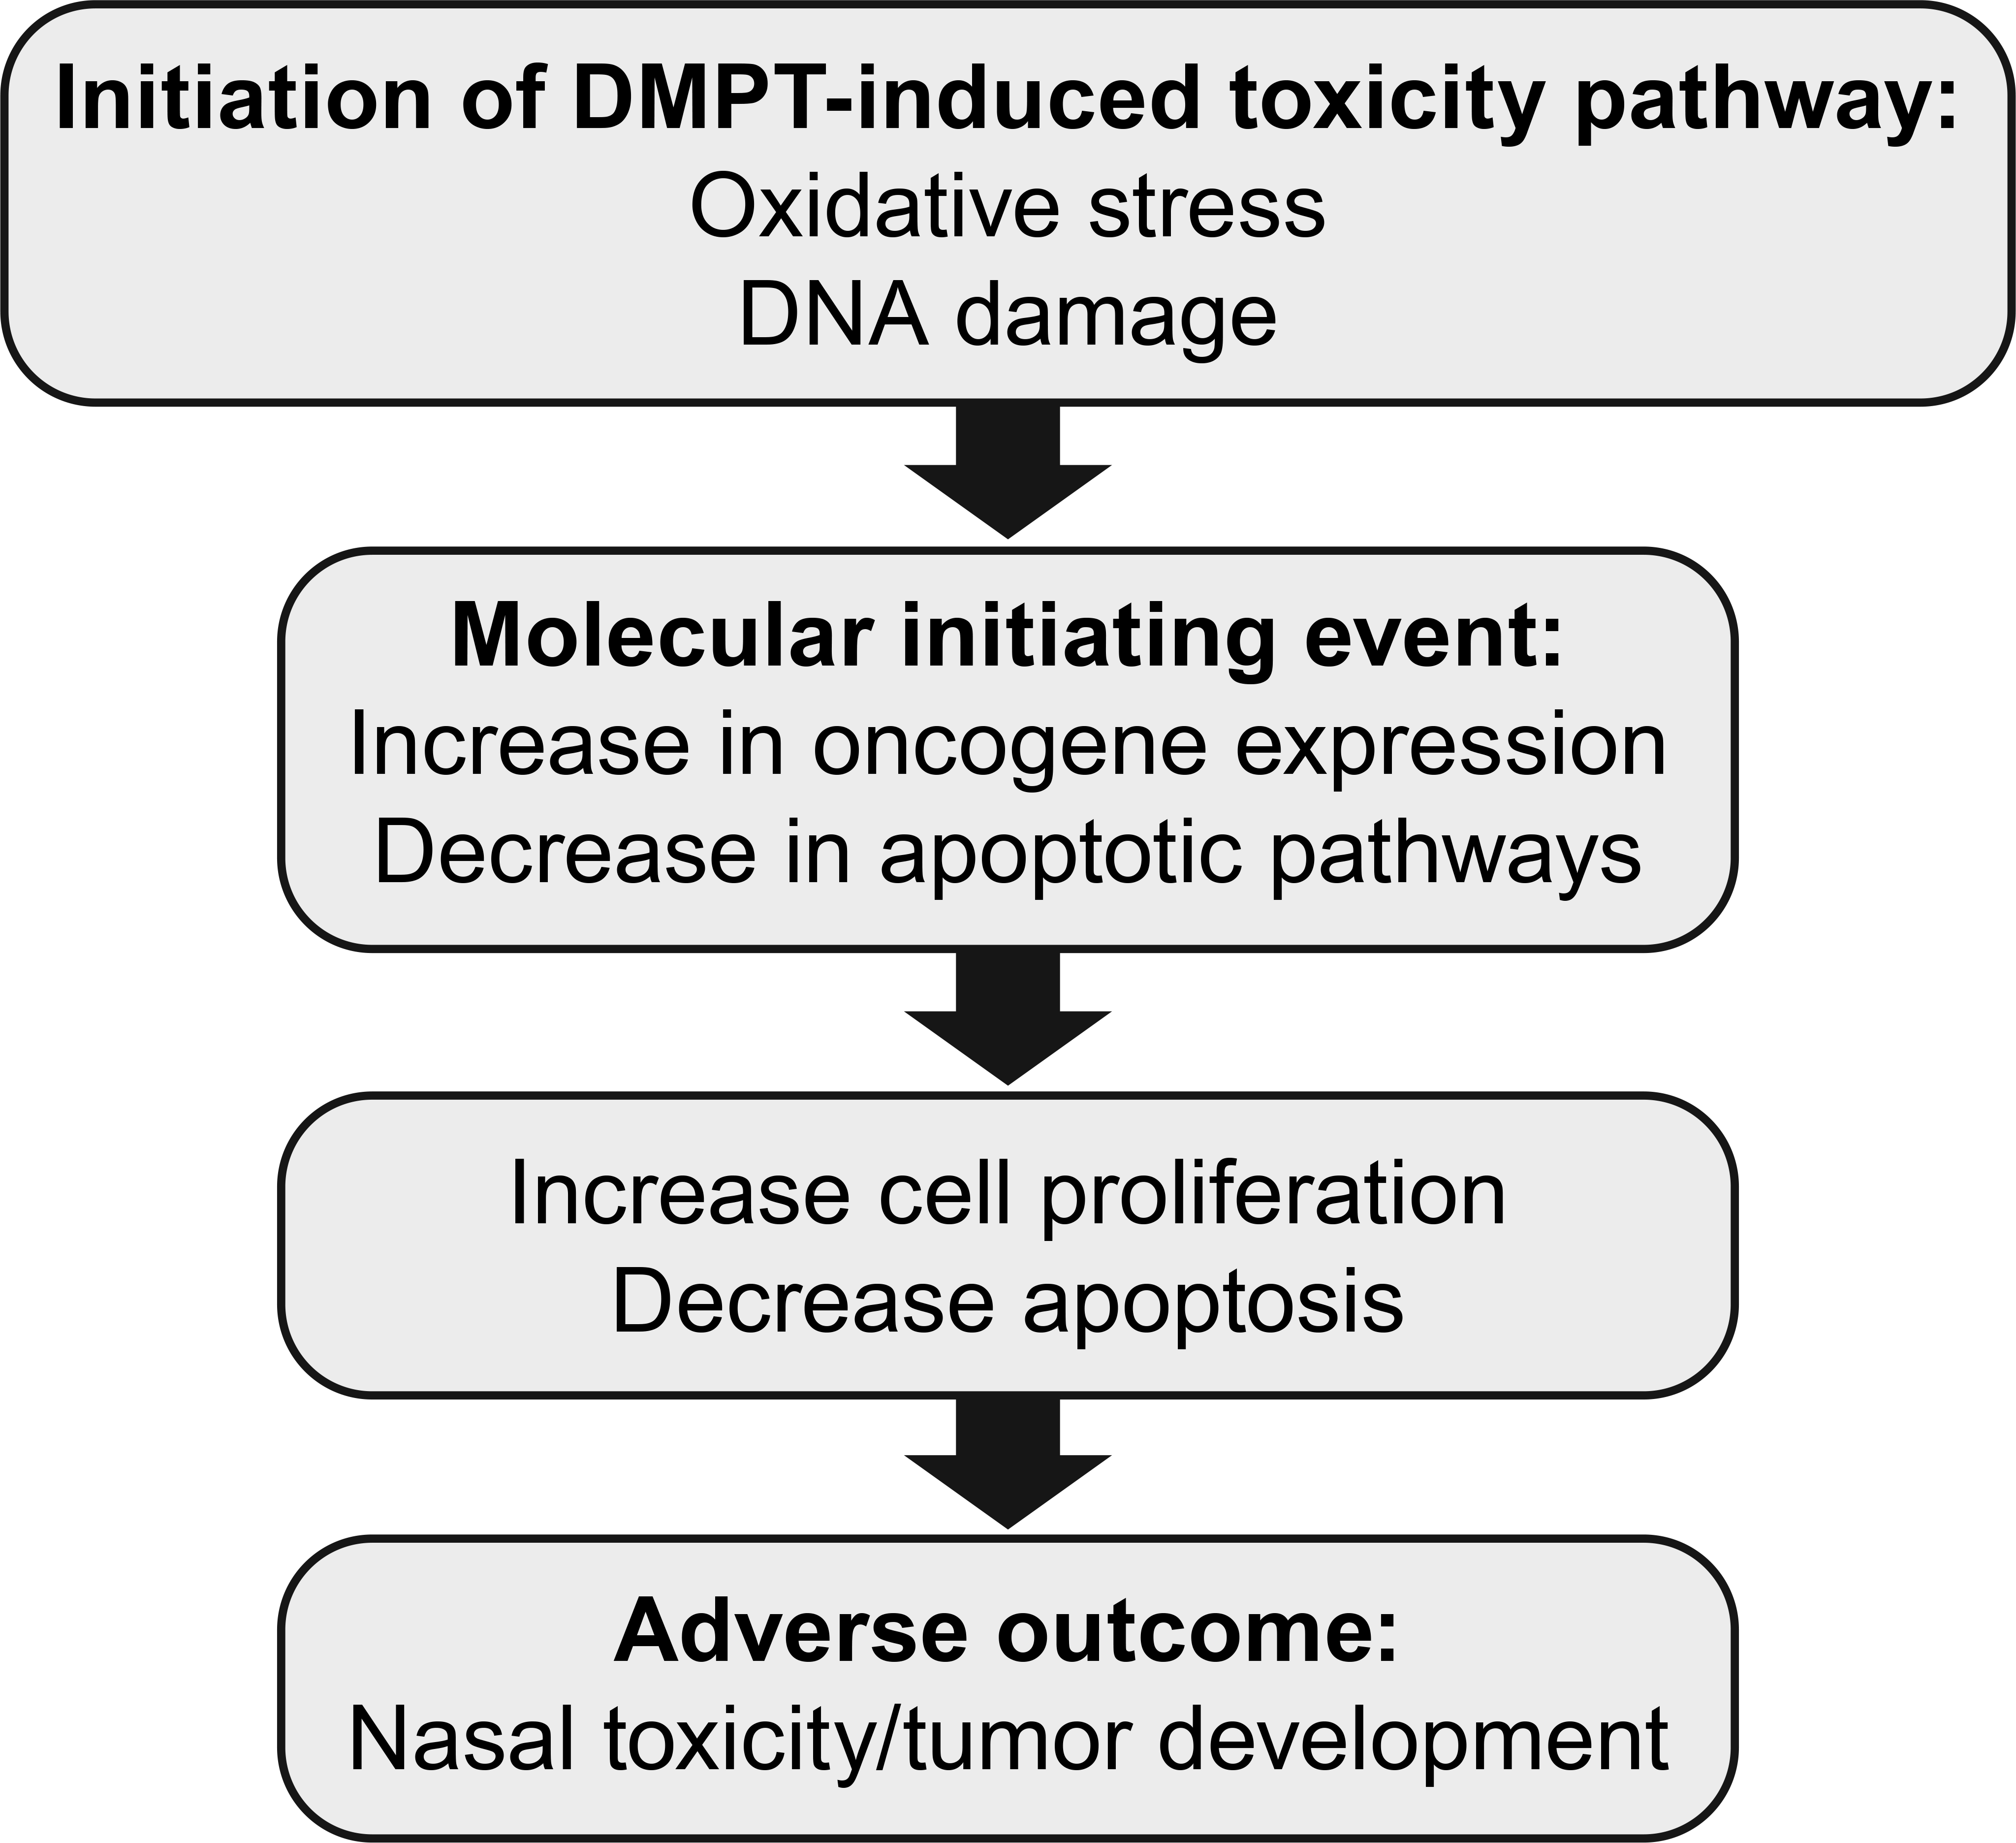
Proposed N, N-dimethyl-p-toluidine nasal cavity toxicity pathways.
Footnotes
Acknowledgments
We gratefully acknowledge technical support from B. Mahler, E. Hou, R. Fannin, O. Lyght, and R. Wilson. The in-life portion of this study was conducted under NIEHS contract NO1-ES-75561 with Alion Science & Technology, Inc. We thank Drs. M. Cesta and D. Malarkey (NIEHS) for their excellent review of the article.
Author Contributions
Authors contributed to conception or design (JD, BM, AB, DM, GF, JF, KS, YW). All authors (JD, BM, AB, DM, KG, GF, JF, KS, YW) contributed to the data acquisition, analysis, or interpretation; drafting and critically revising the manuscript and gave final approval and agreed to be accountable for all aspects of work in ensuring that questions relating to the accuracy or integrity of any part of the work are appropriately investigated and resolved.
Authors’ Note
The statements, opinions, or conclusions contained therein do not necessarily represent the statements, opinions, or conclusions of NIEHS, NIH, or the U. S. government.
Declaration of Conflicting Interests
The author(s) declared no potential conflicts of interest with respect to the research, authorship, and/or publication of this article.
Funding
The author(s) disclosed receipt of the following financial support for the research, authorship, and/or publication of this article: The intramural program of the National Institute of Environmental Health Sciences (NIEHS), Research Triangle Park, NC, supported this work.
References
Supplementary Material
Please find the following supplemental material available below.
For Open Access articles published under a Creative Commons License, all supplemental material carries the same license as the article it is associated with.
For non-Open Access articles published, all supplemental material carries a non-exclusive license, and permission requests for re-use of supplemental material or any part of supplemental material shall be sent directly to the copyright owner as specified in the copyright notice associated with the article.