
Abstract
Given the proven utility of natriuretic peptides as serum biomarkers of cardiovascular maladaptation and dysfunction in humans and the high cross-species sequence conservation of atrial natriuretic peptides, natriuretic peptides have the potential to serve as translational biomarkers for the identification of cardiotoxic compounds during multiple phases of drug development. This work evaluated and compared the response of N-terminal proatrial natriuretic peptide (NT-proANP) and N-terminal probrain natriuretic peptide (NT-proBNP) in rats during exercise-induced and drug-induced increases in cardiac mass after chronic swimming or daily oral dosing with a peroxisome proliferator-activated receptor γ agonist. Male Sprague-Dawley rats aged 8 to 10 weeks were assigned to control, active control, swimming, or drug-induced cardiac hypertrophy groups. While the relative heart weights from both the swimming and drug-induced cardiac hypertrophy groups were increased 15% after 28 days of dosing, the serum NT-proANP and NT-proBNP values were only increased in association with cardiac hypertrophy caused by compound administration. Serum natriuretic peptide concentrations did not change in response to adaptive physiologic cardiac hypertrophy induced by a 28-day swimming protocol. These data support the use of natriuretic peptides as fluid biomarkers for the distinction between physiological and drug-induced cardiac hypertrophy.
Keywords
Introduction
Cardiotoxicity is a major reason for the preclinical failure of compounds in development as well as for the withdrawal of approved drugs due to unexpected adverse postmarket cardiovascular events (Fermini and Fossa 2003; Ferri et al. 2013; Laverty et al. 2011; Redfern et al. 2010; Stevens and Baker 2009). Regardless of causality, postmarket withdrawal of approved drugs places patients’ lives at risk. Advances in the areas of genetics and imaging technologies have provided greater mechanistic understanding of drug-induced cardiotoxicity; however, additional tools are needed to provide a more complete cardiovascular risk assessment of new medicines early in development.
Cardiac hypertrophy is the general term for the highly coordinated, complex growth of the heart. Hypertrophy can occur as the myocardium adapts during life events such as growth or pregnancy, or it can be induced by chronic cardiovascular exercise (Frey and Olson 2003). Hypertrophy of the myocardium can also occur in response to myocardial insult such as chronic sustained hypertension, myocardial infarction, or as the result of drug-induced cardiotoxicity, such as with peroxisome proliferator–activated receptor (PPAR) agonists (Friedland et al. 2012; Frey and Olson 2003). As such, identifying drugs that induce a hypertrophic response of the myocardium has been a major focus of pharmaceutical companies and regulatory agencies alike. The current paradigm for nonclinical assessment of drug-induced cardiovascular effects consists of relative and absolute heart weight (HW) measurement followed by histomorphological evaluation; however, these measurements have limitations with respect to the detection and characterization of hypertrophic changes. For example, measurement of end of study of HW depends on sufficient duration of treatment to cause a significant change in HW and provides limited information on the mechanism of damage and temporal dynamics of changes in cardiac mass. Often, these changes are equivocal and rarely present as a robust dose-responsive increase, especially in short-duration studies (e.g., 4 to 7 days). Histopathological examination of the heart at the end of treatment rarely provides evidence of cardiac hypertrophy unless the toxicity is severe enough, or has persisted over a period of time long enough, to cause robust cardiomyocyte necrosis, collagen deposition, or myocardial disarray. In addition to these gaps, neither HW measurements nor histopathology can act as a translational tool that can be routinely utilized in the clinical setting. Serum biomarkers of cellular necrosis and acute myocyte injury (i.e., cardiac troponins [cTnI, cTnT], heart-type fatty acid binding protein [FABP3], creatine kinase-myocardial band [CK-MB], and myoglobin) are used in the clinic to detect cardiomyocyte membrane disruption, but these markers do not reflect changes in cardiac remodeling resulting from compound administration. Furthermore, despite clinically translatable imaging technologies such as echocardiography having advanced to a level of sensitivity allowing for the detection of structural and functional drug-induced cardiovascular effects in rodents, the application of these modalities during regulatory toxicology studies is limited due to a combination of a low throughput, high cost, intra- and interuser variability, and resistance to acceptance by the toxicology community.
Atrial and brain natriuretic peptides (ANP and BNP, respectively) are cardiac hormones primarily stored as granules on the atria and/or ventricles of the heart and released in response to stretch induced by increased pressure or neurohormonal stimuli (Levin, Gardner, and Samson 1998; Ramos and de Bold 2006; Ogawa and de Bold 2014; Toyoshima et al. 1996). Upon release, these peptides are cleaved into active and rapidly degraded peptides (ANP [t½ ∼ 30 sec] or BNP [t½ ∼ 6.4 min]) and inactive cleavage products with longer circulating half-lives (N-terminal [NT]-proANP [t½ ∼ 2.5 min] and NT-proBNP [t½ ∼ 15.5 min]; Semenov et al. 2011; Thibault et al. 1988). The relatively superior stability of NT-proANP and NT-proBNP make them attractive biofluid biomarkers, both preclinically and clinically. The active peptides act systemically on a broad range of physiological systems, specifically regulating water and sodium homeostasis, culminating in reduced systemic blood pressure (Zois et al. 2014). ANP and BNP have proven clinical utility for the assessment of heart failure, in particular, the severity of left ventricular systolic dysfunction (Dickstein et al. 1995; Jortani, Prabhu, and Valdes 2004; Lerman et al. 1993; Lloyd et al. 1994; Muders et al. 1997). Contrary to BNP, ANP is highly conserved across species thereby allowing NT-proANP to be potentially used in multiple species throughout the drug development process as a noninvasive, translational serum biomarker of cardiovascular modification (Vlasuk et al. 1986).
The objectives of this study were to investigate and compare the changes that occur to the cardiovascular serum biomarkers, NT-proANP and NT-proBNP, during adaptive left ventricular myocardial remodeling induced by a chronic swimming regimen and cardiac hypertrophy induced by chronic dosing with a PPARγ agonist. PPARγ agonists have been reported to cause decreased blood pressure, increased plasma volume, and increased HW in rats (Blasi et al. 2009).
Materials and Methods
All animal care protocols and experimental procedures were approved by the University of Rhode Island Institutional Animal Care and Use Committee in accordance with state and federal guidelines.
Animals
Male Sprague-Dawley rats (n = 42), aged 8 to 10 weeks and weighing 240 to 290 g (Charles River Laboratories, Raleigh, NC), were acclimated to housing, food, and water conditions for 7 days prior to the start of the study. Rats were cohoused in polycarbonate, solid-bottom cages in a temperature-controlled environment (22°C ± 2°C), an approximate 12-hr light–dark cycle with access to Purina Certified Rodent Diet #5002-9 (pellets) and reverse osmosis filtered water.
Dose Groups and Swimming Protocol
Animals were randomly assigned to 1 of 4 groups: (1) control (C), (2) active control (AC), (3) swimming (S), and (4) drug-induced hypertrophy (DI) groups. The C and AC groups consisted of 10 rats per group, while the S and DI groups consisted of 11 rats per group.
The control animals remained in the cage throughout the study aside from weekly sample collections, while the animals in the AC group swam twice daily for 2 min with each bout separated by 4 hr. Swim sessions occurred 7 days per week for 4 weeks, as has been published previously (Hickson, Hammons, and Holloszy 1979; Kaplan et al. 1994).
The S group participated in a progressive 4 week daily swimming protocol as follows:
Day 1—2 × 20-min swim sessions separated by 4 hr;
Day 2 to 7—2 swim sessions with duration increased by 10 min/session daily; and
Day 8 to 28—2 × 90-min sessions separated by no less than 4 hr.
Animals in the DI group were administered 100 mg/kg/day GI262570, a potent PPARγ agonist, once daily for 4 weeks. GI262570 has demonstrated plama volume expansion and cardiac hypertrophy in rats in a series of published and unpublished studies (Chen et al. 2005). The drug was prepared as a 10-mg/ml suspension in 0.5% hydroxypropyl methylcellulose/0.1% Tween 80 (in water) and was administered daily to rats by oral gavage at a dose volume of 10 ml/kg/day. The mixture was resuspended on a stir plate at room temperature for 20 min prior to daily oral dosing, and dose volumes were based on the most recent body weight (BW) data.
Clinical Chemistry
Blood (approximately 0.25 ml) for the determination of serum biomarkers was collected weekly from all rats in all groups. For animals in the S and AC groups, serial blood samples were obtained from the tail vein of unanesthetized restrained animals prior to initation of swimming or test article administration (baseline), along with immediately before the 1st and immediately after the 2nd swimming session on days 7, 14, 21, and 28. For all other animals (C and DI groups), nominal morning blood samples were collected from the tail vein at the same time that baseline samples were collected from the S and AC groups and then on days 7, 14, 21, and 28 at the same time as the preswim sampling in the S and AC groups. Following an overnight fast, a terminal blood sample was obtained from the abdominal aorta of deeply anesthetized (5% isoflurane) animals from all groups immediately prior to necropsy on day 29.
All blood samples were collected into labeled serum separator tubes and allowed to clot for at least 30 min at room temperature. After cold centrifugation (10 min at 6,000 to 15,000 g; 2°C to 8°C), serum samples were transferred to individually labeled amber screw-cap vials and stored at −70°C until analysis.
At the interim sample collections, serum was aliquoted into tubes for analysis of NT-proANP and NT-proBNP. The terminal collection sample was aliquoted into separate tubes for NT-proANP, NT-proBNP, and cTnI analysis.
Serum cTnI concentrations were measured in duplicate (50 μl each) as previously reported (Dunn et al. 2011) and according to the manufacturer’s recommendations using the Singulex Erenna Ultrasensitive Immunoassay system (Singulex, Alameda, CA). All samples were run concurrently using the same reagents.
The Biomedica™ (Vienna, Austria) proANP (1-98) ELISA kit was used to measure NT-proANP in 10 µl of serum in duplicate. The assay was performed according to the manufacturer’s protocol.
Amino-terminal proBNP concentrations in serum were measured in duplicate (50 µl each) at a 2-fold dilution according to the manufacturer’s recommendations using Meso-Scale Discovery’s (Rockville, MD) rat NT-proBNP assay kit.
For individual animals, final serum NT-proANP, NT-proBNP, and cTnI concentrations reported here are the means of the duplicate measurements. Group means were determined from all serum NT-proANP, NT-proBNP, and cTnI concentrations.
Gross and Anatomic Pathology
The brain and heart were weighed at necropsy on day 29. Hearts were fixed in neutral-buffered formalin, and longitudinal step sections that included the left ventricle and left atrium were processed to hematoxylin and eosin (H&E)- or picrosirius red–stained slides. Heart sections were microscopically examined by one study pathologist who had knowledge of the groups being evaluated but was blinded to serum biomarker data. Sections were scored according to a grading lexicon established by the Predictive Safety Testing Consortium. Lesions were scored as follows: minimal = difficult to identify at low magnification, very few small foci affected; mild = identifiable at low magnification, but limited tissue involvement; moderate = easily identifiable at low magnification, but minority of tissue affected; marked = obvious at low magnification, majority of tissue affected; and severe = most of the tissue affected with little capacity for increased severity. A picrosirius red stain was utilized to identify the presence of myocardial collagen.
Statistical Analysis
Statistical analysis was performed using standard statistical software (GraphPad Prism 6). Analysis of serum NT-proANP and NT-proBNP was performed using a 2-way repeated measures analysis of variance (ANOVA). Absolute and relative HWs were performed using a one-way ANOVA. Pearson’s product–moment correlation coefficient was applied to investigate associations between serum NT-proANP levels and relative hypertrophy. Data are reported as mean ± standard error of the mean with a calculated p value less than .05 considered significant.
Results
Clinical Chemistry
Serum NT-proANP and NT-proBNP concentrations relative to baseline values
Animals in the DI group presented with significantly elevated serum NT-proANP and NT-proBNP concentrations that were apparent by day 7 (Figures 1 and 2). Serum NT-proANP remained persistently elevated while NT-proBNP serum concentrations trended lower until day 28, when they were no longer statistically different and then increasing on day 29 (Figures 1 and 2). Baseline serum NT-proANP concentrations were significantly elevated in the S group relative to C and DI groups (Figure 3). Interestingly, animals that were exposed to water in any fashion (both S and AC groups) demonstrated a trend of decreasing serum NT-proANP over the course of the study. Similarly, the NT-proBNP values of the C, AC, and S groups decreased from baseline through day 14, after which they remained stable (Figure 2).
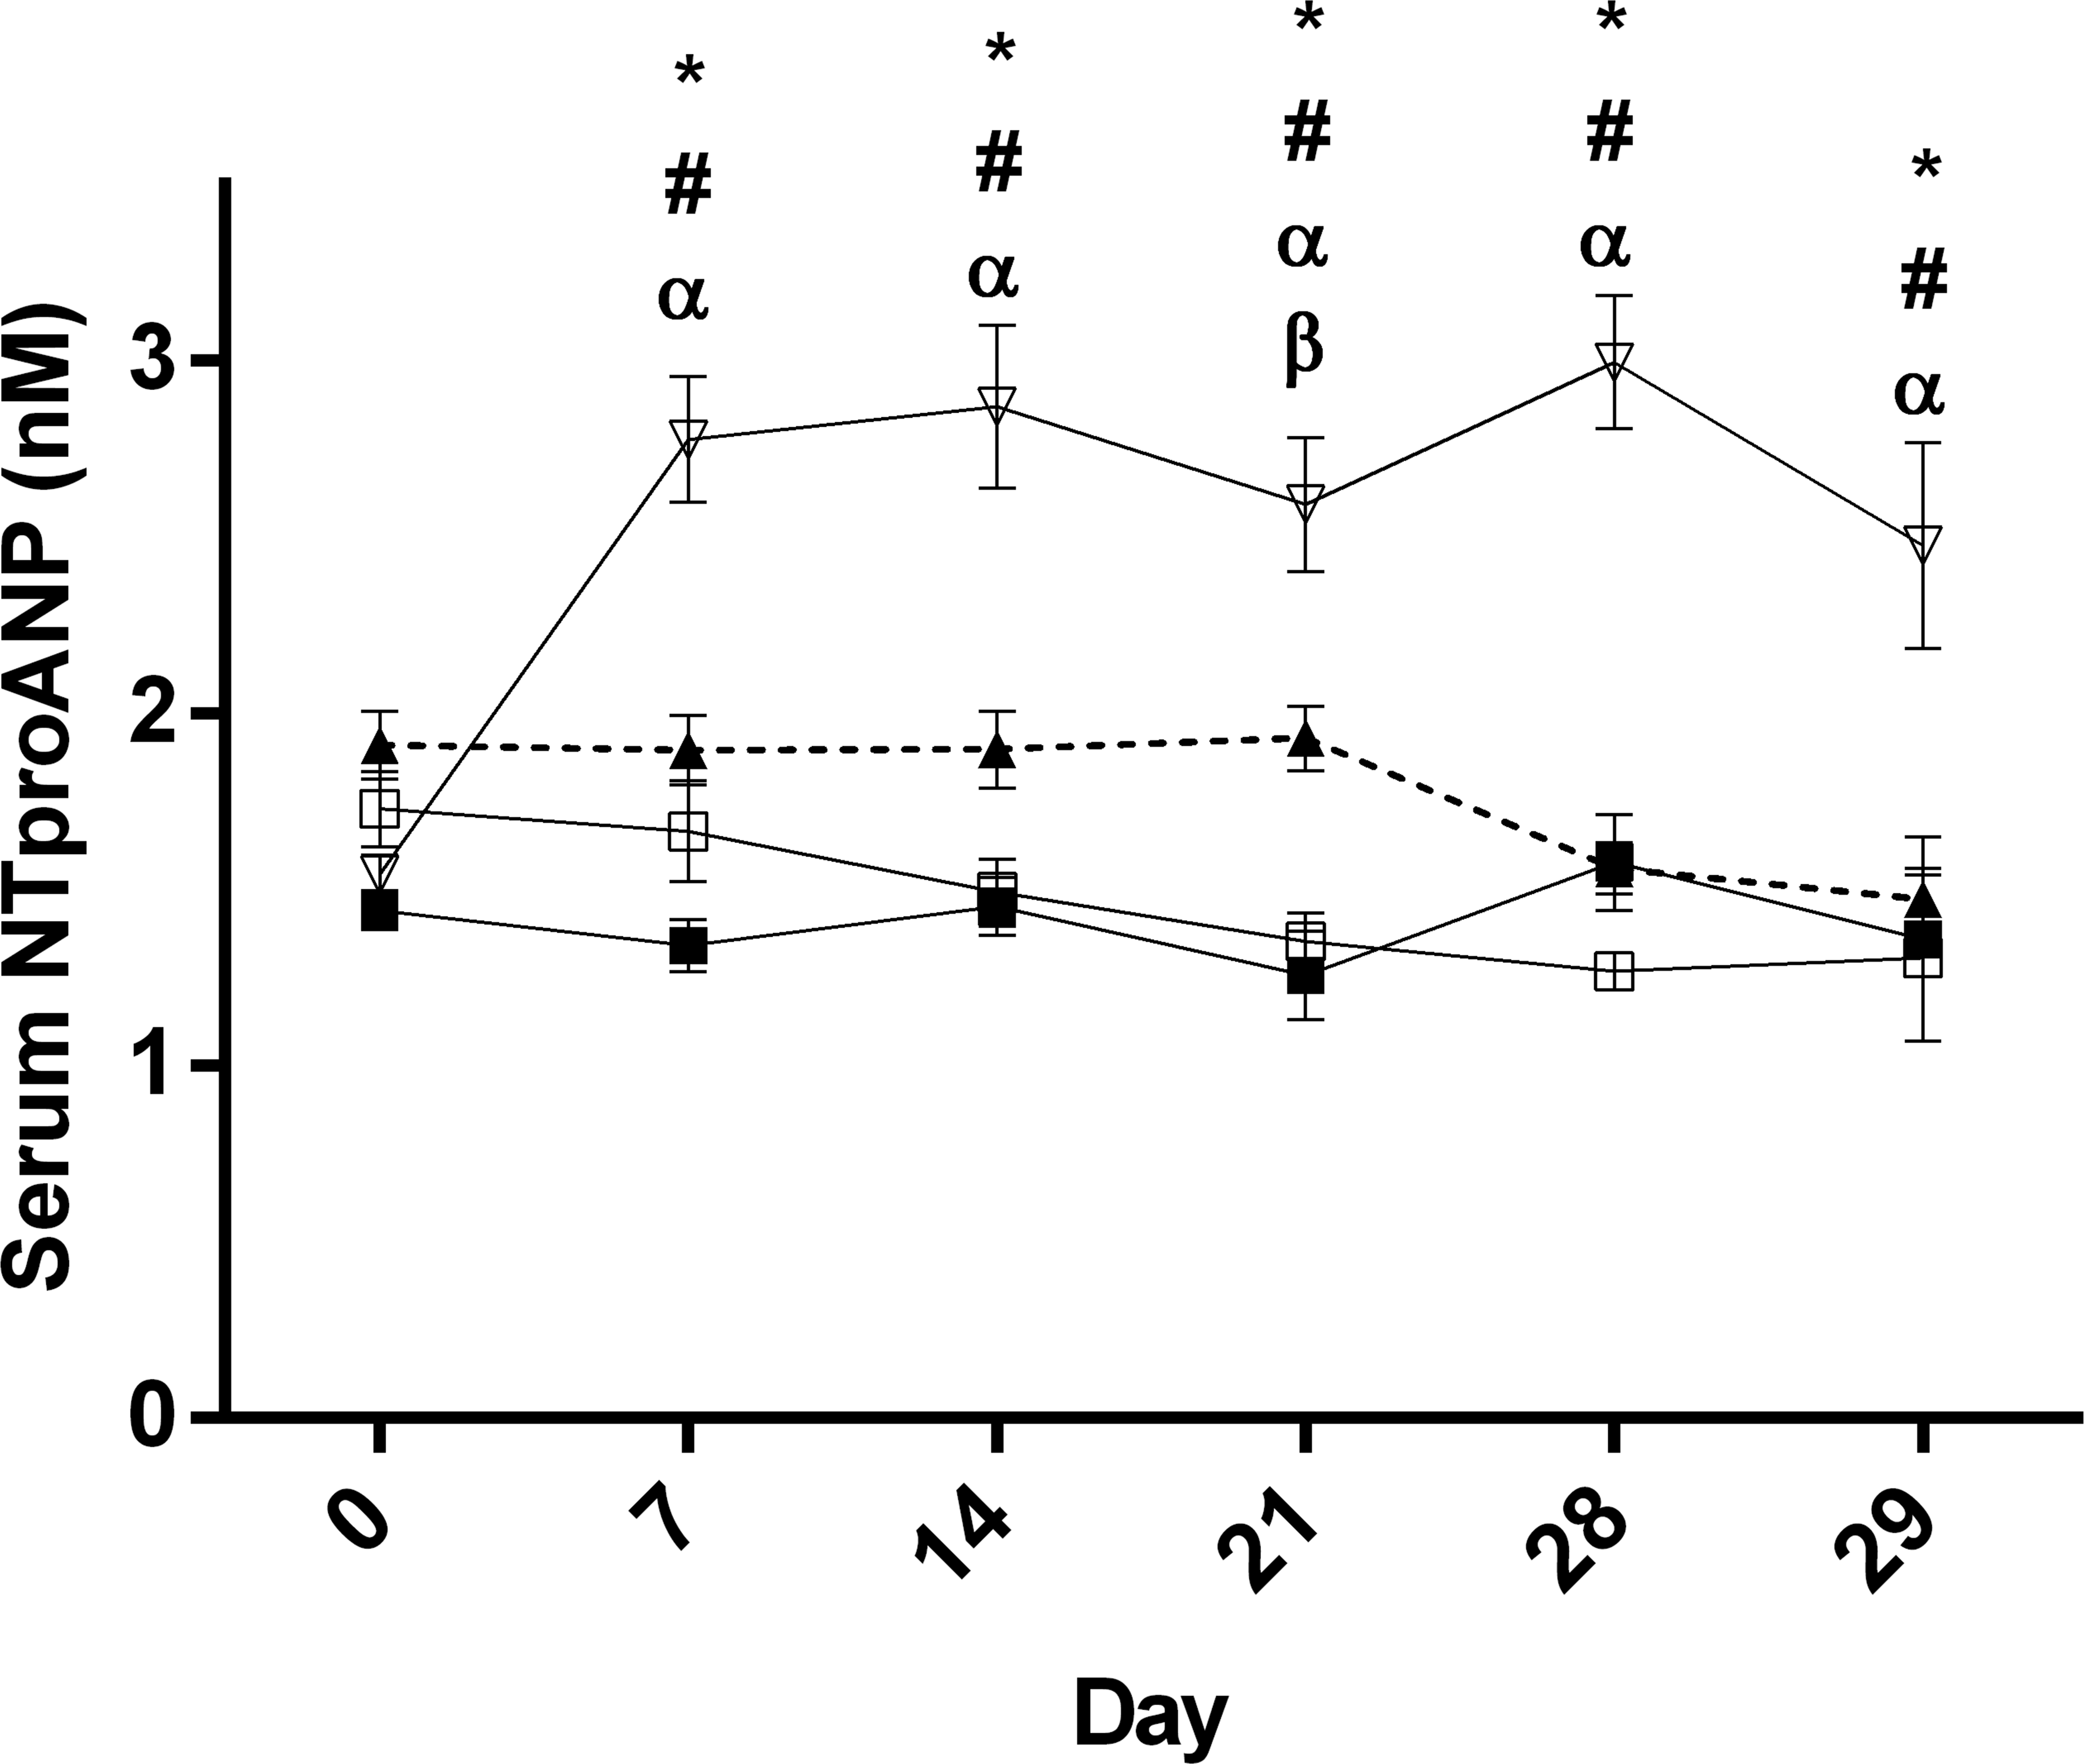
Group mean (±SEM) serum N-terminal proatrial natriuretic peptide concentrations; open triangles = drug treated, closed triangles = swim group, open squares = active control, and closed squares = control; *p < .05 control versus drug treated, α p < .05 active control versus drug treated; # p < .05 swim versus drug treated, and β p < .05 control versus swim.
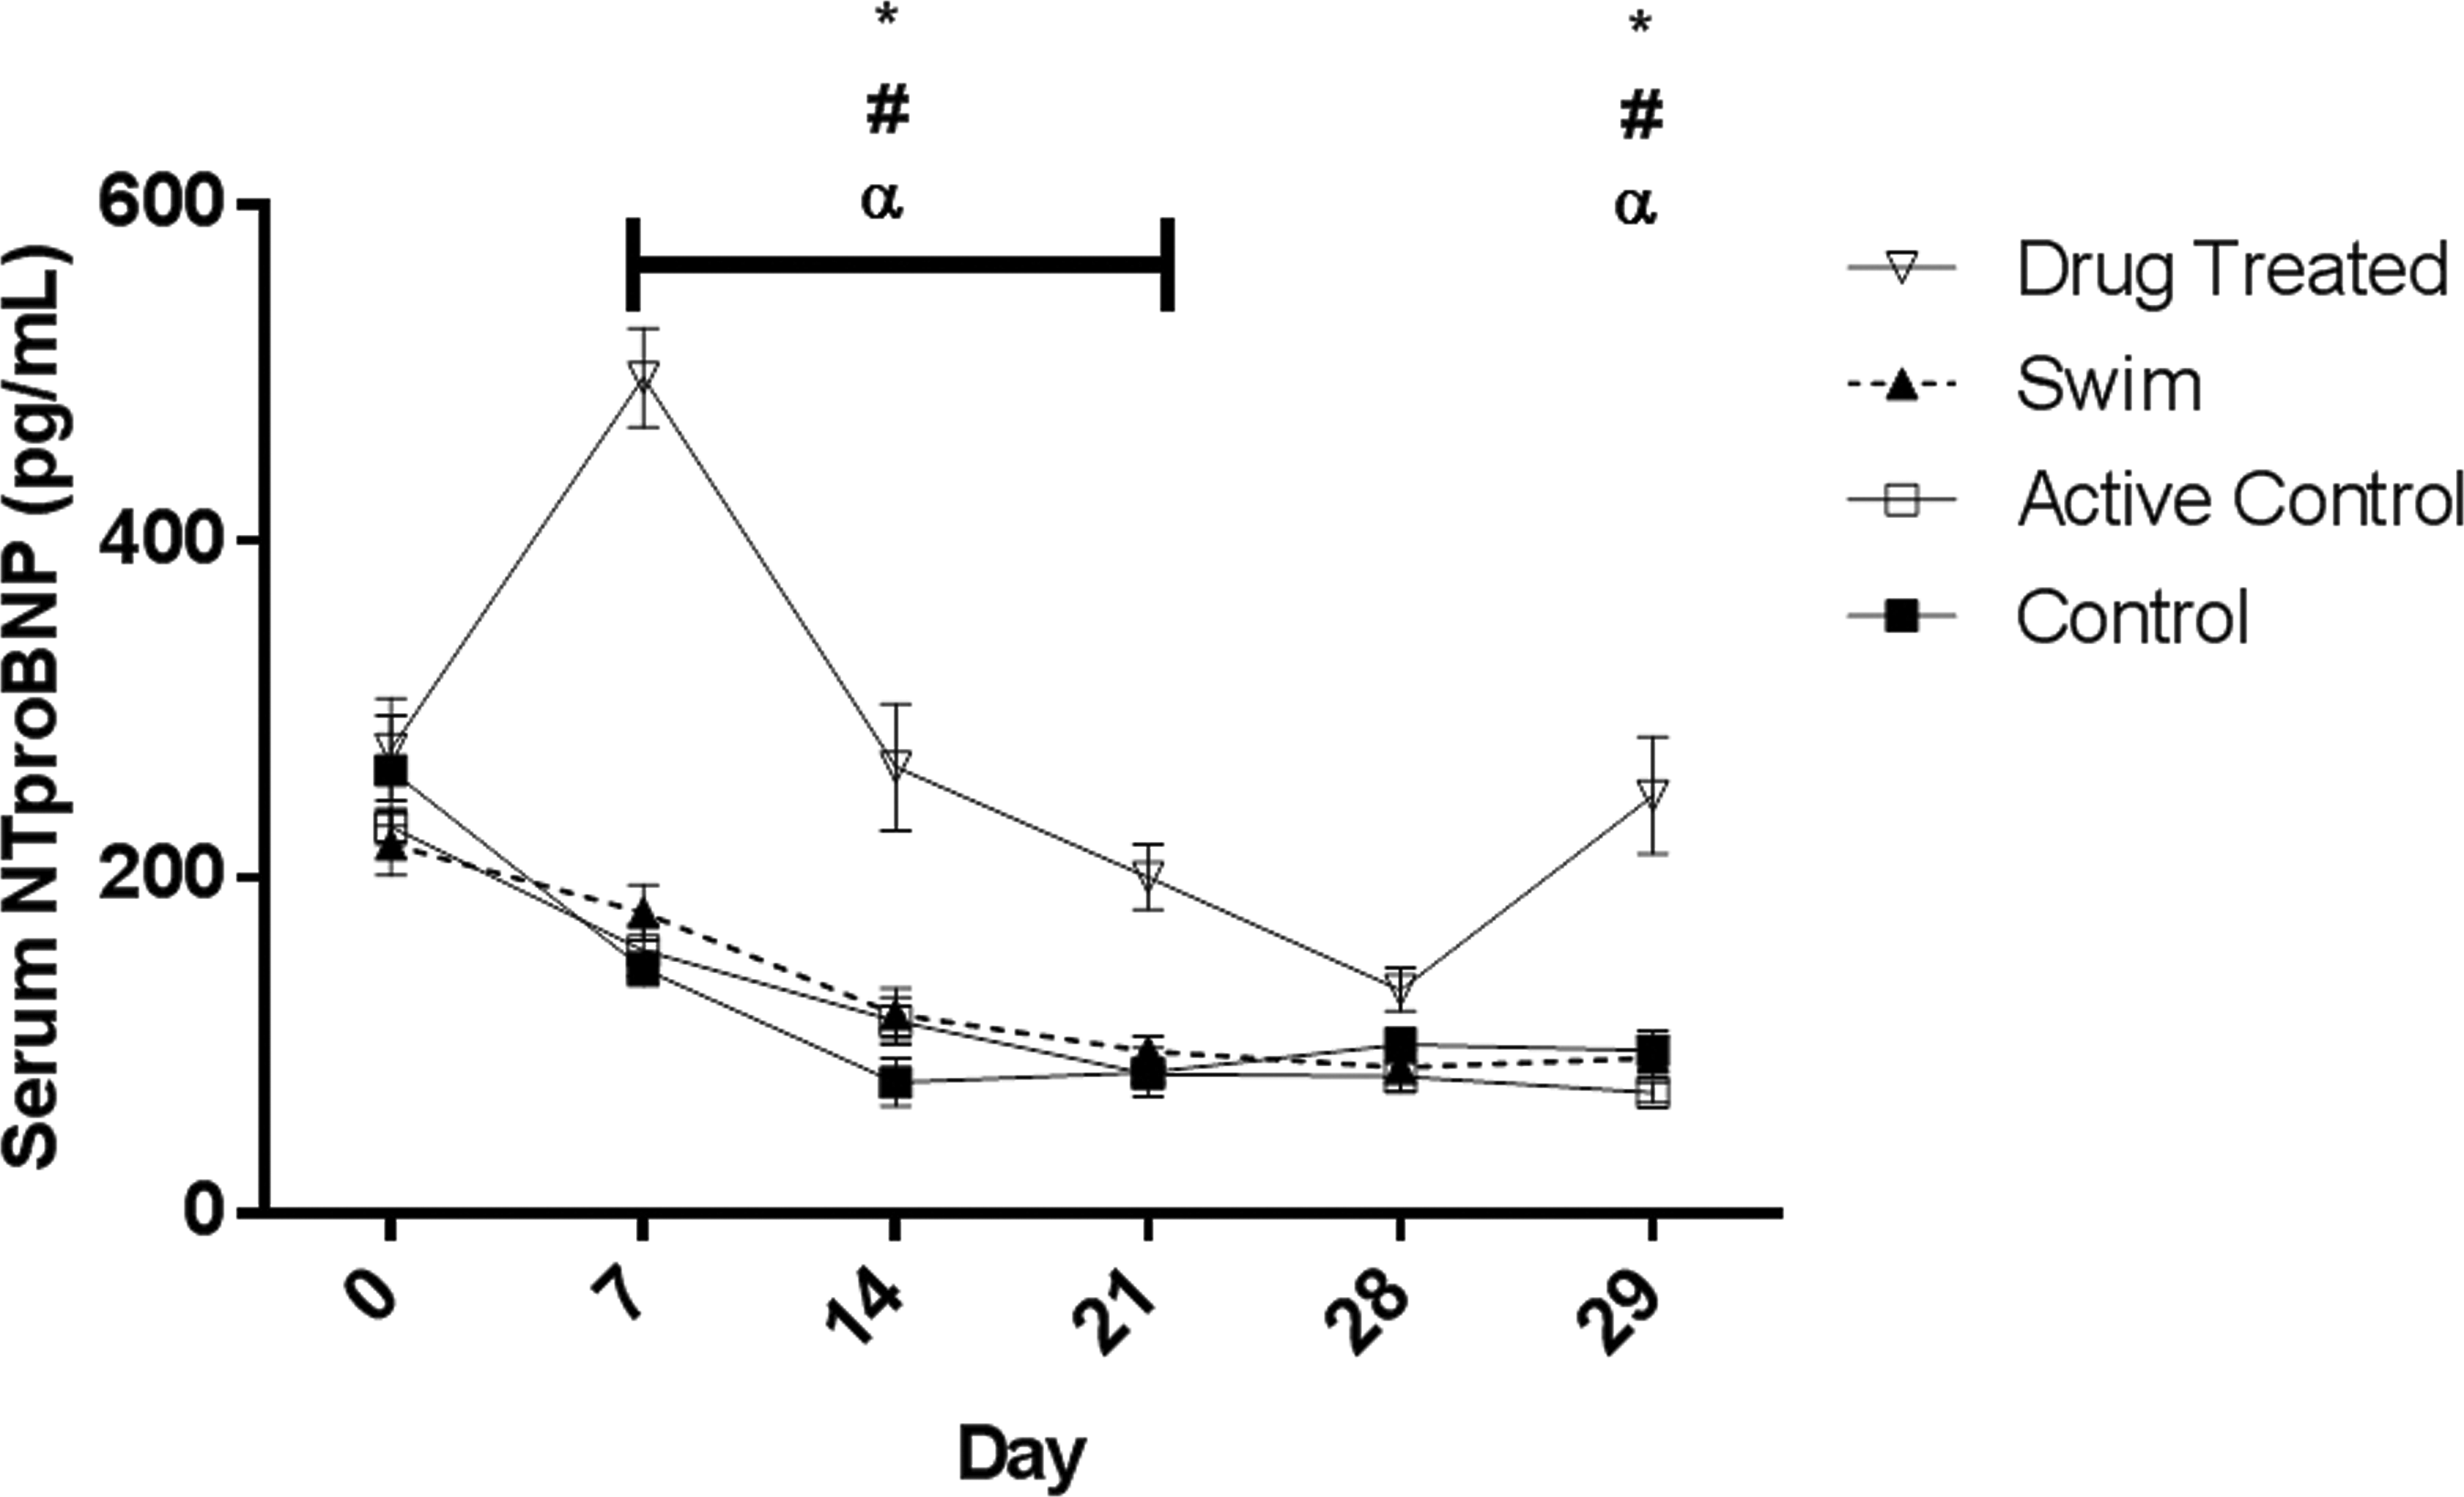
Group mean (±SEM) serum N-terminal probrain natriuretic peptide concentrations; open triangles = drug treated, closed triangles = swim group, open squares = active control, and closed squares = control; *p < .05 control versus drug treated, α p < .05 active control versus drug treated, and # p < .05 swim versus drug treated.
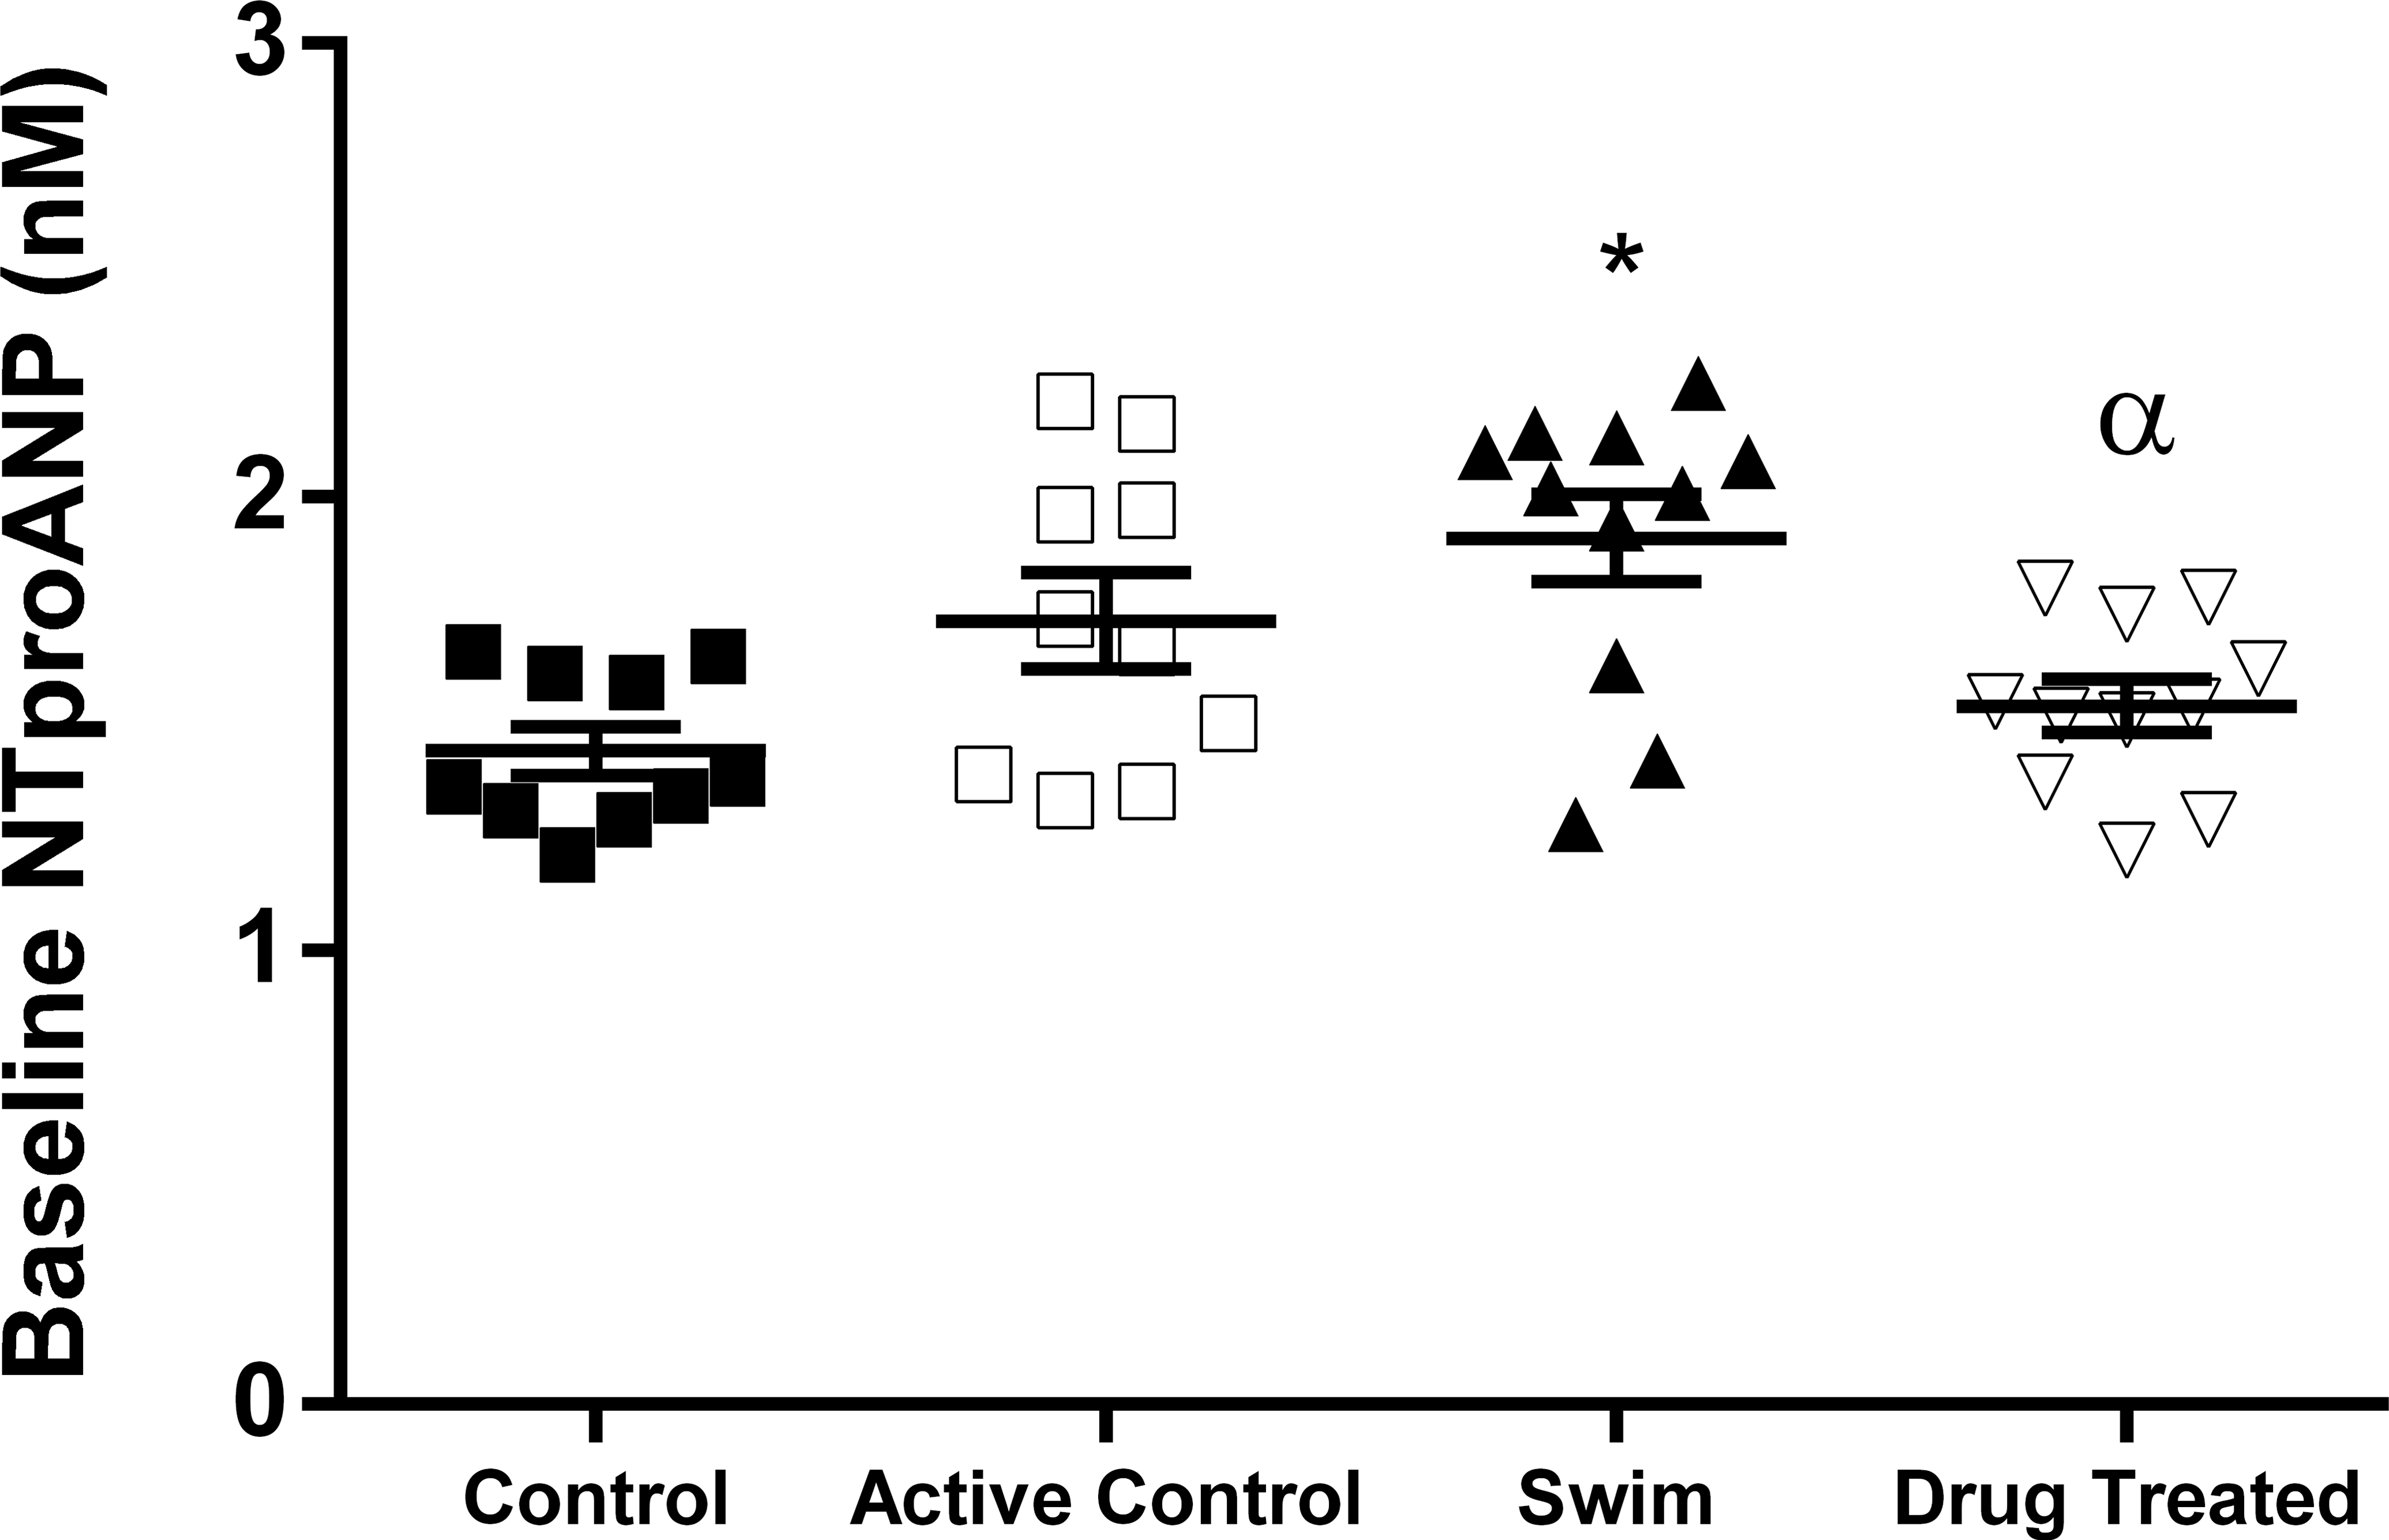
Baseline serum N-terminal proatrial natriuretic peptide concentrations; symbols represent individual animals, bars represent group mean (±SEM); *p < .05 versus control, α p < .05 versus swim.
Temporal dynamics of NT-proANP secretion in response to swimming
In an effort to characterize the temporal dynamics of NT-proANP secretion in response to exercise, serum was collected from S and AC group animals both prior to and immediately following the daily swim bouts on days 7, 14, and 21. Significant differences in serum NT-proANP concentrations between the swim and AC groups were consistently identified prior to swimming on study days 14 and 21 with equivalent concentrations detected following swimming (Figure 4). NT-proBNP concentrations were significantly different on day 7 with no difference between S and ACs, thereafter. The difference in response between NT-proANP and NT-proBNP may be related to the differential regulation of cardiac ANP and BNP in response to different stages of experimental heart failure as well as the hemodynamics in the individual chambers (Langenickel et al. 2000).
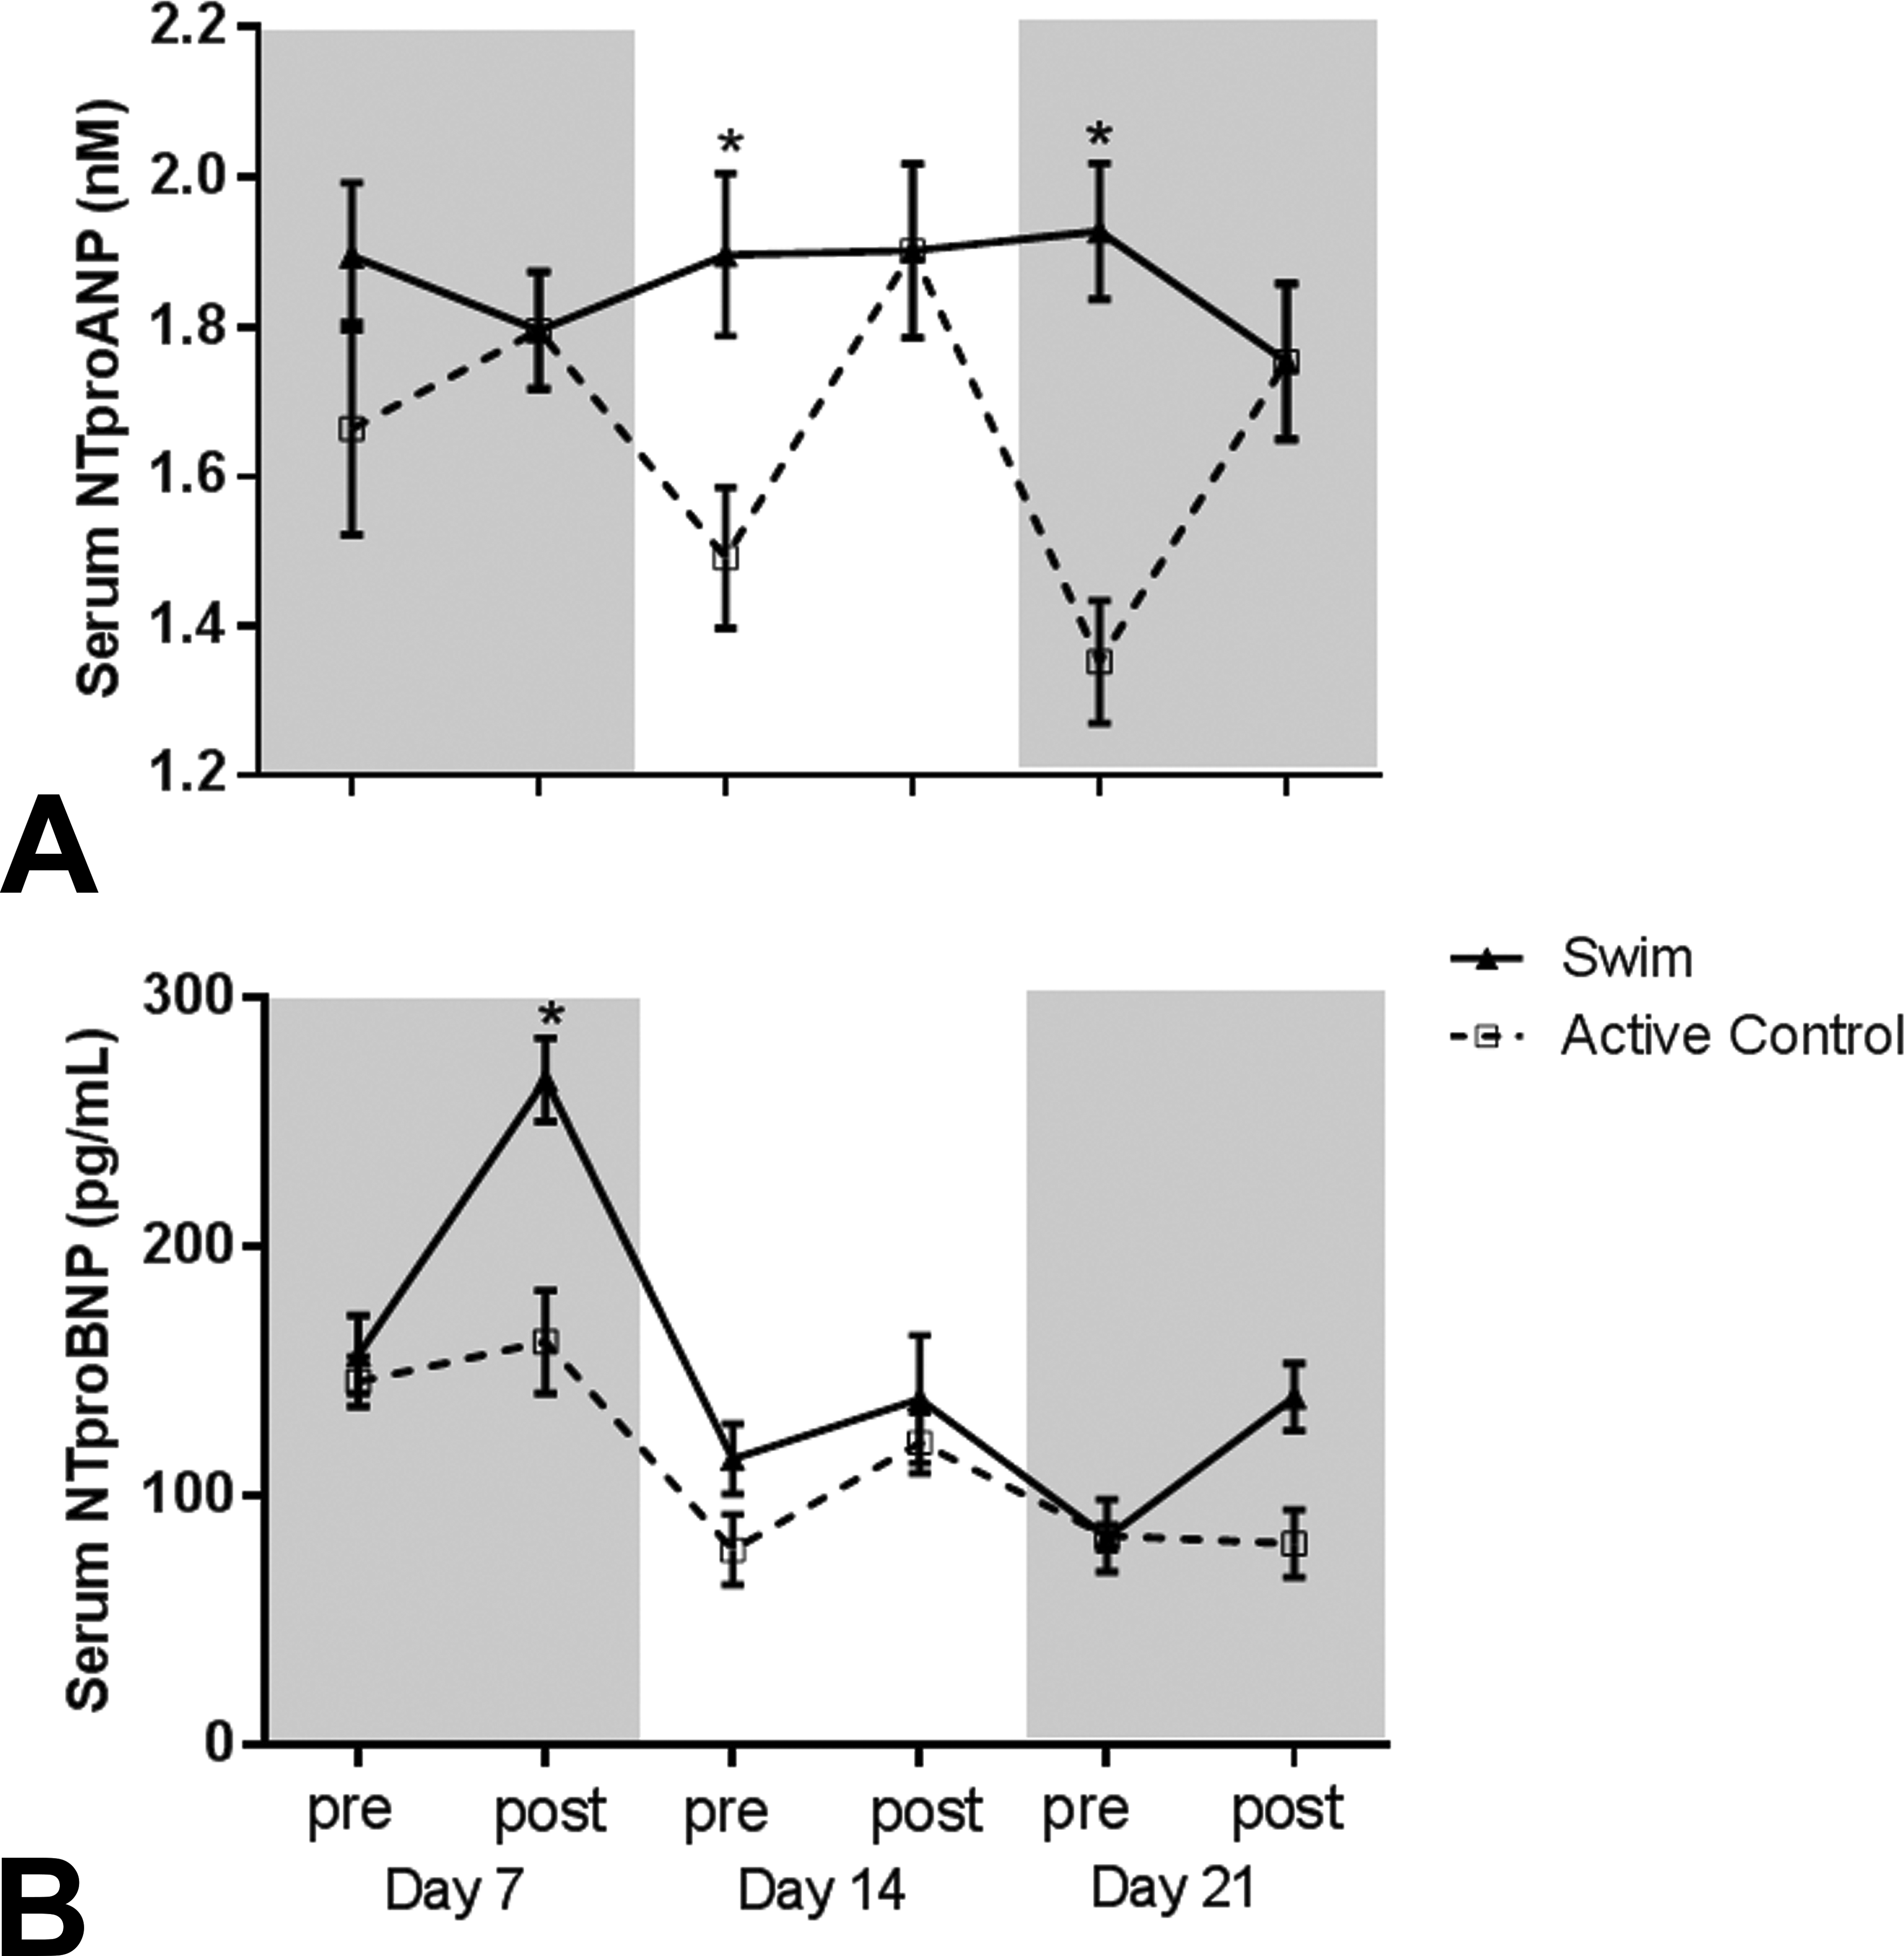
Pre- and postswimming serum N-terminal proatrial natriuretic peptide (a.) and N-terminal probrain natriuretic peptide (b.) concentrations in active control (AC) and swim (S) groups on study days 7, 14, and 21; closed triangles = swim group, open squares = active control; *p < .05 versus active control.
End of study (day 29) serum cTnI concentrations
At the terminal sample, several animals from each group, including controls, exhibited cTnI elevations (data not shown) above the established reference baseline of 10 pg/ml (Schultze et al. 2009); however, there were no significant differences in mean concentration between any groups.
Body and Organ Weights
Both absolute and relative HWs (HW: brain weight [BrW]) were collected from all animals in all groups at the terminal time point (day 29). Mean absolute (Table 1) and relative (Table 1 and Figure 5) HWs of animals in the S and DI groups were significantly higher than those from animals in the C and AC groups (both p < .001).
Body, Absolute, and Relative Heart Weights.
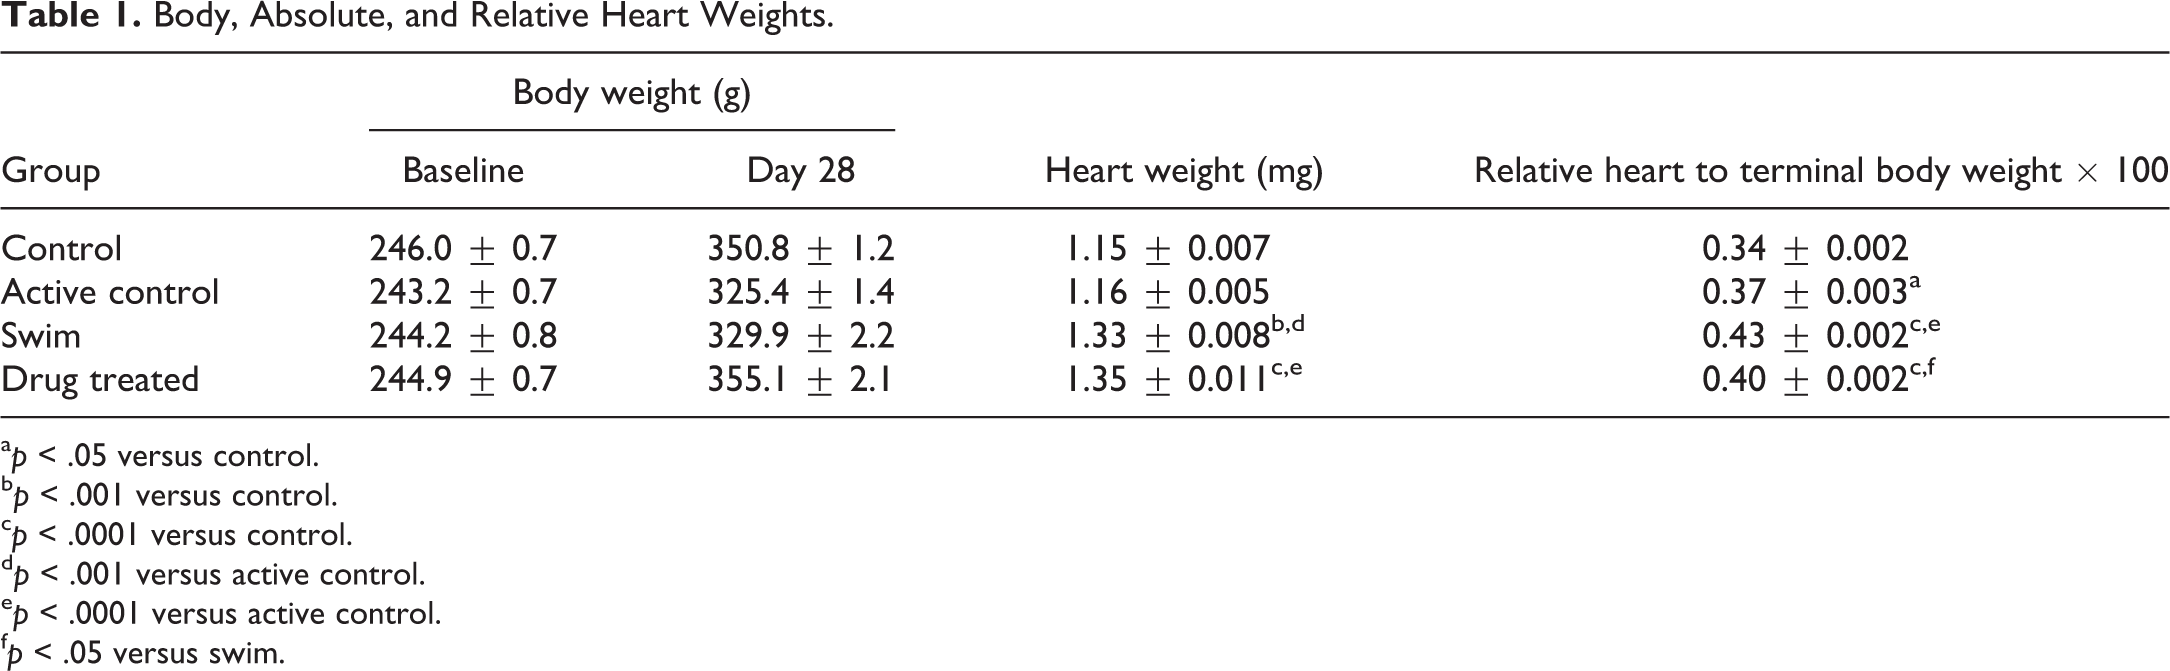
a p < .05 versus control.
b p < .001 versus control.
c p < .0001 versus control.
d p < .001 versus active control.
e p < .0001 versus active control.
f p < .05 versus swim.
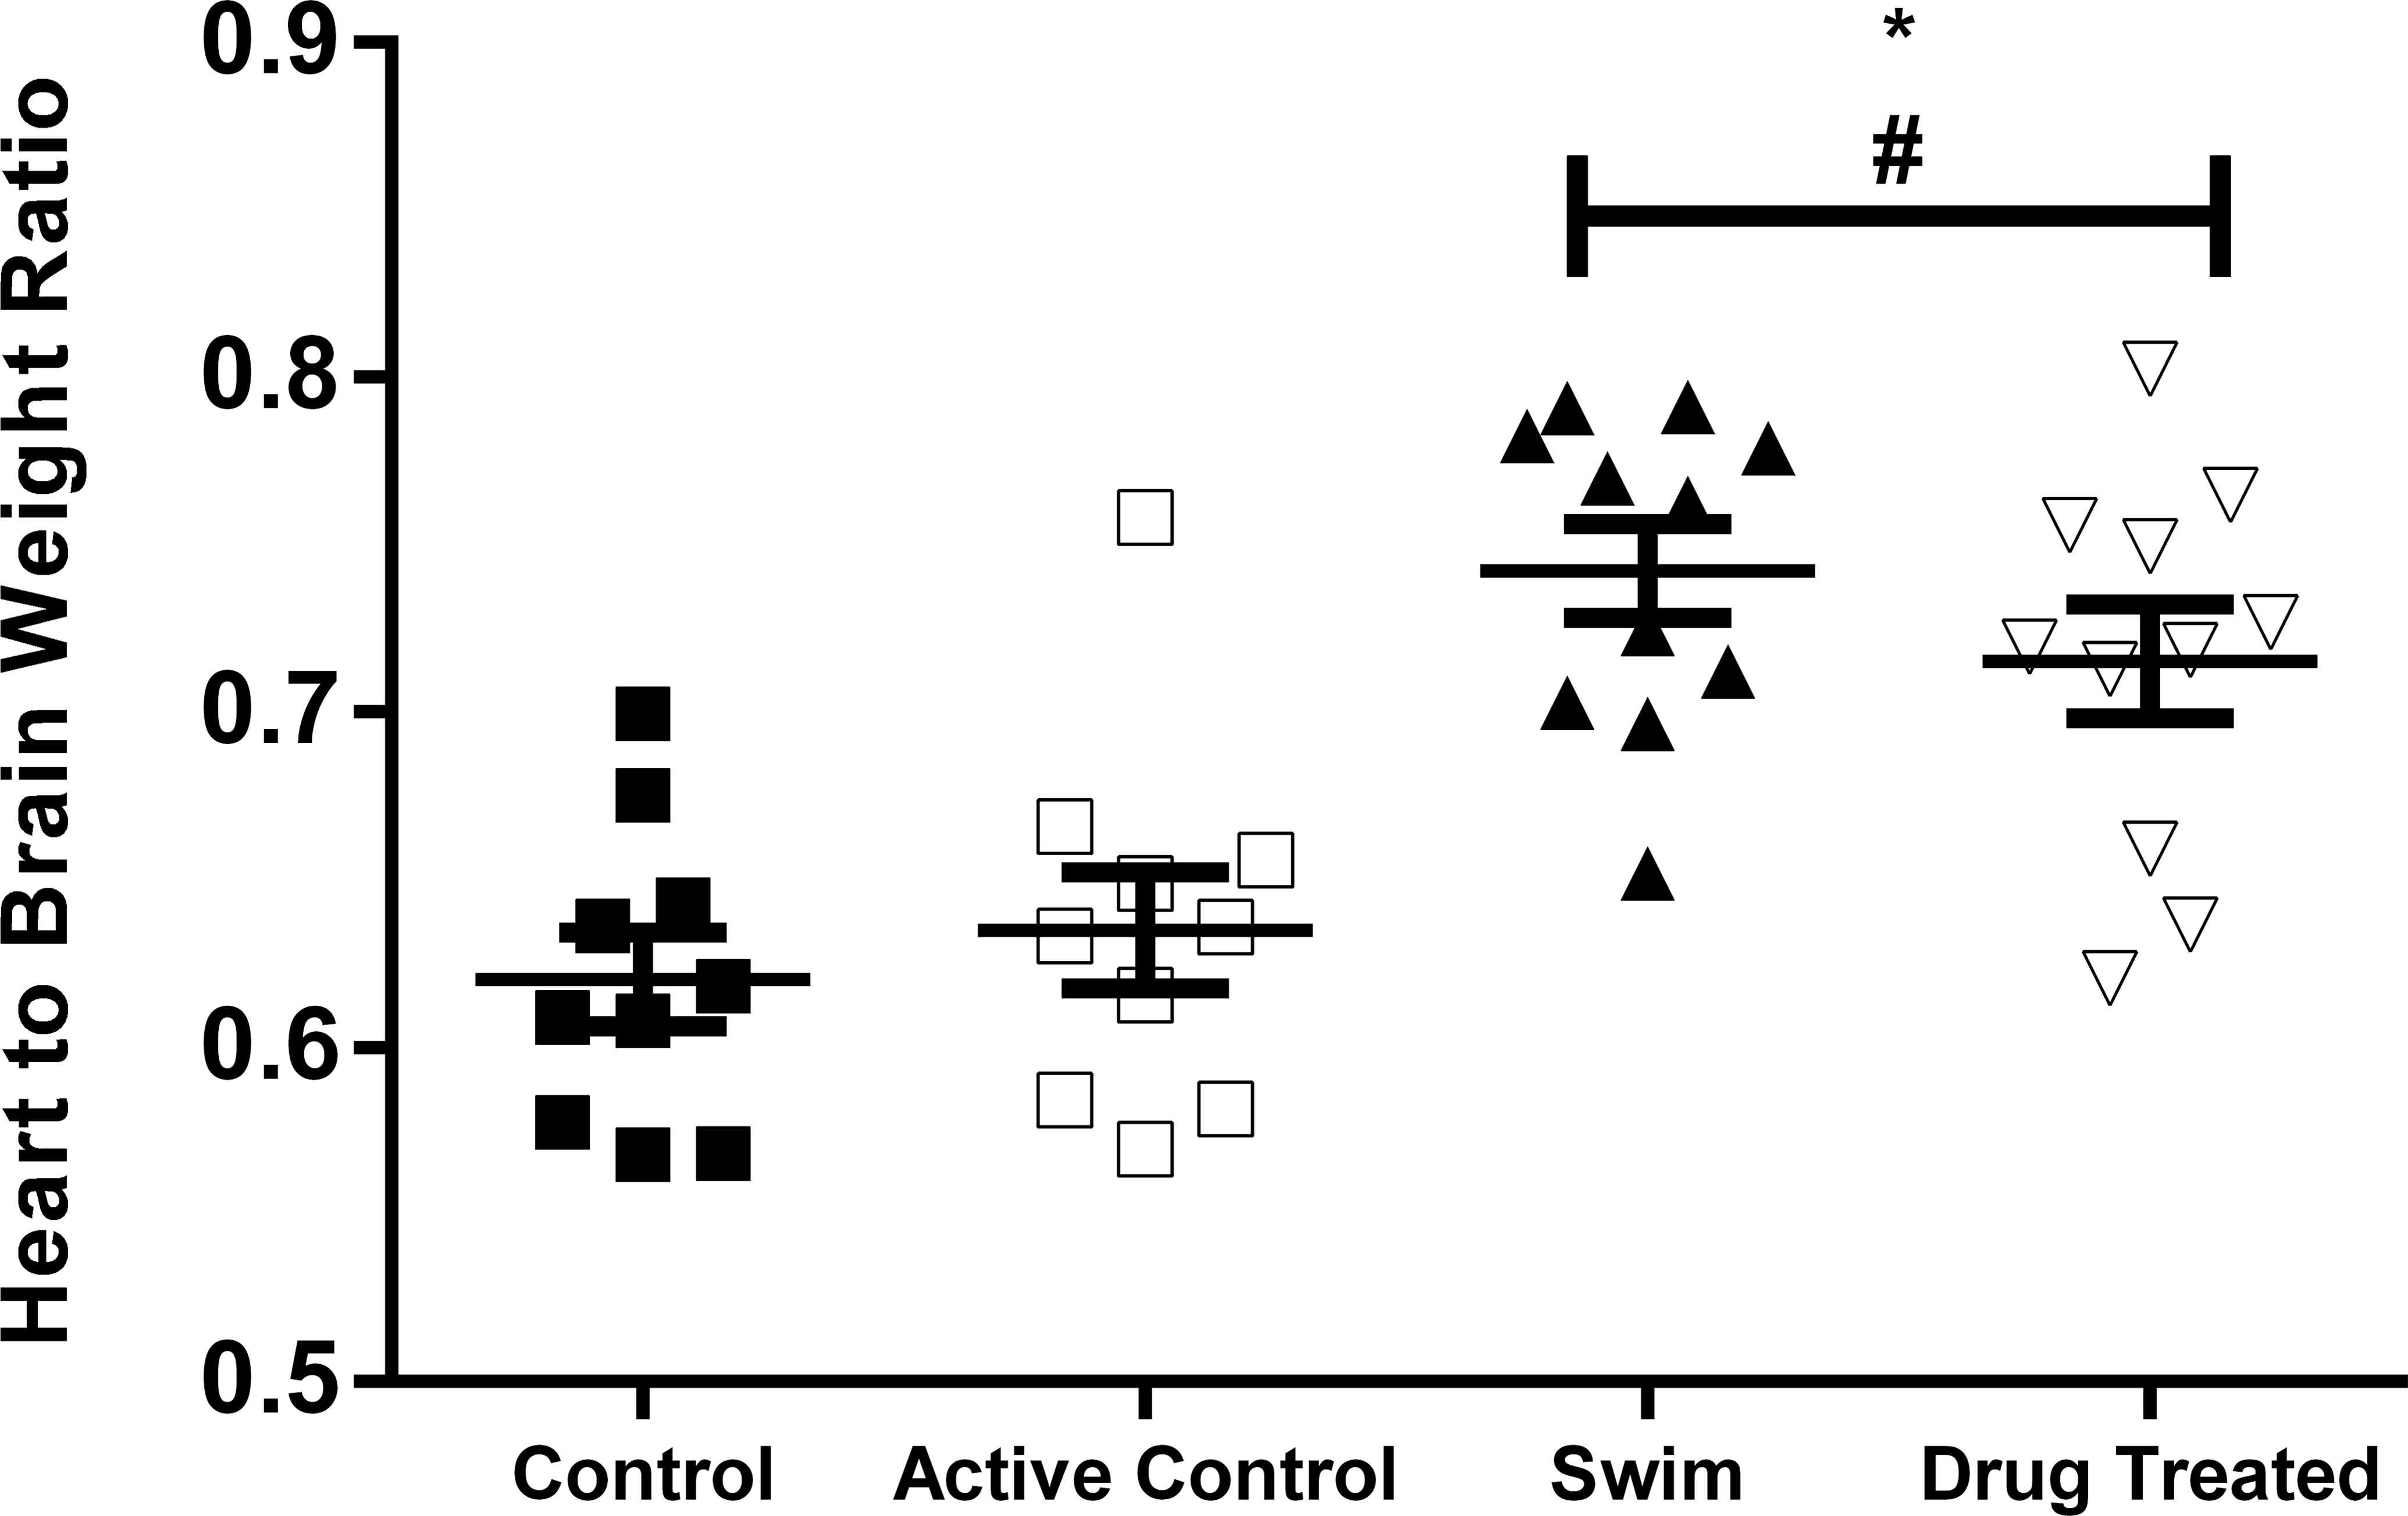
Mean relative heart weight (rHW) in the swim (S) and drug-induced hypertrophy (DI) groups were significantly higher than those from animals in the control (C) and active control (AC) groups (both p < .001); symbols represent individual animals, bars represent group mean (±SEM). There were no significant differences between the rHW of the S and DI groups or between the C and AC groups; *p < .05 versus control; #p < .05 versus active control.
Animals in the S and AC groups had a nonsignificant reduction in BW gain (Table 1) over the duration of the study compared to C and DI animals. There was a slight downward shift in BW over a 24-hr period in all animals from all groups starting with the day 28 preswim weight decreasing approximately 2% at the postswim weighing and then 4% by necropsy on day 29 (data not shown). This uniform decrease in BW can be attributed to the animals being fasted overnight prior to necropsy. Since BrW was used to calculate relative HW, these data do not affect the results or interpretation. When viewed in concert with relative HWs, serum NT-proANP and NT-proBNP concentrations allow for the distinction between exercise-induced and drug-induced increases in cardiac mass (Figure 6).
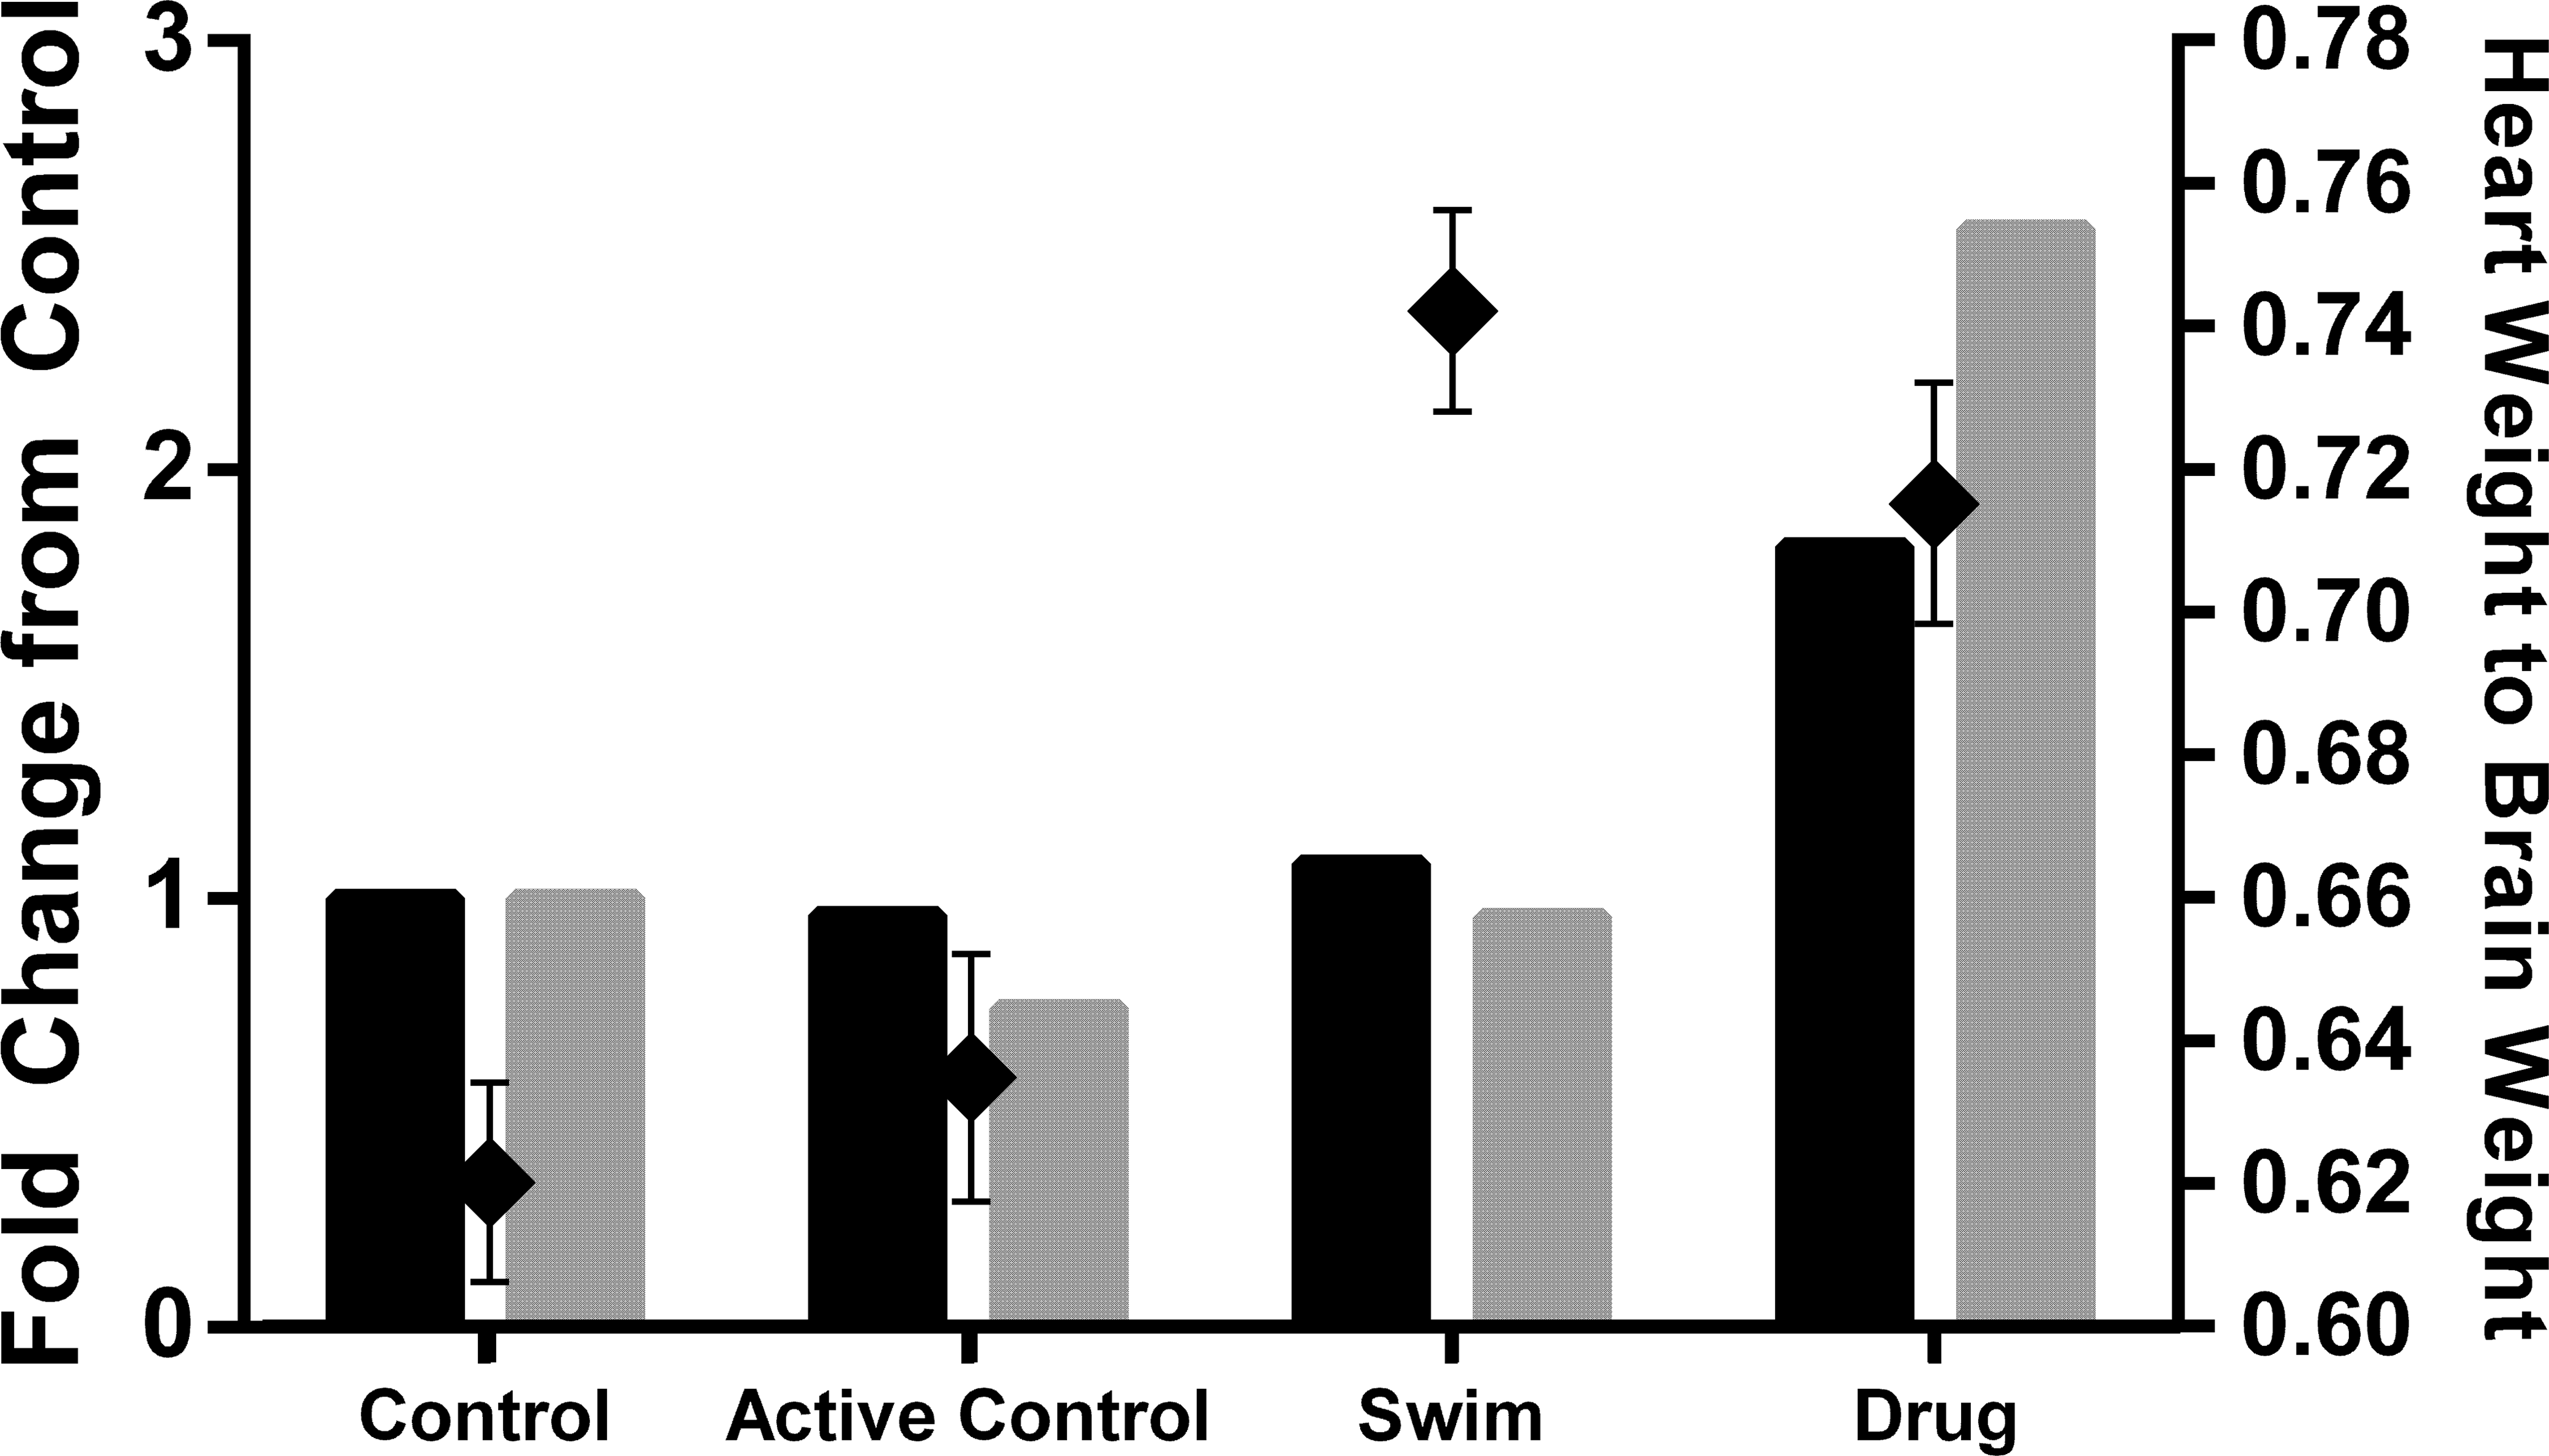
Correlation of terminal serum N-terminal proatrial natriuretic peptide (NT-proANP) concentrations with relative heart weight; gray bars = terminal serum NT-proANP, black bars = terminal serum N-terminal probrain natriuretic peptide (left axis), black diamonds = relative heart weight (right axis).
Natriuretic peptide concentrations relative to HW
The S group exhibited significantly increased absolute and relative (Table 1) HWs compared to the C group, and the increase was of the same order of magnitude as for the DI group. NT-proANP and NT-proBNP concentrations were not chronically elevated in the S group. The DI group did have significantly increased NT-proANP and NT-proBNP values compared to both time-matched control and individual animal baseline values from day 7 through the end of the study.
Histopathology
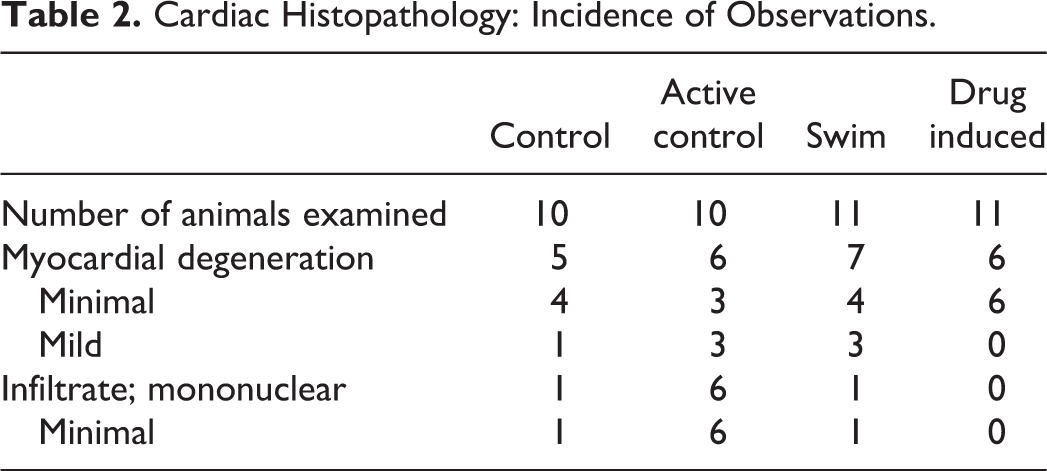
Heart sections (H&E) from all animals were examined microscopically, and no effects of either the PPARγ agonist test article or chronic swimming were observed. Histological evidence of cardiomyocyte hypertrophy was not evident on routine microscopic evaluation, and similar amounts of connective heart tissue were observed between all groups. Notably, incidence of myocardial degeneration was comparable across all groups and no histopathologic evidence (Table 2) of cardiomycyte injury was observed in animals exhibiting cTnI elevations at day 29. Picrosirius red staining demonstrated no difference in the levels of collagen between the 4 groups. All findings observed were consistent with background cardiomyopathy and occurred within the normal incidental ranges for the Sprague-Dawley strain of rat (Jokinen et al. 2011).
Cardiac Histopathology: Incidence of Observations.
Discussion
The primary objective of this study was to evaluate the similarities and differences of serum concentrations of NT-proANP and NT-proBNP during the process of exercise-induced versus drug-induced cardiac remodeling following chronic swimming or daily oral dosing with a PPARγ agonist. In both the S and DI groups, an approximate 15% increase in relative HW was observed. Despite equivalent increases in HW relative to the untreated groups (C and AC), serum NT-proANP and NT-proBNP values were only significantly increased in response to treatment with the PPARγ agonist, a class of compounds that have been reported to cause left ventricular hypertrophy (Engle et al. 2010). The observed increase in serum natriuretic peptides induced by daily oral administration of a PPARγ agonist was anticipated and correlates with both preclinical and clinical findings (Engle et al. 2010; Turkmen Kemel et al. 2007). As members of the thiazolidinedione class of insulin-sensitizing drugs, PPARγ agonists are used in the treatment of type 2 diabetes. Chronic administration of the PPARγ agonist rosiglitazone has been shown to increase HW in rats (Pickavance et al. 1999) and elevate the risk of acute myocardial infarction in man (Nissen et al. 2007). Although the exact mechanism of a PPARγ agonist–induced increase in HW has yet to be elucidated, speculation has implicated a variety of pathways including enhanced myocardial insulin sensitivity (Abbasi et al. 2009), elevation of circulating low-density lipoprotein levels (Liu et al. 2009), hemodilution resulting in plasma volume expansion, and reduction of hemoglobin levels (Blasi et al. 2009).
Based on lack of sequence conservation between species and related issues with assay performance and availability, NT-proBNP has been less characterized than NT-proANP in rodents. The dynamic range of NT-proBNP has not yet been established in rats nor have the temporal dynamics in response to hemodynamic stress or the effects of site of blood collection on NT-proBNP values. The apparent fall toward baseline of NT-proBNP that occurs after the concentration peaks at day 7 provides an interesting differentiation to the response of NT-proANP. A more detailed comparison of the temporal response of these 2 biomarkers in response to different models of hemodynamic perturbation would provide useful information for the characterization of overall natriuretic peptide response. Similarly, an evaluation of the effects of blood collection site on NT-proBNP concentrations would be a useful exercise considering the increased NT-proBNP values demonstrated between days 28 and 29 for which samples were collected from the caudal vasculature and the abdominal aorta, respectively.
Elevations of serum NT-proANP and NT-proBNP during drug-induced cardiac hypertrophy but not exercise-induced hypertrophy with an equivalent increase in relative HW occurring independent of a histological correlate, indicate the potential value of serum natriuretic peptides as biomarkers for characterizing differential pathways to cardiac hypertrophy during preclinical drug safety evaluation.
A secondary objective of this study was to characterize the temporal dynamics of NT-proANP and NT-proBNP secretion in relation to bouts of exercise by measuring circulating levels at weekly intervals from the swim group animals both before and after swimming bouts. Based on experiments reported in the literature (Sabatine et al. 2004; Goenka et al. 2008), serum NT-proANP and NT-proBNP were expected to be transiently increased in response to the increased heart rate and associated pressure elevations caused by swimming. While transient elevations of serum NT-proANP were demonstrated in the AC group, values remained relatively stable in the exercised animals from pre- to postswim throughout the conduct of the study. The lack of transient changes in the S group likely rule out the effect of a circadian influence. Similarly, NT-proBNP samples were transiently elevated from pre- to postswim at day 7; however, no significant differences were observed on days 14 and 21. The temporal differences observed between NT-proANP and NT-proBNP indicate that there is a distinct natriuretic peptide release pattern that occurs in response to exercise. However, there are potential explanations for the lack of an observed transient NT-proANP elevation in the S group that were expected based on the cardiovascular effects of sustained exercise. Blood collections postswim may have occurred after the exercise-induced pressure and associated NT-proANP increase had already returned toward baseline. Additionally, the first postswim blood collection took place after 7 days of daily swimming, and the rats may have already adapted to the physiological demands of swimming, resulting in minimal change in NT-proANP. The transient changes identified in the AC group further support this hypothesis, as these animals may have not been able to adapt to the swimming regimen over the initial 7-day period. An alternative hypothesis is that the minor amount of exercise that the AC group experienced was insufficient to induce a persistent and/or measurable natriuretic peptide increase. Perhaps the maintenance of slightly higher baseline values of NT-proANP in the trained animals provides a buffering capacity for the workload and associated pressure increase that comes with the daily swimming regimen. Unfortunately, this study was not equipped for functional monitoring, and therefore heart rate and blood pressure parameters could not be used to assess the effects of these variables. Future studies designed to more completely monitor the physiological response to swimming along with implementing more frequent and/or timely blood sampling would be useful to obtain a more detailed profile of the transient dynamics of serum NT-proANP and NT-proBNP before, during, and after exercise.
Serum cTnI is a highly sensitive and specific biomarker of myocardial tissue injury in humans (Thygesen et al. 2007) and in several species of laboratory animals (Apple et al. 2008; O’Brien et al. 2006). Within this study, several animals across all groups demonstrated elevated serum cTnI on the day of necropsy. There was no histopathologic correlate for these elevations. While cTnI elevations have been reported in response to chronic exercise in animals (Nie et al. 2010) and humans (Legaz-Arrese et al. 2011; Lippi et al. 2012; Traiperm et al. 2012), the data presented herein cannot be used to draw any conclusions due to the fact that baseline values were not determined as a consequence of caudal blood volume collection limitations. The lack of increase of this circulating biomarker of cardiomyocyte necrosis in these 2 animal models demonstrating significant effects on cardiac function highlights the need for additional circulating biomarkers for identifying hemodynamic perturbations that lead to a significant increase in cardiac mass.
The results of this study support the hypothesis that elevations of serum natriuretic peptides occur in response to cardiac hypertrophy induced by daily oral administration of a PPARγ agonist but do not occur in response to physiologic hypertrophy induced by chronic exercise. As reported previously, increases in serum ANP are more sustained than the transient elevations of BNP demonstrated in response to the hemodynamic perturbations caused by plasma volume expansion (Kamoi et al. 1988; Wambach and Koch 1995). Future studies implementing additional functional end points should be performed to further characterize the temporal dynamics of natriuretic peptide release in response to diverse models of hemodynamic stress leading to cardiac hypertrophy.
While these granular characteristics of natriuretic peptide release and clearance still need to be assessed, it should be noted the standard battery of preclinical tools used to evaluate the cardiovascular effects of new molecular entities would not have provided any differentiation between these 2 distinct pathways to cardiac hypertrophy, which present significantly different levels of risk to patients. The current paradign of toxicological testing would have only provided evidence of increased relative and absolute HW in both groups. These data highlight the potential to provide additional biomarkers of cardiovascular function to aid in the characterization of drug-induced changes in cardiac mass.
Footnotes
Acknowledgments
The authors acknowledge the following University of Rhode Island students who successfully performed the swim training and drug delivery Programs and provided technical support for the necropsy team: Angela Slitt, PhD, Kaitlin Abbate, Dana Demers, Ryan Johnson, Angela Phongsavan, Stephen Sladen, Erik Simpanen, Christopher DeSantos, Reilly Loomis, and Cara Finan. Special appreciation is given to Ms. Denise Vaz and Laura Huntley for their technical assistance and expert training of the University of Rhode Island students regarding animal and animal facility care and to Paul Gruber and Nicholas Wallingford from Pfizer Inc. and Lisa Cicia and Georgianna Varrone from Takeda Pharmaceuticals for their technical assistance during the necropsy.
Author Contribution
All authors (MD, TM, KA, SE, JP, NK, LR, KG, MG, FV, VM, PS, DS, and HC) contributed to conception or design; data acquisition, analysis, or interpretation; drafting the manuscript; and critically revising the manuscript. All authors gave final approval and agreed to be accountable for all aspects of work in ensuring that questions relating to the accuracy or integrity of any part of the work are appropriately investigated and resolved.
Authors’ Note
The views expressed in this article are those of the authors and do not necessarily represent the policies, positions, or opinions of their respective employers and agencies.
Declaration of Conflicting Interests
The author(s) declared no potential conflicts of interest with respect to the research, authorship, and/or publication of this article.
Funding
The author(s) disclosed receipt of the following financial support for the research, authorship, and/or publication of this article: This work was supported by the Predictive Safety Testing Consortium of the Critical Path Institute. FDA Grant U01 FD003865-05.