
Abstract
Vinylidene chloride (VDC) has been widely used in the production of plastics and flame retardants. Exposure of B6C3F1 mice to VDC in the 2-year National Toxicology Program carcinogenicity bioassay resulted in a dose-dependent increases in renal cell hyperplasia, renal cell adenoma, and renal cell carcinomas (RCCs). Among those differentially expressed genes from controls and RCC of VDC-exposed mice, there was an overrepresentation of genes from pathways associated with chronic xenobiotic and oxidative stress as well as c-Myc overexpression and dysregulation of TP53 cell cycle checkpoint and DNA damage repair pathways in RCC. Trend analysis comparing RCC, VDC-exposed kidney, and chamber control kidney showed a conservation of pathway dysregulation in terms of overrepresentation of xenobiotic and oxidative stress, and DNA damage and cell cycle checkpoint pathways in both VDC-exposed kidney and RCC, suggesting that these mechanisms play a role in the pathogenesis of RCC in VDC-exposed mice.
Keywords
Introduction
Vinylidene chloride (VDC, 1,1-dichloroethylene) is a volatile chemical that has been used as a chemical intermediate in the production of 1,1,1-trichloroethane and widely used as a monomer in commercial resins and a polymer in the production of plastics (food packaging materials) and flame-retardants coating for fiber and carpet backing (Oesch et al. 1983; Roberts et al. 2002; Speerschneider and Dekant 1995). In humans, VDC is considered to be a central nervous system depressant and repeated exposure to low concentrations may cause liver and kidney dysfunction (Torkelson and Rowe, 1981). In laboratory animals, the kidney and lung are the primary target organs; however, toxicity varies by species, sex, and route of exposure (Hathway 1977). The potential carcinogenicity of VDC has been evaluated in several laboratory animal species by a number of exposure routes (Lee et al. 1978; C. Maltoni et al. 1977; C. G. Maltoni et al. 1985; Quast et al. 1983; Viola and Caputo 1977). C. G. Maltoni and colleagues (1985) observed renal adenocarcinomas in male Swiss Webster mice after VDC inhalation exposure. However, certain study limitations such as the lack of key experimental details and the inability to confirm these findings using a similar mouse strain and greater VDC exposure has brought the validity of these findings into question (Lee et al. 1978; C. Maltoni et al. 1977).
Renal cell carcinoma (RCC) in humans accounts for nearly 4% of cancer incidence and 2% of cancer mortality in the United States (American Cancer Society 2015). The vast majority of these neoplasms (85–90%) originate from the renal tubular epithelium and are a clinicopathologically heterogeneous disease classified histologically as clear cell RCC (ccRCC), papillary, chromophobe, collecting duct, medullary, multilocular cystic, and unclassified RCC (Gurel et al. 2013; Maher 2013; Motzer, Bander, and Nanus 1996). Male B6C3F1 mice develop spontaneous RCCs at a very low incidence (0.17%, all routes, and all vehicles; National Toxicology Program [NTP] 2014). These tumors have not been reported in control female B6C3F1 mice in any NTP carcinogenicity bioassays, nor have they been reported in male B6C3F1 control mice in any NTP inhalation studies (NTP 2014). In B6C3F1 mice, RCC is classified based on morphologic pattern including solid, papillary, cystic, or mixed; in addition, cytologic staining characteristics have been used including eosinophilic, basophilic, or clear cell types (Seely 1999).
Molecularly, several tumor suppressor genes have been identified to play a role in the development of RCC in humans, including TP53, SETD2, VHL, PBRM1, and MYC (Maher 2013; Pena-Llopis et al. 2013; Reiter et al. 1993; Sato et al. 2013; Suzuki et al. 1992). While gene expression alterations and mutation spectra have been well studied in human RCC, such alterations have not been studied in RCC from the B6C3F1 mouse. Therefore, their molecular identity and any molecular similarity to human RCC are uncertain. The objective of this study was to analyze the global gene expression profiles and mutation spectra in RCC and nontumor kidney (containing foci of hyperplasia) from VDC-exposed mice compared to chamber controls, in order to identify transcriptomic alterations, which may play a role in VDC-associated renal tumorigenesis. Furthermore, to examine the relevance of this model, we sought to identify transcriptomic changes in mouse RCC that are known to play a role in human carcinogenesis.
Materials and Methods
Tumor Samples
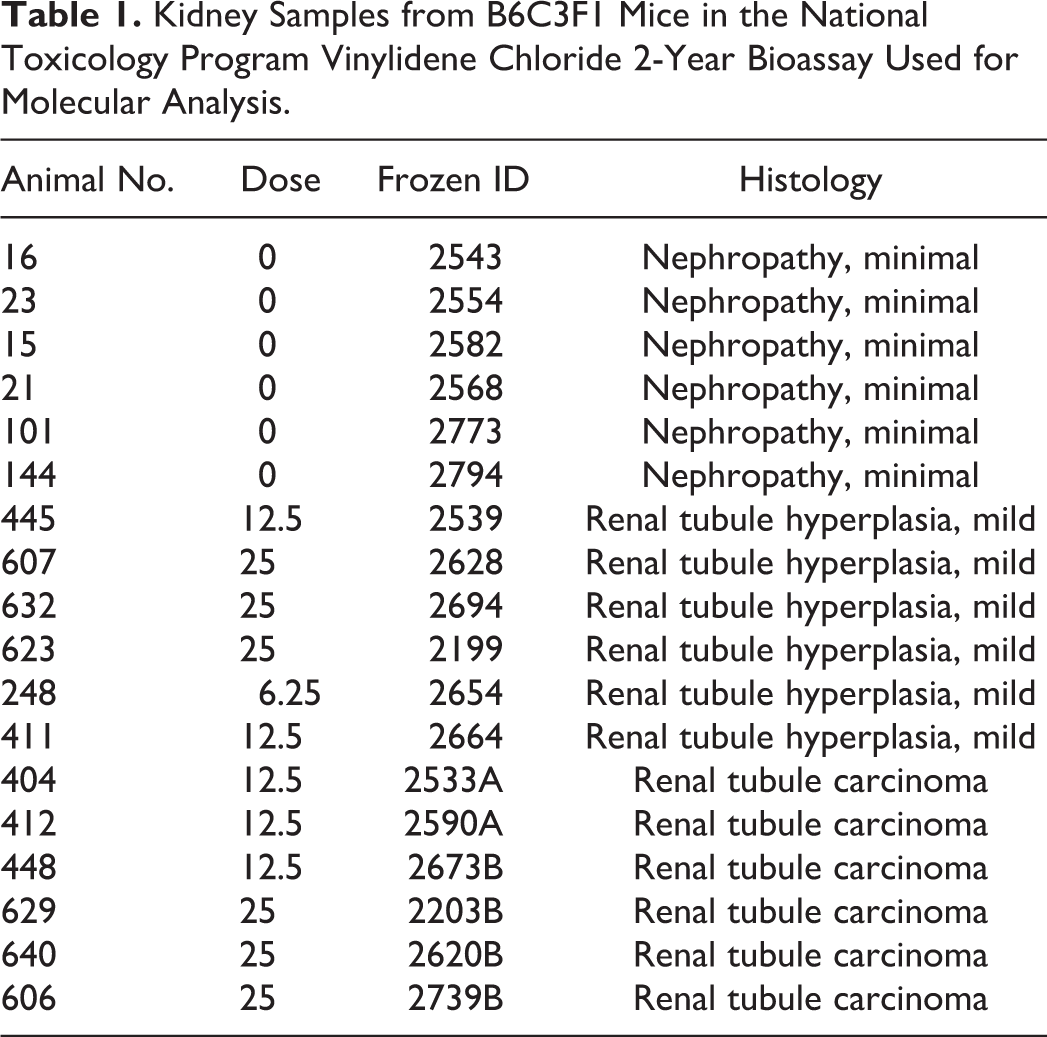
Samples of RCCs and nontumor kidney were collected from VDC-exposed B6C3F1 mice, and samples of kidney from chamber control animals, from the 2-year VDC NTP bioassay. For RCCs, one half of each tumor sample was fixed in 10% neutral-buffered formalin and the other half was flash frozen in liquid nitrogen. The morphology of each sample was reviewed to assure minimal necrotic tissue (<20%) and maximum tumor to normal tissue per section. Corresponding formalin-fixed, paraffin-embedded (FFPE) sections of RCCs and nontumor kidney from VDC-exposed animals, and chamber control kidneys were examined histologically to confirm the histologic diagnosis for phenotypic anchoring of the differential gene expression data. Focal microscopic hyperplasias were often observed histologically in nontumor kidney from VDC-exposed animals. A list of samples used for molecular analysis is included in Table 1.
Kidney Samples from B6C3F1 Mice in the National Toxicology Program Vinylidene Chloride 2-Year Bioassay Used for Molecular Analysis.
Mutation Analysis
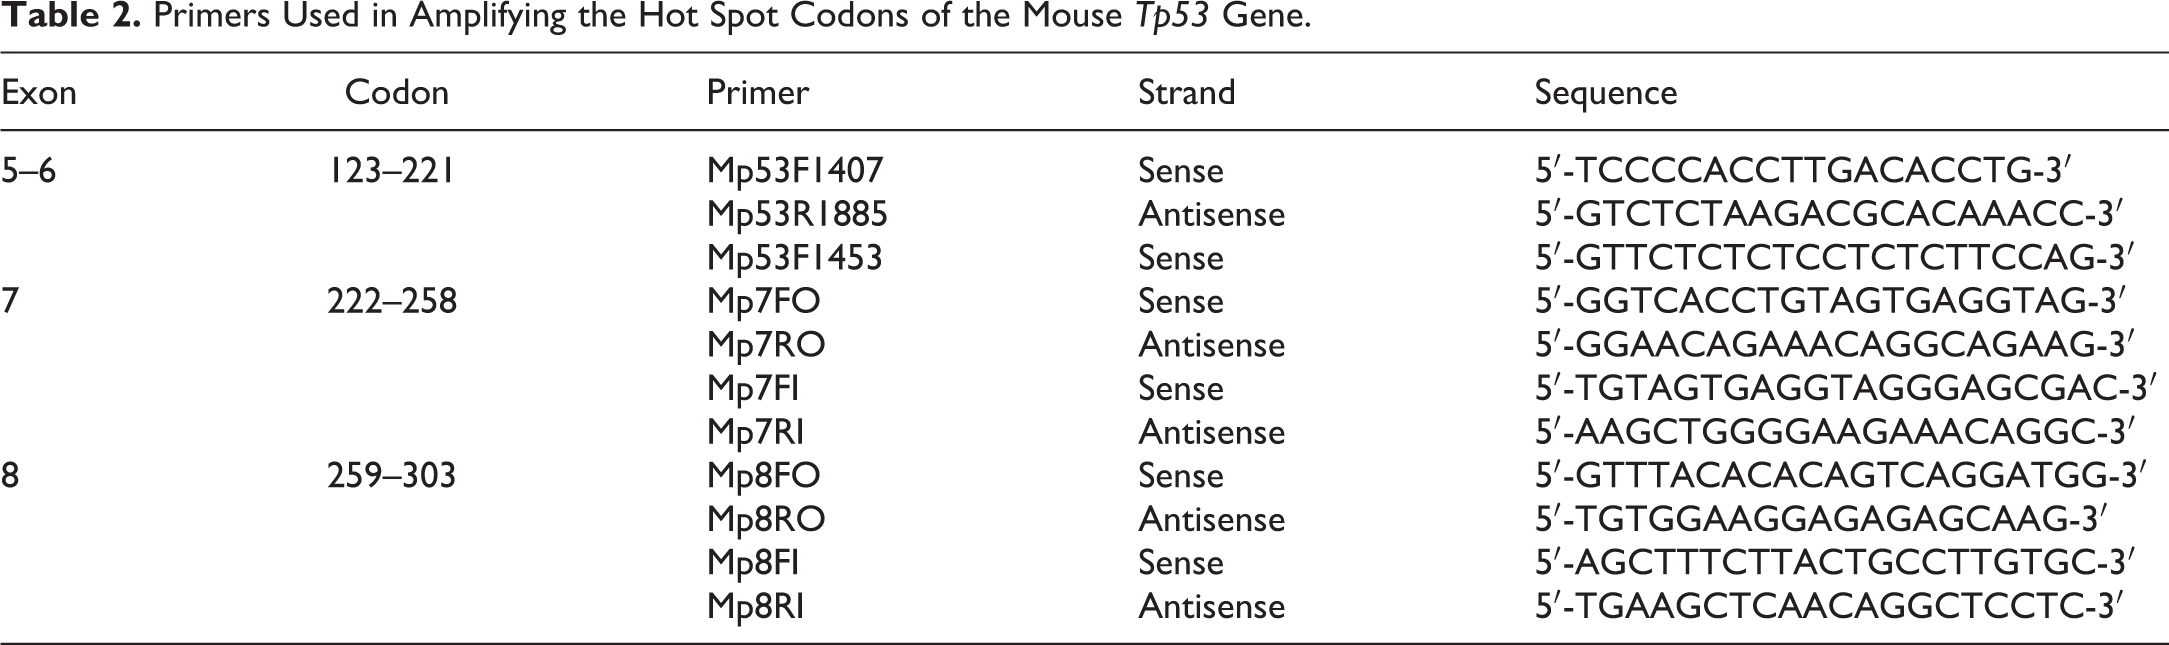
Ten RCCs from VDC-treated mice were evaluated for mutations in exons 5–8 (codons 123–303) of Tp53, representing the hot spot region that correlates with mutations observed in human RCC. DNA was isolated and extracted from RCCs using the DNeasy Tissue kit (Qiagen, Valencia, CA). Amplification reactions were carried out by seminested polymerase chain reaction (PCR) using the primer set exons 5 and 6 (codons 123–221), exon 7 (codons 222–258), and exon 8 (codons 259–303) of the mouse Tp53 gene (Table 2). PCR products for gene targets were purified using a QIAquick Gel Extraction kit (Qiagen). The purified PCR products were cycled with Terminal Ready Reaction Mix-Big Dye (Perkin Elmer, Foster City, CA), then purified extension products with DyeEx 2.0 spin kit (Qiagen). The lyophilized PCR products were sequenced with an automatic sequencer (Perkin-Elmer ABI Model 3100). The automated ABI DNA sequencing system detects fluorescence from different dyes that are used to identify the A, C, G, and T extension of sequence reaction. Each sequence generates a 4-color chromatogram showing the analyzed data from which the machine determines the nucleotide sequence. The file of electropherogram was used for comparison between control and treated groups. Sequencing results were confirmed by both forward and reverse primers.
Primers Used in Amplifying the Hot Spot Codons of the Mouse Tp53 Gene.
RNA Extraction and Quantification
Flash frozen male B6C3F1 mouse kidneys from chamber controls (n = 6), nontumor kidneys from VDC-exposed mice (n = 6), and RCCs from VDC-exposed mice (n = 6) were used for RNA extraction. RNA was extracted from each sample using the Invitrogen PureLink Mini kit (Cat# 12183-018A; Invitrogen, Carlsbad, CA), according to the manufacture’s protocol. Frozen kidney samples were lysed and homogenized in TRIzol reagent (Invitrogen) using a rotor–stator homogenizer. Isolation of RNA was performed according to the mini kit protocol. RNA samples were purified by On-column deoxyribonuclease (DNase) treatment using the Invitrogen PureLink DNase kit. RNA concentration and 260:280 ratio were measured using a bioanalyzer (Agilent Technologies, Santa Clara, CA), and RNA quality was checked on Embi Tec Precast RNA gels (Embec cat# GE-6010). Samples were aliquoted and stored at −80°C.
Microarray Analysis
Differential gene expression was evaluated across chamber control kidney, VDC-exposed nontumor kidneys, and VDC-exposed RCC using global gene expression analysis. Gene expression analysis was conducted using Affymetrix Mouse Genome 430 2.0 GeneChip® arrays (Affymetrix, Santa Clara, CA). Total RNA (100 ng) was amplified as directed in the Affymetrix 3′ IVT Express kit protocol. Amplified biotin-antisense RNAs (aRNA), 12.5 µg, were fragmented, and 10 µg were hybridized to each array for 16 hr at 45°C in a rotating hybridization oven using the Affymetrix Eukaryotic Target Hybridization controls and protocol. Array slides were stained with streptavidin/phycoerythrin using a double-antibody staining procedure and then washed using the EukGE-WS2v5 protocol of the Affymetrix Fluidics Station FS450 for antibody amplification. Arrays were scanned in an Affymetrix Scanner 3000 and data were obtained using the GeneChip Command Console Software (AGCC, version 1.1). For this set of experiments, all of the samples were labeled on the same day with the same labeling kit and were hybridized on the same day with microarrays from the same lot number. The microarrays were washed and stained at the same time with reagents from the same hybridization, wash, and stain kit and were scanned on the same day on the same scanner.
Quantitative Real-time PCR Validation
Quantitative gene expression levels were validated using real-time PCR with the ABI PRISM 7900HT Sequence Detection System (Applied Biosystems) TaqMan MGB probes (FAM™ dye labeled). Primers and probes were purchased from Applied Biosystems Assays-on-Demand Gene Expression products. For amplification, diluted complementary DNA was combined with a reaction mixture containing TaqMan® universal PCR Master Mix (Catalog no. 4304437; Applied Biosystems) according to the manufacturer’s instructions. Samples were analyzed in duplicate, and a third sample without reverse transcriptase was included in each plate to detect genomic DNA contamination. Amplification was performed as follows: 50°C for 2 min (for uracil-N-glycoside incubation), denaturation at 95°C for 10 min (denaturation), 95°C for 15 sec, and 60°C for 30 sec (denaturation and amplification) for 40 cycles. Fold changes in gene expression in VDC-exposed nontumor kidneys and VDC-exposed RCC were determined by quantification of target samples relative to chamber control kidney. The 18S RNA was used as the endogenous control for normalization of RNA levels. To determine normalized values, 2−(ΔΔCt) values were compared between either VDC-exposed nontumor kidney or VDC-exposed RCC and control samples.
Bioinformatics, Data Processing, and Statistical Analysis
Fluorescent pixel intensity measurements were acquired from the arrays, and probe intensity data were read into the R software environment, R version 2.15.2 (http://www.R-project.org) from Microarray data files (.cel) using the R/affy package, version 1.36.1 (Gautier et al. 2004). Data quality was evaluated using image reconstruction, intensity histograms, and box plots of raw signal intensities. Normalization was performed across the 18 samples (6 chamber control kidneys, 6 VDC-exposed nontumor kidneys, and 6 RCCs from VDC-exposed mice) using the robust multiarray average (RMA) method to form one expression measure for each probe set on each array (Irizarry et al. 2003). Briefly, the RMA method adjusts the background of perfect match (PM) probes, applies a quantile normalization of the corrected PM values, and calculates final expression measures using the Tukey median polish algorithm.
Pairwise comparisons between treatment groups (chamber control normal vs. VDC-exposed nontumor and chamber control normal vs. VDC-exposed RCC) were made for each probe set using a bootstrap t-test in order to identify those statistically significant differentially expressed genes between experimental groups. Pairwise tests were conducted while controlling the mixed directional false discovery rate at 5% level (W. Guo and Peddada 2008). W. Guo and Peddada procedure controls the overall false discovery rate (FDR) across multiple comparisons and takes into account directional errors corresponding to upregulated or downregulated genes. Results corresponding to these pairwise analyses are summarized in Table 3, Figures 1, 2 –4, and Supplemental Table 1. In addition to the pairwise comparisons, we identified genes whose expression increased or decreased according to tumor stage, that is, no tumor, hyperplasia, and carcinoma. Trend tests were performed by controlling FDR at the 5% level. Multiple pairwise comparisons were done to evaluate the differential gene expression in VDC-exposed groups (tumor and nontumor) compared to chamber controls, whereas trend analysis was done with the assumption that carcinogenesis is a progressive process, in which changes occurred during chemical exposure (such as the observed microscopic hyperplasias) progress to neoplastic lesions. Therefore, the trend analysis designed to capture those genes that play an important role in the progression of carcinogenesis during VDC exposure. The results of the trend analyses are summarized in Figure 5. The above approaches do not assume normality and are robust to heteroscedasticity. Statistical calculations were performed in the ORIOGEN software package, version 4.01 using 10,000 bootstrap samples (Peddada et al. 2005). Microarray data files (.cel) and associated annotations have been deposited in the Gene Expression Omnibus database (GSE67320).
Selected Differentially Expressed Genes in Vinylidene Chloride–exposed Nontumor Kidney and Renal Cell Carcinoma Compared to Chamber Control Kidney in B63CF1 Mice.
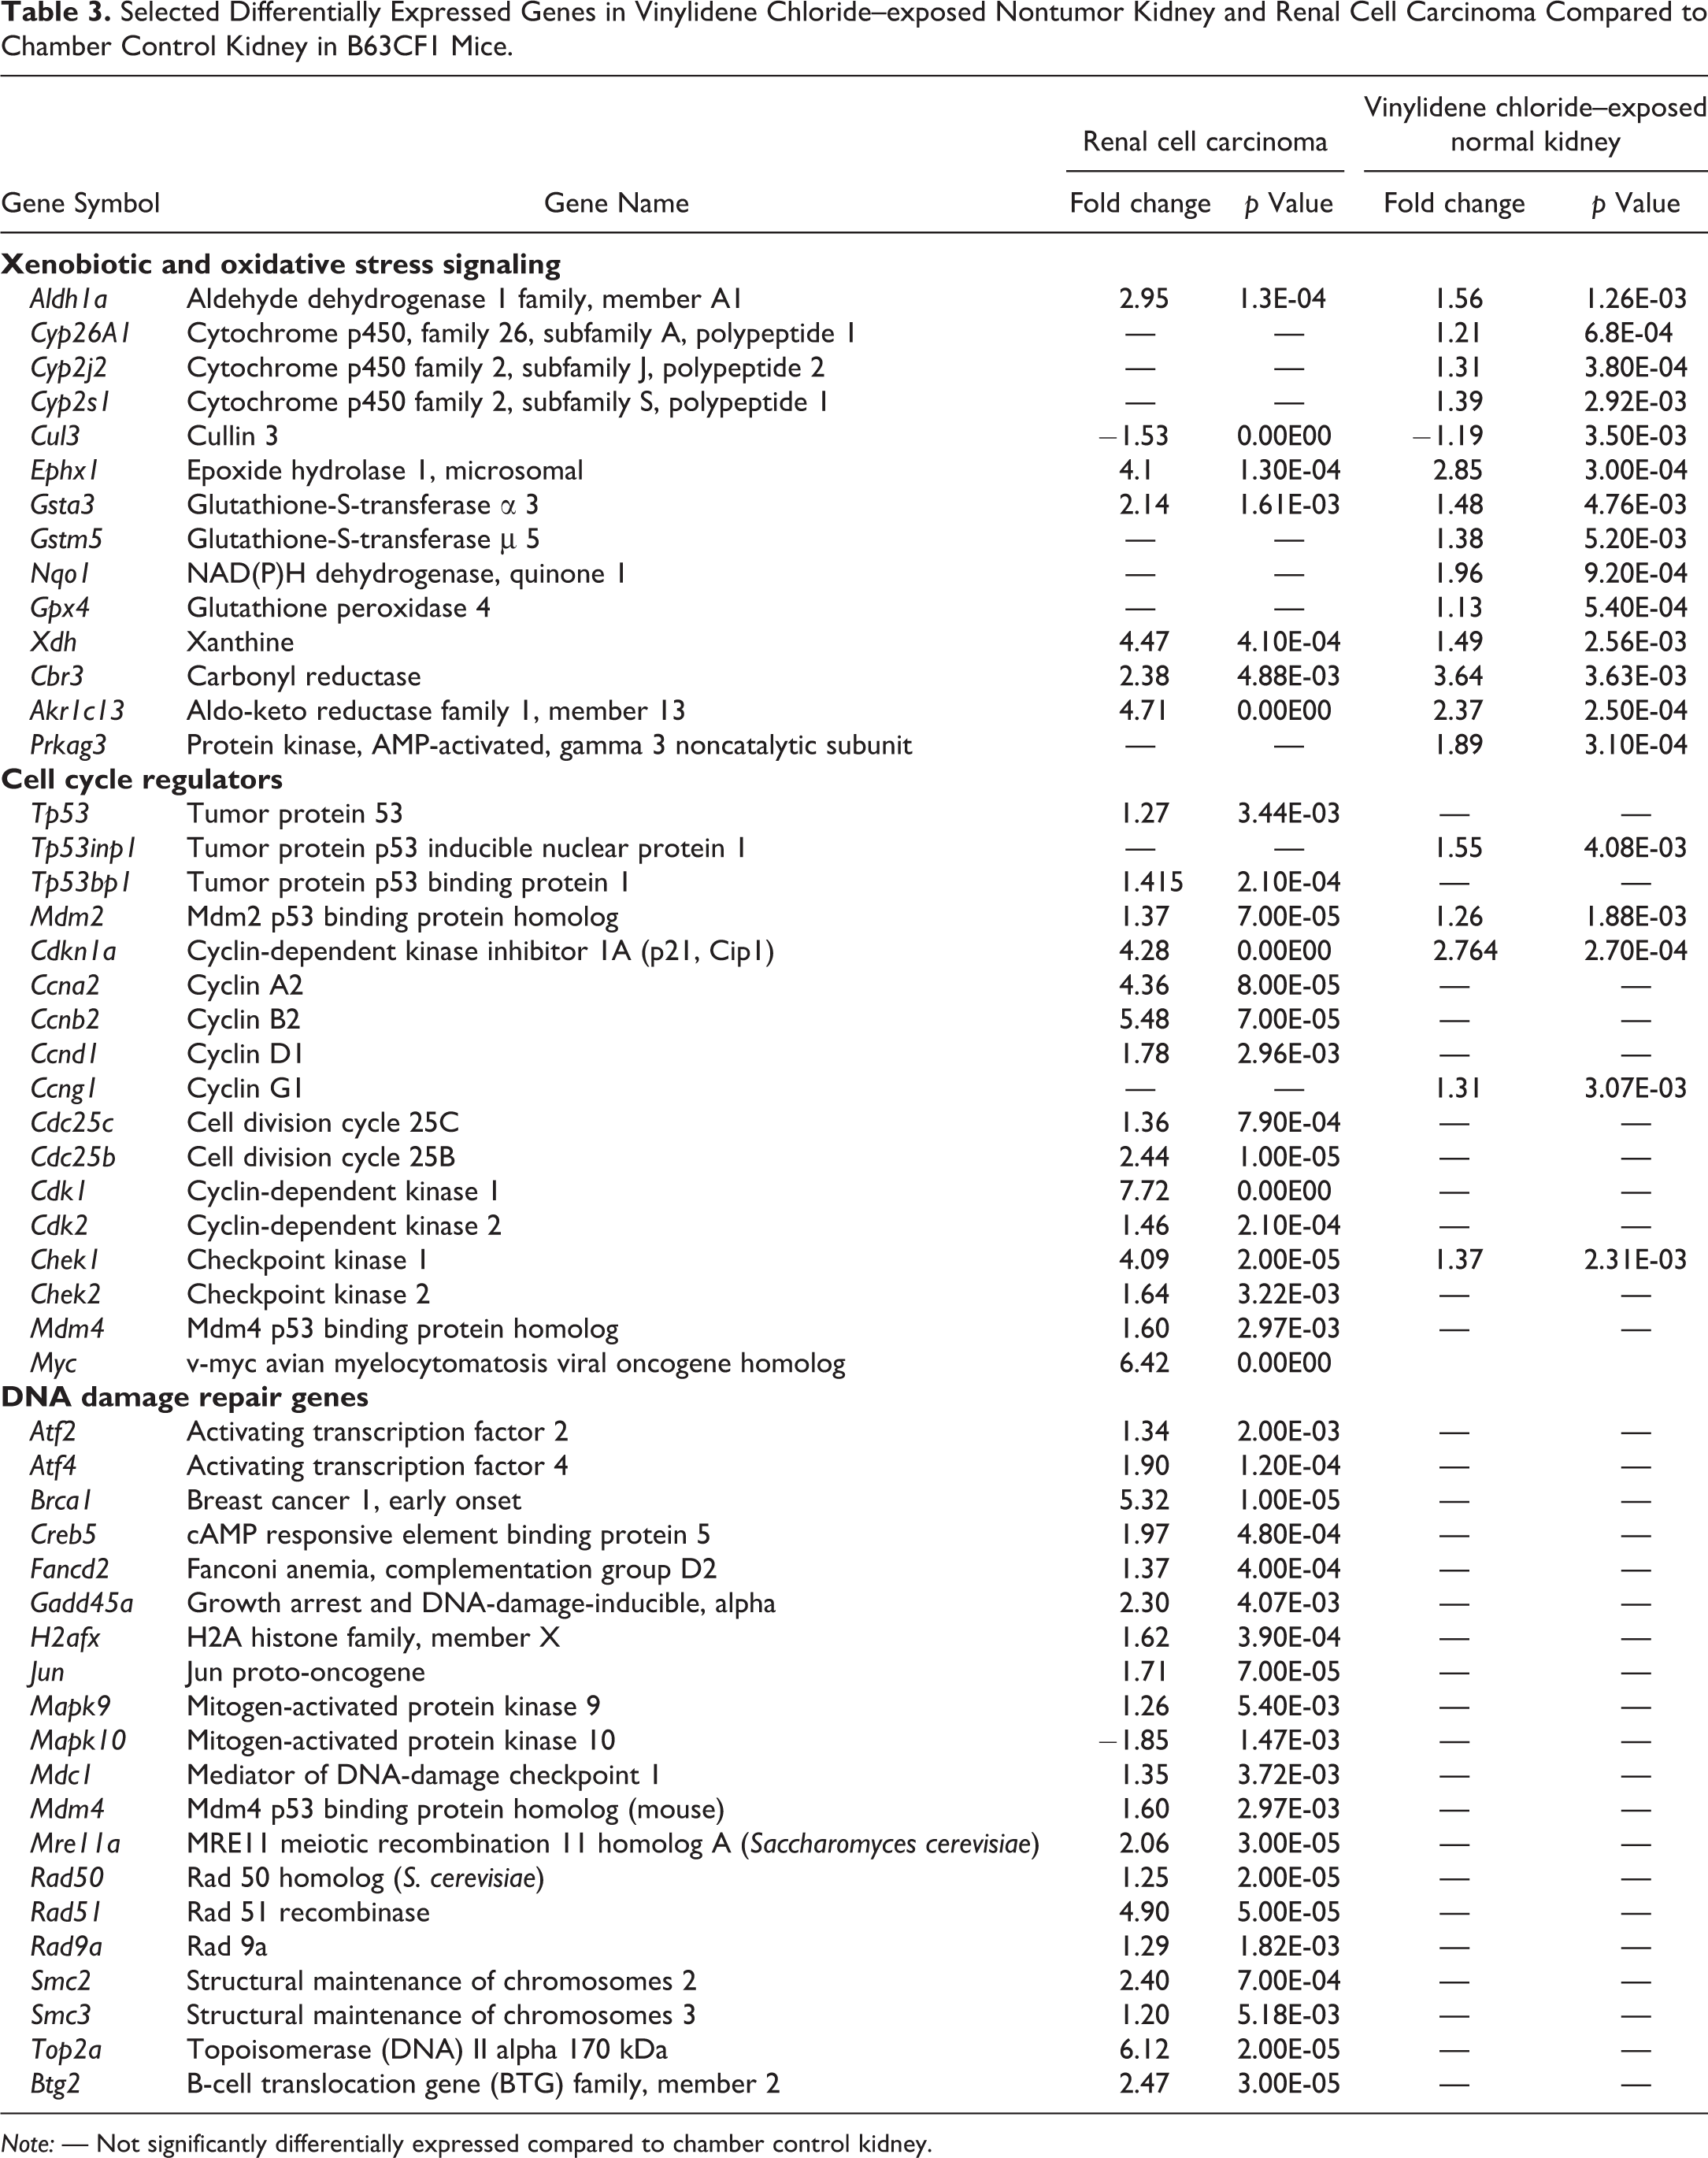
Note: — Not significantly differentially expressed compared to chamber control kidney.
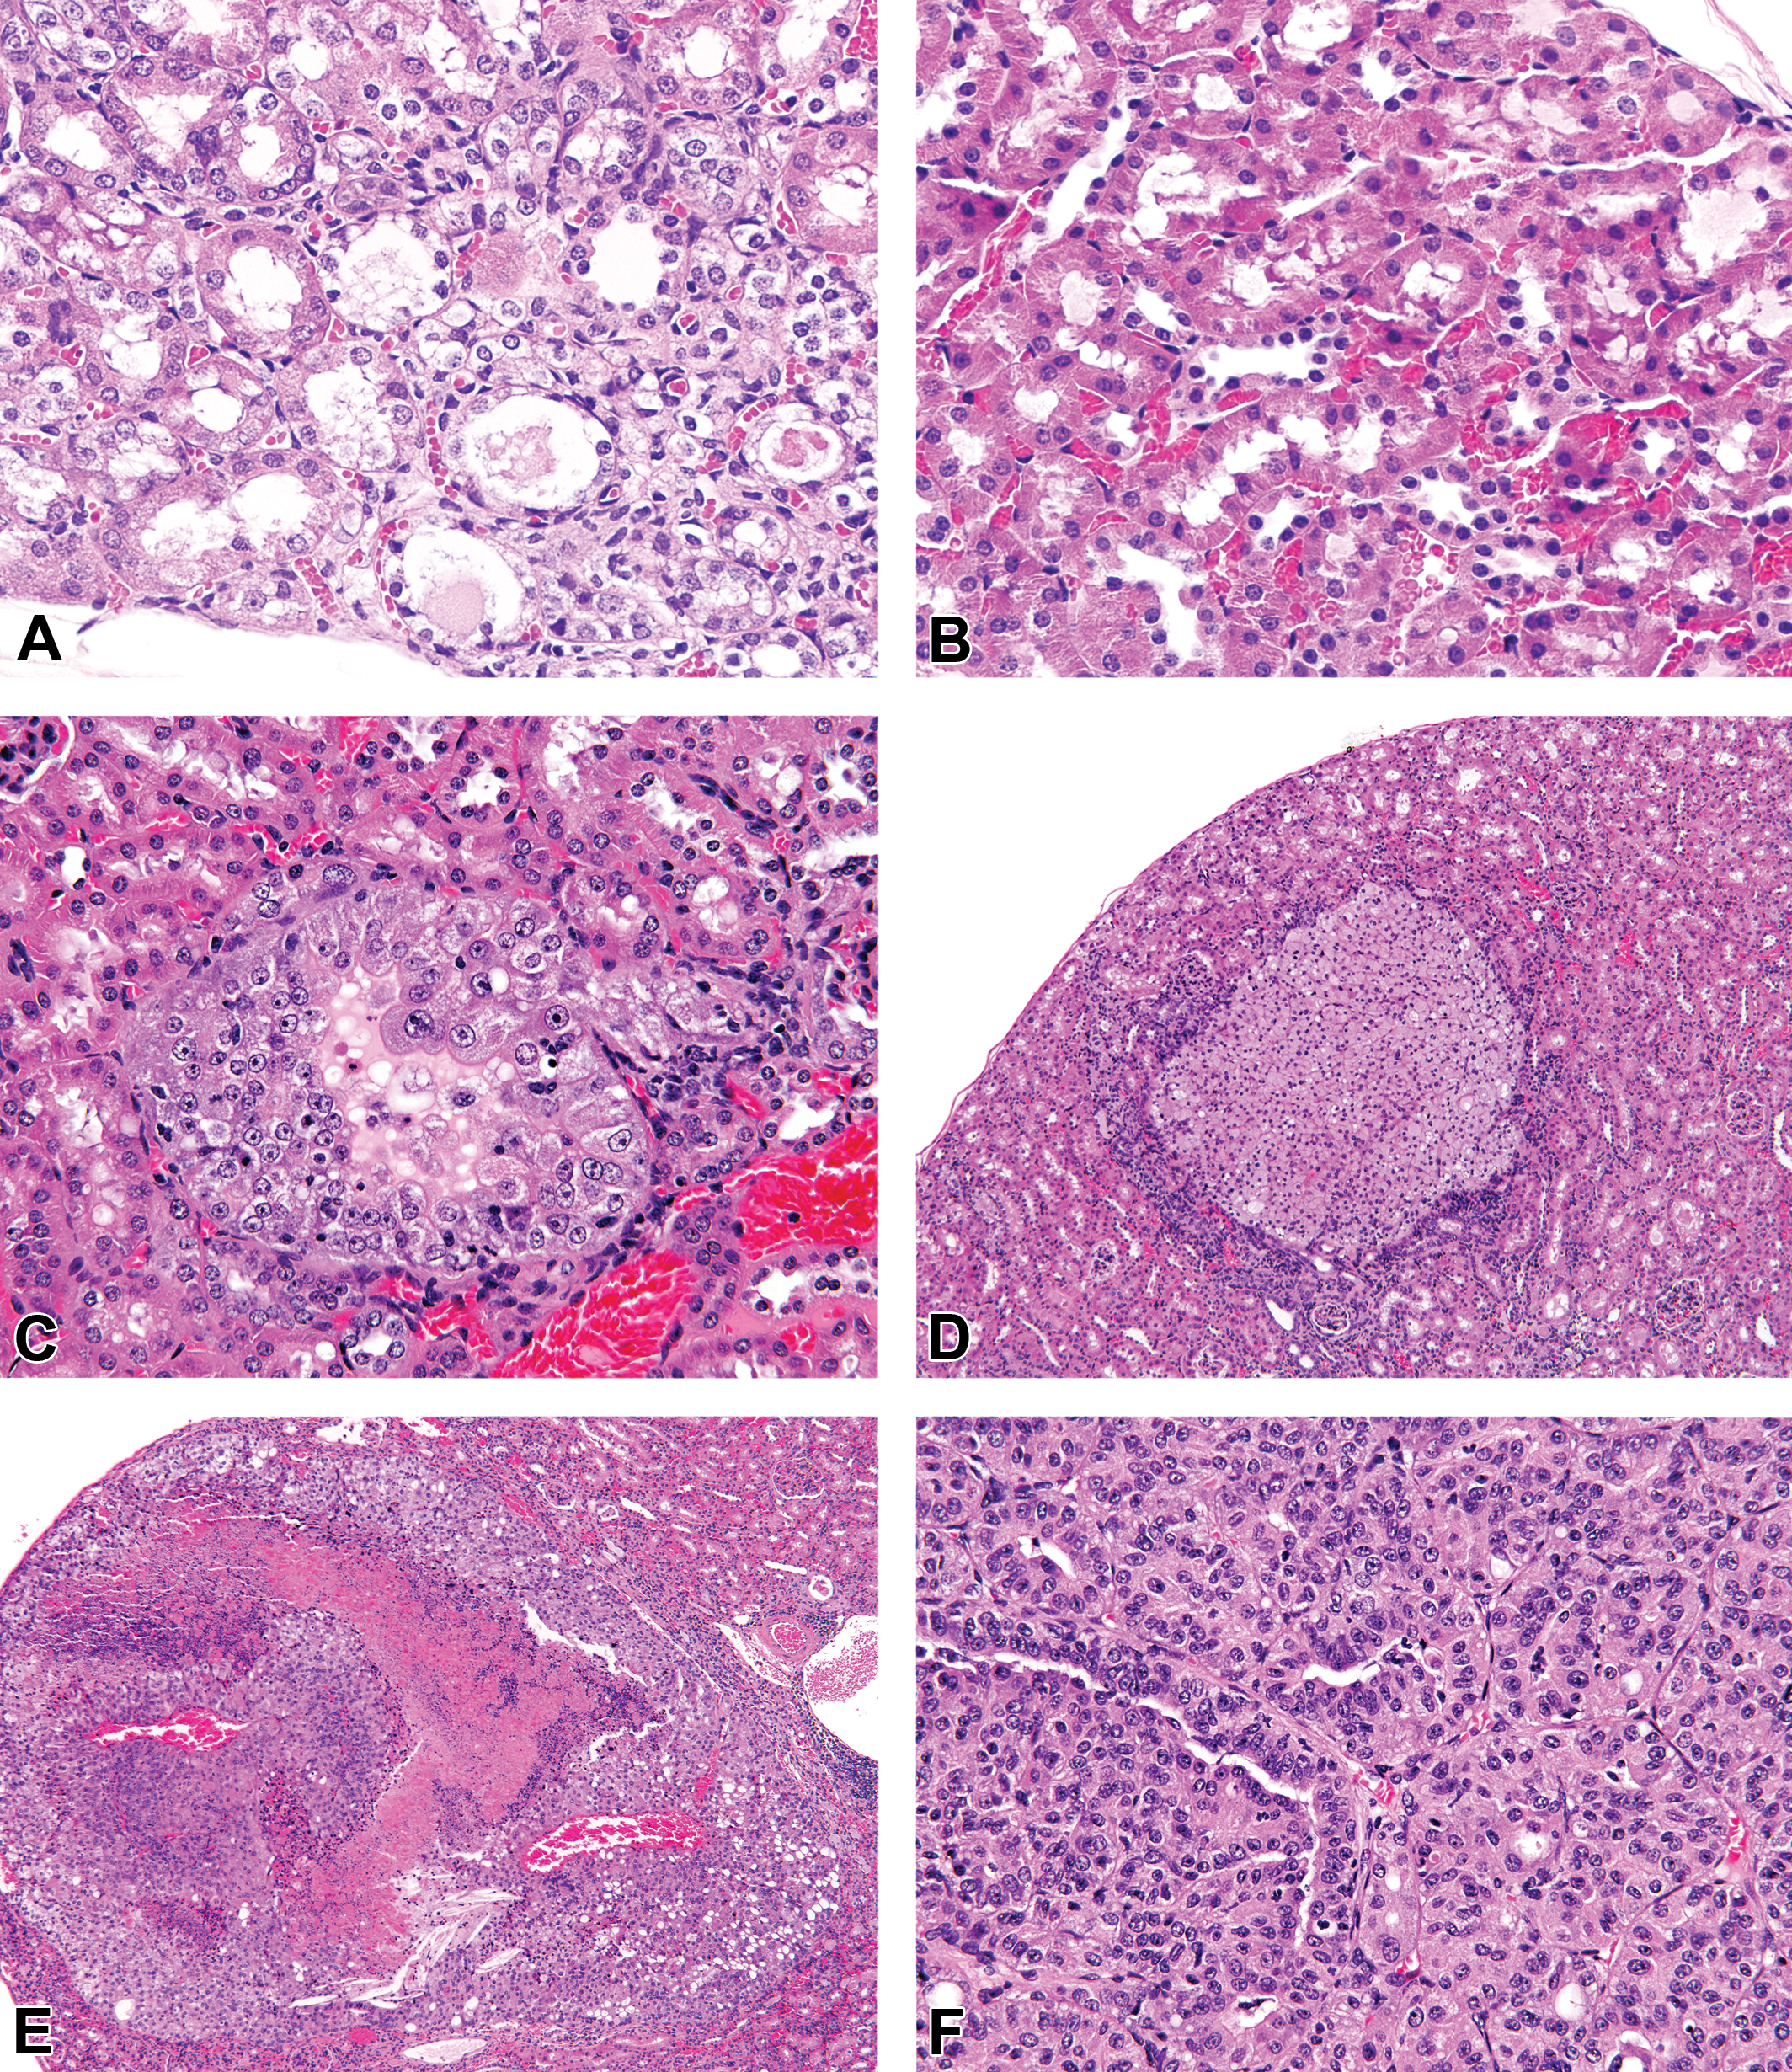
Histopathology of degenerate and proliferative renal tubular lesions in B6C3F1 mice exposed to vinylidene chloride (VDC). (A) Male mice exposed to VDC for 14 days had multifocal foci of proximal tubular epithelial degeneration and loss (original objective used: 40×), compared to female mice (B), which did not have appreciable renal tubular lesions (original objective used: 40×). In the 2-year carcinogenicity bioassay, proliferative lesions included renal tubular hyperplasia (C), which was composed of a focal, multilayered proliferation of renal tubular epithelial cells less than 5 tubules in diameter, partially filling the tubular lumen without compression of adjacent parenchyma (original objective used: 40×) (D) Renal cell adenoma composed of an expansile proliferation of sheets of epithelial cells causing locally extensive compression of adjacent renal cortical parenchyma (original objective used: 10×). (E) Large renal cell carcinoma (RCC) with local invasion of the renal parenchyma and central necrosis (original objective used: 10×). RCCs often had a mixed solid to papillary growth pattern (F, original objective used: 20×).
Unsupervised hierarchical cluster analysis plot illustrating clear clustering of renal cell carcinoma tumor samples (“R”) from treated nontumor (“T”) and chamber normal control (“C”) kidney, and overlap of normal chamber control and treated nontumor samples based on global gene expression (A) and multiple comparison analysis of differentially expressed transcripts (B) (red = upregulated and green = downregulated).
Principal component analysis of renal cell carcinoma (RCC) tumor samples (red), treated nontumor kidney (blue), and chamber control normal kidney (green). Based on (A) global gene expression of all transcripts. (B) Differentially expressed transcripts from the pairwise comparison analysis, which show segregation of RCC samples but overlap of treated nontumor kidney and chamber control normal kidney. (C) Trend analysis where overlap is not observed.
Comparison of renal cell carcinoma (RCC), vinylidene chloride (VDC)-exposed nontumor kidney, and chamber control normal kidney by hierarchical cluster analysis (HCA) and principal component analysis (PCA). Without the influence of gene expression from RCC samples, there remains overlap between chamber control normal kidney and treated nontumor kidney on HCA (A) and PCA (B) based on evaluation of global gene expression from pairwise comparison analysis. However, based on pairwise comparison analysis of only the differentially expressed transcripts, there is clear clustering of these 2 groups by HCA (C) and separation between these 2 groups on PCA (D), illustrating clear alterations in gene expression based on VDC exposure.
Ingenuity pathway analysis of vinylidene chloride (VDC)-exposed nontumor kidney compared to chamber control kidney. VDC-exposed nontumor kidney showed overrepresentation of pathways associated with cell cycle checkpoint regulation, molecular mechanisms of cancer, cell growth and proliferation pathways, xenobiotic metabolism, oxidative stress, and DNA damage (yellow line = significance threshold at p < .05).
The differentially expressed gene lists obtained from the multiple comparisons testing described above were uploaded into Ingenuity Pathways AnalysisTM (IPA) software (www.ingenuity.com) for identification of pathways enriched for differentially expressed transcripts (DETs). The IPA Knowledge Base database consists of data with known biological relationships between genes and gene products curated from the literature. Enrichment of pathway members among differentially expressed probe sets was assessed using the one-tailed Fisher exact test. A complete list of differentially expressed genes between RCC and nontumor kidney in VDC-exposed mice compared to chamber controls is available in Supplemental Table 1.
The principal component analysis (PCA) and the hierarchical cluster analysis (HCA) plots were created using Partek Genomics Suite version 6.6 (Partek Inc., St. Louis, MO). We used sample correlation matrix for computing the principal components (PCs). We used 3 PCs when computing the percentage variation explained based on the RMA normalized data. To obtain HCA heat maps, we used the Pearson’s dissimilarity metric and Ward’s clustering method on standardized gene expression data.
Immunohistochemistry
Immunohistochemistry was performed using the standard avidin–biotin–peroxidase technique on FFPE tissue sections of kidneys from chamber control and VDC-exposed male and female mice in the NTP 14-day and 90-day bioassays, and on RCC from VDC-exposed male B6C3F1 mice from the 2-year chronic carcinogenicity bioassay. Unstained sections were deparaffinized in xylene and rehydrated through graded ethanol. Primary antibodies included rabbit polyclonal TP53 antibody (1:500; Vector Laboratories, Burlingame, CA), gamma histone 2AX (γH2AX; 1:5,000; Cell Signaling Technology, Danvers, MA), and c-Myc (1:75; Abcam, Cambridge, MA), and CYP2E1 (1:1,000; Millipore, Billerica, MA). Endogenous peroxidase blocking was done by immersing the sections in 3% H2O2, after which antigen retrieval was performed with heat and pressure in a citrate buffer (Biocare Medical, CA). Endogenous biotin and avidin binding sites were blocked using Avidin–Biotin Blocking kit (Vector Laboratories). For negative controls, the primary antibody was substituted with normal serum from the same species as the source of the secondary antibody (Chrompure; Jackson ImmunoResearch, West Grove, PA). Secondary incubation was done with respective antibodies and the antigen–antibody complex was detected using Vectastain Elite ABC R.T.U. label (Vector) and 3,3-diaminobenzidine DAB chromogen (Dako, Carpinteria, CA). Slides were then counterstained with hematoxylin, dehydrated, and coverslipped.
Results
Exposure to VDC Results in Increased Incidence of Renal Cell Degeneration at Early Timepoints, and Renal Cell Hyperplasia, Renal Cell Adenomas, and RCCs by 2-Years in Male Mice
Exposure of male B6C3F1 mice to 25, 50, 100, 200, and 400 ppm VDC for 14 days resulted in renal tubular degeneration (Figure 1A), compared to female mice, which did not have kidney lesions (Figure 1B). Similar findings were observed in male mice exposed to 50 ppm VDC by inhalation for 90 days, with no kidney lesions observed in females. Exposure of male and female B6C3F1 mice to 6.25, 12.5 and 25 ppm of VDC over a 2-year period (NTP TR582; 2015) resulted in treatment-related increases in renal proliferative lesions that included renal tubular hyperplasia, renal cell adenoma, and RCC (Table 4). Proliferative lesions were limited to male treatment groups. Single or multiple foci of renal tubular hyperplasia were observed in VDC-exposed nontumor kidneys; this lesion was characterized by a proliferation of renal tubular epithelial cells of uniform cell type <5 tubules in diameter, multilayered or solid, with partial or complete obliteration of the tubular lumen and with little or no compression of adjacent parenchyma or basement membrane thickening (Figure 1C). Similarly, exposure to VDC resulted in a dose-dependent increase in the incidence of renal tubular adenomas and renal tubular carcinomas in male mice. Renal tubular adenomas were characterized by a solitary mass with a solid to papillary growth pattern, vascular ingrowth, compression of the adjacent renal parenchyma, and a delicate capsule of fibroblasts or pseudocapsule composed of compressed adjacent renal parenchyma (Figure 1D). Occasionally, adenomas were multiple or bilateral. Carcinomas tended to be either markedly compressive or invasive into adjacent renal parenchyma (Figure 1E) and were often associated with necrosis, hemorrhage, mineralization, osseous metaplasia, and/or spaces filled with eosinophilic fluid. Renal carcinomas were solid to papillary, cystic, or had a mixed growth pattern (Figure 1F).
Incidence of Renal Tubular Proliferative Lesions in Male B6C3F1 Mice from the National Toxicology Program 2-Year Vinylidene Chloride Bioassay.a
aB6C3F1 mice were exposed to 0, 6.25, 12.5, or 25 ppm vinylidene chloride by inhalation 5 days a week for 2 years.
*Significantly different at p < .05 from vehicle control group by the Poly-3 test.
**Significantly different at p < .01 from vehicle control group by the Poly-3 test.
Multiple Comparison Analysis Shows Clear Segregation of RCC from Exposed Nontumor and Normal Kidney, Whereas Trend Analysis Provides Clear Segregation of All Experimental Groups
In order to evaluate the relationship of each experimental group to one another in terms of their gene expression, we performed unsupervised HCA based on global gene expression (evaluation of all genes on the microarray; Figure 2A) as well as cluster analysis of only the statistically significant DETs (Figure 2B). There was distinct clustering of RCC in VDC-exposed mice, but VDC-exposed nontumor kidney and chamber control kidney showed overlapping gene expression in analyses of both global gene expression and only statistically significant DETs. PCA illustrated clear clustering of the RCC in VDC-exposed mice. However, there was a difference in the PCA plots based on the trend analysis and multiple pairwise comparisons. There was overlap in the chamber control normal kidney and VDC-exposed nontumor kidney based on global gene expression (Figure 3A) and in the multiple pairwise comparison analysis of the DETs (Figure 3B) but based on trend analysis this overlap was not observed on PCA (Figure 3C). When the chamber control normal kidney and VDC-exposed nontumor kidney samples were analyzed separately from RCC, there is still overlap on HCA (Figure 4A) and PCA (Figure 4B) based on global gene expression; however, when comparing DETs between chamber controls and treated nontumor kidney, a clear clustering on HCA (Figure 4C) and a clear separation between groups on PCA (Figure 4D) can be observed indicating that VDC exposure results in differential gene expression in the kidney. The differences between VDC-exposed and control kidneys are more apparent when directly comparing the DETs from these 2 groups than when considering these expression profiles along with the overwhelming transcriptional alterations associated with the tumor samples.
Global Gene Expression Analysis of Nontumor Kidney in VDC-Exposed Mice Identifies Pathways Associated with Xenobiotic Metabolism, Oxidative Stress, and DNA Damage
To assess how this differential gene expression correlated with biologic outcomes, a comparison analysis was performed using ingenuity pathway analysis (IPA) software. When comparing expression profiles between VDC-exposed nontumor kidney and chamber control kidney, we identified several overrepresented pathways associated with cell cycle checkpoint regulation, xenobiotic metabolism, oxidative stress and DNA damage response, cell growth and proliferation pathways, and molecular mechanisms of cancer (Figure 5 and Table 3). Significant pathways involved in xenobiotic stress included glutathione (GSH) metabolism, oxidative stress, and aryl hydrocarbon receptor (Ahr) signaling. Within these xenobiotic pathways, there was upregulation of genes involved in phase I (Cyp26a1 and Cyp2j2) and phase II (Gsta3, Gstm5, Aldh, and Xdh) xenobiotic transformation. Overrepresented gene categories associated with oxidative stress and DNA damage included NRF2 and Ahr pathways. Pathways associated with cell cycle regulation and molecular mechanisms of carcinogenesis included those in the G2/M cell cycle checkpoint and Tp53 target genes and ATM pathway (Cdkn1a, Chek1, Ccng1, and Mdm2).
Global Gene Expression Analysis of RCC in VDC-exposed Mice Identifies Pathways Associated with Cancer Signaling and Human RCC Development
To investigate changes related to carcinogenesis in VDC-exposed animals, a comparison analysis between nontumor kidney and RCC was performed in VDC-exposed mice within the context of normal chamber control kidney. A set of 925 differentially expressed (up- or downregulated) genes were identified in nontumor kidney, and a gene set of 4,987 differentially expressed genes were identified in RCC from VDC-exposed mice compared to normal kidney. Gene categories associated with cancer signaling included cell cycle, cell proliferation, cell death, cellular movement, and inflammatory response in RCC compared to nontumor kidney (Figure 6A). Gene categories associated with toxicologic functions in RCC included renal necrosis/cell death, renal tubule injury, renal inflammation, kidney failure, and nephrosis (Figure 6B). Canonical pathways overrepresented in RCC included oxidative phosphorylation, mitochondrial dysfunction, PTEN signaling, DNA damage repair (Aft2/4, Brca1, Fancd2, H2afx, and Rad50/51) and cell cycle checkpoint regulation (Ccna2, Ccnb2, Ccnd1, Cdc25b/c, Cdk1/2, and Chek1/2), TP53 signaling (Tp53, Tp53bp1, and Mdm4), and signaling through cell growth and proliferation pathways including ATM, PI3K/AKT, RhoA, and ERK/MAPK pathways (Figure 6C and Table 3). Select differentially expressed genes were validated by quantitative PCR (qPCR; Figure 7). Gene expression was expressed as positive fold change (upregulation) or negative fold change (downregulation) compared to chamber control kidney. Genes were selected based on known involvement in cancer progression (Tp53, Mdm2, Cdnk1a, Cdk1, c-Myc, and Areg), in oxidative stress and xenobiotic metabolism (Nrf2, Exph1, and Cyp2j2), or in normal renal homeostasis (Mup1 and Calb1). In all genes validated except for Tp53, RNA expression was consistent with the directional changes observed on the microarray. Tp53 was slightly upregulated on microarray in RCC (1.272-fold upregulated) and was slightly downregulated by qPCR in both RCC and VDC-exposed nontumor kidney (Figure 7).
Ingenuity pathway analysis comparison of renal cell carcinoma (RCC) and nontumor kidney in vinylidene chloride–exposed B6C3F1 mice from the pairwise comparison analysis (dark blue line = RCC, light blue line = nontumor kidney, yellow line = significance threshold at p < .05). (A) Overrepresented biologic categories in RCC included cell death, cancer, cell proliferation, assembly, and function, cell cycle, and cell movement. (B) Toxicologic pathways overrepresented in RCC included renal necrosis, renal tubular injury, nephritis, nephrosis, and kidney failure. (C) Overrepresented canonical pathways in RCC compared to nontumor kidney including oxidative phosphorylation, mitochondrial dysfunction, Pten signaling, cell cycle checkpoint regulation, Tp53 signaling, cell growth, and proliferation pathways (ATM, PI3K/AKT, RhoA and ERK/MAPK).
Quantitative PCR validation of gene expression changes in renal cell carcinoma and nontumor kidney in vinylidene chloride–exposed B6C3F1 mice compared to chamber control kidney. Each bar represents the average of 6 biologic samples per experimental group, assayed in technical duplicates.
CYP2E Expression Is Increased in Degenerating Renal Tubules in VDC-exposed Male Mice, and RCCs Have Alterations DNA Damage and Repair Proteins
By immunohistochemistry, there was variable expression of CYP2E1 in the proximal renal tubular epithelium of VDC-exposed male and female mice at the 14-day and 90-day timepoints. At the 14-day and 90-day timepoints, there was no appreciable difference overall in cytoplasmic staining between male and female mice, except for multifocal accumulation of granular cytoplasmic staining in degenerating tubules in male mice (Figure 8A and B). In RCCs from the chronic 2-year bioassay, there was multifocal nuclear expression of γH2AX in all RCCs (Figure 8C), an indicator of double-strand DNA breaks and repair. Tumors that expressed γH2AX also showed nuclear expression of TP53 (Figure 8D). Minimal MYC protein expression was observed in 1 of 5 RCCs from VDC-exposed B6C3F1 mice (data not shown).
Immunohistochemistry of kidney lesions in B6C3F1 mice. There was diffuse cytoplasmic expression for CYP2E1 in renal tubular epithelial cells in female (A) and male (B) mice, with multifocally increased immunolabeling in degenerate tubules in male mice (arrowheads, original objective used: 40×). There was multifocal nuclear expression of γH2AX (C, anti-H2AX antibody, original objective used: 40×) and TP53 (D, anti-TP53 antibody, original objective used: 40×) in renal cell carcinomas from 4 of 5 vinylidene chloride–exposed B6C3F1 mice.
Prolonged TP53 Half-life Is Not Due to Tp53 Mutation in RCC from VDC-exposed Mice
Since 80% of RCCs from VDC-exposed mice had upregulation of Tp53 expression by microarray and qPCR, as well as nuclear expression of TP53 by immunohistochemistry, we assessed the Tp53 mutation status of these tumors at the “hot spot” regions of the gene (exons 5–8). Despite overexpression of TP53 protein, mutations in the Tp53 gene were not observed in this region in any RCCs from VDC-exposed mice (data not shown).
Discussion
Exposure to VDC by inhalation over 2 years resulted in renal carcinogenesis primarily in male B6C3F1 mice. In this study, we used differential transcriptomic analysis to elucidate the alterations present in RCC as well as in nontumor kidneys containing hyperplastic lesions in VDC-exposed mice, in order to better understand the chronic renal effects of VDC exposure and the relevance of these changes to human renal cancer.
Classic renal carcinogens tend to be genotoxic chemicals (Hard 1998). Either the carcinogen itself or a reactive metabolite has the capability of interacting directly with DNA to form chemical-DNA adducts (Hard 1998; Lock and Hard 2004). Various studies indicate that VDC, with metabolic activation, is genotoxic in bacteria, yeast, and fungi (Bartsch et al. 2000; Bronzetti et al. 1981; Henschler and Bonse 1977). However, genotoxicity studies in mammalian cells have been equivocal (Drevon and Kuroki 1979; McGregor et al. 1991), and unlike vinyl chloride (Whysner et al. 1996), DNA adduct formation has not been reported (Whysner et al. 1996). Similarly, results were equivocal in the current NTP genotoxicity testing (NTP TR582; 2015). These largely negative genotoxicity results suggest that VDC exposure may influence the development of RCC through nongenotoxic, or indirectly genotoxic, mechanisms. Nongenotoxic carcinogens may affect the stability or activity of key regulatory proteins and indirectly induce DNA damage through the mediation of reactive oxygen species (ROS) and reactive nitrogen species, resulting in aberrations of gene expression including overexpression of oncogenes and loss of tumor suppressor gene function. In nontumor kidney, we observed overrepresentation of several pathways involved in xenobiotic signaling, oxidative stress, cell cycle regulation, and DNA damage and repair, including upregulation of the NRF-2 pathway, which plays a significant role in xenobiotic signaling and the oxidative stress response (Jung and Kwak 2010). ROS can directly produce single- or double-stranded DNA breaks, and persistent DNA damage resulting in replication errors and genomic instability (Klaunig et al. 1998). Constitutive and chronic upregulation of these pathways has been linked to cellular stress and cytotoxicity as well as resultant cellular proliferation and carcinogenesis through nongenotoxic mechanisms.
Numerous studies on the metabolism of VDC in rodents have been published implying nongenotoxic effects related to bioactivation for liver, lung, and renal toxicity following exposure (Forkert 2001; Hanioka et al. 1997; Lee and Forkert 1994; Liebler, Meredith, and Guengerich 1985; Simmonds et al. 2004; Speerschneider and Dekant 1995). Two complementary mechanisms for bioactivation include oxidation by P450 cytochromes and conjugation of GSH by glutathione-S-transferase. Speerschnerider and Dekant (1995) showed that CYP-induced renal damage was species, strain, and sex specific, as mice were much more susceptible than rats, kidney damage was more prominent in male mice, and CD-1 mice were a more susceptible strain, while the C57BL/6J strain was least susceptible (Speerschneider and Dekant 1995). Previous studies have shown that the predominance of kidney lesions in CD-1 males is due to a sexual dimorphism in CYP2E1 expression in the kidney, which plays a major role in the bioactivation of VDC (Lee and Forkert 1994, 1995). As a result, toxicities resulting from exposure to compounds inducing CYP2E1 are much more severe in males than in females, at least in the CD-1 mouse strain. In the acute 14-day NTP toxicity study in B6C3F1 mice (NTP 2015), VDC toxicity associated renal injury was observed histologically in the 50, 100, 200, and 400 ppm male dose groups but was not seen in females. Cyp2e1 gene expression was not upregulated in nontumor kidney in this study; however, since VDC is reported to be catalyzed predominantly by CYP2E1, and epoxide conjugates are undetectable 4 hr after exposure (Forkert 1999), this suggests that Cyp2e1 induction is an early event that was possibly not captured in the analysis of kidneys from the 2-year carcinogenicity study. Frozen kidney was not available for gene expression analysis from earlier exposure points (14 and 90 days) nor from female mice; however, higher amounts of CYP2E1 protein were detected by immunohistochemistry in sporadic individual degenerative proximal tubular epithelial cells in FFPE tissues from male B6C3F1 mice compared to females exposed to VDC by inhalation for 14 and 90 days.
VDC intermediates formed in the liver as a result of oxidative metabolism are conjugated with GSH, and these GSH conjugates are transported in the blood to the kidney (Dekant, Vamvakas, and Anders 1989). In renal tubular epithelial cells, metabolism of GSH conjugates through secondary modification by beta-lyase and cysteine conjugate S-oxidase produces reactive metabolites, which contribute to renal tubular damage (Ban et al. 1995). There was significant upregulation of several genes in the GSH pathway, suggesting the involvement of this pathway in the metabolism of VDC in exposed animals. These mechanisms of renal tubular injury may impact regeneration and proliferation of renal tubular epithelium, and following chronic injury, may represent nongenotoxic mechanisms of carcinogenesis in VDC-exposed mice. Alternatively, cysteine conjugates can form DNA-binding genotoxic intermediates as a potential mechanism of carcinogenesis (Birner et al. 1993; Dekant and Henschler 1999). Such mechanisms may indirectly influence DNA damage and repair, and as such, RCC in this study was associated with aberrant signaling of a critically important DNA damage repair mediator and one involved in a majority of cancers, Tp53.
TP53 is a tumor suppressor gene that regulates the cell cycle and causes cell cycle arrest during DNA damage. It is heralded as the “guardian of the genome” (Lane 1992), and its function is altered in a majority of human cancers (Junttila and Evan 2009) including human RCC (Albers et al. 2013). Our global gene expression profiling indicated dysregulation of the Tp53 pathway, and there was downregulation of Tp53 in RCCs by qPCR. In addition, RCCs in this study showed nuclear expression of TP53. Nuclear expression of the TP53 protein is often associated with increased half-life of the protein due to gene mutation (Bennett et al. 1992; Hall and Lane 1994; Taylor et al. 1999; Wynford-Thomas 1992; Yemelyanova et al. 2011) or constitutive activation of DNA damage repair pathways (Shaw 1996; Wynford-Thomas 1992). As mutation analysis did not reveal Tp53 mutations, it is likely that constitutive activation of DNA damage pathways may be responsible for aberrant TP53 protein expression. Indeed, it is reported that TP53 is rarely mutated in human RCC but is either nonfunctional or repressed by overexpression of negative regulators such as Mdm2 or MdmX or loss of positive regulators such as Arf (Gurova et al. 2004). Negative regulators of TP53 were slightly upregulated in our microarray data set, including Mdm2 (1.372-fold upregulated) and MdmX (1.595-fold upregulated), but tumors showed nuclear expression of TP53 protein, suggesting that normal mechanisms of protein repression were not effective. Gurova et al. (2004) showed that in several RCC cell lines, TP53 protein undergoes the necessary stages of activation in response to DNA damage, including nuclear accumulation and DNA binding, but an as of yet unknown dominant repression mechanism prevents activation of transcription (Gurova et al. 2004). Therefore, given the lack of Tp53 mutation in the face of nuclear protein accumulation in the present study, it seems possible that a similar mechanism to the one described in human RCC may be in part responsible for RCC in VDC-exposed B6C3F1 mice. Alternatively, mutation outside of the hot spot region examined (exons 5–8) may have been responsible for the observed aberrant TP53 protein expression (Anczukow et al. 2008; Bennett et al. 1992; Hall and Lane 1994; Soussi and Beroud 2001; Taylor et al. 1999; Warburton et al. 2005; Wynford-Thomas 1992; Yemelyanova et al. 2011).
cMYC is a well-known oncogene that is frequently amplified in human RCC (Vignoli and Martorana 1997) and was upregulated 10-fold in RCC from VDC-exposed mice compared to chamber controls. cMYC is a classic oncogene, overexpressed in a large number of cancers, functioning as a growth switch without checks and balances (cell cycle arrest and apoptosis; Nilsson and Cleveland 2003). Deregulated CMYC expression can induce aberrant cellular proliferation, loss of terminal differentiation, abrogation of DNA damage-induced cell cycle arrest, genomic stability, and oncogenesis (Ho et al. 2005). CMYC protein is expressed in a number of human malignancies (Adhikary and Eilers 2005; Tang et al. 2009) including human RCC (Kinouchi et al. 1989; Tang et al. 2009; Yao et al. 1988). As TP53 and cMYC are involved in many of the same cellular processes, they have similar signal transduction targets and modulate overlapping activities in cell cycle progression. Under normal conditions, TP53 represses cMYC through mechanisms involving histone deacetylation (Ho et al. 2005). Thus in the absence of TP53 or in the presence of TP53 mutants, cMYC expression is greatly elevated (Nilsson and Cleveland 2003). In the current study, it is possible that elevation of cMyc transcripts may be due to gene amplification; however, cMYC protein expression was minimally detected in only one VDC-exposed RCC. While a key assumption is that mRNA expression is predictive of protein expression (Vogel and Marcotte 2012), several studies have shown that this can be inconsistent (Y. Guo et al. 2008; Maier, Guell, and Serrano 2009; Stark et al. 2006), possibly be due to regulatory proteins and small interfering RNAs acting as translational modulators, or other posttranscriptional modifications including phosphorylation, acetylation, and ubiquitinylation (Maier, Guell, and Serrano 2009; Stark et al. 2006; Vervoorts, Luscher-Firzlaff, and Luscher 2006). Alternatively, gene amplification of a noncoding or defective transcript may result in lack of downstream protein expression.
Consistent with a constitutive DNA damage response, γH2AX was expressed in 80% of the VDC-exposed RCC in male mice. γH2AX is critical for concentrating repair proteins and maintaining the integrity of the damage response foci (Celeste et al. 2003; Paull et al. 2000) and plays a role in the TP53/P21 pathway, as it is required for increasing p21 levels after replication inhibition that subsequently results in checkpoint activation and cell cycle arrest (Fragkos, Jurvansuu, and Beard 2009). Tumors that expressed γH2AX also expressed TP53, further corroborating the role of γH2AX in TP53/TP21-induced cell cycle arrest in VDC-exposed animals.
Conclusions
Cytotoxicity and consequent regenerative hyperplasia is a well-documented mechanism of action for a variety of non-DNA reactive chemical carcinogens (Dietrich and Swenberg 1991). Chemicals that function through this mode of action produce sustained cell death often related to metabolism of the chemical and accompanied by persistent regenerative growth, resulting in the potential for spontaneous DNA mutations and allowing mutated cells to accumulate and proliferate (Klaunig et al. 1998). In the current NTP study, short-term exposures (14 and 90 days) induced acute renal tubular necrosis and regenerative tubular hyperplasia exclusively in male mice, a possible prequel to renal neoplasia. In the 2-year bioassay, formation of renal cell neoplasms in male B6C3F1 mice exposed to VDC by inhalation were associated with perturbation of xenobiotic and oxidative stress pathways as well as alterations in DNA repair pathways and cell cycle regulation. Central to these pathways was the tumor suppressor gene Tp53 and its related target genes. Constitutive activation and nuclear expression of Tp53, without evidence of gene mutation, suggests that RCCs in these mice may develop in part through Tp53-dependent mechanisms involved in chronic DNA damage and repair and cell cycle dysregulation, possibly due to chronic oxidative stress induced by chronic exposure to VDC.
Footnotes
Acknowledgments
We would like to thank the NIEHS histology and immunohistochemistry laboratories, microarray core, DNA sequencing core, and the NTP Archives for their excellent technical expertise. We would like to also thank Beth Mahler and Eli Ney for their assistance with figures and images.
Author Contributions
Authors contributed to conception or design (AP, KS, SP, RS, and MH); data acquisition, analysis, or interpretation (SH, AP, TT, HH, NC, KS, SP, KG, MW, RS, and MH); and drafting the manuscript (SH, AP, KS, SP, and MH). All authors critically revised the manuscript, gave final approval, and agreed to be accountable for all aspects of work in ensuring that questions relating to the accuracy or integrity of any part of the work are appropriately investigated and resolved.
Declaration of Conflicting Interests
The author(s) declared no potential conflicts of interest with respect to the research, authorship, and/or publication of this article.
Funding
The author(s) received no financial support for the research, authorship, and/or publication of this article.