
Abstract
Exposure to the mycotoxin ochratoxin A (OTA) causes nephropathy in domestic animals and rodents and renal tumors in rodents and poultry. Humans are exposed to OTA by consuming foods made with contaminated cereal grains and other commodities. Management of human health risks due to OTA exposure depends, in part, on establishing a mode of action (MOA) for OTA carcinogenesis. To further investigate OTA’s MOA, p53 heterozygous (p53+/−) and p53 homozygous (p53+/+) mice were exposed to OTA in diet for 26 weeks. The former are susceptible to tumorigenesis upon chronic exposure to genotoxic carcinogens. OTA-induced renal damage but no tumors were observed in either strain, indicating that p53 heterozygosity conferred little additional sensitivity to OTA. Renal changes included dose-dependent increases in cellular proliferation, apoptosis, karyomegaly, and tubular degeneration in proximal tubules, which were consistent with ochratoxicosis. The lowest observed effect level for renal changes in p53+/− and p53+/+ mice was 200 μg OTA/kg bw/day. Based on the lack of tumors and the severity of renal and body weight changes at a maximum tolerated dose, the results were interpreted as suggestive of a primarily nongenotoxic (epigenetic) MOA for OTA carcinogenesis in this mouse model.
Introduction
Ochratoxin A (OTA) was first identified and structurally characterized from a culture of Aspergillus ochraceus Wilh. isolated from sorghum (van der Merwe et al. 1965) and is now known to be produced by species in the fungal genera Aspergillus and Penicillium (Varga et al. 2001). It is a phenylalanyl derivative of a substituted isocoumarin (R)-N-[5-chloro-3,4-dihydro-8-hydroxy-3-methyl-1-oxo-1H-2-benzopyran-7-y1)-carbonyl]-L-phenylalanine (Marin et al. 2013, van der Merwe et al. 1965). Although ochratoxigenic fungi may be present on crops at harvest, OTA is primarily produced in storage when crop moisture content, temperature, and other environmental conditions favor fungal growth (Ominski et al. 1994). OTA is widely distributed in food commodities including cereal grains, dried fruits, and spices, coffee, beer, wine, cocoa, and meats (Marin et al. 2013). Relative to other foods, consumption of OTA in cereal grain–based foods contributes significantly to human dietary OTA exposure (Duarte, Pena, and Lino 2010; Kuiper-Goodman et al. 2010).
Exposure to OTA is nephrotoxic in rodents, pigs, and poultry, and causes renal tumors in rodents and poultry (Battacone, Nudda, and Pulina 2010; Bendele et al. 1985; Boorman et al. 1992; Krogh et al. 1979; Stoev 2010). Thus, OTA has long been a suspected contributor to human nephropathies. Exposure to OTA in food has been linked to Balkan endemic nephropathy (BEN), a chronic progressive renal disease associated with upper urothelial tract tumors that occur in rural populations along the Danube River (Pfohl-Leszkowicz 2009). In this case, OTA involvement is controversial and there is also evidence supporting the carcinogenic plant toxin aristolochic acid as a causative agent of BEN (Grollman et al. 2007; Stefanovic, Polenakovic, and Toncheva 2011; Wu and Wang 2013). A recent review of studies linking OTA to human nephropathies concluded that there was no statistically significant evidence for human health risks associated with OTA exposure. However, the analysis was based on three studies that met the established criteria for review, underscoring the need identified by the authors for larger cohort or case-control OTA epidemiology studies and for studies validating biomarkers of human OTA exposure (Bui-Klimke and Wu 2014). Taken together, the classification of OTA by the International Agency for Research on Cancer (IARC) as a possible human carcinogen with sufficient evidence for carcinogenicity in experimental animals but inadequate evidence in humans (IARC 1993) is consistent with current knowledge. Although nephropathy is the primary noncancer outcome in OTA-exposed animals, establishing a link between chronic kidney disease and OTA exposure in humans is complicated by the multifactorial nature of renal disease (Jha et al. 2013; McClellan and Flanders 2003) and the lack of knowledge on OTA’s exact MOA.
Multiple MOAs for OTA-induced renal tumor formation and nephropathy have been proposed based on in vivo and in vitro studies. Although OTA exposure leads to DNA damage, there is controversy about whether this occurs due to direct interaction with DNA by OTA or a reactive OTA metabolite (genotoxicity), or indirectly due to interaction of OTA or a metabolite with non-DNA targets (nongenotoxicity). A covalent DNA adduct (C-C8 OTA 3′ dGMP) with mutagenic potential has been detected in kidneys from rats exposed to OTA, although independent laboratories have not confirmed these findings (Delatour et al. 2008; Mantle et al. 2010; Sharma, Manderville, and Wetmore 2013). In support of an indirect MOA, in vivo and in vitro studies indicate that OTA exposure increases the production of reactive oxygen species (ROS) leading to oxidative DNA damage in renal cells (Marin-Kuan et al. 2011). There is also evidence that OTA disrupts antioxidant defense responses regulated by the transcription factor nuclear factor-erythroid 2-related factor 2 (Marin-Kuan et al. 2006), which could exacerbate ROS-induced oxidative stress in kidney proximal tubule cells. Inhibition of gap junction intercellular communication has been associated with cancer development and has been shown to be disrupted by OTA in vitro (Mally et al. 2006). Cell-based assays and transcriptomic analyses of renal tissues and cultured cells indicate that OTA can perturb posttranslational protein modifications that regulate many cellular functions (Jennings et al. 2012). These include histone acetyltransferase inhibition leading to mitotic disruption that may explain, in part, OTA-associated karyomegaly, genetic instability, and tumorigenesis (Czakai et al. 2011; Mally 2012).
Uncertainty in the MOA for OTA-induced DNA damage impacts its risk assessment and management. Approaches for food-borne carcinogens are based, in part, on the assumption that there is no threshold for the dose response to genotoxic carcinogens, whereas homeostatic mechanisms impart a threshold to the dose response elicited by nongenotoxic carcinogens (Barlow et al. 2006). The Joint FAO/World Health Organization (WHO) Expert Committee on Food Additives (JECFA) considered that the weight of scientific evidence pointed to multiple nongenotoxic MOAs for OTA (JECFA 2008). Kuiper-Goodman et al. (2010) considered the genotoxicity of OTA to be equivocal and based their health risk assessment on genotoxicity, which is a default position for a substance with an unknown carcinogenic MOA and not an acknowledgment that genotoxicity per se is the MOA (European Food Safety Authority [EFSA] 2005). While many in vitro and in vivo studies contribute to determining OTA’s MOA, multidose chronic exposure and carcinogenesis studies provide the most valuable dose–response data for risk assessment. Two-year carcinogenesis studies using F344/N and B6C3F1 mice are key studies for OTA risk assessment (Bendele et al. 1985; JECFA 2008; Kuiper-Goodman et al. 2010; NTP 1989). The present 26-week study, a comparison of heterozygous p53+/− mice and corresponding p53+/+ mice exposed to OTA in diet, provides further data on the chronic toxicity and carcinogenicity of OTA over a dose range relevant for risk assessment.
Transgenic mice heterozygous for a null p53 allele display increased susceptibility to a wide range of carcinogens and a low spontaneous tumor incidence rate up to about 9 months in age (French, Storer, and Donehower 2001b). They have been used as a model to identify potential chemical carcinogens (Donehower et al. 1992; French et al. 2001a). The p53 protein acts as a transcription factor that regulates multiple genes involved in cellular functions and genome maintenance (Harris and Levine 2005). The U.S. National Institute of Environmental Health Sciences/National Toxicology Program (NTP) evaluated the p53+/− mouse for use in short-term carcinogenicity testing and observed decreased latency and increased susceptibility to tumor formation by genotoxic carcinogens (Dunnick et al. 1997; French et al. 2001a; French, Storer, and Donehower 2001b; Pritchard et al. 2003; Tennant, Spalding, and French 1996). Previous chronic dietary exposure studies using the p53+/− mouse in our laboratory supported a nongenotoxic MOA for the carcinogenic fungal toxin fumonisin B1, which was consistent with the disruption of sphingolipid metabolism and cellular regulators of apoptosis and proliferation rather than direct genotoxicity (Bondy et al. 2012). In this study, the p53+/− mouse model was used to provide further insight into the MOA for OTA carcinogenesis.
Methods and Materials
Toxin and Diet Preparation
OTA (>98% purity; benzene free) was purchased from Sigma-Aldrich Canada (Oakville, ON, Canada). All mice received a modified AIN-93M diet (Dyets Inc., Bethlehem, PA) during the acclimation period and throughout the study. To prepare test diets, OTA was dissolved in methanol and added to the diet. The resulting slurry was mixed thoroughly while the methanol was removed by evaporation to dryness, resulting in a stock diet containing 1.6 g of OTA/kg diet. The OTA stock diet was mixed with control diet using an industrial food mixer to prepare test diets containing 1-, 15-, or 40-mg OTA/kg diet (weeks 1 and 2) and 0.5-, 2-, or 10-mg OTA/kg diet (weeks 3–26).
Diet samples were collected monthly during the study to verify OTA levels in treatment diets and to detect background OTA levels in the control diet. Feed analyses methods were adapted from Lombaert et al. (2003). Briefly, feed samples were extracted with acetonitrile, methanol, and water (1:1:2) by volume; centrifuged; and filtered. Aliquots of each sample were diluted with phosphate buffered saline solution (PBS) and cleaned up using an LCTech OTAClean immunoaffinity column (Dorfen, Germany) prior to OTA determination by liquid chromatography (LC) with fluorescence detection. A 50-µl volume was injected onto the LC system consisting of a Waters Alliance 2695 liquid chromatograph (Milford, MA) combined with Waters 2475 multiwavelength fluorescence detector and a 150 mm × 2.1 mm (3 µm) reversed phase Waters Atlantis dc18 analytical column. The fluorescence detector was set to 333 nm excitation and 460 nm emission wavelengths.
The OTA primary reference standard (Sigma-Aldrich Canada, Oakville, Ontario, Canada) was prepared in benzene:acetic acid (99:1). Calibration standard solutions were prepared in acetonitrile/water/acetic acid (99:99:2) by volume ranging from 1 to 20 ng/ml, representing 2 to 40 ng/g in samples. The limit of quantitation for OTA was 6 ng/g. This was determined as that level of standard in sample matrix producing a chromatographic signal/noiseptp ratio of 10. The limit of detection for OTA was 1.6 ng/g, determined with a chromatographic signal/noiseptp ratio of 3.
Recovery experiments were performed with each sample set using a known negative rodent feed sample. Samples were spiked at 4 ng/g. The mean recovery for OTA was 108% (SD = 2.5%, n = 3). Qualitative confirmation of the analyte identity was performed by methyl esterification. Following sample analysis, an aliquot of each calibration standard and sample solution was removed and methyl esterified. Methyl esterification resulted in the diminution of the OTA chromatographic peak and the appearance of a new chromatographic peak corresponding to methyl-OTA.
Animals and Study Design
Forty male p53+/− mice (P53N5-T) mice and 40 male p53+/+ (P53N5-W) mice, 5 to 7 weeks old, were purchased from Taconic Farms Inc. (Germantown, NY). Mice were weighed and individually caged upon arrival. Cages were housed in semirigid HEPA-filtered isolator units manufactured for Health Canada by Charles River (Boston, MA). Mice received modified AIN-93M diet and water ad libitum for 1 week prior to the study while acclimating to the animal facility and isolator units. Temperature and humidity inside the isolator units were monitored daily for the duration of the study. Throughout the study, mice received care and handling according to the requirements of the Canadian Council for Animal Care.
The mean body weight (BW) of all mice (p53+/+ and p53+/−) upon arrival was 26.0 ± 2.4 g. During acclimation, p53+/+ and p53+/− mice were divided randomly into 4 groups of 10 mice/dose/strain. There were no significant differences in starting BWs across dose groups and strain at the beginning of the study (Table 1). During the study, mice received water and control or test diet ad libitum. BW and food consumption data were collected weekly. At the beginning of the study, p53+/+ and p53+/− mice received feed containing 0-, 1-, 15-, or 40-mg OTA/kg diet, as in Bendele et al. (1985). By the end of week 2, BWs in p53+/+ mice were 20% and 28% lower in the 15- and 40-mg/kg dose groups, respectively; in p53+/− mice, BWs were 27% and 31% lower in the 15- and 40-mg/kg dose groups, respectively (Figure 1A and B). Due to rapid weight loss, test diets were removed from the p53+/+ and p53+/− medium- and high-dose groups at the end of week 2 and replaced with control diet for 24 hr. After 24 hr, reformulated diets were given to all test groups (Figure 1). For the remainder of the study, mice received 0-, 0.5-, 2-, or 10-mg OTA/kg diet. After 26 weeks, final BWs were recorded and all mice were exsanguinated by cardiac puncture under isoflurane anesthesia (Baxter Corporation, Mississauga, ON, Canada). Organ weights were recorded at necropsy for liver, kidney, thymus, and spleen.
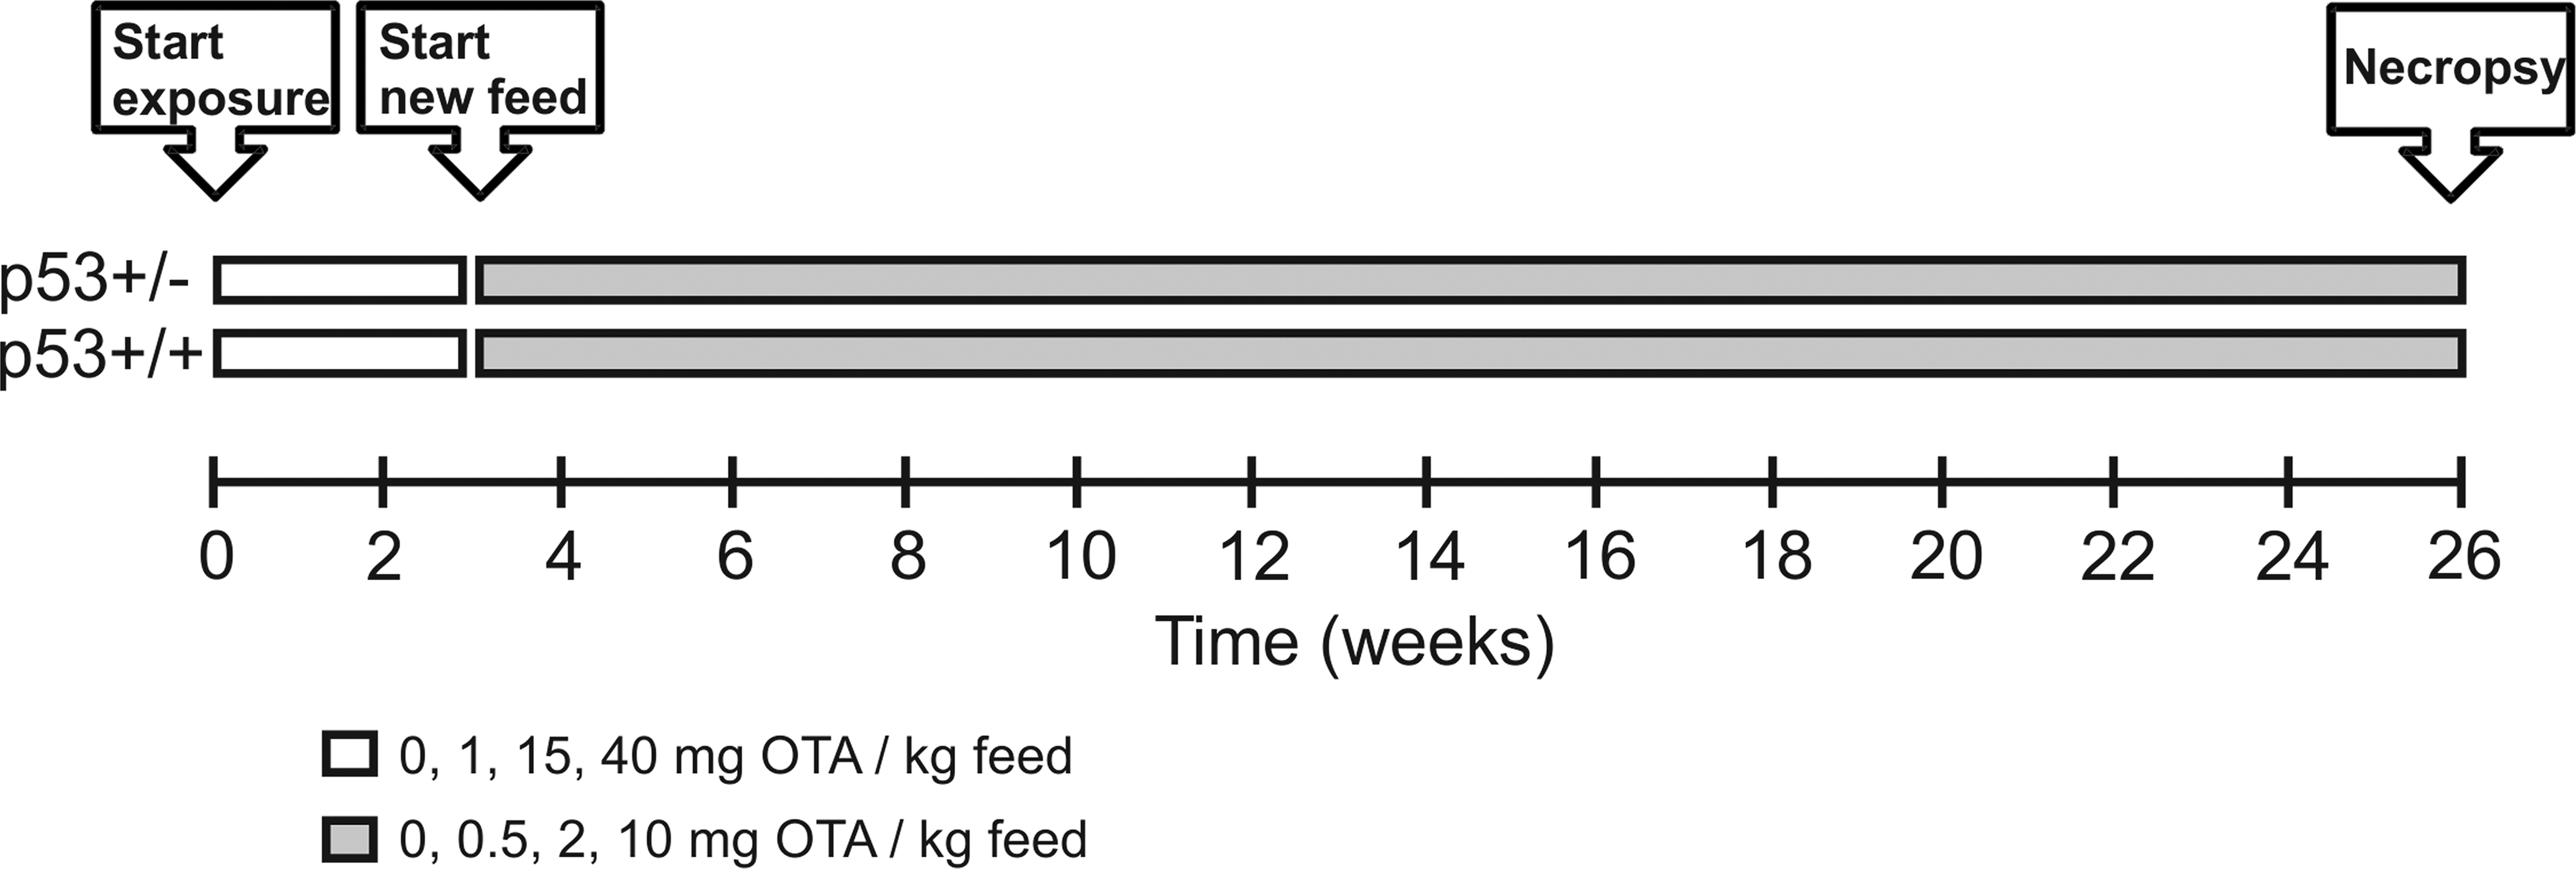
Time line for exposure of p53+/+ and p53+/− mice to ochratoxin A in diet.
Initial BW, final BW, and final organ weights of p53+/+ and p53+/− mice exposed to dietary OTA for 26 weeks.
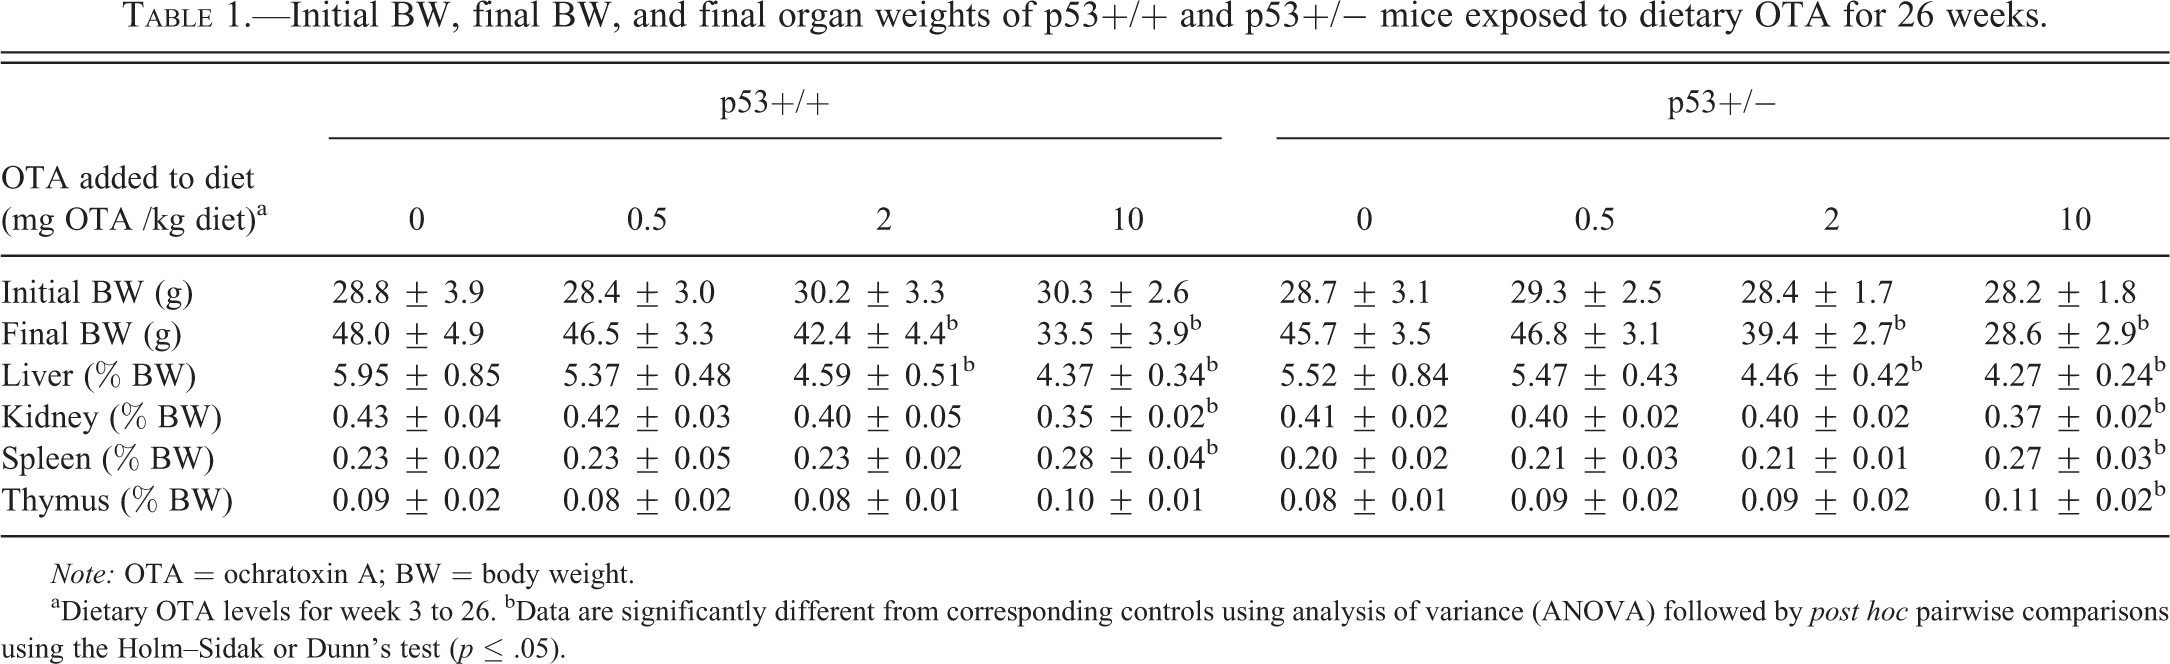
Note: OTA = ochratoxin A; BW = body weight.
aDietary OTA levels for week 3 to 26. bData are significantly different from corresponding controls using analysis of variance (ANOVA) followed by post hoc pairwise comparisons using the Holm–Sidak or Dunn’s test (p ≤ .05).
Hematology and Immunology
Whole blood was collected in ethylenediaminetetraacetic acid (EDTA) at necropsy. White blood cells (WBCs), neutrophils, lymphocytes, monocytes, eosinophils, and basophils were enumerated using a Coulter AcTTM 5 Diff Cap Pierce Hematology Analyzer (Beckman Coulter, Mississauga, ON, Canada).
Immunophenotype analysis of whole blood by flow cytometry was based on four color panels using the following monoclonal antibodies (BD Biosciences, Mississauga, ON, Canada): rat anti-mouse CD45 phycoerythrin-cyanine 5.5 (PE-Cy5.5) clone 30-F11, Leucocyte Common Antigen; hamster anti-mouse CD3e fluorescein isothiocyanate clone 145-2C11, T lymphocyte; rat anti-mouse CD4 allophycocyanine clone RM4-5, T helper lymphocyte; rat anti-mouse CD8a R-phycoerytherin clone 53-6.7, T cytotoxic lymphocyte; rat anti-mouse CD19 allophycocyanine clone 1D3, B lymphocyte; rat anti-mouse CD49b phycoerythrin clone DX5, natural killer cell. Blood samples were mixed with antibodies and incubated for 10 min protected from light at room temperature. Red blood cells were lysed using a TQ-Prep (Beckman Coulter, Mississauga, ON, Canada) and Immunoprep lysis reagent (Beckman Coulter, Brea, CA). Lymphocyte subset analyses were performed by flow cytometry using a Becton Dickinson FACSCalibur System equipped with 488 nm and 635 nm air-cooled lasers (BD Biosciences, Mississauga, ON, Canada).
Splenocyte suspensions for immunophenotyping were prepared in Dulbecco’s phosphate buffered saline (D-PBS; Gibco/Invitrogen, Grand Island, NY) by gently crushing tissues in a 70-μm nylon cell strainer (BD Falcon, Bedford, MA) and rinsing into a 50-ml tube. Prior to staining, WBCs were counted using a Beckman Coulter AcTTM 5 Diff Cap Pierce Hematology Analyzer and cell suspensions were standardized to 2 × 10⁷ WBCs/ml. Cell staining was performed by mixing a 100 μL aliquot of suspended splenocytes with antibodies as described previously and fixing using 0.1% buffered formaldehyde.
Splenocytes for proliferation assays were released from the spleen by gentle dispersion into D-PBS using tissue forceps. Erythrocytes were removed by lysis using ammonium-chloride-potassium lysing buffer (Quality Biological Inc., Gaithersburg, MD), splenocytes were strained with trypan blue, and viable cells were enumerated using a hemocytometer. Cultures containing 5 × 10⁵ viable splenocytes in Gibco serum-free AIM-V medium supplemented with 2-mercaptoethanol (Invitrogen Canada Inc., Burlington, ON, Canada) were incubated in the presence of pokeweed mitogen (Sigma) or medium only (unstimulated controls) for 72 hr. Splenocyte proliferation was measured by quantifying 6-hr 3H-methylthymidine (1 µCi/ well) incorporation using a LKB Wallac liquid scintillation counter (Perkin Elmer Life Sciences, Woodbridge, ON, Canada).
Total plasma immunoglobulin levels were analyzed by sandwich enzyme-linked immunosorbant assays (ELISA) using primary and secondary antibodies specific for mouse IgA, IgG, and IgM (Bethyl Laboratories Inc., Montgomery, TX). Sandwich ELISAs were performed according to the protocol accompanying the antibodies using buffers and reagents as described by Tryphonas et al. (2004).
Histology
A gross visual examination was performed on each mouse at necropsy. Liver, right kidney, thymus, spleen, esophagus, trachea, thyroid, stomach (including forestomach), ileum (including Peyer’s patches), mesenteric lymph nodes, popliteal lymph nodes, heart, and lungs were fixed by immersion in 10% neutral buffered formalin. Samples from the fixed tissues were paraffin embedded and blocked. The tissue blocks were sectioned to 5 µm, stained with hematoxylin and eosin according to the method described by Luna (1968), and examined by light microscopy. Renal lesions were classified according to International Harmonization of Nomenclature and Diagnostic Criteria nomenclature (Frazier et al. 2012). Lesion severity was graded subjectively in comparison to control animals and assigned a numeric score from 0 to 5 where 0 indicated that a lesion was not present or present within subjective normal limits, and where 1 through 5 indicated that lesions were minimal, mild, moderate, marked, and severe, respectively. Lymphoid tissues were assessed for direct immunotoxicity according to International Collaborative Immunotoxicity Study (1998). Testes were fixed by immersion in Bouin’s fixative at necropsy. After 24 hr, they were washed and transferred to 70% ethanol. Fixed testes were trimmed to produce transverse sections at the level of rete and then embedded in paraffin. Tissue blocks were sectioned to 5 µm and stained with periodic acid Schiff hematoxylin. A section from the right testes of each mouse was evaluated by light microscopy for standard lesions (Foley 2001; Lanning et al. 2002).
Renal Immunohistochemistry
Unstained kidney sections (5 μm thick) were used for immunohistochemical procedures. To detect proliferating cells, sections were first subjected to antigen retrieval by heating in 10 mmol/L sodium citrate buffer in a microwave for 2.5 min. The mouse monoclonal anti-proliferating cell nuclear antigen (PCNA) antibody (DakoCytomation, Carpinteria, CA), diluted 1:10,000, was used as the primary antibody. The EnVisionTM + System (DakoCytomation), using an anti-mouse secondary antibody conjugated with horseradish peroxidase followed by detection with diaminobenzidine, was applied according to the manufacturer’s instructions to visualize PCNA-positive cells. Harris’s hematoxylin was used as the counterstain.
For apoptosis, the ApopTag® Plus Peroxidase In Situ Apoptosis Kit (Chemicon, Temecula, CA) was used according to the manufacturer’s instructions. This terminal deoxynucleotidyl transferase dUTP nick end labeling (TUNEL) assay-based method detects early apoptosis via DNA fragmentation by enzymatically labeling the free 3′-OH termini with modified nucleotides. Briefly, sections were subjected to a protein digestion enzyme to quench endogenous peroxidase, followed by application of an equilibration buffer and incubation with TdT enzyme, before stopping the reaction by adding anti-digoxigenin conjugate buffer. This was followed by incubation with the peroxidase substrate and counterstain with methyl green.
For clusterin (CLU) detection, sections were first subjected to antigen retrieval by heating in Tris EDTA, pH 9, in a 100°C water bath for 30 min. Sections were incubated with the primary antibody rabbit polyclonal anti-CLU (Santa Cruz Biotechnology, Dallas, TX) diluted 1:100, followed by detection with the EnVisionTM + System (DakoCytomation) and Harris’s hematoxylin counterstain.
To detect osteopontin (OPN), kidney sections were first subjected to antigen retrieval by heating in a commercially obtained antigen retrieval solution (S1700; Dako Cytomation) in a water bath at 100°C for 30 min. After blocking endogenous biotin, biotin receptor, and avidin binding sites (Avidin/biotin blocking kit, Vector Laboratories, Burlingame, CA), sections were incubated with the primary antibody rabbit polyclonal anti-OPN (Abcam Inc., Cambridge, MA) diluted 1:250, followed by detection with the EnVisionTM + System (Dako Cytomation) and Harris’s hematoxylin as the counterstain.
The immunostained sections were analyzed using a Zeiss Axiophot light microscope (Carl Zeiss Canada Ltd., Toronto, ON, Canada) and image analysis. Proliferating (PCNA-positive) and apoptotic (TUNEL-positive) cells were enumerated in proximal tubules for 1 entire kidney section per mouse. The ratios of proliferating cells (PCNA-positive) or apoptotic cells (TUNEL-positive) per section area (mm2) were determined using Northern Eclipse Version 7.0 software (Empix Imaging, Inc., Mississauga, ON, Canada). Semiquantitative assessments were conducted on CLU- and OPN-stained sections. Ten fields per section covering most of the section area were assessed for percentage proximal tubule staining in each field using Northern Eclipse version 7.0 software, generating a mean percentage positivity score for 1 kidney section per mouse.
Statistical Analyses
Statistical comparisons were conducted using SigmaPlot 12 (Systat Software, Inc., San Jose, CA). Data were analyzed for normality using the Kolmogorov–Smirnov test. Equal variance was tested by checking the variability around group means. Within each strain (p53+/+ or p53+/−), multiple group comparisons were conducted by 1-way analysis of variance (1-way ANOVA), followed by post hoc pairwise comparisons using the Holm–Sidak test. Multiple group comparisons of nonparametric data were conducted using the Kruskal–Wallis ANOVA on Ranks, followed by post hoc pairwise comparisons using the Dunn’s method. Animal weights and relative food consumption (food consumption/BW) were analyzed by ANOVA on weekly average weights (Hoffman, Ness, and van Lier 2002). For histopathology endpoints, including CLU and OPN data, lesion severity data were analyzed using the Kruskal–Wallis 1-way ANOVA on Ranks within each strain. Comparisons of data from p53+/+ and p53+/− mice were conducted by 2-way ANOVA to identify interactions between strain and dose, followed by post hoc pairwise comparisons using the Holm–Sidak method.
Results
Diet Analyses
OTA was not detected in control diets. Levels of OTA detected in treatment diets are summarized in Tables 2 and 3. After correcting for recovery, OTA was recovered from treatment diets at levels 20–30% lower than OTA added to diets at preparation.
Ochratoxin A consumption by p53+/+ and p53+/− mice in week 1 of the 26-week exposure period.
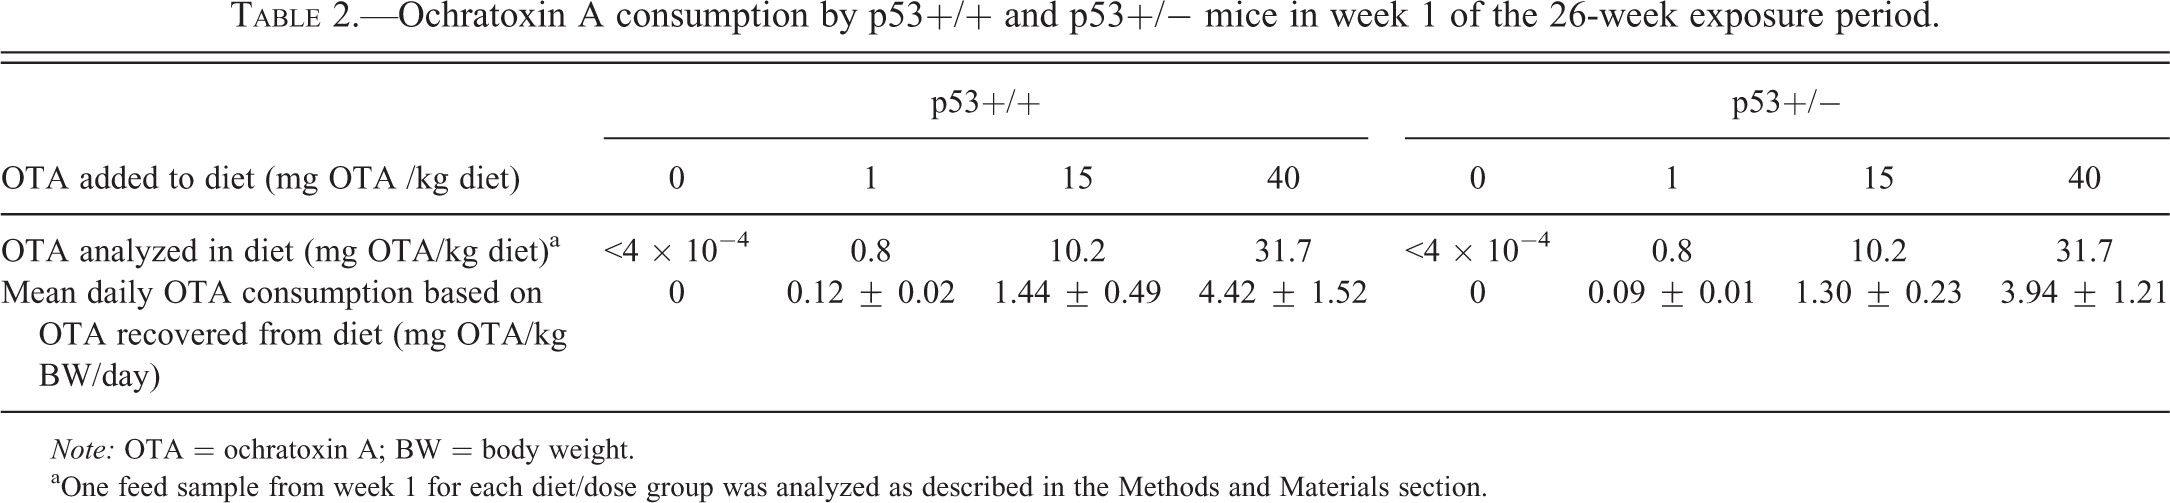
Note: OTA = ochratoxin A; BW = body weight.
aOne feed sample from week 1 for each diet/dose group was analyzed as described in the Methods and Materials section.
Ochratoxin A consumption by p53+/+ and p53+/− mice from week 3 to 26 of a 26-week exposure period.
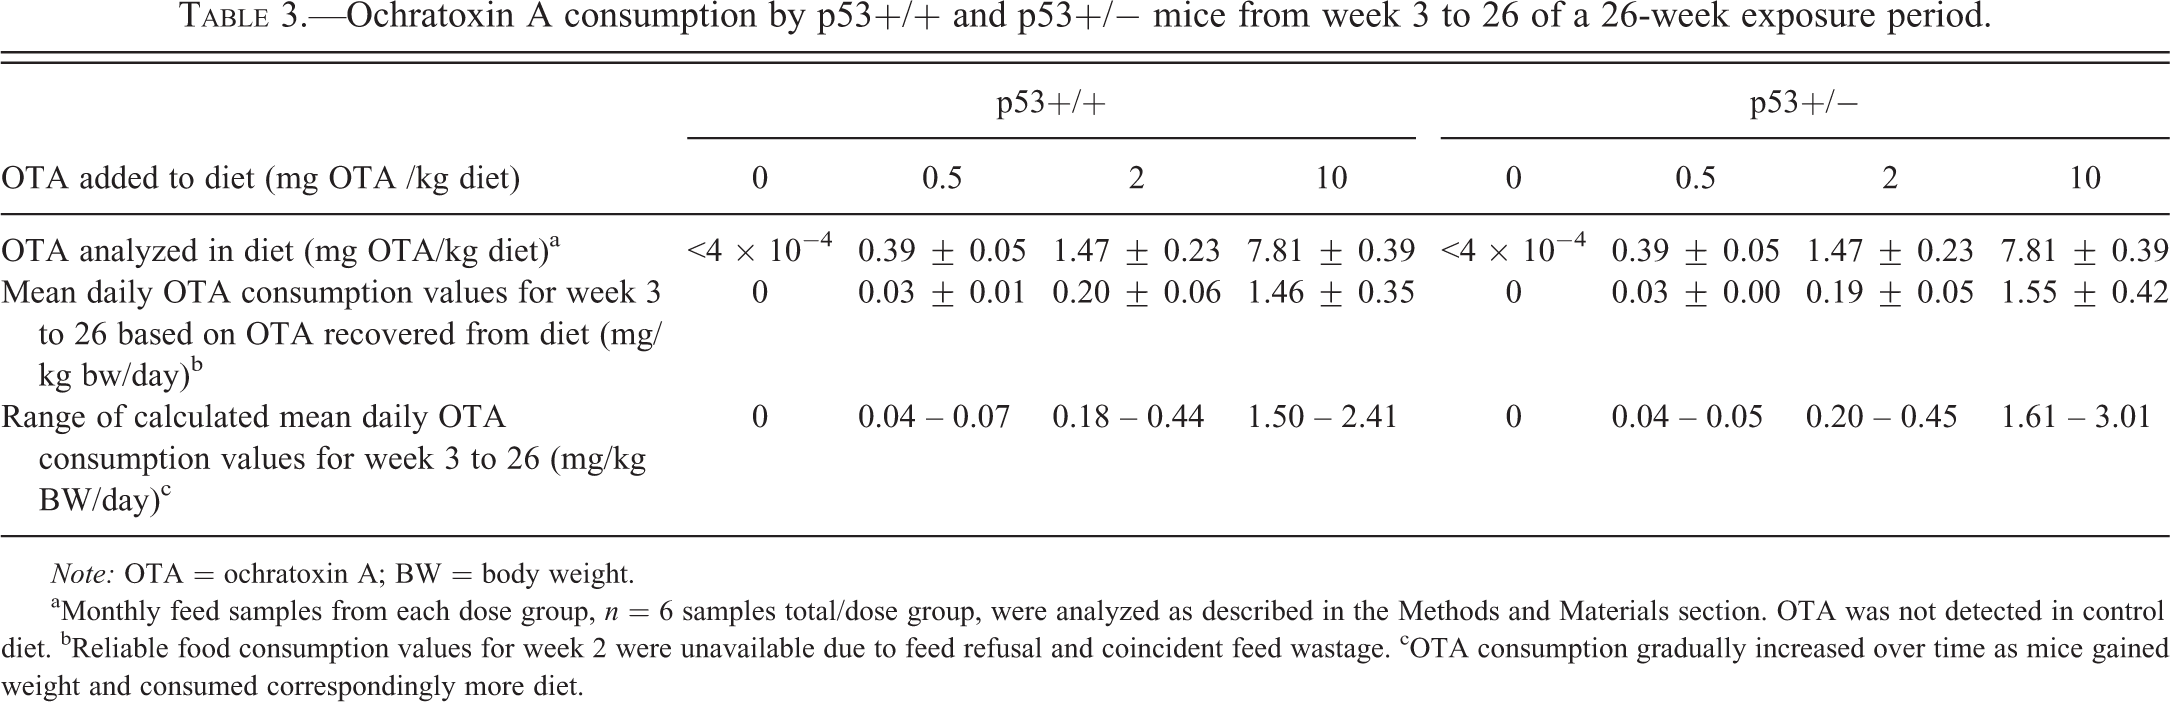
Note: OTA = ochratoxin A; BW = body weight.
aMonthly feed samples from each dose group, n = 6 samples total/dose group, were analyzed as described in the Methods and Materials section. OTA was not detected in control diet. bReliable food consumption values for week 2 were unavailable due to feed refusal and coincident feed wastage. cOTA consumption gradually increased over time as mice gained weight and consumed correspondingly more diet.
Effects of OTA on BW, Food Consumption, and Organ Weight
In the first 2 weeks on diet, BW gain in all mice in the medium (15-mg OTA/kg diet) and high (40-mg OTA/kg diet) dose groups was significantly depressed compared to mice in the control and low (1 mg/kg) dose groups. By the end of week 2, BWs in p53+/+ mice were 20% and 28% lower in the 15- and 40-mg/kg dose groups, respectively; in p53+/− mice, BWs were 27% and 31% lower in the 15- and 40-mg/kg dose groups, respectively (Figure 2A and B). It was decided that medium- and high-dose group mice would not survive the 26-week exposure period, so reformulated diets containing lower OTA levels were introduced at the beginning of week 3. From this time onward, mice in the new medium (2-mg OTA/kg diet) and high (10 mg OTA/kg diet) dose groups gained weight. Control p53+/+ and p53+/− mice and mice in the new low-dose group (0.5-mg OTA/kg diet) gained weight throughout the exposure period. In both p53+/+ and p53+/− mice, BWs of low-dose mice were not significantly different from respective controls at any time (Figure 2A and B). Mean BWs of medium-dose p53+/+ mice were significantly lower than respective controls in week 2 and weeks 6–26. Mean BWs of high-dose p53+/+ mice were significantly lower than respective controls from weeks 1 to 26 (Figure 2A). In p53+/− mice, mean BWs of medium and high dose mice were significantly lower than respective controls from weeks 1 to 26 (Figure 2B).
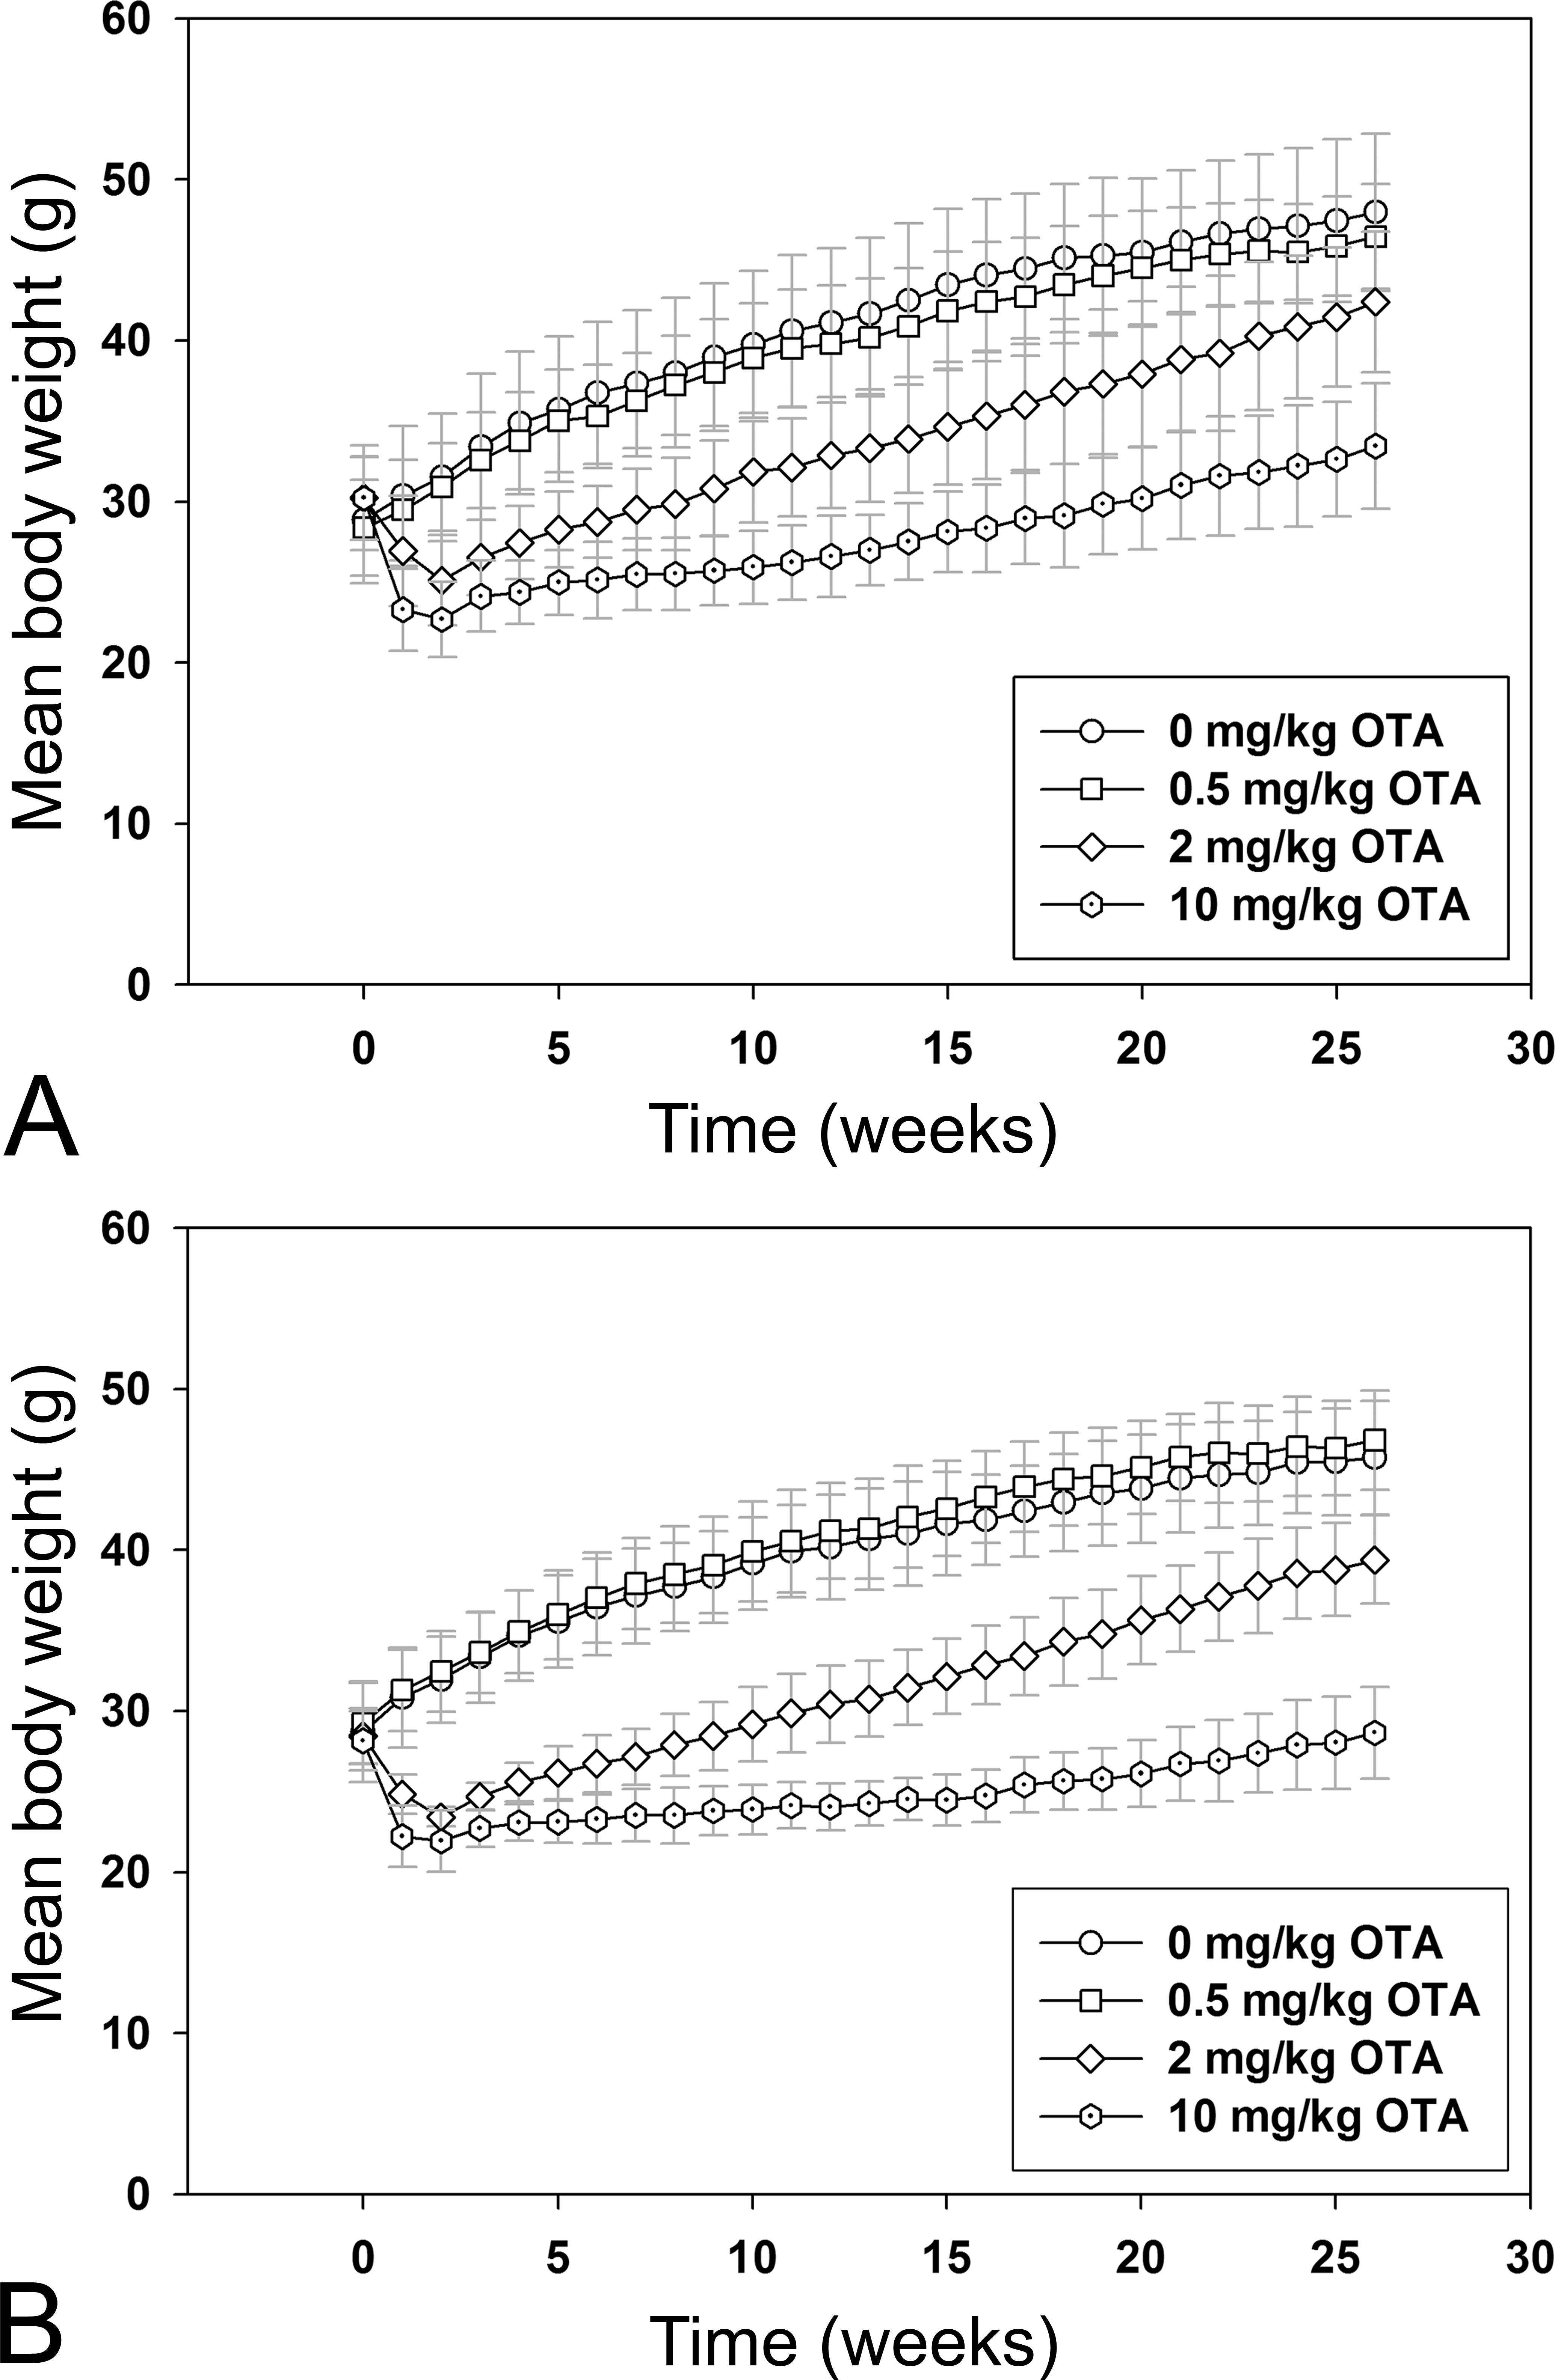
Mean body weights (BWs; g; +SD) in (A) p53+/+ and (B) p53+/− mice exposed to ochratoxin A in diet for 26 weeks. Mean BWs of medium-dose p53+/+ mice were significantly lower than respective controls in week 2 and weeks 6 to 26; mean BWs of high-dose p53+/+ mice were significantly lower than respective controls from weeks 1 to 26 (A). Mean BWs of medium-and high-dose p53+/− mice were significantly lower than respective controls from weeks 1–26 (B).
The effect of OTA exposure on BW-normalized food consumption (relative food consumption) was evaluated for each week of the study (Figure 3A and B). In p53+/+ medium-dose mice, relative food consumption was significantly higher than in respective controls from weeks 6 to 11; in p53+/+ high-dose mice, relative food consumption was significantly higher than in respective controls in week 3 and weeks 4 to 26 (Figure 3A). In p53+/− medium-dose mice, relative food consumption was higher than in respective controls in weeks 3, 4, 6, 10, 11, 14 to 17, 19, and 21 to 23. In p53+/− high-dose mice, relative food consumption was significantly higher than in respective controls from weeks 1 to 26 (Figure 3B).
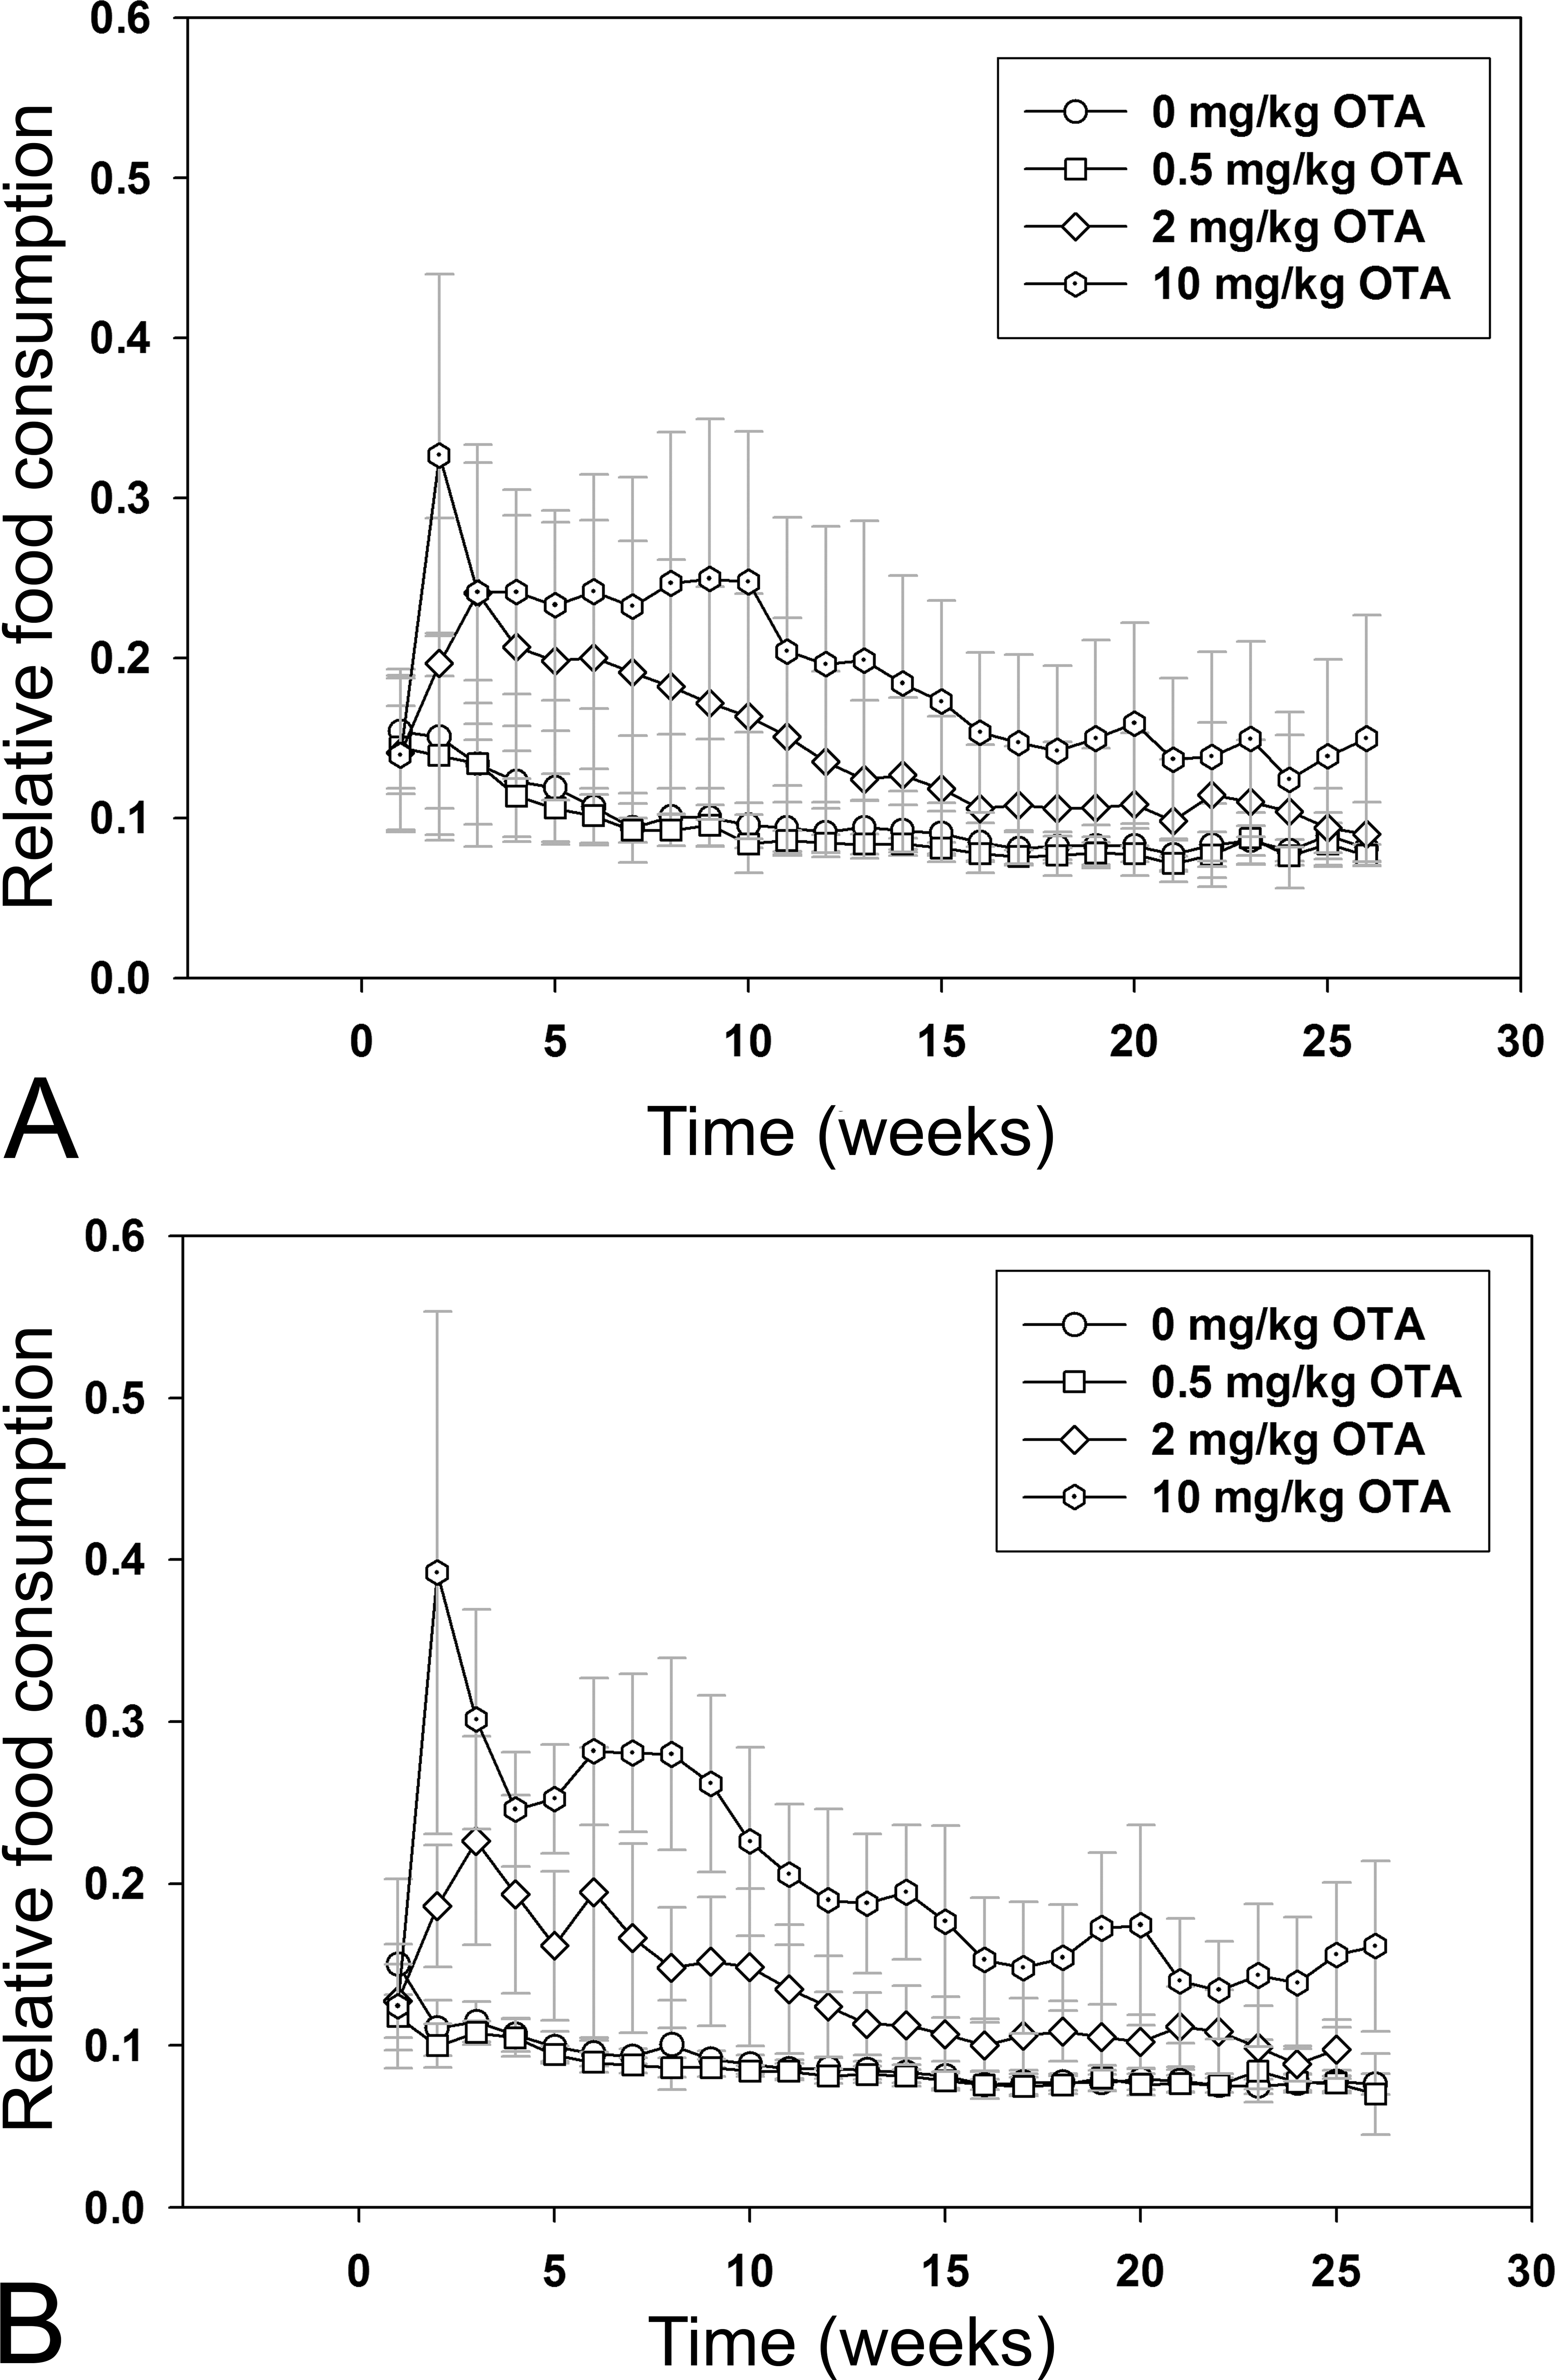
Mean weekly feed consumption (g; +SD) in (A) p53+/+ and (B) p53+/− mice exposed to ochratoxin A in diet for 26 weeks. In p53+/+ medium-dose mice, relative food consumption was significantly higher than in respective controls from weeks 6 to 11; in p53+/+ high-dose mice, relative food consumption was significantly higher than in respective controls in week 3 and weeks 4 to 26 (A). In p53+/− medium-dose mice, relative food consumption was higher than in respective controls in weeks 3, 4, 6, 10, 11, 14 to 17, 19, and 21 to 23. In p53+/− high-dose mice, relative food consumption was significantly higher than in respective controls from weeks 1 to 2 (B).
Mean daily OTA consumption values were calculated based on OTA levels detected in diets, food consumption, and BW (Tables 2 and 3). In the 1st week of the study, mean daily OTA consumption values were 0.12-, 1.44-, and 4.42-mg OTA/kg bw/day for p53+/+ low-, medium-, and high-dose diets, respectively. For p53+/− low-, medium- and high-dose groups, mean daily OTA consumption values were 0.09-, 1.30-, and 3.94-mg OTA/kg bw/day, respectively. Calculations were not possible for week 2 due to feed refusal and feed wastage in the medium- and high-dose groups (Table 2); however, similar calculations were done for the remaining 24 weeks of the study (Table 3). Mean daily OTA consumption increased over week 3 to 24, in parallel with increasing relative food consumption. This resulted in a range of mean daily OTA consumption values calculated for weeks 3 to 26 which were lowest early in the study and gradually increased to the highest value by the end of the study (Table 3).
Final organ weights expressed as percentage BW are summarized in Table 1. Liver weights were significantly reduced relative to respective controls in p53+/+ and p53+/− mice in the medium- and high-dose groups, and kidney weights were significantly reduced in p53+/+ and p53+/− mice at the highest dose. Spleen weights were significantly increased in p53+/+ and p53+/− mice in the high-dose group. Relative thymus weights were significantly higher relative to controls in p53+/− mice in the high-dose group.
Effects of OTA on Immune Parameters
There were no significant changes due to OTA in numbers of circulating WBCs, lymphocytes, lymphocyte subsets, or granulocytes (data not shown). There were no significant changes in splenocyte subpopulations due to OTA exposure (data not shown). Splenocyte proliferation was significantly reduced in p53+/+ mice in the high-dose group relative to controls (Figure 4). Plasma total immunoglobulin M, G, and A levels were unaffected by OTA in p53+/+ and p53+/− mice (data not shown).
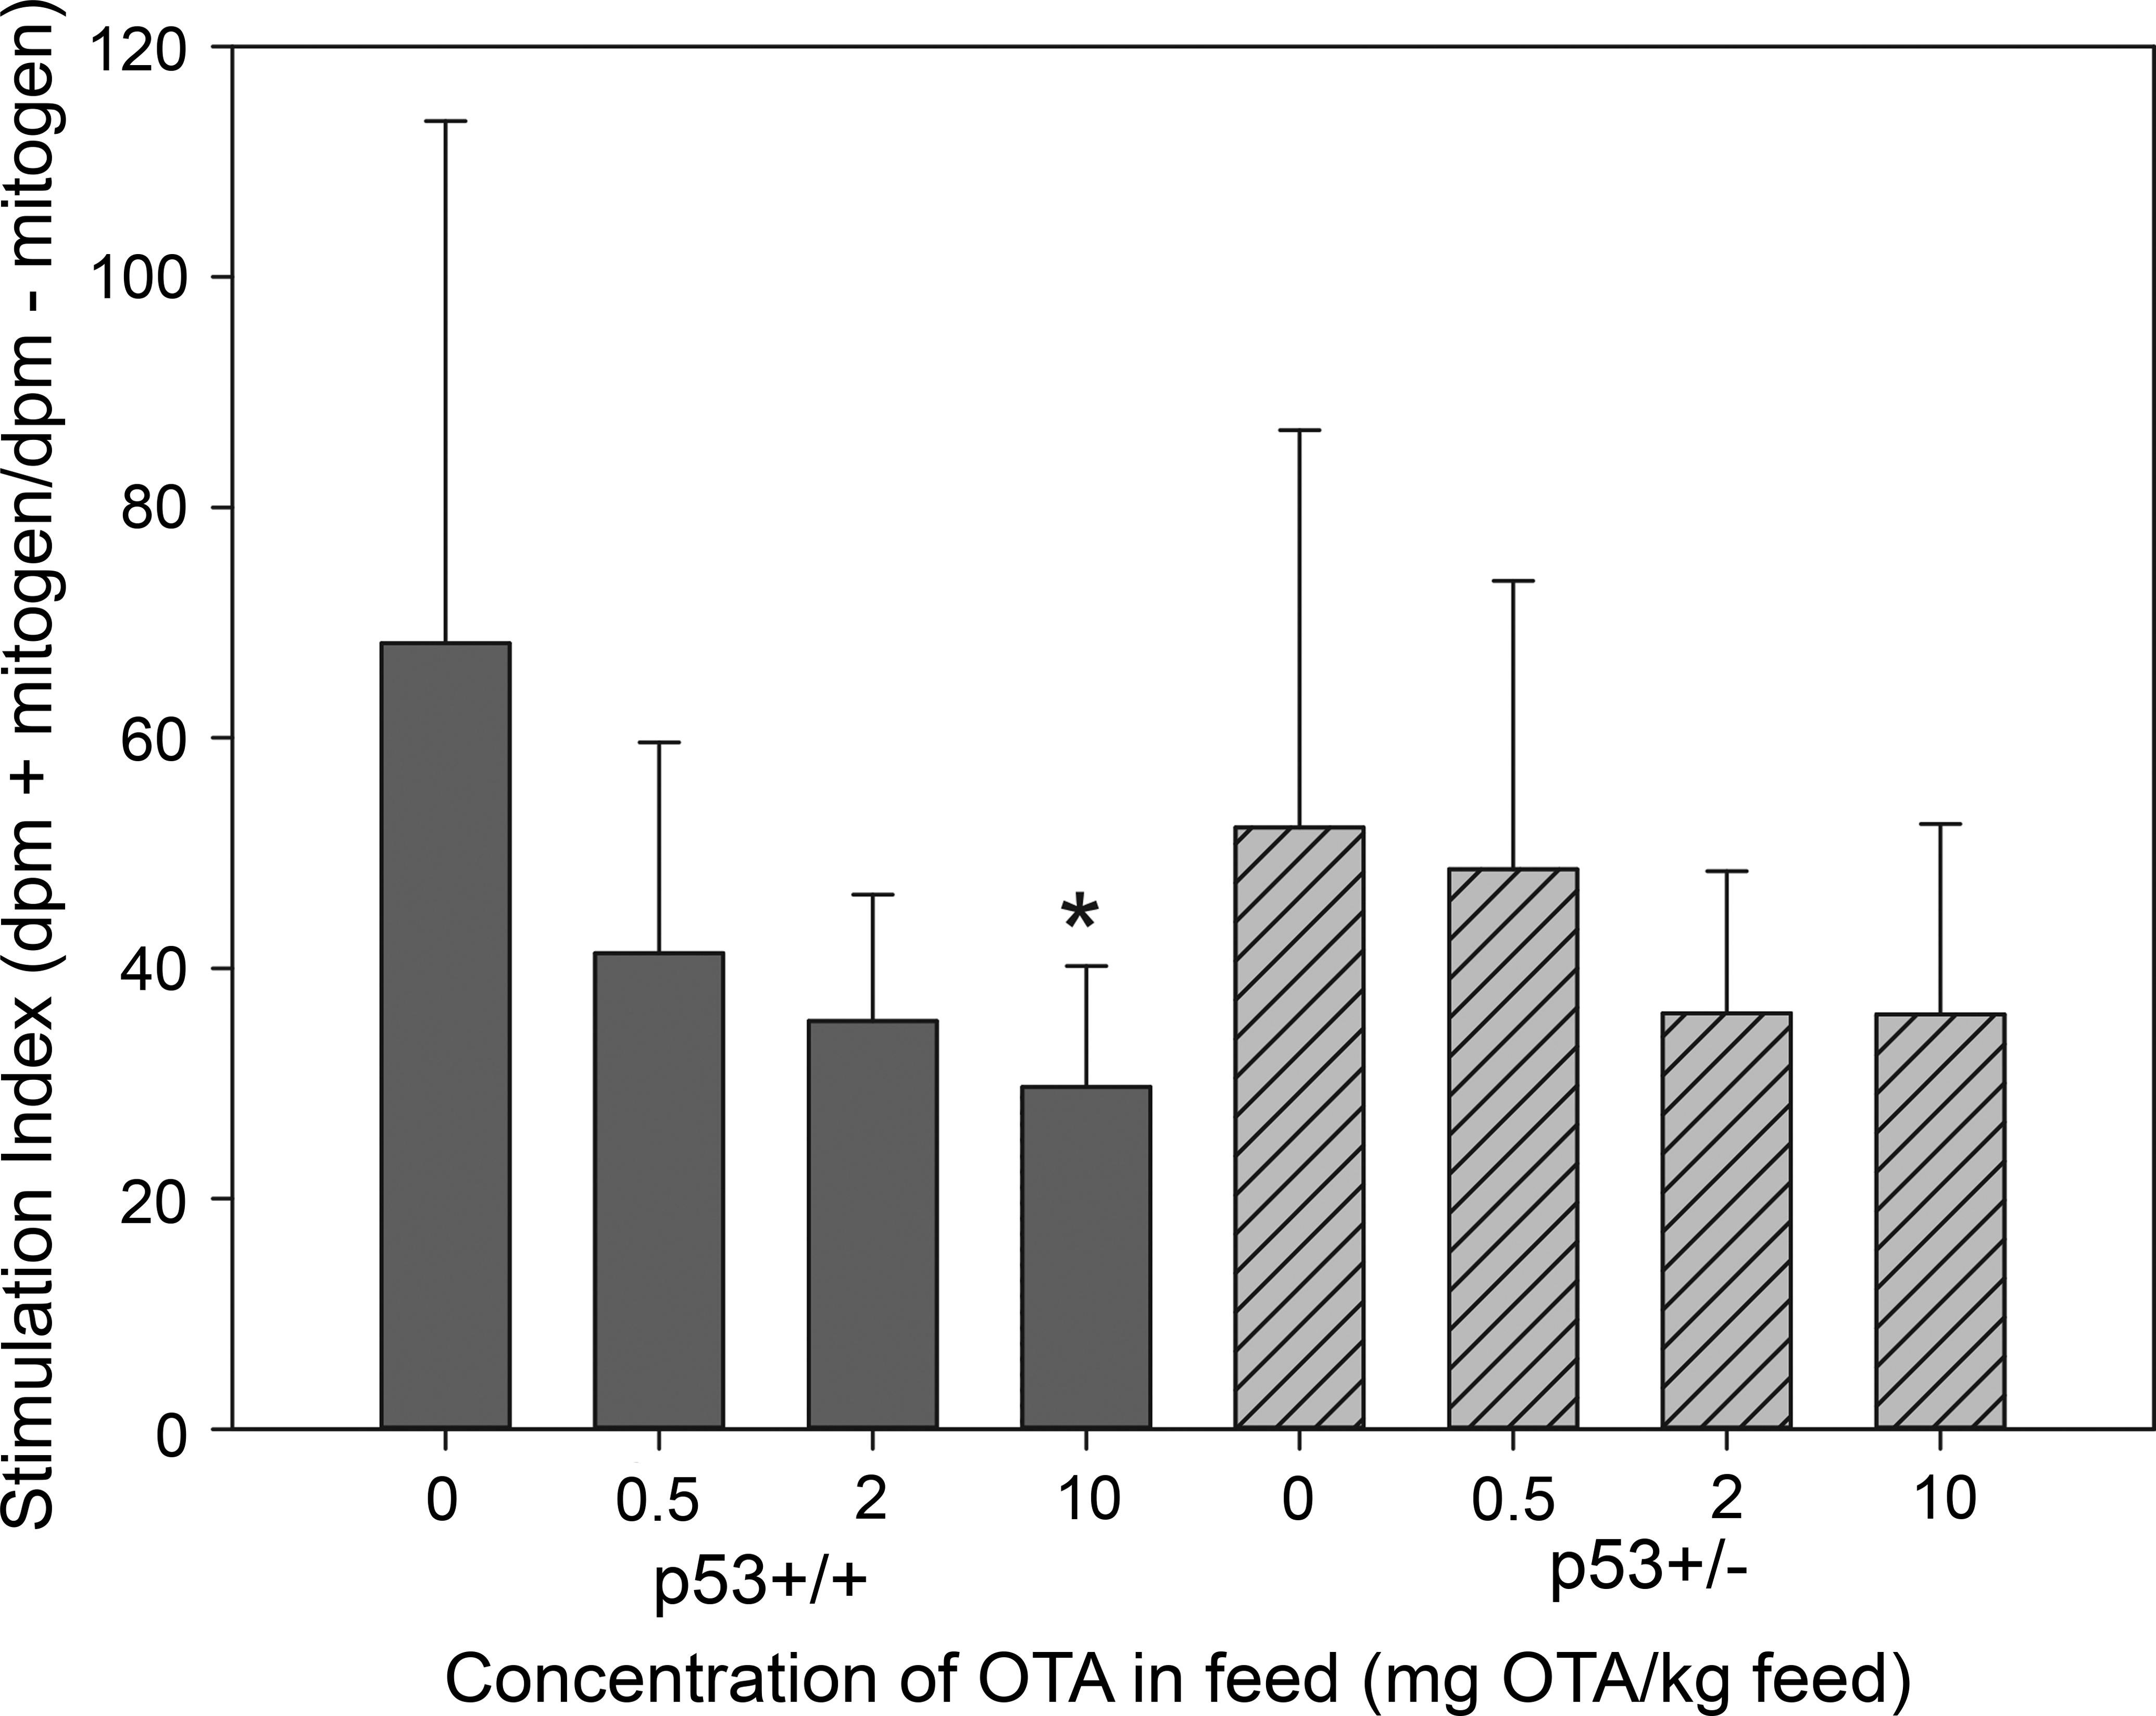
Pokeweed mitogen (PWM)-stimulated proliferation in splenocyte cultures from p53+/+ and p53+/− mice exposed to ochratoxin A in diet for 26 weeks. Proliferation is expressed as 3H-thymidine incorporation (disintegrations per minute) in PWM-stimulated cultures/3H-thymidine incorporation in unstimulated cultures. *Significantly different from corresponding controls (p < .05).
Histopathologic Changes in Mice Exposed to OTA
Hepatocytes were markedly enlarged with cytoplasmic clearing and vacuolation in the livers of control and low-dose mice of both strains, which was generally associated with relatively high body fat levels. In medium-dose p53+/+ and p53+/− mice, hepatocytes were less swollen with less cytoplasmic clearing and vacuolation. In high-dose mice, hepatocyte cytoplasmic swelling with vacuolation was not observed. Occasional foci of hepatocellular necrosis were observed in all control and low-dose mice. The incidence and severity of focal necrosis increased in medium- and high-dose mice relative to controls. There were no strain-related differences in the incidence and severity of hepatocellular necrosis (data not shown).
The incidence and severity of renal lesions in p53+/+ and p53+/− mice are summarized in Table 4 and examples of typical renal lesions are shown in Figure 5. In both strains, microscopic lesions were evident in renal tissues at all doses, dominated by increasingly severe and prevalent karyomegaly, apoptosis, and anisokaryosis affecting the proximal tubular epithelium, including the S1 and S2 convoluted segments (cortical labyrinth) and the S3 straight segments (outer stripe of the outer medulla [OSOM] and medullary ray). Rare epithelial cells with mild degeneration were present in the tubular epithelium in the 0.5-mg OTA/kg dose group in both mouse strains. Mild tubular degeneration, evident as cytoplasmic vacuolation with or without pale basophilic coloration, was observed in the 2-mg OTA/kg dose group in both mouse strains. In the 10-mg OTA/kg dose groups, occasional regenerative tubules were observed in the cortex, with mild tubular degeneration affecting cortical tubular epithelium. No adenomas, carcinomas, or cystic tubules lined by hyperplastic epithelium, as described by Bendele et al. (1985), were detected.
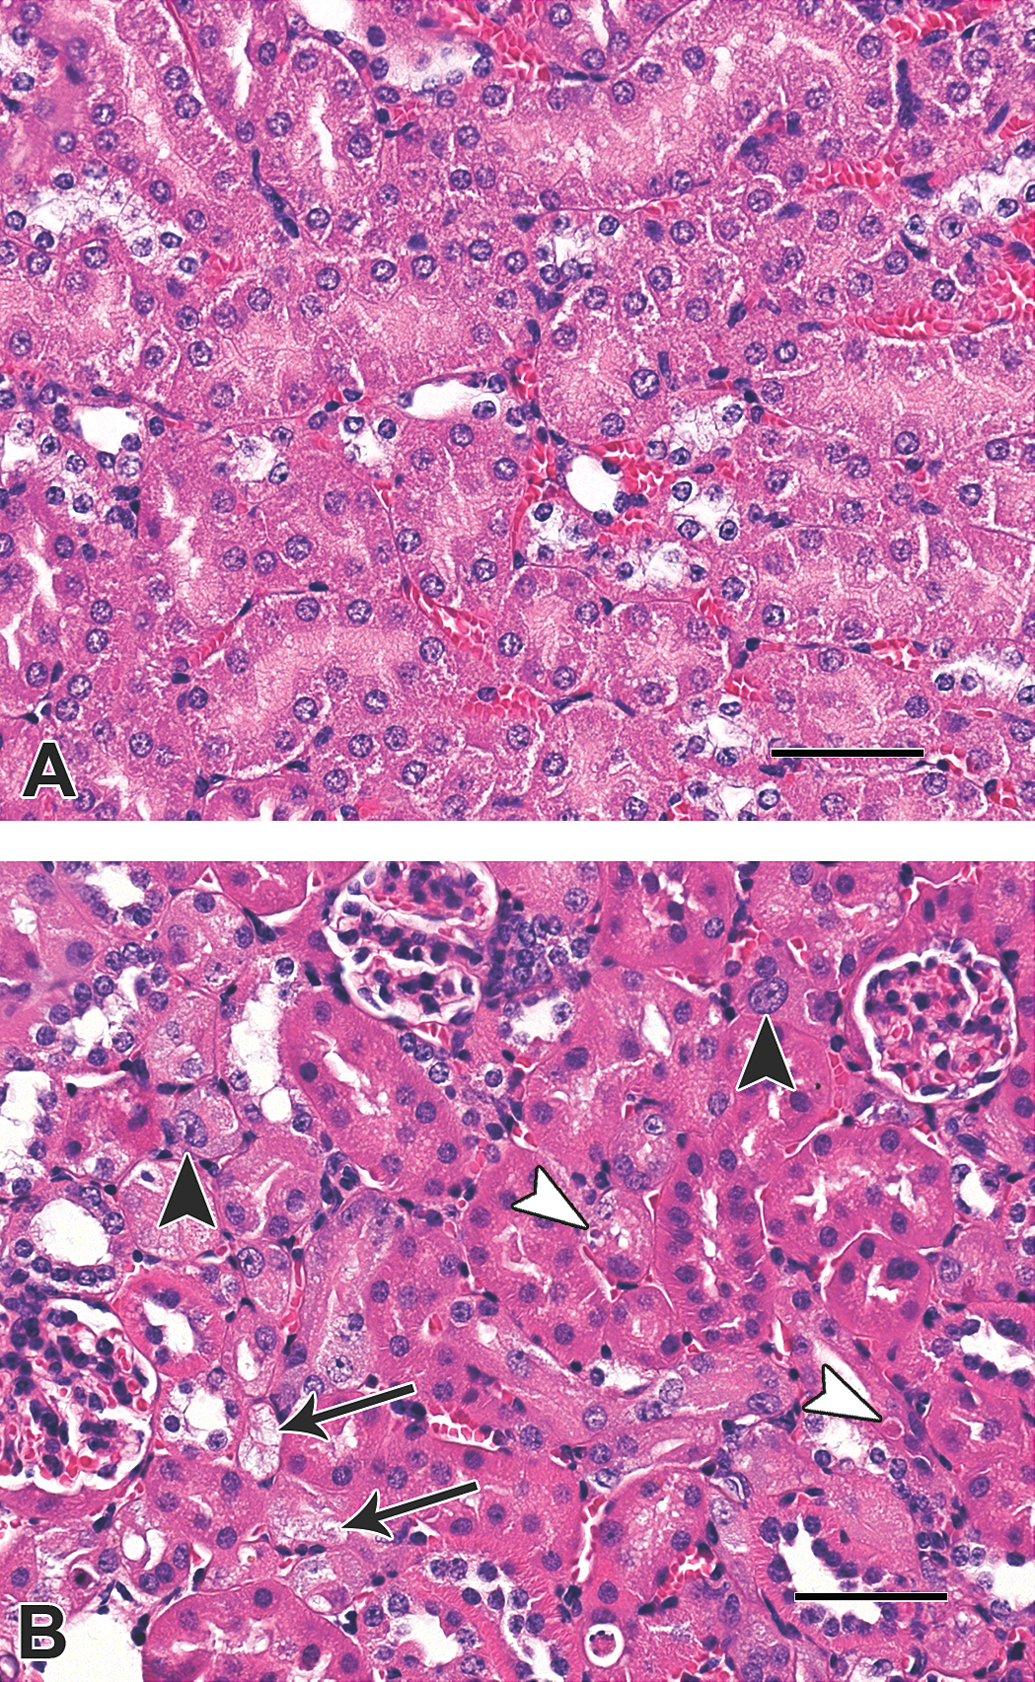
Photomicrographs of kidney tissues from control mice and mice exposed to ochratoxin A (OTA) in diet: (A) kidney cortex from a p53+/− control mouse; (B) kidney cortex from a p53+/− mouse exposed to 10-mg OTA/kg diet. In (B), the large black arrowheads indicate proximal convoluted tubular epithelial cell with karyomegaly, the white arrowheads indicate apoptotic bodies, and the arrows indicate damaged tubules containing vacuolated epithelial cells. Hematoxylin and eosin stain; scale bars 50 μm.
Summary of severity and incidence of histologic lesions in kidneys from p53+/+ and p53+/− mice exposed to dietary OTA for 26 weeks.
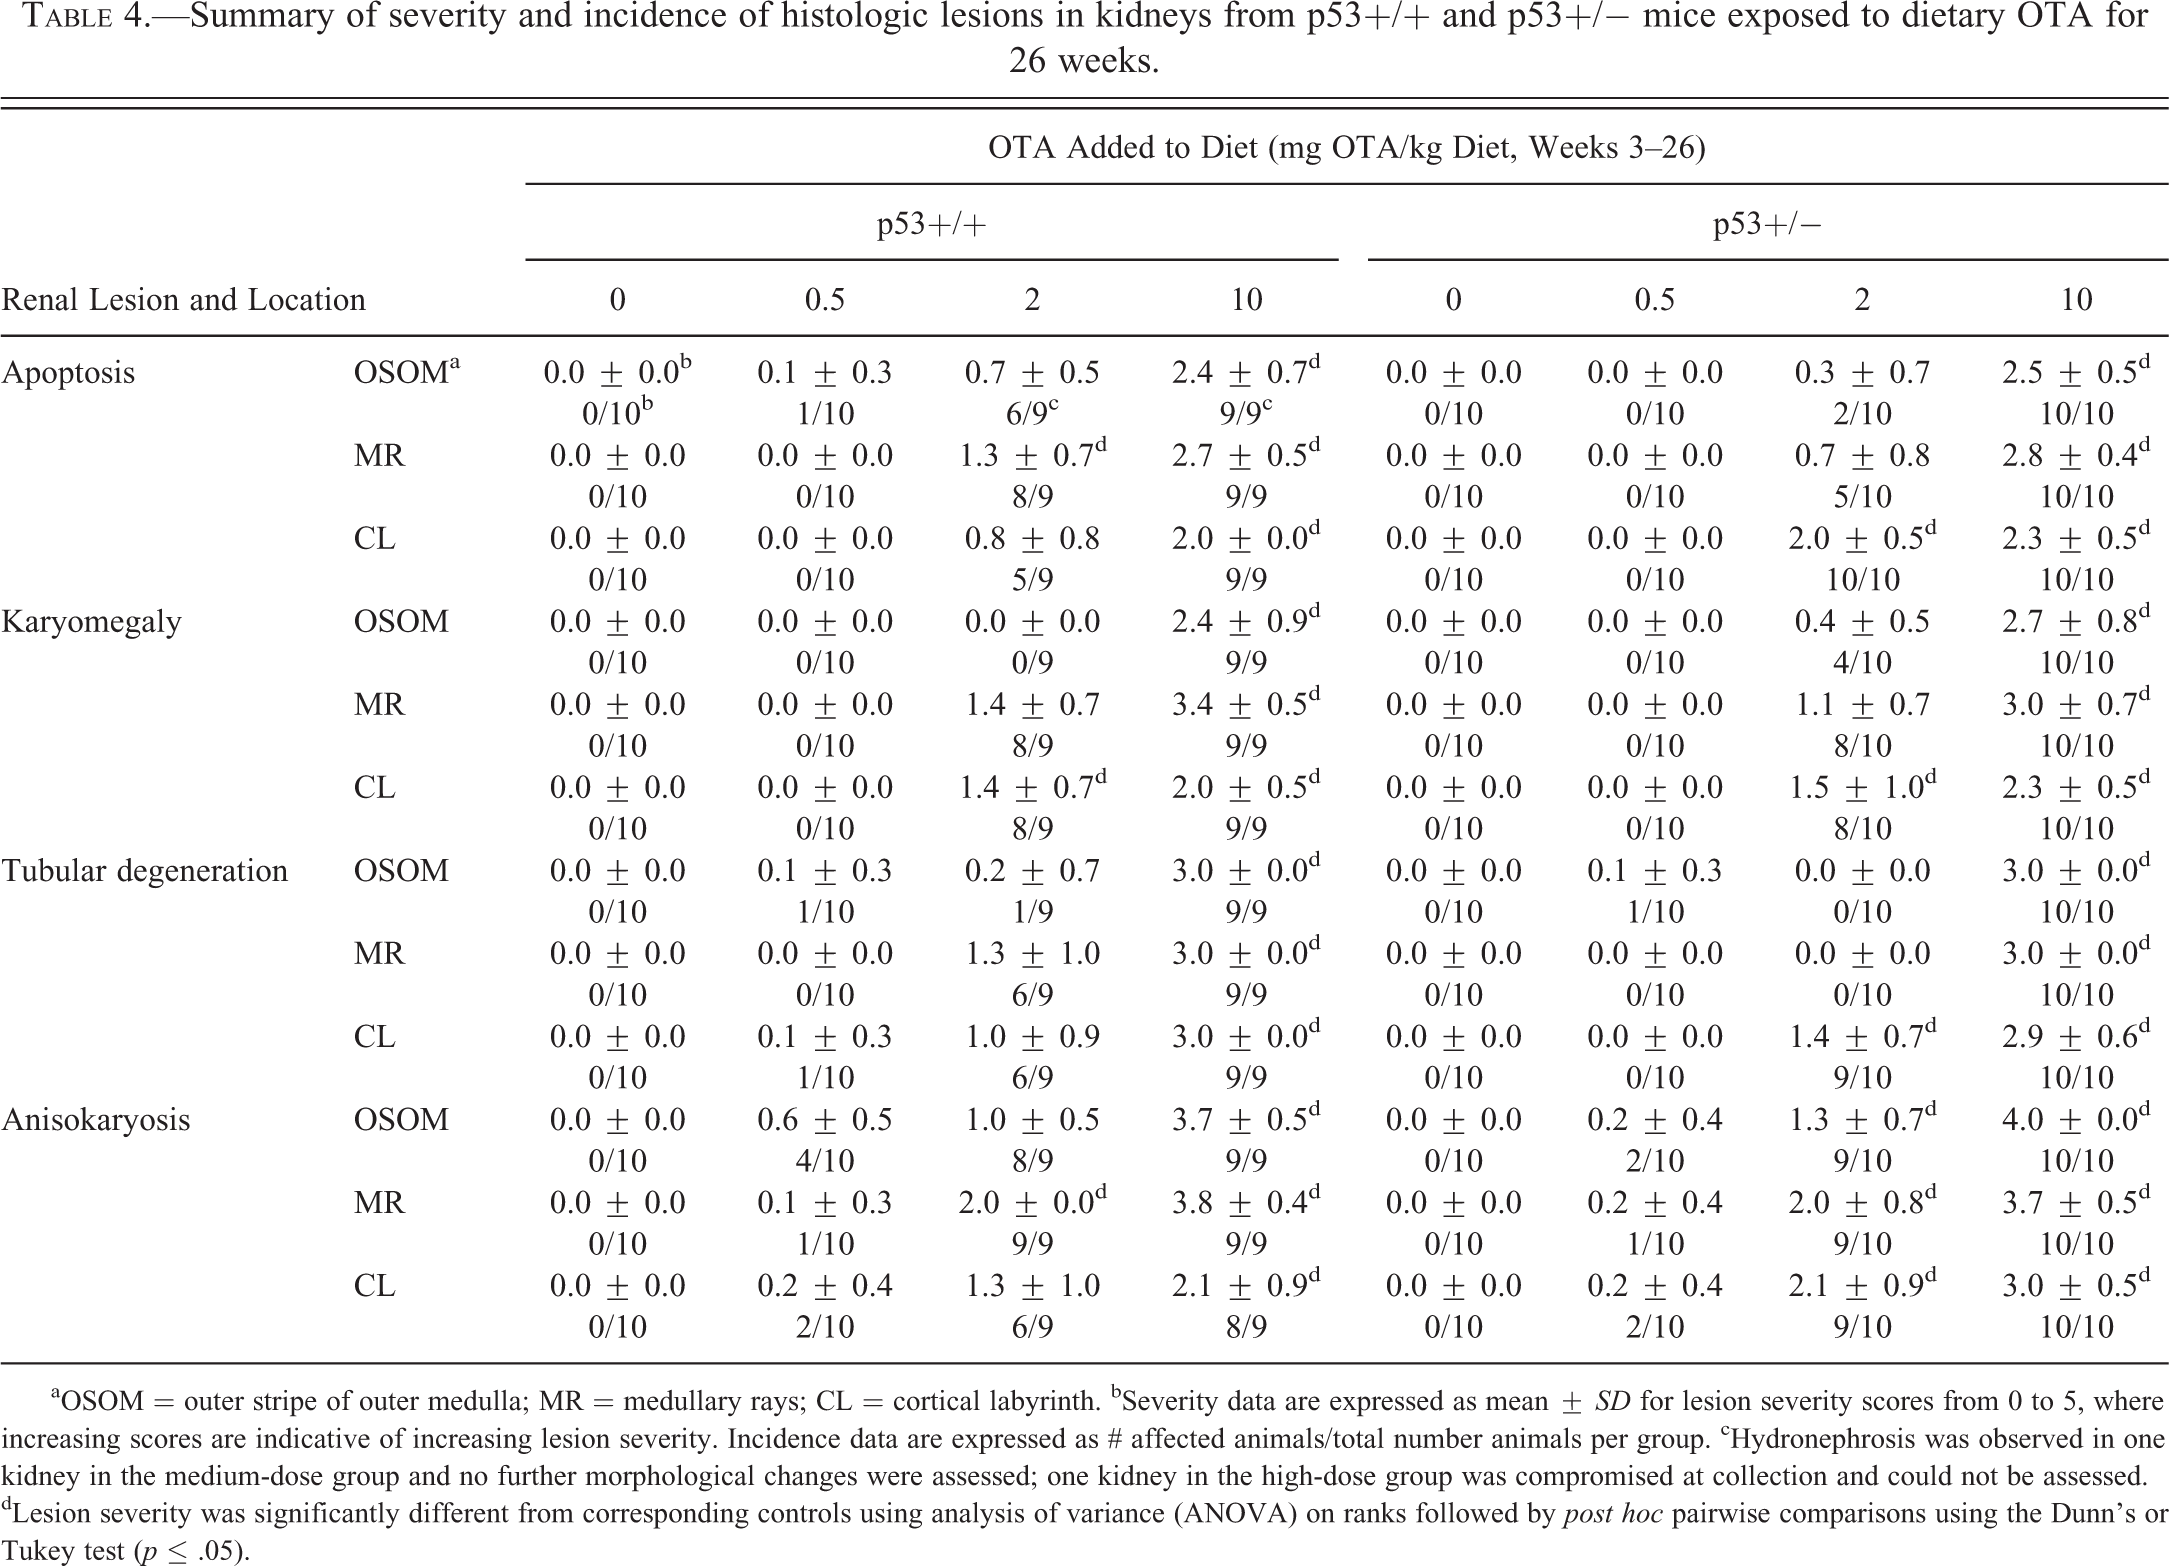
aOSOM = outer stripe of outer medulla; MR = medullary rays; CL = cortical labyrinth. bSeverity data are expressed as mean ± SD for lesion severity scores from 0 to 5, where increasing scores are indicative of increasing lesion severity. Incidence data are expressed as # affected animals/total number animals per group. cHydronephrosis was observed in one kidney in the medium-dose group and no further morphological changes were assessed; one kidney in the high-dose group was compromised at collection and could not be assessed. dLesion severity was significantly different from corresponding controls using analysis of variance (ANOVA) on ranks followed by post hoc pairwise comparisons using the Dunn’s or Tukey test (p ≤ .05).
There were no lesions in immune tissues, including thymus, Peyer’s patches, spleen, and mesenteric and inguinal lymph nodes. Mild degenerative lesions were observed in testicular seminiferous tubules from all mice. These changes appeared to be more prevalent in p53+/+ than in p53+/− mice across all doses, although this observation was not quantified.
There were no lesions in any other tissues examined, with the exception of the lungs. In the lungs of p53+/+ and p53+/− mice in all dose groups, including controls, lesions consistent with eosinophilic crystalline pneumonia (ECP) were observed (Hoenerhoff, Starost, and Ward 2006). In control, low-, and medium-dose mice, these lesions were characterized by mild to marked lymphoid/ plasma cell infiltration in peribronchiolar and perivascular regions. Scattered in the alveoli were few macrophages containing abundant densely eosinophilic cytoplasm that had a crystalline appearance. Large eosinophilic rod-shaped crystals occurred occasionally in bronchiolar lumens. In high-dose mice, similar lesions appeared to be more severe. Figure 6 demonstrates a prominent needle-shaped crystal visible in a bronchiole from a control p53+/− mouse. The diagnosis of ECP was verified by consultation with the Armed Forces Institute of Pathology (AFIP 2008), although the “crystalline” component was not considered striking. A further observation in the lungs of all mice, regardless of strain and dose, was that of mild bronchiolar epithelial cell hyperplasia, mild smooth muscle hyperplasia of bronchioles and prominent smooth muscle hyperplasia in the tunica media of lung arterioles. The degree of smooth muscle hyperplasia was similar across dose groups and strains. These lesions were also verified by the AFIP (2008), and are not known to be associated with ECP.
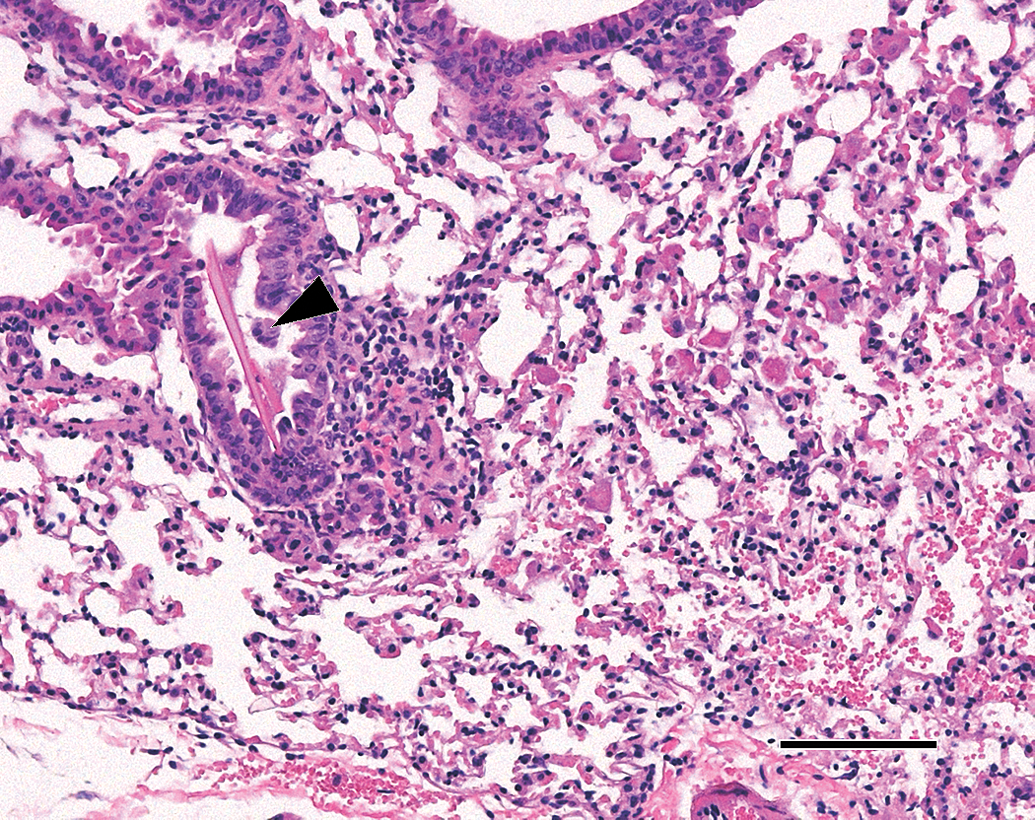
Photomicrograph of a lung section from a p53+/− control mouse; hematoxylin and eosin stain. A large needle-shaped crystal is evident in the bronchiole (black arrowhead); in the adjacent alveoli, a light mixed leukocytic infiltration composed of macrophages with acidophilic cytoplasm and a few neutrophils is evident. Hematoxylin and eosin stain; scale bar 100 μm.
Immunohistochemical Assessment of Kidneys from OTA-exposed Mice
Quantitative and semiquantitative immunohistochemical assessments of kidney sections from p53+/+ and p53+/− mice are summarized in Table 5. A dose-dependent increase in PCNA-positive epithelial cells in the proximal tubules of p53+/+ and p53+/− mice was observed, which was significantly greater in both strains exposed to 10-mg OTA/kg diet compared to the corresponding controls. The number of apoptotic epithelial cells was also significantly higher in proximal tubules of p53+/+ and p53+/− mice in the 10-mg OTA/kg dose group. Expression of the kidney injury biomarkers CLU and OPN in proximal tubules was significantly increased in p53+/+ mice in the 10-mg OTA/kg dose group and in p53+/− mice in the 2- and 10-mg OTA/kg dose groups (Table 5; Figure 7). CLU and OPN expression were also higher with increasing OTA exposure in distal convoluted tubules from p53+/+ and p53+/− mice, with the difference achieving significance at the highest dose (data not shown).
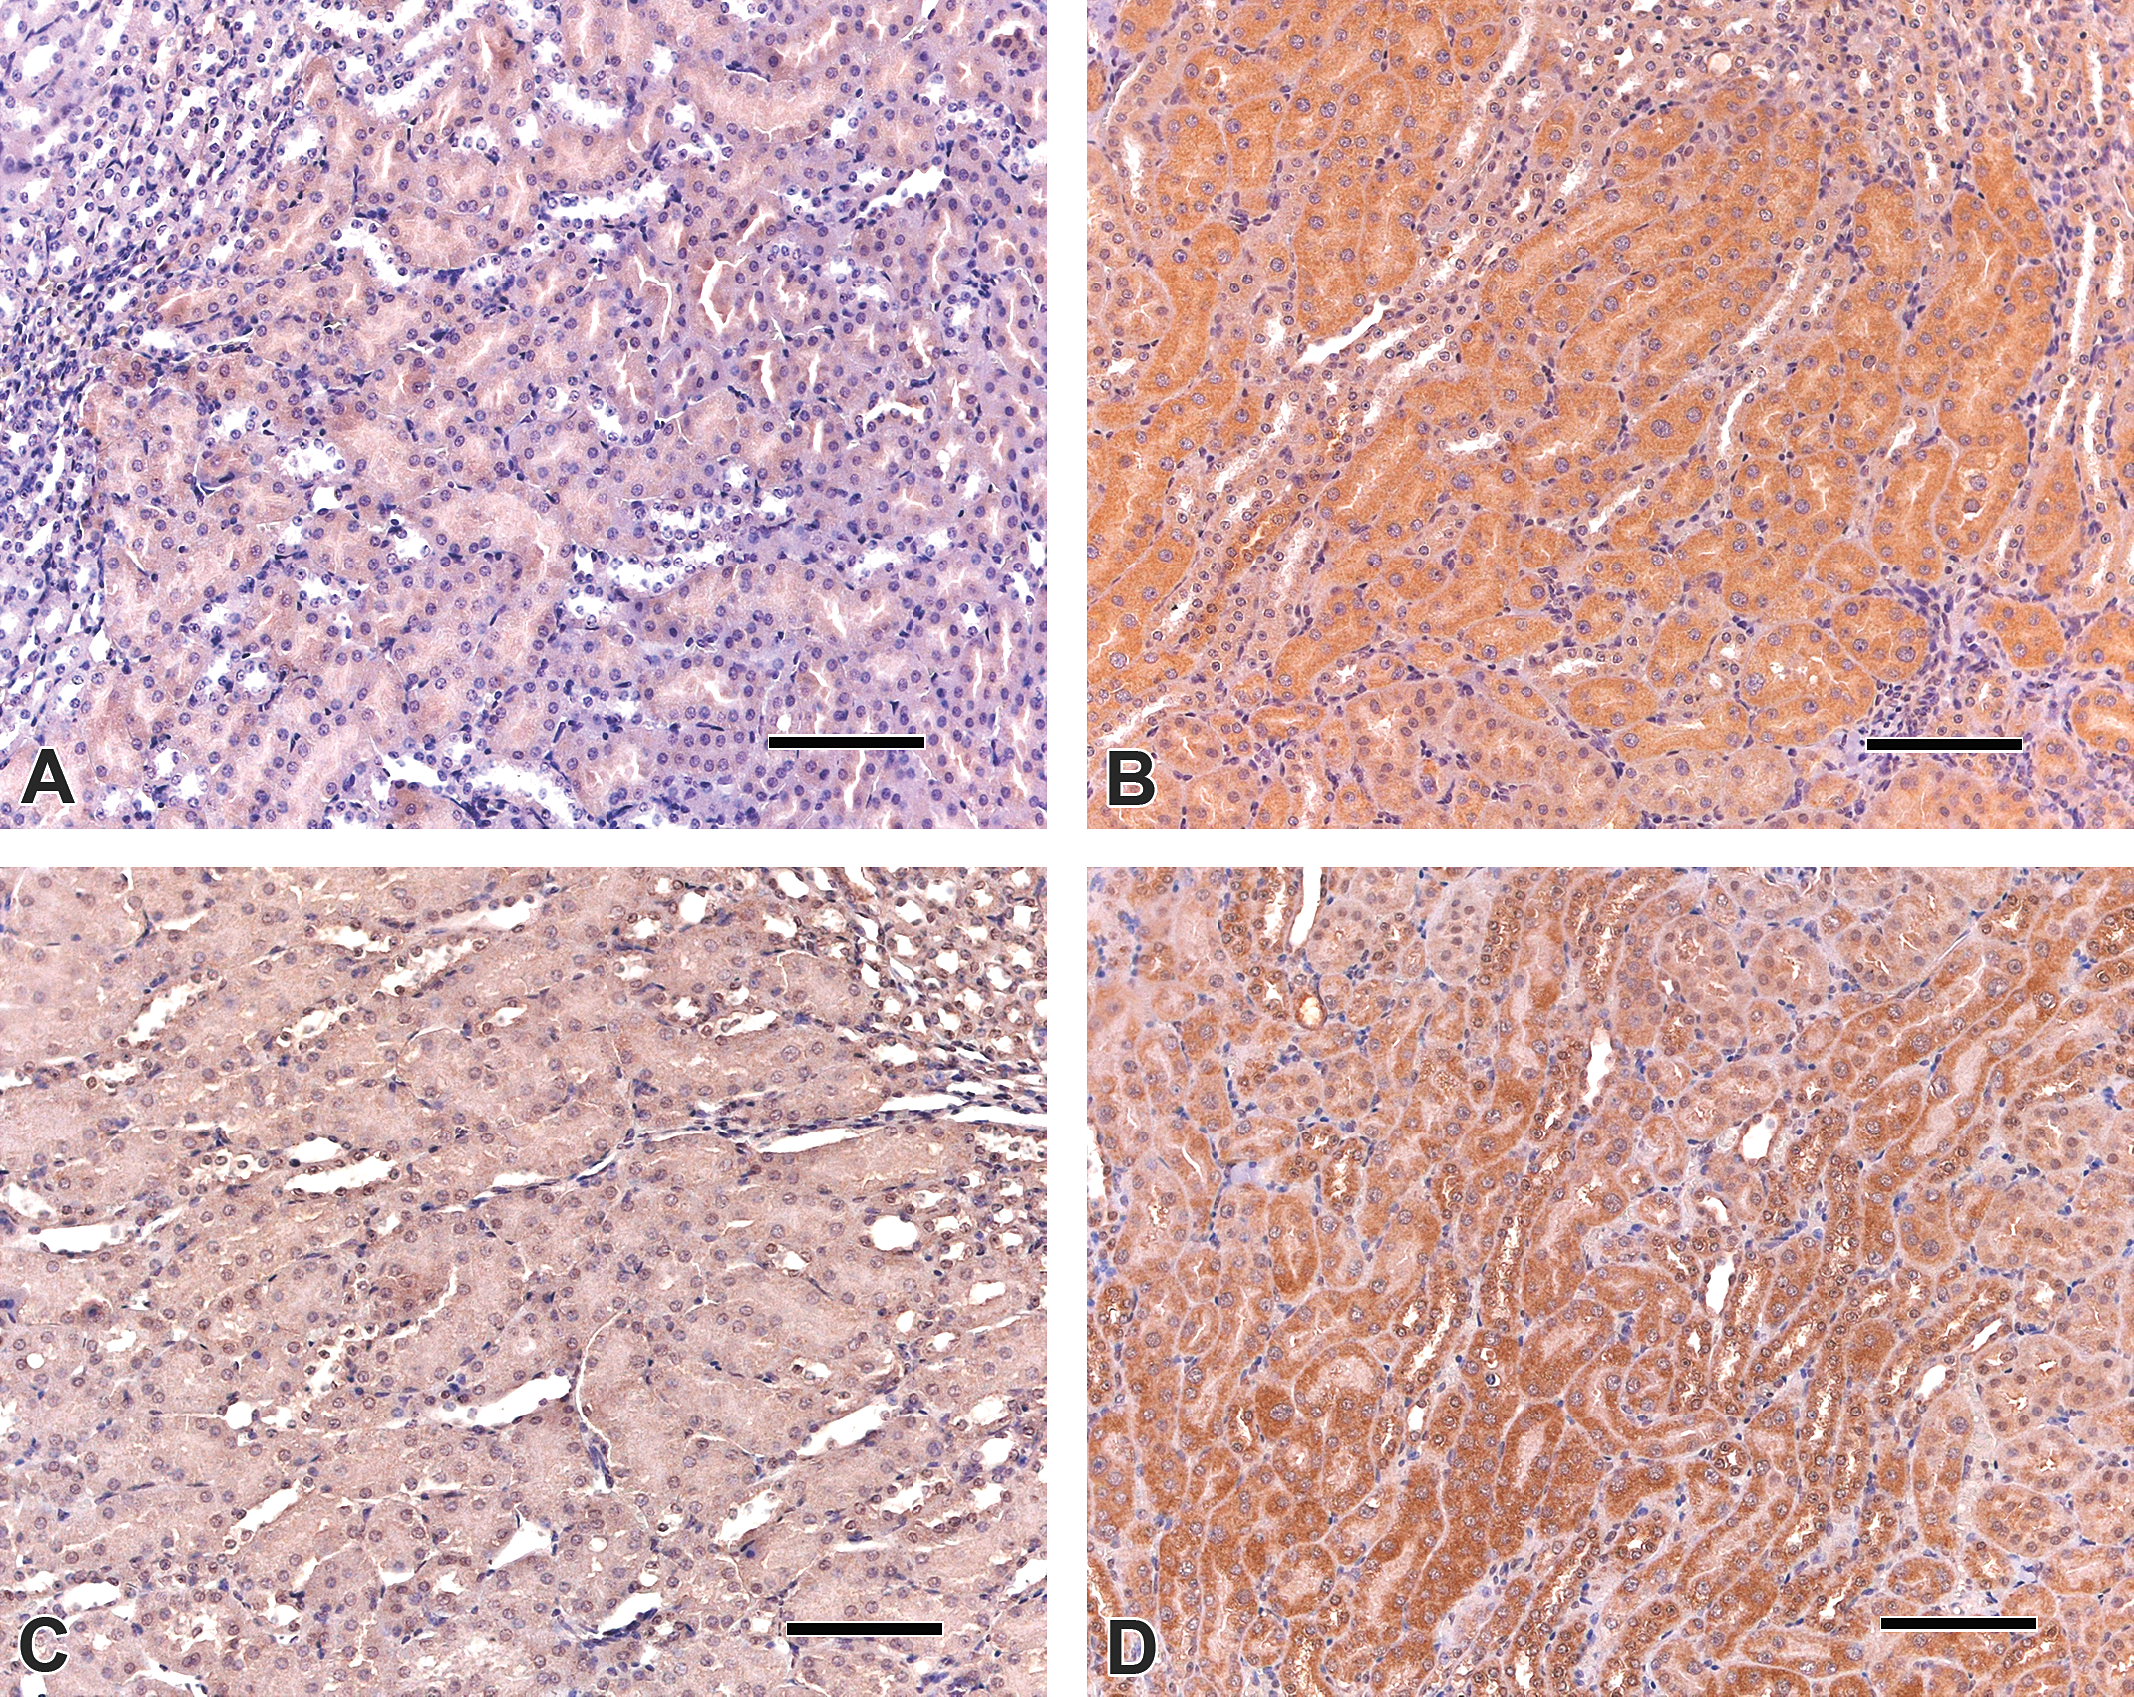
Clusterin (CLU) and osteopontin (OPN) expression in the outer stripe of the outer medulla of kidneys from p53+/+ mice: (A) CLU, control; (B) CLU, 10-mg ochratoxin A (OTA)/kg diet; (C) OPN, control; (D) OPN, 10-mg OTA/kg diet. CLU and OPN positivity are visible as dark reddish-brown staining, more prominent in kidney sections from the 10-mg OTA/kg dose group. Scale bars 100 μm.
Immunohistochemical assessment of kidneys from p53+/+ and p53+/− mice exposed to dietary OTA for 26 weeks.
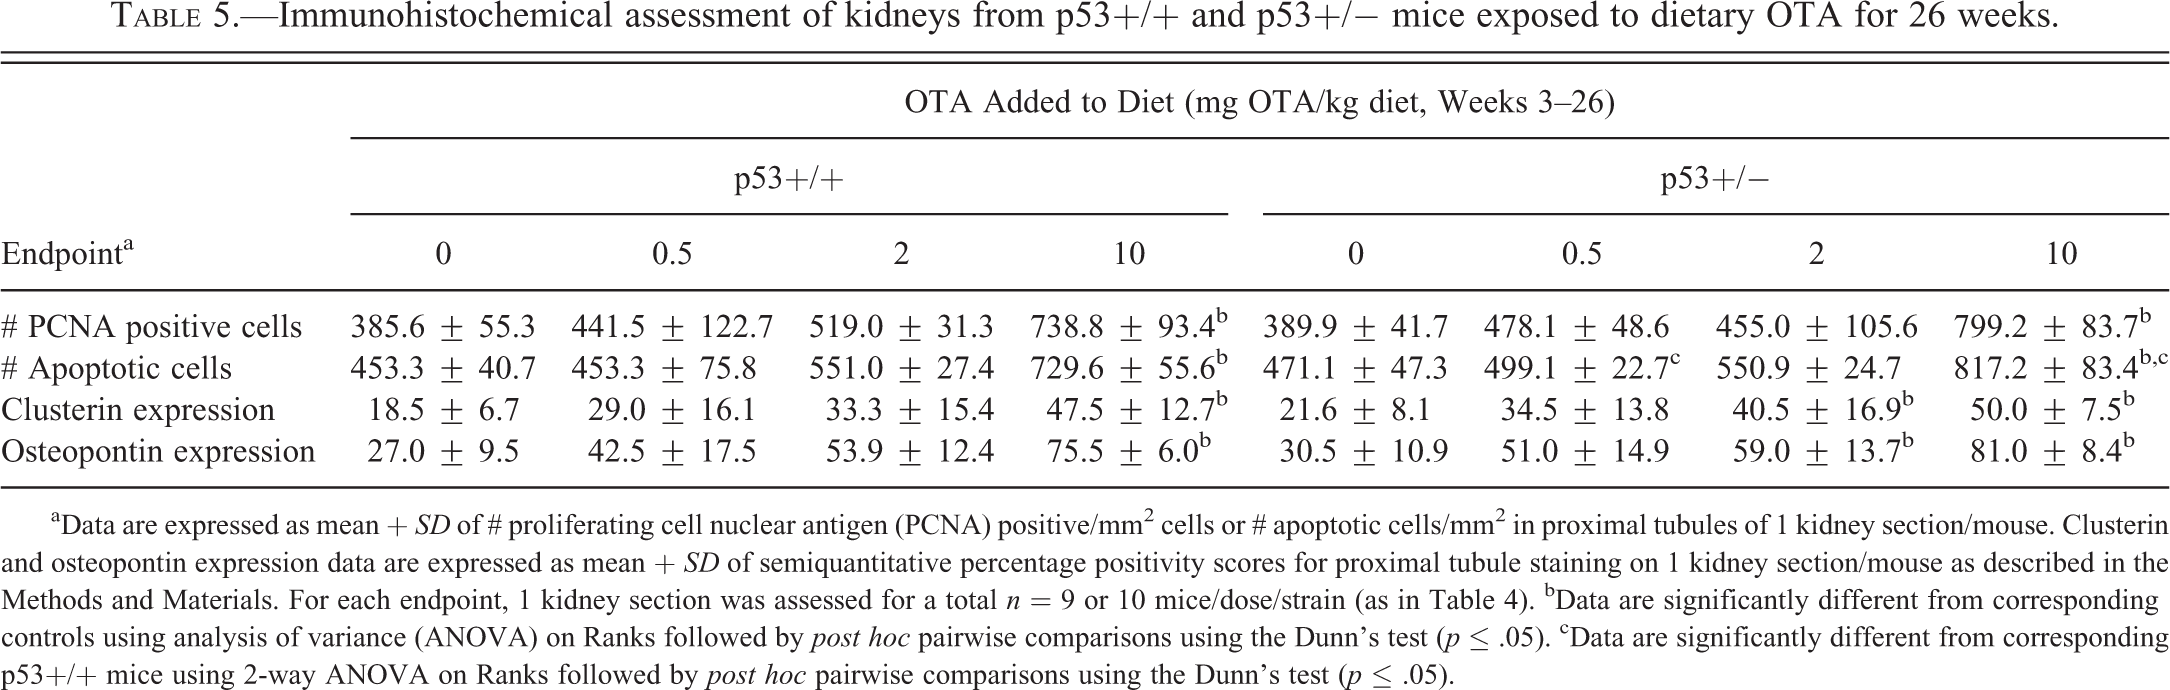
aData are expressed as mean
Comparison of Changes in p53+/+ and p53+/− Mice
Differences in the responses of p53+/− versus p53+/+ mice to OTA were not pronounced. Final BWs were 15% lower in high-dose p53+/− mice compared to p53+/+ mice; this difference was not statistically significant (Table 1). In comparison, final BWs were 5%, 0%, and 7% lower in p53+/− mice compared to p53+/+ in the control-, low-, and medium-dose groups (Table 1). Compared to their respective controls, significant differences in BW and relative food consumption occurred more often in p53+/− than p53+/+ mice (Figure 2A and B; Figure 3A and B). There were significantly higher numbers of apoptotic cells in proximal tubules of p53+/− mice exposed to 0.5-mg and 10-mg OTA in diet, respectively, compared to p53+/+ mice exposed to the same levels of OTA in diet (Table 5). Although CLU and OPN expression were significantly higher in p53+/− mice but not p53+/+ mice exposed to 2-mg OTA/kg diet, the apparent difference between strains was not statistically significant. There were no further statistically significant strain-related differences in responses to OTA for any other endpoint examined.
Discussion
Hepatic and renal tumors were observed in male B6C3F1 mice exposed chronically to 40-mg OTA/kg diet (Bendele et al. 1985; Kanisawa and Suzuki 1978). In this study, male p53+/+ and p53+/− mice could not be fed diets containing 15- or 40-mg/kg OTA due to rapid and significant weight loss. Mice were switched to new diets containing 0.5-, 2-, and 10-mg OTA/kg diet to replace diets containing 1-, 15-, and 40-mg OTA/kg diet, respectively. Feed consumption measurements during the initial period were highly variable in the 15- and 40-mg/kg dose groups, primarily due to the mice removing diet from feed containers. This activity, presumably motivated by dissatisfaction with the diet, obscured any measurement of putative changes in food consumption. However, even with an assumption that BW changes were due to reduced feed consumption, it could not be established whether feed refusal was due to unpalatability or to OTA morbidity with concurrent inappetance.
At the end of the study, a dose-dependent increase in hepatocellular necrosis, but no tumors or preneoplastic lesions were observed in the livers of p53+/+ and p53+/− mice. Likewise, renal changes were consistent with OTA-induced nephrotoxicity, but no tumors were observed in the kidneys of p53+/+ and p53+/− mice. It is possible that tumors may have developed if the exposure period had been longer or if it were possible to use the higher dietary OTA levels that caused tumors in B6C3F1 mice (Bendele et al. 1985). Validation of the p53+/− mouse model for carcinogenesis bioassays initially indicated that a 26-week exposure period was sufficient for true positive responses to develop in p53+/− mice after exposure to genotoxic compounds known to pose carcinogenic risks for humans (Floyd et al. 2002); however, exposure periods up to 9 months have been used with no increased mortality in control animals (NTP 2005a, 2005b). In this study, it was assumed that the maximum tolerable dose had been achieved at 10-mg OTA/kg diet based on significant weight loss in mice initially exposed to 15-mg OTA/kg diet. Furthermore, BW and liver weight reduction in p53+/− and p53+/+ mice exposed to 10-mg OTA/kg diet were indicative of morbidity. Final BWs were 30% and 37% lower, respectively, and relative liver weights were 27% and 23% lower, respectively, in high-dose p53+/+ and p53+/− mice in this dose group. In comparison, BWs of B6C3F1 mice exposed to 40 ppm OTA in diet were 20% and 30% lower than those exposed to 0 ppm or 1 ppm OTA in diet in months 6 to 24 of a 2-year study (Bendele et al. 1985). This supports the conclusion that the absence of tumors in p53+/− mice in this study was not an artifact of dose selection or exposure period. Since p53+/− mice are sensitive to genotoxic carcinogens, the lack of tumors and the overall similarity in responses to OTA in p53+/− and p53+/+ mice suggest that the MOA for OTA carcinogenesis is primarily nongenotoxic.
Similar responses to OTA in p53+/+ and p53+/− mice indicate that p53 heterozygosity did not strongly influence renal toxicity, suggesting either a limited role for p53 and p53-regulated pathways in response to OTA-induced cellular toxicity or significant redundancy in cellular protective mechanisms to compensate for p53 deficiency. The only statistically significant difference between p53+/− and p53+/+ mice was a higher number of apoptotic cells in kidney OSOM in p53+/− versus p53+/+ mice. The overall difference was small, but it was consistent with an increase in the incidence of OTA-induced apoptosis in kidney OSOM and cortex of p53-deficient gpt δ mice compared to their p53-proficient counterparts exposed to 1- or 5-mg OTA/kg BW by gavage for 4 weeks (Hibi et al. 2013b). Global gene expression analyses of the kidney outer medulla of gpt δ rats exposed to OTA demonstrated that there were changes in the expression of genes regulating p53-dependent and p53-independent apoptosis (Hibi et al. 2013a, 2013b). This study indicates that OTA-induced apoptosis is likely to be mediated in part by 1 or more p53-independent pathways. Furthermore, since p53 activates both pro- and antiapoptotic genes (Roos and Kaina 2013), reduced expression of p53-dependent antiapoptotic genes associated with DNA repair may also contribute to the higher incidence of apoptotic cells in kidneys of p53-deficient mice exposed to OTA.
OTA stimulates and disrupts cell division in the kidney. A dose-dependent increase in PCNA-positive cells, indicative of proliferation, was observed in proximal tubules of p53+/+ and p53+/− mice and was consistent with similar increases in PCNA-positive proximal tubule cells in rats exposed to OTA by gavage (Mally et al. 2005; Taniai et al. 2014). The presence of cells with an abnormally enlarged nucleus, or karyomegaly, in the renal proximal tubule is a distinguishing lesion associated with OTA exposure (Boorman et al. 1992). Although karyomegaly can be induced by renal carcinogens, it is not considered a preneoplastic lesion because there is no evidence that proliferative foci stem directly from these cells (Hard et al. 1999). OTA and other karyomegaly-inducing carcinogens, which also stimulated cellular proliferation, increased the expression of γH2AX, a phosphorylated variant of the histone H2AX involved in DNA double strand break (DSB) repair, in the kidney OSOM of rats exposed to 210-μg OTA/kg bw/d by gavage for 28 days (Taniai et al. 2012a). Phosphorylated Chk2 and nuclear cdc2, both part of the G2/M DNA damage checkpoint pathway, were also elevated suggesting that DNA damage is associated with exposure to karyomegaly-inducing carcinogens, triggering homeostatic repair responses that prevent cells with DNA damage from entering mitosis. Multiple epigenetic effects resulting in cell cycle perturbation have been linked experimentally to OTA toxicity and carcinogenicity, including aberrant ubiquitin D activation leading to disrupted cell cycle regulation, inhibition of histone aceytltransferases leading to mitotic disruption, and cytoskeletal perturbations leading to aberrant cell division (Taniai et al. 2012b; Czakai et al. 2011; Rached et al. 2006). One or more of these events leading to mitotic disruption in renal proximal tubule cells could manifest as OTA-induced karyomegaly. The hypothesis that OTA-induced aberrant mitosis is a trigger for proliferative changes in renal proximal tubules is plausible (Rached et al. 2007; Mally 2012), but the key event has yet to be conclusively confirmed and the available evidence does not rule out multiple cellular targets for OTA. Marin-Kuan et al. (2008) proposed that OTA carcinogenicity stems from multiple epigenetic mechanisms, including cell- and tissue-level responses to OTA-meditated apoptosis, and tissue regeneration and proliferation resulting from cytotoxicity due to oxidative stress and protein synthesis inhibition. This hypothesis accommodates the spectrum of cellular changes observed in kidneys from OTA-exposed p53+/+ and p53+/− mice that ranged from necrosis and apoptosis to proliferation and changes such as karyomegaly, anisokaryosis, and hyperchromatic nuclei in renal epithelial cells.
Based on experimental evidence of OTA carcinogenicity in rats, mice, and poultry (Bendele et al. 1985; NTP 1989; Stoev 2010), DNA damage is a likely outcome of OTA exposure. In confirmation, in vivo mutagenesis assays using gpt δ rats detected large deletion mutations in the outer medulla of the kidney after 4 weeks of exposure to 5-mg/kg OTA by gavage (Hibi et al. 2011). Positive comet assays and increased phosphorylation of histone variant H2AX were indicative of DNA DSBs at the target site and increased expression of genes linked to DNA repair by homologous recombination (HR) suggested that large deletion mutations may arise during repair by HR of OTA-induced DSBs (Kuroda et al. 2014). However, the underlying mechanism of OTA-induced DSBs has yet to be determined. Nuclear 8-hydroxy-2′-deoxyguanosine (8-OHdG) levels were not altered in the cortex or outer medulla of gpt δ rats exposed to OTA, suggesting that oxidative DNA damage was not the primary cause of deletion mutations at the target site in this model (Hibi et al. 2011), but other epigenetic pathways leading to OTA-induced genotoxicity cannot be ruled out (Mally and Dekant 2009; Trosko and Ruch 1998).
Changes in CLU and OPN expression in kidneys from p53+/+ and p53+/− mice were similar to those seen in kidneys from OTA-exposed rats (Rached et al. 2008). Dose-dependent increases in CLU and OPN positivity in proximal and distal tubules due to OTA exposure in mice were consistent with their identification as presumptive biomarkers of both proximal and distal tubule injury (Hoffmann et al., 2010). Although CLU and OPN have been used as renal injury markers, both are widely distributed in tissues. The secretory heterodimeric glycoprotein CLU has been reported to be involved in regulating multiple cellular responses that may occur in a mutually exclusive and opposing manner, for example, apoptotic cell death, cell cycle regulation, DNA repair, cell adhesion, tissue remodeling, lipid transportation, membrane recycling, and immune system regulation (Jones and Jomary 2002; Shannan et al. 2006). OPN, a secretory glycosylated phosphoprotein, is an antiapoptotic factor associated with regulation of bone remodeling, chemotaxis, and immune responses, as well as cellular proliferation and regeneration after renal injury (Xie et al. 2001). Consequently, increased renal CLU and OPN expression in OTA-exposed mice are consistent with an increased incidence of proliferating cells, apoptotic cells, necrosis, and other lesions indicative of cell cycle disruption.
There were no significant changes in peripheral and splenic WBC numbers, including granulocyte differentials and lymphocyte subsets, in p53+/+ and p53+/− mice chronically exposed to OTA. Similarly, there were no significant changes in peripheral WBC numbers in rats chronically exposed to OTA in diet (NTP 1989). Mild splenomegaly in all high-dose p53+/+ and p53+/− mice was most likely a nonspecific response to tissue damage in target organs such as the kidney. Cellular proliferation was significantly depressed in ex vivo splenocyte cultures indicating functional compromise in lymphocytes from OTA-exposed mice, which was generally in accordance with the well-established immunosuppressive effects of OTA (Bondy and Pestka 2000).
The lung lesions observed in all p53+/− and p53+/+ mice were unexpected but not considered to be treatment related. ECP is a sporadic, idiopathic disease that occurs in certain strains of laboratory mice, including the C57BL/6 and 129Sv strains used to generate this p53+/− knockout and the reconstituted p53+/+ mouse (French, Storer, and Donehower 2001b; Hoenerhoff, Starost, and Ward 2006). To our knowledge, this is the first report of ECP in this mouse model. The disease was considered mild, but there was apparent exacerbation with OTA treatment resulting in a slight increase in the severity of ECP in high-dose mice. Since ECP has been associated with mutations that result in immunodeficiency or that target the immune system (Guo, Johnson, and Schuh 2000), it is possible that OTA-induced immunosuppression contributed to increased ECP severity. The pulmonary smooth muscle hyperplasia that was also observed in all mice is unexplained at this time but was not considered to be treatment related and was not increased in severity with OTA exposure.
OTA is nephrotoxic to laboratory and domestic animals and, irrespective of its MOA, is considered a potential human health hazard. The lowest observed effect level (LOEL) for renal toxicity in the pig, which is highly sensitive to OTA-induced nephrotoxicity, was 8-μg/kg BW/day for minimal renal toxicity (JECFA 2008; Krogh et al. 1974). The LOEL for renal proximal tubule karyomegaly in male rats exposed to OTA by gavage for 5 d/wk for 90 d was 62.5 μg/kg BW/d (NTP 1989). In 2-year carcinogenesis studies the LOEL for kidney tumors was 4,400 μg/kg BW/d in male B6C3F1 mice exposed to OTA in diet, and 70 μg/kg BW/d in male rats exposed to OTA by gavage for 5 d/wk (Bendele et al. 1985; JECFA 2008; NTP 1989). In comparison, the lowest dose group in which renal changes were observed in p53+/− and p53+/+ mice was 2-mg OTA/kg diet, corresponding to a LOEL of 200-μg OTA/kg BW/day based on feed consumption. This is lower than the LOEL for kidney tumors in B6C3F1 mice, although the wide dose separation between the 1 ppm and 40 ppm dietary OTA levels in the 2-year mouse study complicates direct comparison with the present study. Taken together, these comparisons support the general conclusion that mice are less sensitive than rats and pigs to OTA-induced nephrotoxicity and less sensitive than rats to OTA-induced renal carcinogenesis. Species sensitivity was arguably a more critical influence on responses to OTA than p53 heterozygosity.
In conclusion, renal changes due to ochratoxicosis in p53+/+ and p53+/− mice were consistent with those observed in B6C3F1 mice and in other species. Heterozygosity for the p53 gene had a limited influence on murine responses to OTA. The results of this study were interpreted to be suggestive of primarily epigenetic MOAs for OTA carcinogenesis, based on validation of the p53+/− N5 mouse for use in short-term carcinogenesis bioassays which has shown that this model is susceptible to tumor induction by genotoxic and not nongenotoxic carcinogens (Pritchard et al. 2003; Tennant, Spalding, and French 1996).
Footnotes
Acknowledgments
The authors would like to thank Jennifer Eastwood, Mark Feeley, Gary Lombaert, and Tim Schrader for valuable discussions and article review, and the staff of the Health Canada animal care facility for their assistance throughout the study.
Author Contribution
Authors contributed to conception or design (GB, LC, IC, DL, and RM); data acquisition, analysis, or interpretation (GB, DC, SA, LC, CA, IC, RK, KK, DL, and RM); drafting the manuscript (GB); critically revising the manuscript (DC, SA, LC, CA, DL, and RM); and gave final approval (RM). All authors gave final approval, all authors agreed to be accountable for all aspects of work in ensuring that questions relating to the accuracy or integrity of any part of the work are appropriately investigated and resolved.
The author(s) declared no potential conflicts of interest with respect to the research, authorship, and/or publication of this article.
The author(s) received no financial support for the research, authorship, and/or publication of this article.