
Abstract
Perfluorooctanoic acid (PFOA) is a perfluoroalkyl acid primarily used as an industrial surfactant. It persists in the environment and has been linked to potentially toxic and/or carcinogenic effects in animals and people. As a known activator of peroxisome proliferator–activated receptors (PPARs), PFOA exposure can induce defects in fatty acid oxidation, lipid transport, and inflammation. Here, pregnant CD-1 mice were orally gavaged with 0, 0.01, 0.1, 0.3, and 1 mg/kg of PFOA from gestation days (GD) 1 through 17. On postnatal day (PND) 21, histopathologic changes in the livers of offspring included hepatocellular hypertrophy and periportal inflammation that increased in severity by PND 91 in an apparent dose-dependent response. Transmission electron microscopy (TEM) of selected liver sections from PND 91 mice revealed PFOA-induced cellular damage and mitochondrial abnormalities with no evidence of peroxisome proliferation. Within hypertrophied hepatocytes, mitochondria were not only increased in number but also exhibited altered morphologies suggestive of increased and/or uncontrolled fission and fusion reactions. These findings suggest that peroxisome proliferation is not a component of PFOA-induced hepatic toxicity in animals that are prenatally exposed to low doses of PFOA.
Introduction
Perfluorooctanoic acid (PFOA) belongs to the perfluoroalkyl acid (PFAA) family, a group of perfluorinated compounds that also includes perfluorooctane sulfonate (PFOS). PFOA and PFOS, also known as C8 PFAAs or simply “C8s,” share a similar chemical structure that consists of an 8-carbon backbone with either a functional carboxylate (PFOA) or a sulfonate (PFOS) group. As perfluorinated compounds, each hydrogen has been replaced with a fluorine: a unique chemical structure that endows PFOA and PFOS with profound hydrophobic, oleophobic, and lipophobic properties that make them ideal industrial surfactants used in the manufacturing of a variety of consumer products including paints, lubricants, adhesives, nonstick cookware coatings, stain repellents, and flame retardants (Abbott et al. 2012; Emmett et al. 2006; Lau 2012; Lau et al. 2006; Rosen et al. 2007; Wolf et al. 2008; Post, Cohn, and Cooper 2012; Lindstrom, Strynar, and Libelo 2011; Huang et al. 2013; Gallo et al. 2012).
PFOA is ubiquitous and persistent within the environment. The rate of elimination of PFAAs from the body burden is enhanced with decreasing carbon-chain length. Therefore, C8s, like PFOA, are eliminated rather slowly in numerous species and tend to persist in the environment, as well as in people, for several years (Lau 2012; Post, Cohn, and Cooper 2012; Lindstrom, Strynar, and Libelo 2011). Within the general U.S. population, the Centers for Disease Control (CDC) currently estimate that the mean PFOA serum concentration is 3.12 ng/ml, demonstrating the persistent and ubiquitous nature of the chemical within the environment (Centers for Disease Control [CDC] 2013). However, in areas at high risk for PFOA exposure (e.g., near production sources), the mean serum concentration has been reportedly as high as 493 ng/ml; the highest mean serum PFOA concentrations appear to be among individuals over 60 years of age or children aged 2 to 5 years (Emmett et al. 2006).
The rate of elimination for PFOA is lowest among humans compared to other animal species. The mean half-life of PFOA in humans is 3.8 years with no differences in toxicokinetics among sexes (Lindstrom, Strynar, and Libelo 2011; Post, Cohn, and Cooper 2012). However, rats are extremely efficient at clearing PFOA and demonstrate sex-dependent differences in toxicokinetics in which the half-life of PFOA in the female rat is significantly shorter than that of males (Lindstrom, Strynar, and Libelo 2011; Lau 2012; Post, Cohn, and Cooper 2012). Although the half-life of PFOA in mice is much shorter than in humans, mice demonstrate similar sex-independent elimination kinetics and body burdens for PFOA and are therefore the preferred rodent model for PFOA toxicity studies.
Developmental abnormalities associated with gestational PFOA exposures are consistently observed in mice. In a study by Lau et al. (2006), full litter resorptions were reported in 100% of dams given 40 mg/kg of PFOA from gestation day (GD) 1 to 17. Decreased postnatal survival and growth deficits including low birth weight and delayed eye-opening were also noted with doses as high as 5 mg/kg and were most pronounced in the 20-mg/kg PFOA dose groups. Accelerated pubertal maturation in PFOA-exposed male mice was also observed at high doses. In addition, increased relative liver weight has been reported at lower doses of PFOA, and a study by Macon and coworkers revealed delayed mammary gland development among female mice exposed to low doses (0.3 and 1.0 mg/kg) of PFOA for the entire length or latter half of gestation (Lau 2012; Lau et al. 2006; Abbott et al. 2012; Macon et al. 2011; Rosen et al. 2007).
As a known peroxisome proliferator–activated receptor alpha (PPARα) agonist, PFOA has been associated with various neoplastic processes as well as alterations in metabolic and immune functions. Adult PFOA-exposed rats typically develop hepatocellular adenomas, pancreatic acinar tumors, and interstitial (Leydig) cell tumors of the testis in the 2-year bioassay, a specific combination of tumors known widely as the “tumor triad” that is characteristic of PPARα agonists. For this reason, PFOA’s activation of PPARα is believed to be the critical mode of action for PFOA-induced hepatocellular carcinomas in rodent models (Lau 2012; Post, Cohn, and Cooper 2012; Yang et al. 2002; Abbott et al. 2012).
Adult rodents treated with high doses of PFOA also present with evidence of severe hepatotoxic change including hepatocellular hypertrophy, hepatomegaly, microvesicular or mixed fatty change, and necrosis (cell death). The observed centrilobular hepatocellular hypertrophy is primarily associated with profound peroxisome and/or mitochondrial proliferation, of which peroxisome proliferation is a response unique to the PFOA rodent model (Lau 2012; Berthiaume and Wallace 2002; Huang et al. 2013). On histological examination, hepatocytes are enlarged with prominent smooth endoplasmic reticulum (SER), hypereosinophilia, and a characteristic, finely granular or “ground glass” appearance within the cytoplasm indicative of enzyme induction. Since our previous studies have demonstrated increased incidences of hepatocellular tumors in a PPARα knockout (KO) mouse strain (Filgo et al. 2014), we hypothesized that the mechanism of action for PFOA-induced hepatocellular hypertrophy and subsequent tumor development was independent of PPARα activation.
Generally, in hepatotoxic injury, many organelles, including mitochondria and the endoplasmic reticulum (ER), often exhibit marked ultrastructural alterations (Cheville 2013). Mitochondria are continuously reshaped during fission (fragmentation) and fusion reactions that cause a morphological shift between small, fragmented mitochondrial units and large mitochondrial networks; these fission and fusion reactions are catalyzed by dynamin-related proteins, specifically DRP1, the major fission protein of mitochondria and its receptor, FIS1 (fission 1 or Mitochondrial fission factor [MFF]). The GTPases, OPA1, MFN1, and MFN2, are essential mediators of mitochondrial fusion. MFN2 is a tethering protein that recruits DRP1 from the cytosol to its receptor on the mitochondrial outer membrane (MOM). Altered conformations of DRP1 can promote mitochondrial fission and inhibit fusion reactions, resulting in elongated mitochondria (Cheville 2013).
In this study, we examined adverse hepatic changes at both the microscopic and ultrastructural levels in CD-1 mice prenatally exposed to low doses of PFOA that are considered to be within the higher end of the reference interval for human exposures (0.01-, 0.1-, 0.3-, and 1.0-mg/kg PFOA; Macon et al. 2011; Emmett et al. 2006). Based on previous reports linking low doses of PFOA to increased body weights and elevations in adipokines (Hines et al. 2009), our mice were also given a high-fat diet challenge in order to elucidate any potential alterations in lipid metabolism that might occur as a result of gestational PFOA exposures. Here, we demonstrate evidence of an early PFOA-mediated effect in CD-1 mice at postnatal day (PND) 21 manifested as centrilobular hepatocellular hypertrophy due to mitochondrial abnormalities that increased in severity by PND 91.
Materials and Methods
Animal Procedures
Timed-pregnant CD-1 mice arrived on gestational day (GD) 0 (sperm positive) from Charles River Laboratories (Raleigh, NC). Pregnant dams were housed individually in polypropylene cages and received lab chow (LabDiet Purina 5001, PMI Nutrition International LLC, Brentwood, MO) and tap water ad libitum. AAALAC accredited animal facilities were maintained on a 12:12 hr light–dark cycle at 20 to 23°C and 40 to 50% relative humidity. Animals were treated humanely and with regard for alleviation of suffering and all animal protocols were approved by the NIEHS Animal Care and Use Committee.
PFOA, as its ammonium salt (>98% pure), was acquired from Sigma Aldrich (St. Louis, MO). PFOA dosing solution was prepared fresh daily in deionized water. The timed-pregnant CD-1 mice (n = 17–21 dams per dose) were dosed in the morning with 0-, 0.01-, 0.1-, 0.3-, or 1-mg/kg PFOA by oral gavage from GD 1 to 17 in a volume of 10 μl/g of dosing solution. Vehicle control mice were given deionized water via oral gavage. Dams were weighed daily prior to dosing. Within each treatment group, litters were equalized at PND 4 to 4 females and 6 males (males were used for a separate study). Litters with less than 10 pups received fosters from larger litters within the same respective dose group. Pups from small litters (n < 4 pups) were excluded from the remainder of the study. Pups were weaned at 3 weeks of age (PND 21) at which point females were retained and housed at 3 to 5 mice per cage. Males were not evaluated in this study.
For the high-fat diet challenge, subsets of the CD-1 offspring were given a high-fat diet for 6 weeks. Starting on PND 35, mice were switched to a rodent diet with 60% kcal% fat (n = 1 pup from 20 dams per dose group; #D12492, Research Diets, Inc., New Brunswick, NJ) or a control diet with 10% kcal% fat (n = 1 pup from 7 to 10 dams per dose group; #D12450B, RDI) hereafter referred to as control diet. Weight gain was recorded for all animals on post-diet weeks 0, 2, 3, 4, 5, and 6. After 6 weeks, animals were returned to the Purina 5001 diet. At PND 91, prior to necropsy, 50% of the high-fat challenged animals (n = 10 per dose group) were fasted for 4 hr. Seven to 10 pups per treatment group (1 pup per dam) were weighed and then necropsied at PNDs 21 or 91 following decapitation. Relative liver weight was used to express liver weight as a percentage of the total body weight. The trunk blood from each animal was collected and centrifuged, and the serum was collected and stored at −80°C. Liver sections were collected and fixed in 10% neutral buffered formalin or stored at −80°C.
Body Composition Measurements
Body composition was determined at PND 84 (n = 5 per dose group) prior to postmortem examination using a Lunar PIXImus mouse densitometer (GE Medical Systems, Madison, WI). In this process, X-rays generated by the densitometer were directed through the test subject via a collimator; the detector and charged coupled device camera digitally process the data and display the information as an image on a screen. Software included with the PIXImus densitometer identifies and estimates the density and weight of lean tissue, fat tissue, and bone. Isoflurane anesthesia was used at 2.5% with oxygen to anesthetize the mice and each was placed in the prone position on a sticky square within a plastic tray. The head of each mouse was not included in the analysis and was either oriented outside of the X-ray field or masked using the provided software. The PIXImus was calibrated daily using a plastic “mouse phantom” provided by the manufacturer.
Histology
Liver sections from each mouse were collected and fixed in 10% neutral buffered formalin. Three sections from the left liver lobe were processed routinely, paraffin embedded, sectioned at 5 μm, and stained with hematoxylin and eosin stains. Hepatic lesions were graded on a 4-point severity scale by board-certified pathologists, where 1 = minimal, 2 = mild, 3 = moderate, and 4 = severe.
Transmission Electron Microscopy (TEM)
Selected samples of frozen liver (n = 8; 4 high-dose and 4 control animals from both high-fat diet and control diet groups) were post fixed in 1% osmium tetroxide, then dehydrated through a series of graded alcohols, followed by 100% propylene oxide. Fixed tissues were embedded in Polybed 812 resin and placed in a 70°C oven for 72 hr. The resin blocks were trimmed, thick sectioned (a 700- to 800-nm section stained with 1% Toluidine blue), and examined by light microscopy. One block each from zone 1 (periportal) and zone 3 (centrilobular) of the liver was chosen for each animal. The chosen blocks were thin sectioned (a section 70–90 nm or “gold”), placed on formvar-coated copper grids and stained with uranyl acetate and lead citrate. The grids were examined on a FEI Tecnai 120 KV TEM. At least 6 digital photomicrographs were taken of each grid/area of the liver (periportal or centrilobular)/animal and then evaluated and compared by dose group and hepatic zone.
Clinical Chemistry
At PND 91, blood serum samples (approximately 50 ml) were collected from the female CD-1 offspring at the time of necropsy for evaluation. The serum chemistry analyses (alkaline phosphatase [ALP], alanine aminotransferase [ALT], aspartate aminotransferase [AST], glucose, triglyceride, low-density lipoproteins [LDL], high-density lipoproteins [HDL], total bile acid [TBA], sorbitol dehydrogenase [SDH], and cholesterol) were determined using an Olympus AU400e (Beckman Coulter, Inc., Irving, TX) and reagents obtained from the instrument manufacturer (except LDL, HDL, and TBA—reagents obtained from Sekisui Diagnostics, LLC., Framingham, MA). Leptin and insulin immunoassays were performed in duplicate using a Sector Imager 2400 (Meso Scale Discovery, Gaithersburg, MD) and multiplexed reagents obtained from the instrument manufacturer. Assays were carried out as directed by the manufacturer.
Statistics
Data were analyzed using Cochran–Armitage trend or Spearman’s correlation tests to examine dose-related trends for each species/condition combination. Fisher’s exact test was used to compare each dose group to the control group. Kruskal–Wallis analysis of variance was used to test for differences in severities across all dose groups and Mann–Whitney or Dunn’s tests were used to compare each dose group to their respective controls. Data are reported as mean ± standard error of the mean (SEM), unless otherwise specified. Data were considered significantly different at p < .05.
Results
Prenatal PFOA Exposures and High-fat Diet Induce Alterations in Body Weight, Composition, and Liver: Body Weight Ratios
In vehicle control animals at PND 91, there were no significant differences in mean body weights between the control diet and Purina 5001 diet. There was a significant effect of fat in the diet, as mean body weights were significantly higher in the high-fat diet group than the control and Purina 5001 diet groups (Figure 1). Prenatal PFOA exposure had no effect on mean body weight in animals fed the control diet or Purina 5001 for any recorded time point (0–6 weeks or PND 91). However, PFOA treatment was associated with lower mean body weight of the animals fed the high-fat diet in the highest dose group (1.0 mg/kg) compared to high-fat diet vehicle controls within the 2 to 4 weeks of observations (data not shown); this effect had dissipated by PND 91 (Figure 1).
Mean body weights for CD-1 mice at postnatal day (PND) 91 in the various diet groups. Mean body weights (g) in female offspring following the full gestational exposure to perfluorooctanoic acid (PFOA) were significantly elevated (p < .05) in the high-fat (bottom panels) versus control diets (top panels). Data presented as mean ± standard error of the mean (SEM). n = 7 to 10/dose group/diet. No significant treatment effect compared with controls within a diet.
Body fat percentage was determined at PND 84, 1 week prior to necropsy and about 1 week post-high-fat diet. PFOA-dosed animals on the control diet or Purina 5001 exhibited similar percentage body fat. Animals fed the high-fat diet within the high-dose (1.0-mg/kg PFOA) group demonstrated a nearly 10% increase in the percentage body fat compared to controls (Figure 2). However, this effect did not reach statistical significance.
Body composition analysis of CD-1 mice at postnatal day (PND) 84. Mean percentage body fat in PND 84 female offspring following prenatal exposure to perfluorooctanoic acid (PFOA) and 6-week consumption of control and high-fat diets. Data presented as mean ± standard error of the mean (SEM). n = 4 to 5. No significant treatment or diet effects compared with controls.
Liver weight at PND 21 was not statistically different as a result of PFOA exposure (all pups eating Purina 5001 diet at this time point). However, the liver:body weight ratios were significantly higher in the 0.3- and 1.0-mg/kg dose groups, as expected (Figure 3). A previous study, with a lower number of litters represented, demonstrated that full gestational 1.0-mg/kg PFOA exposure increased liver:body weight ratios at PND 14, but not at PND 21 or older (Macon et al. 2011). We confirmed that this is a transient effect, as no differences in liver weights or liver to body weight ratios were evident at PND 91.
Liver weight and relative liver weight of postnatal day (PND) 21 CD-1 mice. Mean liver weights (g) and relative liver weights (liver:body weight ratio) in female offspring following prenatal exposure to perfluorooctanoic acid (PFOA). All pups consumed Purina 5001 diet at this life stage. Data presented as mean ± standard error of the mean (SEM). n = 10/dose group. Significant treatment effect compared with controls (*p ≤ .05, **p ≤ .01).
PFOA Affects Cholesterol in Early Life
Biochemical analyses were performed on the sera of PND 91 animals to assess any metabolic alterations that might have persisted from PFOA exposure under a high-fat diet challenge. Composition analysis of serum collected from the Purina 5001 lab chow and control diet groups used in the high-fat diet challenge revealed comparable metabolites and enzyme levels (supplemental data). Therefore, for clinical chemistry analysis, the statistical comparisons were made from serum samples collected from only the high-fat diet and control diet groups.
In PFOA-exposed animals fed control diet, PFOA exposure did not alter liver enzymes to a biologically relevant level (supplemental data). A 6% increase in serum glucose was observed among the high-dose (1-mg/kg PFOA) group, but was not statistically significant. In addition, since there were no changes in insulin to accompany this apparent glucose elevation, these values may fall within the normal biological variation of the CD-1 mouse strain. No alterations in lipid biomarkers were observed, although some approached significance at the highest PFOA exposure (Figure 4).
Significant alterations in lipid biomarkers of postnatal day (PND) 91 CD-1 mice. Low-density lipoproteins (LDL; mg/dl), high-density lipoproteins (HDL; mg/dl), total cholesterol (mg/dl), and leptin (ng/ml) levels in PND 91 female offspring following full-gestation exposure to perfluorooctanoic acid (PFOA) on control diet and high-fat (both fasted for 4 hrs and nonfasted) diet. Data presented as the mean ± standard error of the mean (SEM). n = 7 to 10/dose group. Significant PFOA treatment effect compared with same diet controls (*p ≤ .05, **p ≤ .01). Significant diet effect compared with same dose control diet (# p ≤ .05, ## p ≤ .01).
In the high-fat diet groups (both fasted and nonfasted), PFOA exposure did not alter liver enzyme levels or carbohydrate metabolism (see supplemental data). However, a diet-related change was observed among high-fat diet groups, as all measured lipid biomarkers (total bile acids, triglycerides, HDL, LDL, and leptin) were significantly increased in the high-fat, nonfasted animals compared to the control diet animals; fasting did seem to resolve some of these alterations in lipid metabolism as serum triglycerides, leptin, and total bile acids were within normal limits in the fasted animals (Figure 4 and supplemental data). Compared to animals fed the control diet, LDL levels were increased in the high-fat, diet-fasted 0- and 0.1-mg/kg PFOA animals as well as the nonfasted, high-fat diet 0-, 0.01-, 0.1-, and 0.3-mg/kg PFOA animals. HDL levels were significantly higher in the high-fat (nonfasted) control animals compared to control diet control animals and was significantly lower in the high-fat 1.0-mg/kg PFOA animals (both fasted and nonfasted).
A high-fat diet significantly increased the total cholesterol among 0-mg/kg PFOA animals compared to those in the same dose group, receiving control diet. In the high-fat diet (fasted) animals, total cholesterol was still significantly higher in the 0.01- and 0.1-mg/kg PFOA groups compared to control diet animals. However, total cholesterol (HDL and LDL) was decreased in both fasted and nonfasted high-fat diet animals previously exposed to PFOA, resulting in levels similar to, or less than, dosed animals fed only control diet. Leptin was also increased in the high-fat diet (nonfasted) group compared to the control diet control and 0.1-mg/kg PFOA animals. Prenatal PFOA exposure also led to an apparent dose-related decrease in serum leptin for the nonfasted, high-fat diet animals (Figure 4).
In control animals challenged with a high-fat diet, no alteration in liver enzymes was observed. A slight increase in insulin was noted in the nonfasted group, but glucose remained within the reference interval (supplemental data).
PFOA Induces Hypertrophic and Inflammatory Changes in the Liver Early in Life
Within liver sections of both PND 91 and PND 21 animals exposed to PFOA, large numbers of inflammatory cells were occasionally observed surrounding portal veins (Figure 5C). These areas of periportal inflammation were composed primarily of lymphocytes and macrophages with fewer plasma cells and occasional neutrophils (chronic-active periportal inflammation). While these inflammatory cells seemed to center on portal vasculature, vasculitis was not a feature, as endothelial cells were unaffected. These changes were most severe among the PND 21 mice in which a significant PFOA dose-dependent response was observed (Figure 6, A). PND 91 mice within the highest dose groups (0.3- and 1.0-mg/kg PFOA) that had received the high-fat (fasted) and control diets (Purina 5001 and control diet) also exhibited significantly increased chronic-active periportal inflammation compared to 0-mg/kg PFOA (Figure 6). This response also indicated a significant dose-related trend among the high-dose PND 91 animals (p < .01) but was less severe than that observed in PND 21 mice (p < .01).
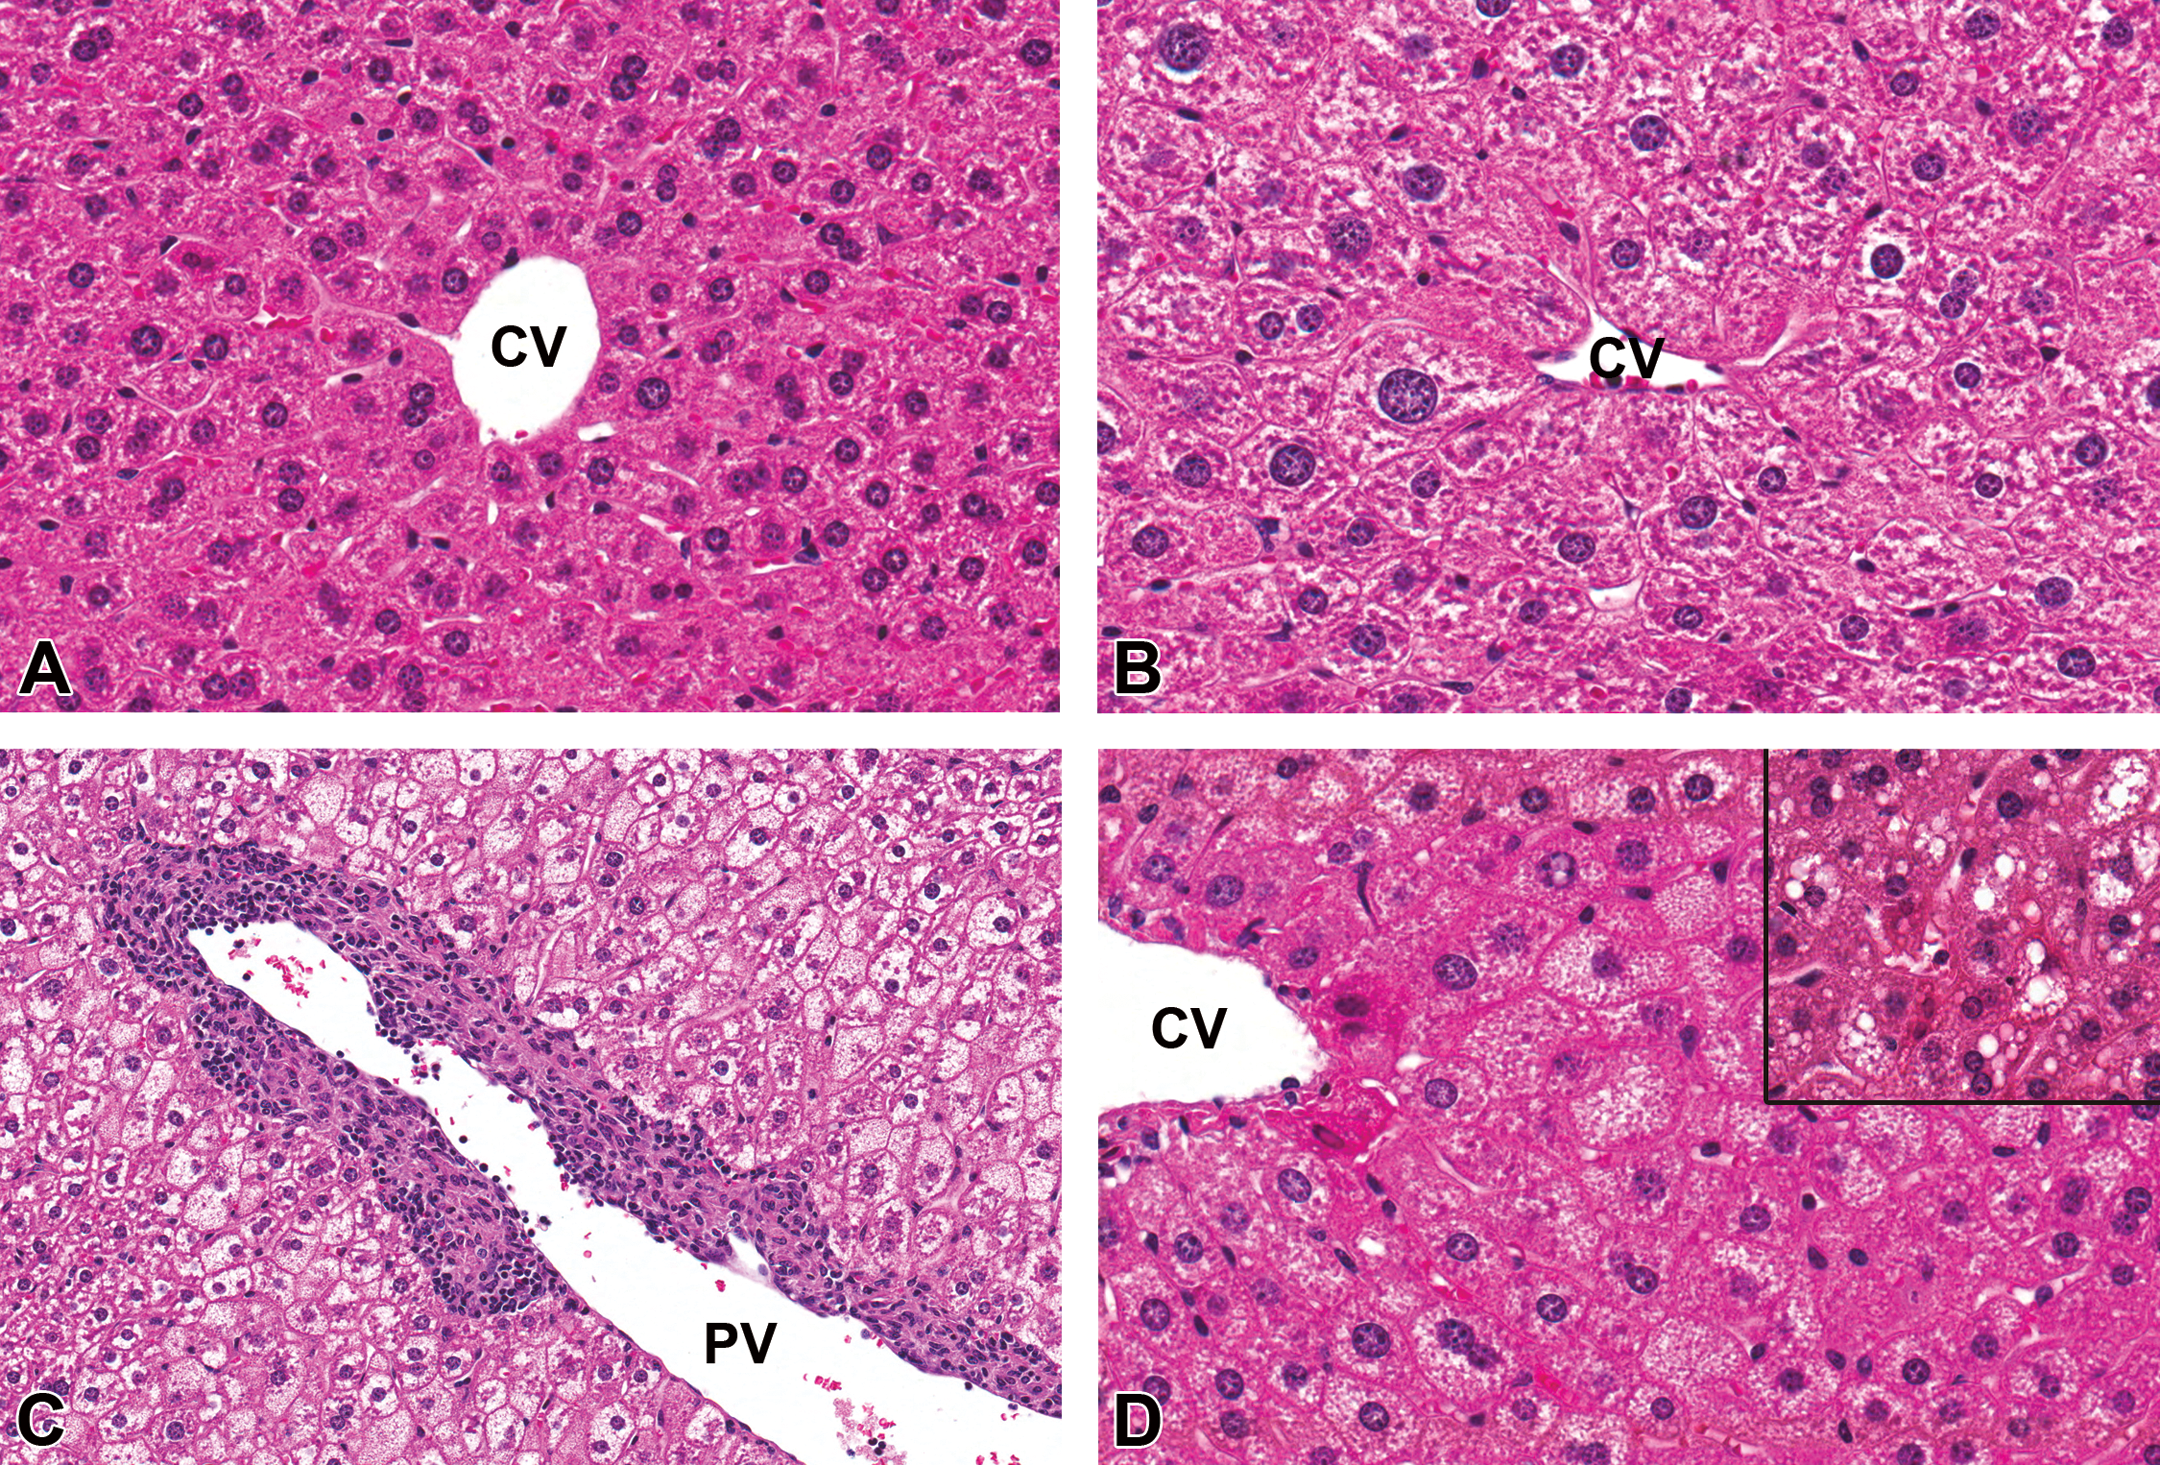
Histopathology of perfluorooctanoic acid (PFOA)-exposed liver, CD-1 mouse at postnatal day (PND) 91. (A) Liver, 0 mg/kg PFOA, control diet. CV = central vein, 40× magnification, hematoxylin and eosin stain (H&E). (B) Liver, 1 mg/kg PFOA, control diet. Markedly enlarged hepatocytes surround the central vein (centrilobular hypertrophy) often exhibiting enlarged, condensed nuclei (karyomegaly) with occasional binucleation. CV = central vein, 40×, H&E. (C) Liver, 1 mg/kg PFOA, high-fat diet, nonfasted. Large numbers of inflammatory cells are surrounding the portal vein (chronic-active periportal inflammation). Note microvesicular fatty change within the adjacent hepatic parenchyma. PV = portal vein, 20×, H&E. (D) Liver, 1-mg/kg PFOA, high-fat diet, fasted. Hepatocytes within centrilobular to midzonal areas are frequently distended with large numbers of tiny, clear, discrete, and intracytoplasmic vacuoles (microvesicular fatty change). CV = central vein, 40×, H&E. Inset: macrovesicular fatty change characterized by larger intracytoplasmic lipid droplets. 40×, H&E.
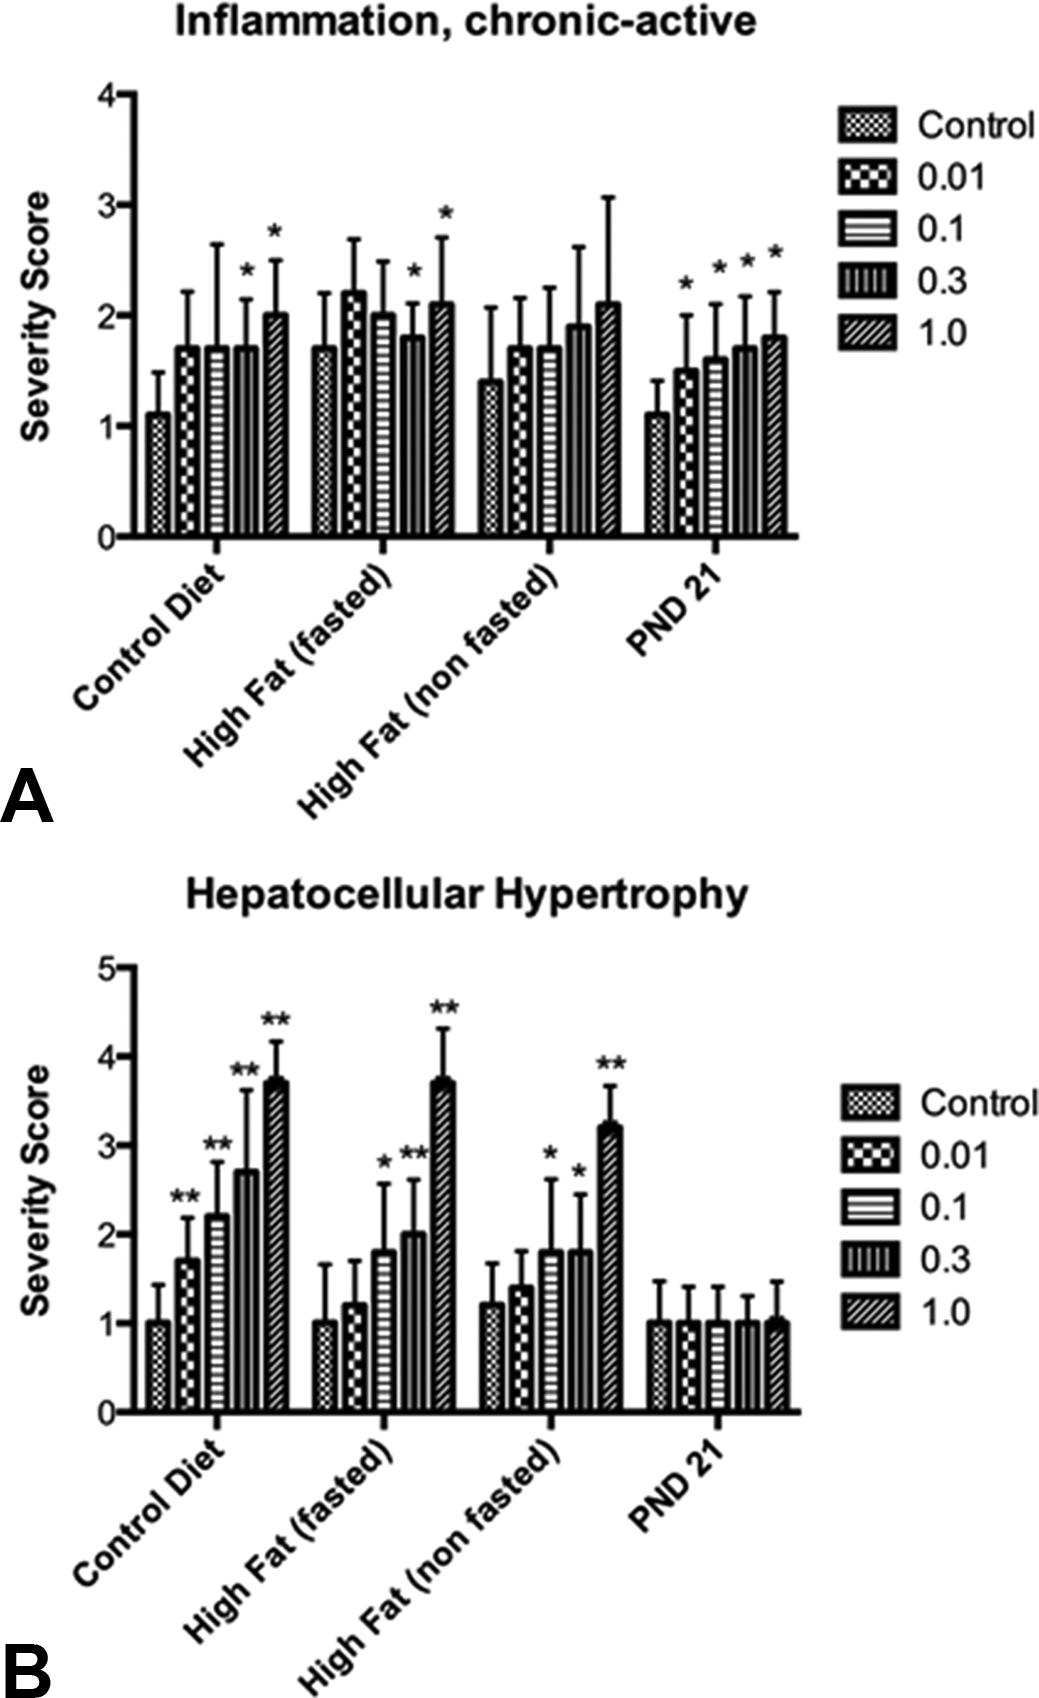
Significant dose-related increases in chronic active periportal inflammation (A) and hepatocellular hypertrophy (B) in perfluorooctanoic acid (PFOA)-exposed CD-1 mice at postnatal day (PND) 91. A significant dose-related increasing trend (p < .01) was observed for chronic-active periportal inflammation among PND 91 control diet or high-fat (fasted) groups, as well as PND 21 mice. Spearman’s correlations test also revealed a significant, dose-related trend in increasing severity scores for hepatocellular hypertrophy among all PND 91 groups, p < .01. Mann–Whitney tests were used to compare severity scores of each dose group with those of the same diet control animals (*p < .05, **p < .01).
Within examined liver sections from PND 91 mice, centrilobular to midzonal hepatocellular hypertrophy was frequently observed within all PFOA dose groups and was characterized by aggregates of enlarged hepatocytes with expanded, hypereosinophilic cytoplasm that often had a finely granular or “ground glass” appearance (Figure 5B). The nuclei of these cells were also typically enlarged with condensed chromatin (karyomegaly) and occasionally exhibited binucleation, which is not an uncommon feature of the mouse liver. PFOA-exposed animals within all dietary groups exhibited significant centrilobular hepatocellular hypertrophy relative to controls and the lesion severity increased in a dose-dependent manner (p < .01) regardless of diet (Figure 6, B). Centrilobular hepatocellular hypertrophy was also observed among PND 21 mice. However, the frequency and severity of these changes among PFOA-exposed weanlings were not significantly different from the age-matched controls for this particular time point. These data suggest that centrilobular hepatocellular hypertrophy is a PFOA-induced effect that begins early and progresses over time, long after the exposure has been eliminated.
Additional histopathological changes observed in both the PND 21 and PND 91 mice included hepatocellular fatty change in which hepatocytes were swollen and distended with numerous small, discrete, clear intracytoplasmic vacuoles (microvesicular), larger, clear, lipid droplets (macrovesicular), or a combination of the two (mixed; Figure 5D). Microvesicular and mixed fatty change was observed most frequently within the PND 91 high-fat diet groups, both fasted and nonfasted, but was not influenced by PFOA exposure, as incidence and severity of fatty change in both PFOA-exposed and control groups were not statistically significant.
PFOA Induces Mitochondrial Alterations within Hypertrophied Hepatocytes
Within PND 91 PFOA-exposed mouse livers, TEM of selected areas of centrilobular hepatocellular hypertrophy revealed enlarged cells containing increased numbers of mitochondria compared to controls (Figure 7). Mitochondria within these hypertrophied cells also exhibited abnormal morphologies including “ring-shaped,” “cup-shaped,” elongated “dumbbell-shaped,” and “giant” mitochondria, further indicating mitochondrial proliferation and increased fusion and fission reactions in response to prenatal PFOA exposure.
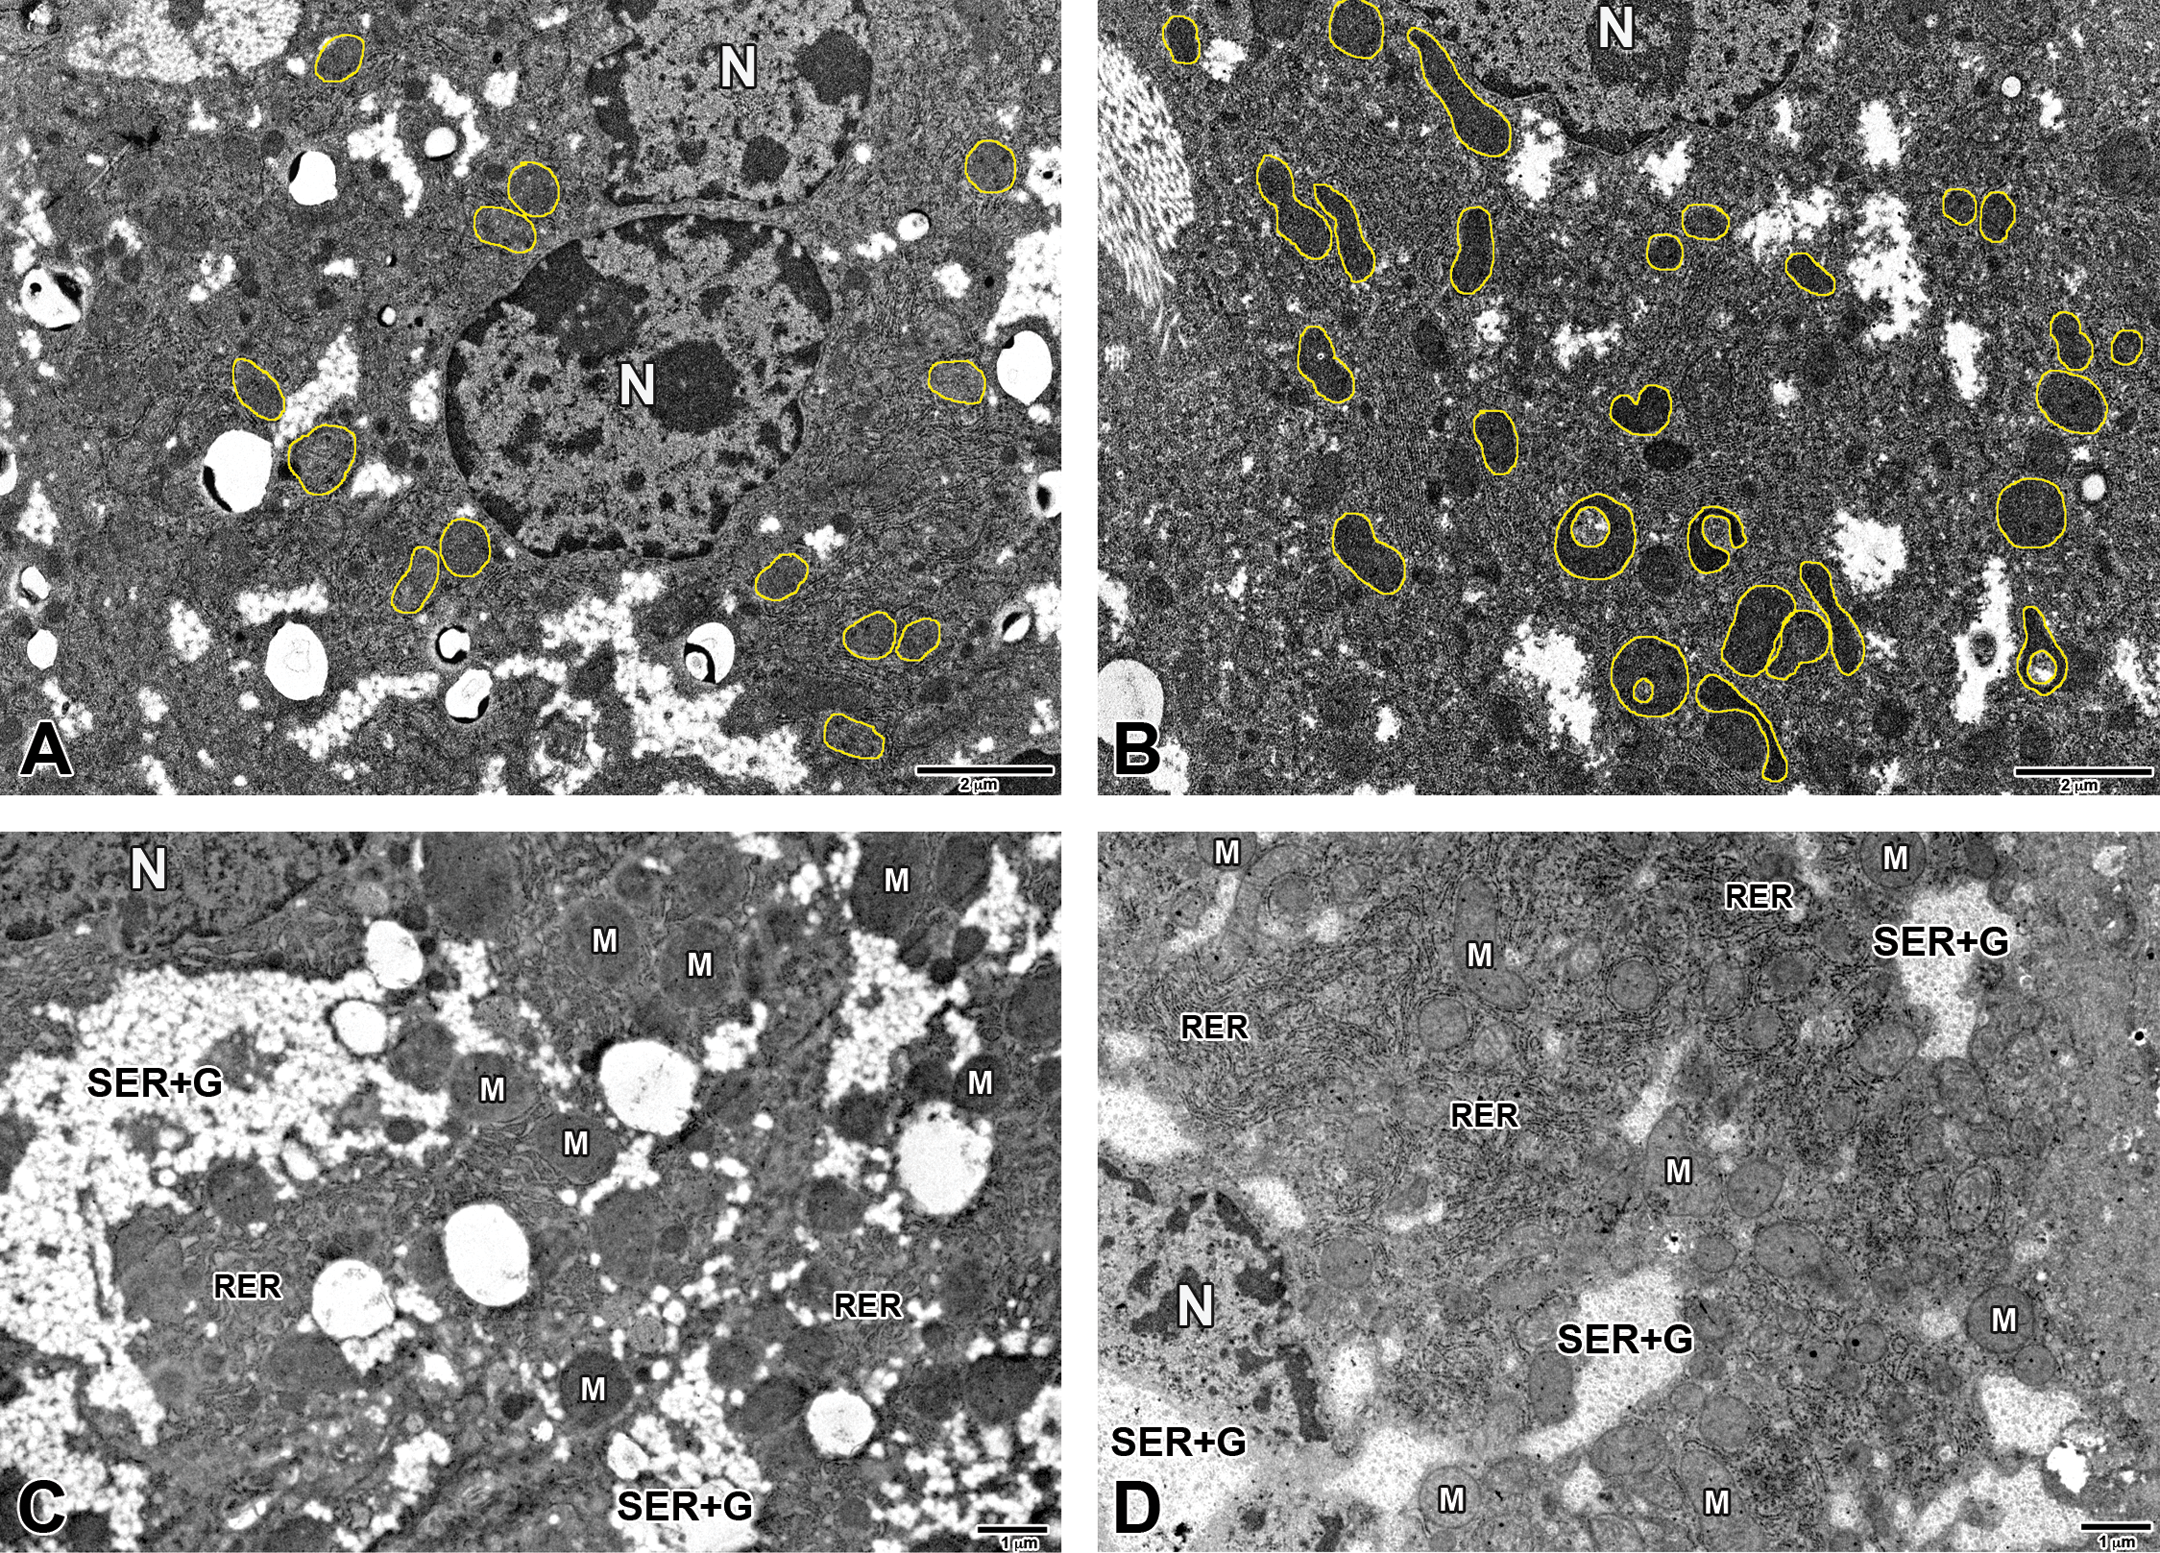
Transmission electron microscopy (TEM) of CD-1 mouse liver at postnatal day (PND) 91, control diet. (A) Liver, 0 mg/kg perfluorooctanoic acid (PFOA), centrilobular zone. N = nucleus; mitochondria outlined. (B) Liver, 1 mg/kg PFOA, centrilobular zone. The enlarged (hypertrophied) cell is expanded by increased numbers of mitochondria (outlined in yellow) that often exhibit abnormal morphology including “ring-shaped,” “cup-shaped,” elongated “dumbbell-shaped,” and “giant” mitochondria. N = nucleus; mitochondria outlined. (C) Liver, 0-mg/kg PFOA, centrilobular zone. (D) Liver, 1-mg/kg PFOA, centrilobular zone. Higher magnification of hypertrophied cell exhibiting mitochondrial proliferation with relative increases in smooth endoplasmic reticulum (SER), glycogen, and rough endoplasmic reticulum (RER). N = nucleus; M = mitochondria; SER + G = smooth endoplasmic reticulum + glycogen; RER = rough endoplasmic reticulum.
TEM at PND 91 infrequently revealed scattered myelin figures; aggregates of cellular debris and lysosomes and, in rare instances, SER, glycogen, and rough endoplasmic reticulum (RER) appeared to be relatively increased when compared to controls. Peroxisomes were present in one of the examined liver sections from the high-dose (1 mg/kg) PFOA group at PND 91 and were closely associated with areas of mitochondrial proliferation; this was the only instance where peroxisomes were detected in this study, regardless of age, dose, or diet.
In addition to the hypertrophy, karyomegaly, and compression of adjacent sinusoidal space observed in liver TEM of 1-mg/kg PFOA exposed weanlings, mitochondrial changes were also consistently observed at PND 21, including proliferation and the abnormal morphology types as noted earlier (Figure 8). These changes were less severe than those observed in PND 91 animals, suggesting that the mitochondrial abnormalities observed at PND 91 develop over time. Peroxisome proliferation or other features of cellular damage were not observed at this stage of development.
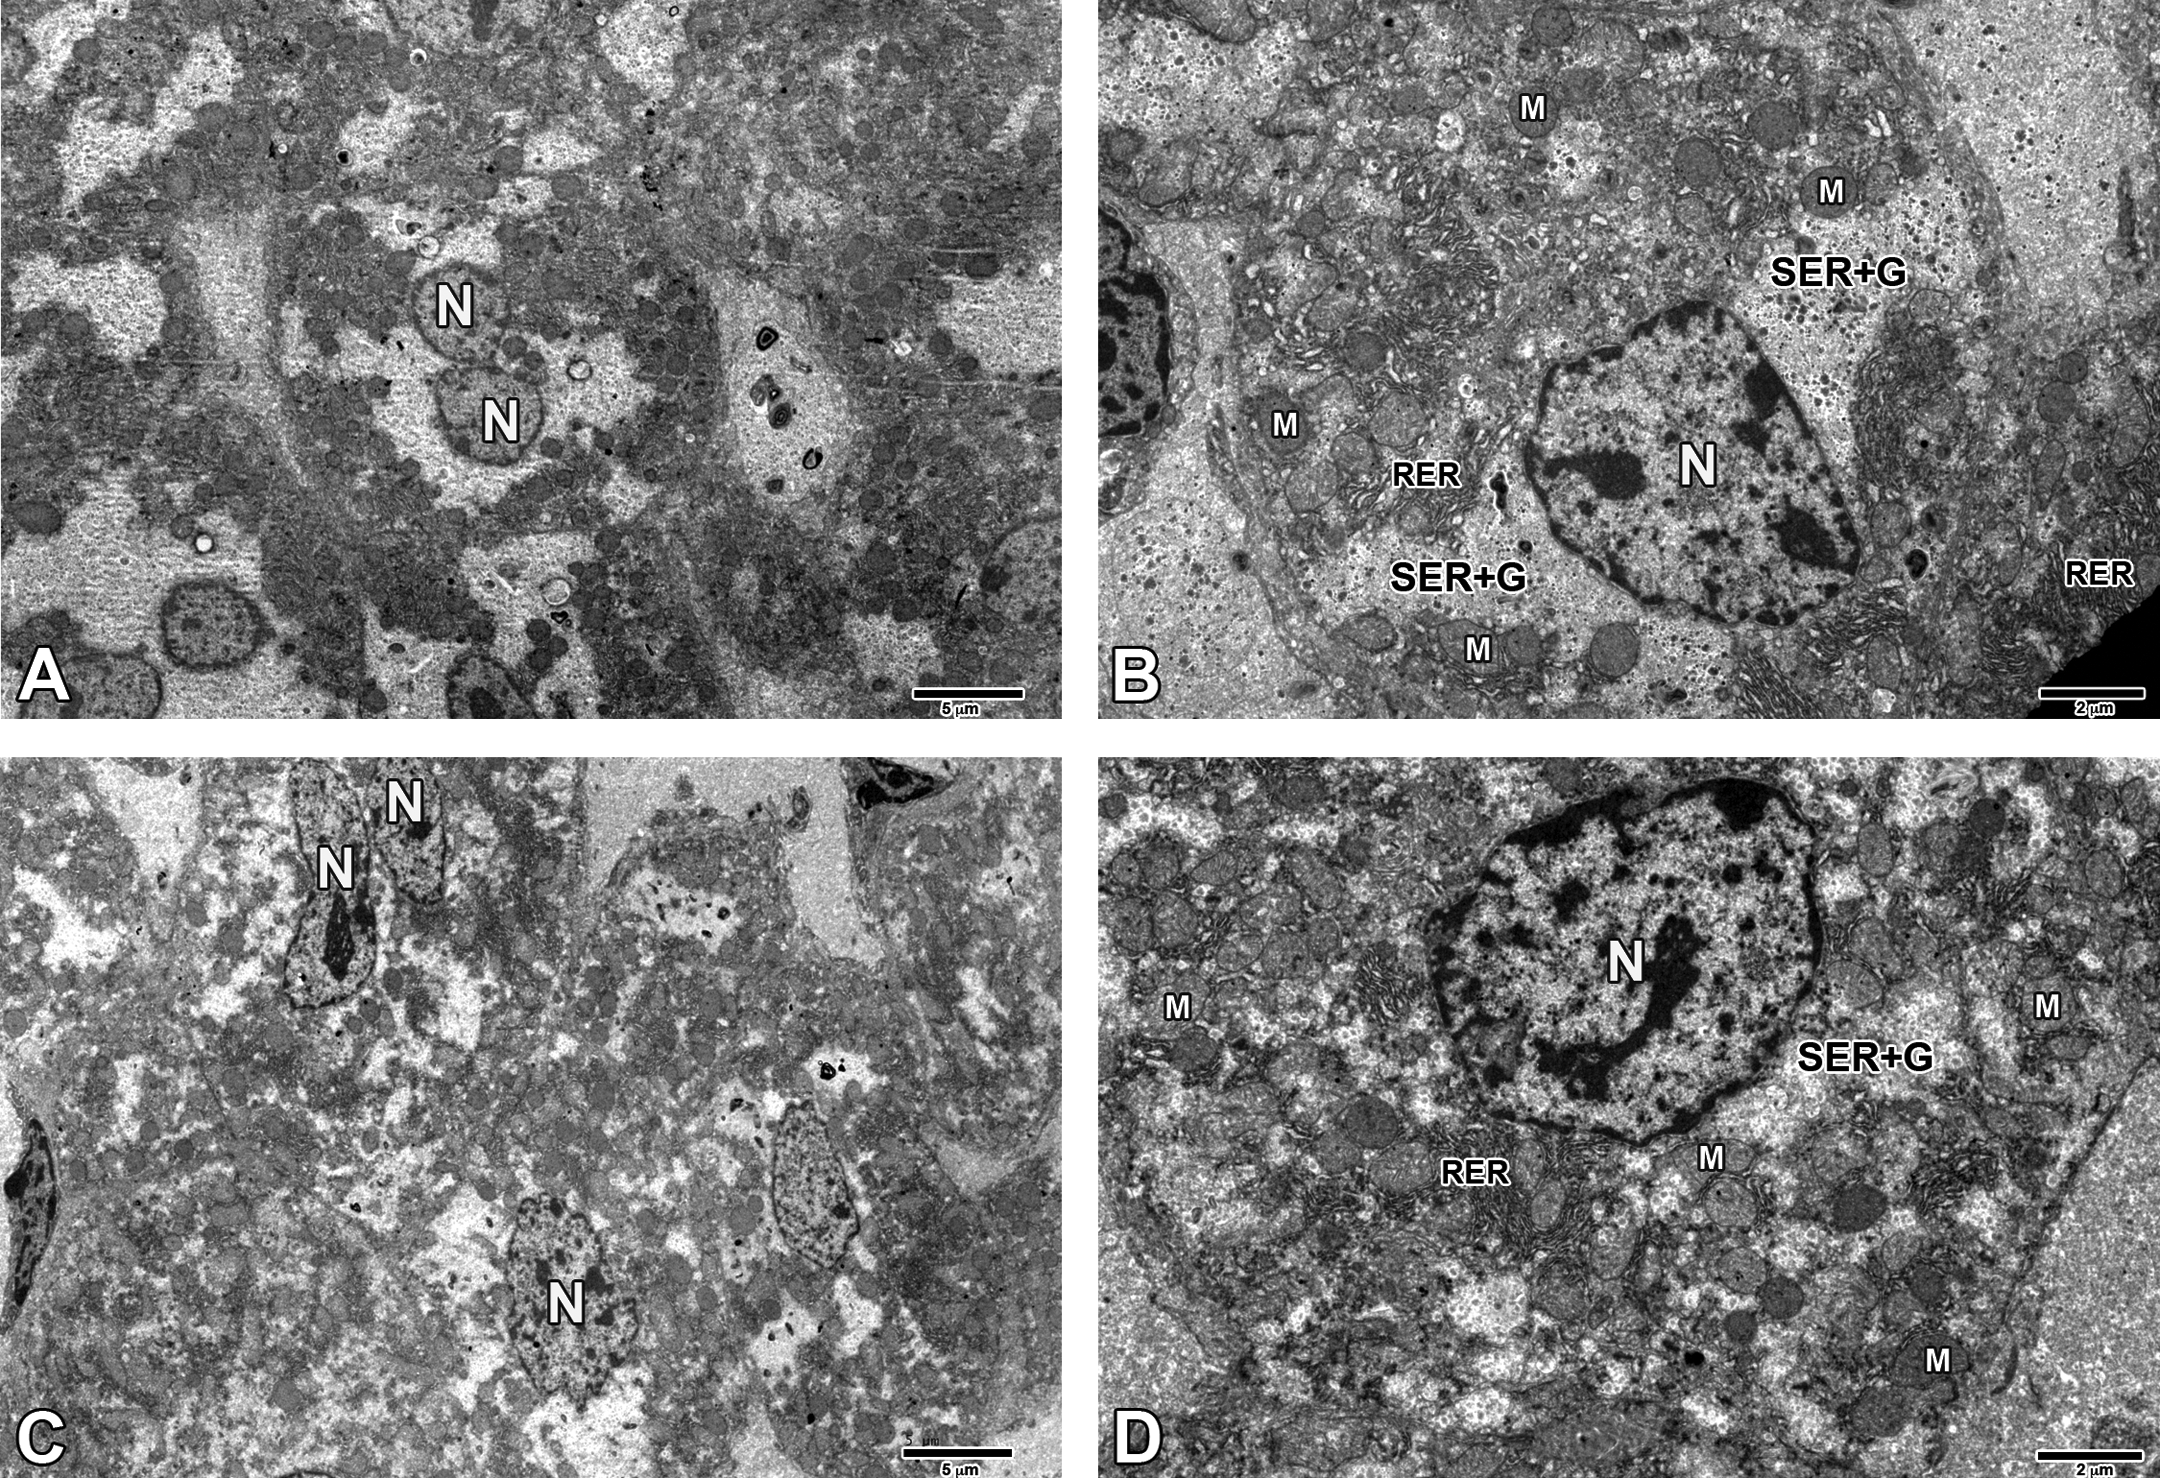
Transmission electron microscopy (TEM) of CD-1 mouse liver at postnatal day (PND) 21. (A) Liver, 0-mg/kg perfluorooctanoic acid (PFOA), centrilobular zone. N = nucleus. (B) Liver, 0-mg/kg PFOA, centrilobular zone. N = nucleus; M = mitochondria; SER + G = smooth endoplasmic reticulum + glycogen. (C) Liver, 1-mg/kg PFOA, centrilobular zone. Hepatocytes are mildly enlarged and encroaching on one another relative to control, also slightly compressing the adjacent sinusoidal space. N = nucleus. (D) Liver, 1-mg/kg PFOA, centrilobular zone. The hepatocyte is enlarged (hypertrophied) relative to control and no longer fits within the frame. The nucleus is also enlarged (karyomegaly) and the number of mitochondria is increased. N = nucleus; M = mitochondria; SER + G = smooth endoplasmic reticulum + glycogen.
Discussion
Ultrastructural changes within the livers of PND 21 and PND 91 mice indicate that prenatal PFOA exposures, at a dose of 1 mg/kg, induce centrilobular hypertrophy as a result of mitochondrial proliferation, and not peroxisome proliferation. Furthermore, proliferating mitochondria consistently exhibit abnormal morphologies including “ring-shaped,” “cup-shaped,” elongated “dumbbell-shaped,” and “giant” mitochondria, suggesting that increased or uncontrolled fission and fusion reactions are occurring as a response to toxic injury or, perhaps, a mitochondrial impairment or defect. Either way, this effect of PFOA is evident by PND 21 and progresses over time. Mitochondrial proliferation and morphological abnormalities were most apparent within the PND 91 animals, despite the length of time since their last PFOA exposure and a low, residual serum PFOA at this stage of development (Macon et al. 2011).
In general, pathological changes associated with PFOA-induced hepatic toxicity in rodents include hepatomegaly, hepatocellular hypertrophy, necrosis, or apoptosis; elevated serum ALT, a marker of hepatocellular injury, may also be observed clinically (Lau 2012; Post, Cohn, and Cooper 2012; Huang et al. 2013; Gallo et al. 2012). In adult-dosed rodent species, hepatocellular hypertrophy is considered a hallmark effect of high PFOA exposures and is most often associated with peroxisome proliferation (Lau 2012; Wolf et al. 2008). Peroxisomes are closely associated with mitochondria, sharing common transcriptional pathways, biochemical processes (such as fatty acid β-oxidation) and similar fission mediators of growth and division (Cheville 2013). In acute hepatic injury, peroxisomes are found in close association with mitochondria, establishing an interface with damaged membranes and moving to sites of injury on the MOM in order to protect mitochondria from further membrane damage. Centrilobular, or periacinar, hepatocytes are most sensitive to peroxisome proliferation as well as increased synthesis of the SER (Cheville 2013; Stalker and Hayes 2007). Increased synthesis of the SER in centrilobular hepatocytes is often observed with enzyme induction, particularly cytochrome p450 (Stalker and Hayes 2007).
Mice developmentally (e.g., prenatally and perinatally) exposed to PFOA that are evaluated soon after exposure exhibit alterations in the expression of genes involved in fatty acid catabolism, lipid transport, ketogenesis, glucose metabolism, cholesterol biosynthesis, and steroid metabolism (Rosen et al. 2007). In this study, serum biochemistry analysis revealed only minimal changes among PFOA-exposed mice 3 months post-PFOA exposure. However, dose-dependent decreases were observed in the measured lipid biomarkers, serum HDL and LDL in PFOA-exposed animals when challenged with a high-fat diet. Serum leptin also responded differently in animals challenged with a high-fat diet, increasing among control and high fat-fasted PFOA-exposed animals, especially within the higher dose groups, but decreasing in the nonfasted, high-fat diet group as a result of PFOA-exposure. A previous study by Hines et al. (2009) also reported elevated leptin in young adult mice (21–33 weeks of age) that were prenatally exposed to similar doses (0.01, 0.1, and 0.3 mg/kg) of PFOA and fed the 5001 Purina diet; however, these mice also exhibited dose-dependent increases in body weight gain (0.1- and 0.3-mg/kg PFOA) that began at 10 weeks and continued until the animals were 40 weeks old, suggesting that developmental exposure to low doses of PFOA might induce increased body weight gain in midlife. While our animals did not exhibit PFOA-related alterations in body weight gain, these findings confirm that developmental exposures to PFOA induce alterations in cholesterol biosynthesis and fatty acid metabolism, and demonstrate that those responses may vary when animals are challenged with a high-fat diet.
Marked microscopic and ultrastructural changes can be observed in hepatotoxic injury (Cheville 2013). In this study, the only histological evidence of PFOA-induced hepatotoxic injury in these CD-1 mice at both PND 91 and PND 21 was centrilobular hepatocellular hypertrophy with no apparent necrosis or apoptosis. Although hepatomegaly was not macroscopically observed, liver to body weight ratios were significantly increased among PND 21 mice at 0.3- and 1-mg/kg PFOA, compared to controls, demonstrating transient hepatic enlargement as a result of prenatal PFOA exposure. However, serum chemistry analyses revealed no elevated liver enzymes for any of the prenatally PFOA-exposed animals at PND 91 or 21. Elevated hepatic enzymes, specifically leakage enzymes ALT and ALP, would be expected in acute hepatic injury.
Hepatocellular hypertrophy is typically a reversible change: a physiological adaptation to increased functional demand that should resolve once the inciting cause is removed (Stalker and Hayes 2007). Yet, at PND 91, when PFOA is only detected at a low, residual level in the serum, these mice exhibited a dose-dependent increase in hepatocellular hypertrophy. Ultrastructural examination confirms that the hypertrophy was not due to peroxisome proliferation or SER induction as would be expected with PFAAs or enzyme inducers, respectively. Rather, hypertrophied cells contain increased numbers of dividing and proliferating mitochondria either as the result of impaired mitochondrial function or, possibly, a mitochondrial defect due to developmental PFOA exposure.
Centrilobular hepatocellular hypertrophy due to high-dose, adult PFOA exposure is typically due to peroxisome proliferation. However, mitochondrial biogenesis (specifically increased mitochondrial DNA) has been reported for PFOA (Berthiaume and Wallace 2002). Based on our findings in CD-1 mice, we conclude that developmental exposures to PFOA at a dose of 1 mg/kg induced hepatocellular hypertrophy due to mitochondrial proliferation, and not increased SER synthesis or peroxisome proliferation. Furthermore, increased numbers of abnormal mitochondria are indicative of an adaptive response to cellular injury or a mitochondrial impairment or defect. PFOA has the ability to interfere with mitochondrial metabolism and respiration (Starkov and Wallace 2002). Therefore, it is possible that the observed ultrastructural features within affected hepatocytes represent a compensatory mechanism in which mitochondria are undergoing increased fission and fusion reactions in order to meet the energy demands of the cell. However, these changes were most marked in the older animals (PND 91) that had only low, residual levels of detectable serum PFOA. In the full gestational PFOA exposure study by Macon et al. (supplemental data, 2011), the mean serum PFOA concentration of mice in the 1-mg/kg dose group was highest at PND 14 (16,950 ng/ml) and dramatically decreased at each collected time point (PND 21, 28, 42, and 63), with only 71 ng/ml detected at PND 84. In the liver, however, PFOA concentrations were highest at PND 7 (8,134 ng/ml) and decreased to 55 ng/ml by PND 84. Provided that in this study, the most severe alterations were observed when PFOA concentrations were only minimally detected at PND 91, we suspect that these increased fission and fusion reactions may be the result of impaired mitochondrial function due to gestational PFOA exposure (i.e., a programming effect) and would most likely persist into adulthood and beyond.
Several immunotoxic effects have been associated with PFOA-exposures including thymic and splenic atrophy, an attenuated T-lymphocyte response and impaired Immunoglobulin M (IgM) synthesis (Lau 2012; Yang et al. 2002). However, in this study, significant increases in periportal inflammation were observed among the 2 highest PFOA dose groups (1.0 and 0.3 mg/kg) at both PND 91 and PND 21. PFOA, as a known PPARα-agonist, is expected to have anti-inflammatory effects, yet these animals display histological changes consistent with chronic-active inflammation that increases in severity with increasing PFOA dose; findings that may be further suggestive of a PPARα-independent mode of action.
Hepatocellular hypertrophy and increased liver weights are associated with increased incidences of hepatocellular tumors in rodent species. In fact, hepatocellular hypertrophy has been regarded as the single “best-predictor” of liver cancer in mice (Hall et al. 2012). Here, we demonstrate that hepatocellular hypertrophy occurs in CD-1 mice prenatally exposed to low doses of PFOA. Additionally, Filgo et al. (2014) demonstrated a significant dose-dependent increase in hepatocellular adenomas in CD-1 mice exposed under the same dosing paradigm, in a separate study. The mechanism of hypertrophy appears to be independent of PPARα activation, as peroxisome proliferation was not a prominent feature in these mice. Further evidence to suggest a PPARα-independent mode of action for hepatocellular hypertrophy and tumorigenesis is the increased incidence of hepatocellular hypertrophy and liver tumors in our PPARα KO strain (Filgo et al. 2014). Based on our findings, we suggest that alterations in mitochondrial function (fission or fusion) are driving the hypertrophy response, and when prolonged, these events may lead to tumor development later in life. Additional studies are needed to determine the precise mode of action for hepatocellular hypertrophy, mitochondrial proliferation, and subsequent tumor development in mice prenatally exposed to low doses of PFOA.
Footnotes
Acknowledgments
The authors would like to thank Ms. Page Myers and the Comparative Medicine Branch for animal care and training on the PIXImus, Dr. Greg Travlos and Mr. Ralph Wilson for clinical pathology measurements, Ms. Deloris Sutton for transmission electron microscopy (TEM) technical support, Ms. Casey Reed for technical assistance, and Ms. Beth Mahler for photographic editing.
This research was supported (in part) by the Intramural Research Program of the National Institutes of Health (NIH) and National Institute of Environmental Health Sciences (NIEHS).
Author Contribution
Erin Quist contributed to acquisition, analysis, and interpretation, drafted the manuscript, critically revised the manuscript, and agrees to be accountable for all aspects of work ensuring integrity and accuracy. Adam Filgo contributed to acquisition, analysis, and interpretation, drafted the manuscript, critically revised the manuscript, and agrees to be accountable for all aspects of work ensuring integrity and accuracy. Connie Cummings contributed to analysis and interpretation, critically revised the manuscript, and agrees to be accountable for all aspects of work ensuring integrity and accuracy. Grace Kissling contributed to analysis and interpretation, critically revised the manuscript, and agrees to be accountable for all aspects of work ensuring integrity and accuracy. Mark Hoenerhoff agrees to be accountable for all aspects of work ensuring integrity and accuracy. Sue Fenton contributed to conception and design, contributed to acquisition, analysis, and interpretation, drafted the manuscript, critically revised the manuscript, gave final approval, and agrees to be accountable for all aspects of work ensuring integrity and accuracy.
The author(s) declared no potential conflicts of interest with respect to the research, authorship, and/or publication of this article.
The author(s) disclosed receipt of the following financial support for the research, authorship, and/or publication of this article: E.Q. and A.F. are funded by an Intramural Research Training Award, NIEHS, NIH.
Abbreviations
References
Supplementary Material
Please find the following supplemental material available below.
For Open Access articles published under a Creative Commons License, all supplemental material carries the same license as the article it is associated with.
For non-Open Access articles published, all supplemental material carries a non-exclusive license, and permission requests for re-use of supplemental material or any part of supplemental material shall be sent directly to the copyright owner as specified in the copyright notice associated with the article.