
Abstract
Peroxisome proliferator (PP)–activated receptor-α (PPARα) agonists exhibit species-specific effects on livers of the rodent and human (h), which has been considered to reside in the difference of PPARα gene structures. However, the contribution of h-hepatocytes (heps) to the species-specificity remains to be clarified. In this study, the effects of fenofibrate were investigated using a hepatocyte-humanized chimeric mouse (m) model whose livers were replaced with h-heps at >70%. Fenofibrate induced hepatocellular hypertrophy, cell proliferation, and peroxisome proliferation in livers of severe combined immunodeficiency (SCID) mice, but not in the h-hep of chimeric mouse livers. Fenofibrate increased the expression of the enzymes of β- and ω-hydroxylation and deoxygenation of lipids at both gene and protein levels in SCID mouse livers, but not in the h-heps of chimeric mouse livers, supporting the studies with h-PPARα-transgenic mice, a hitherto reliable model for studying the regulation of h-PPARα in the h-liver in most respects, except the induction of the peroxisome proliferation. This study indicates the importance of not only h-PPARα gene but also h-heps themselves to correctly predict effects of fibrates on h-livers, and, therefore, suggests that the chimeric mouse is a currently available, consistent, and reliable model to obtain pharmaceutical data concerning the effects of fibrates on h-livers.
Introduction
Peroxisome proliferators (PPs) constitute a group of chemicals with many applications in health and industry (Pyper et al. 2012). The PP–activated receptor-α (PPARα), a ligand–activated nuclear receptor, plays a central role in the uptake and β-oxidation of fatty acids, especially in the liver (Pyper et al. 2012; Fidaleo 2009). Stimulation of PPARα causes an increase in the transcription of genes related to fatty acid transport across the cell membrane, intracellular lipid trafficking, mitochondrial and peroxisomal fatty acid uptake, and both mitochondrial and peroxisomal fatty acid β-oxidation (Pyper et al. 2012; Fidaleo 2009). Administration of these agents to rodents (rats and mice) not only enhances the expression of fatty acid–metabolizing enzymes but also causes hepatic peroxisome proliferation and the development of hepatocellular carcinomas (Pyper et al. 2012; Fidaleo 2009). Although not fully understood, the mechanism of PPARα-induced rodent hepatocarcinogenesis is thought to involve increased oxidant production, increased cell proliferation, and suppressed apoptosis, and the PP-response has served as an early marker of carcinogenesis in these studies (Pyper et al. 2012; Fidaleo 2009).
Fibrates such as ciprofibrate and fenofibrate are PPARα agonists that have been in clinical use for many decades and are generally considered safe. However, conclusion about the potential of PPARα-agonists to induce human cancers cannot be made from the epidemiologic data available for fibrate drugs (Guyton et al. 2009). Studies assessing the ability of fibrates to cause human liver peroxisome proliferation in vivo using liver biopsy samples from patients receiving therapeutic doses of PPARα agonists showed no increase in peroxisomes (Gariot et al. 1983; Blümcke et al. 1983). In vitro studies of peroxisomal enzyme activity revealed that a PPARα agonist, such as Wy-14,643, induced acyl-CoA oxidase (Acox) in isolated rat hepatocytes; however, treatment with the PPARα agonist did not stimulate peroxisomal enzyme activity in purified human hepatocytes (h-heps; Ammerschlaeger et al. 2004). These results suggest that isolated hepatocytes are useful for the evaluation of interspecies differences in PPARα-mediated effects. However, in another study, increased DNA synthesis, a primary reaction of rodent livers to PPARα agonists in vivo, was not observed in purified rat parenchymal cells in vitro because of the removal of nonparenchymal Kupffer cells (Parzefall et al. 2001). Thus, the results of in vitro hepatocyte experiments should be cautiously interpreted when extrapolating them to in vivo situations. In addition to the difference in the effects of the agonists between in vivo and in vitro studies, species differences in PPARα-associated signaling between rodents and humans have been generally recognized among researchers (Tachibana et al. 2008; Yoshizato et al. 2009), making it difficult to determine whether PPARα agonists induce the proliferation of peroxisomes and result in hepatic diseases in humans. The mechanism underlying the species-specific influence of PPARα agonists is not fully understood due to the lack of appropriate animal models for the human liver.
The species difference in PP response between rodents and humans has been a target of intensive studies (Gonzalez and Shah 2008). To investigate the molecular mechanisms related to this species difference, a PPARα-gene humanized mouse line was generated in which h-PPARα cDNA was specifically expressed in the liver under the control of the tetracycline responsive regulatory system (Cheung et al. 2004; Morimura et al. 2006). Studies using these transgenic mice clearly showed that the species difference is explainable by the difference at the PPARα gene level: both h-PPARα and m-PPARα are functional in the regulations of genes related to peroxisomal and mitochondrial fatty acid–metabolizing enzymes, but not in those related to hepatocyte proliferation, and concluded that structural differences between h- and m-PPARα are responsible for the differential susceptibility to PP-induced hepatocarcinogenesis. To strengthen this implication, the same research group generated other types of h-PPARgene-bearing m-PPARα-null mouse in which h-PPARα gene sequences including promoter regions were expressed (Yang et al. 2008). When treated with fenofibrate, these mice showed similar responses to the wild-type mice in tissues with high fatty acid catabolism, such as liver and kidney, including peroxisome proliferation as well as decrease in serum triglycerides and induction of PPARα target genes encoding enzymes for fatty acid–metabolism, but fibrates did not cause significant hepatomegaly and hepatocyte proliferation contrasting with the wild-type mice. Thus, it can be said that, first, h-PPARα gene is functional in the m-hepatocytes in regard to the regulation of fatty acid–metabolism, and, second, there are inherent differences in the PPARα gene–regulated signaling system responsive for the hepatocyte proliferation between mice and humans, and these differences are causes of the observed species specificity of PPs. As a whole, it appears that this hPPARα gene-bearing PPARα-null mouse is an appropriate model to study responses of h-liver to the PPs except in regard to the induction of the peroxisome proliferation. As noted by the authors of the cited study, m-hepatocytes bearing h-PPARα gene induced the proliferation of their peroxisomes. However, peroxisome proliferation is not seen in the liver of patients receiving fibrate drugs (Peters, Cheung, and Gonzalez 2005). This finding indicates that h-PPARα gene cannot reproduce the phenomenon of fibrate-dependency of peroxisome proliferation in the m-hepatocyte’s environment.
Recently, chimeric mice having humanized livers have been generated by transplanting h-heps into albumin enhancer–driven urokinase-type plasminogen activator transgenic/severe combined immunodeficiency (uPA/SCID) mice, which show liver disease caused by overexpression of uPA in m-heps and immunodeficiency by lack of T- and B-cells (Mercer et al. 2001; Tateno et al. 2004). The host hepatocytes of the chimeric mice can be replaced with h-heps at a repopulation rate of >70% (Tateno et al. 2004) and are useful tools for the study of human metabolism (Katoh et al. 2004) and infection with hepatitis B virus (HBV) and hepatitis C virus (HCV; Umehara et al. 2006; Tsuge et al. 2005). We also reported that oral administration of a PPARα agonist, bezafibrate, induced human MDR3 protein expression level in the chimeric mouse liver and its redistribution in the bile canaliculi. Moreover, the modulatory effects of bezafibrate on key factors involved in hepatic cholesterol and bile acid–metabolism in human subjects were traced in the humanized livers of bezafibrate-treated chimeric mice, showing the chimeric mice can be utilized to predict the effects of PPARα agonists on the human liver (Shoda et al. 2007).
In this study, we experimentally addressed the in vivo effect of fibrates on peroxisome proliferation and the growth of h-heps in chimeric mice, using histochemistry, real-time quantitative reverse transcription polymerase chain reaction (qRT-PCR), and proteomics. As a result, we were able to confirm the generally recognized species-specific influence of PPARα agonists, thus supporting the notion that rodent data on PPARα-induced hepatocarcinogenesis cannot be accurately extrapolated to human data. Based on this study, we propose that the chimeric mouse is an appropriate model for studying PPARα-associated signaling in the human liver.
Materials and Method
Animals and Transplantation of Hepatocytes
This study was performed with the ethical approval of PhoenixBio Co., Ltd., and the Hiroshima Prefectural Institute of Industrial Science and Technology Ethics Board. Male SCID mice (uPA wt/wt/SCID mice, PhoenixBio Co., Ltd., Higashihiroshima, Japan) were used as controls. Chimeric mice with humanized livers were produced at PhoenixBio Co. Ltd., as reported previously (Tateno et al. 2004). Briefly, cryopreserved h-heps from a 9-month-old Caucasian boy (9MM; Celsis In Vitro Technologies, Baltimore, MD), a 4-yearr-old Caucasian girl (4YF) or a 6-year-old African-American girl (6YF; BD Biosciences Discovery Labware, San Jose, CA, USA) were thawed, and viable hepatocytes (7.5−10.0 × 10⁵) were transplanted into homozygous 2- to 4-week-old uPA/SCID mice via the spleen. To determine the extent of replacement with h-heps, blood (2 μl) was collected weekly from the tail vein of the chimeric mice 3 weeks after transplantation, and the concentration of human albumin (h-alb) was determined by a latex agglutination immunoassay, using the “EIKEN” Alb-II LX reagent (EIKEN Chemical Co., Ltd., Tokyo, Japan). The correct replacement index (RI, the ratio of h-heps to the total hepatocytes) in a fixed area of liver tissue in histological sections was determined by immmunostaining for h-cytokeratin 8/18 (h-CK8/18) as previously described (Tateno et al. 2004) or calculated by a formula using blood h-alb levels (Table 1). The RI values are respectively shown in Table 1 for each of chimeric mice.
Chimeric mice used in this study.
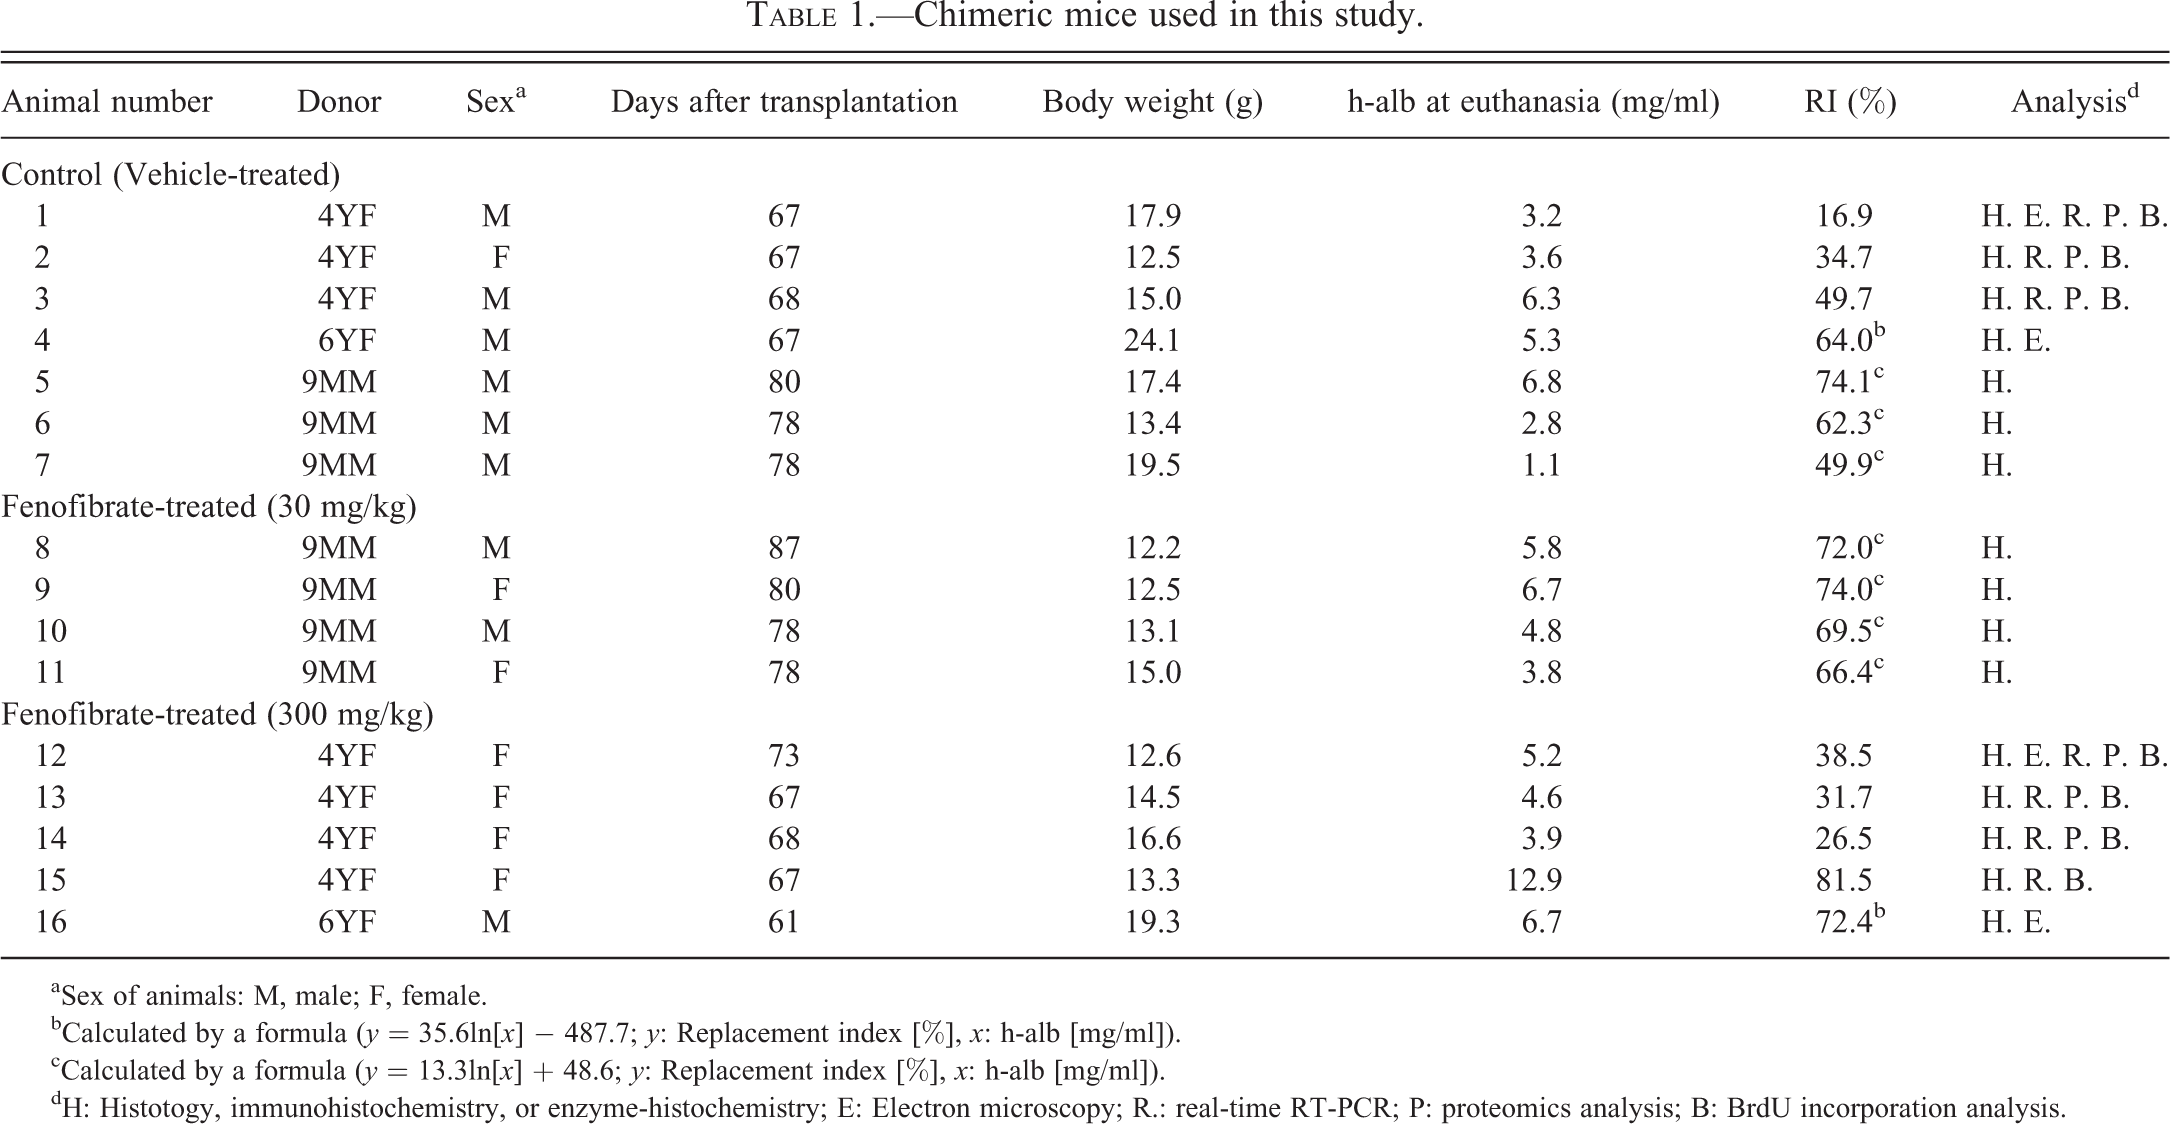
aSex of animals: M, male; F, female.
bCalculated by a formula (y = 35.6ln[x] − 487.7; y: Replacement index [%], x: h-alb [mg/ml]).
cCalculated by a formula (y = 13.3ln[x] + 48.6; y: Replacement index [%], x: h-alb [mg/ml]).
dH: Histotogy, immunohistochemistry, or enzyme-histochemistry; E: Electron microscopy; R.: real-time RT-PCR; P: proteomics analysis; B: BrdU incorporation analysis.
Administration of Fenofibrate to SCID and Chimeric Mice
The dosage levels for fenofibrate (Sigma, St. Louis, MO) were set according to a previously published study (Cattley et al. 1998). Fenofibrate was dissolved in 0.5% hydroxypropyl methylcellulose (Shinestu Kagaku Kogyo, Japan) and administered orally once per day for 4 days to male SCID mice (13–17 weeks old, body weight: 22.1–28.7 g) at the following concentrations: 0 (vehicle-treated, n = 4), 30 (n = 3), 100 (n = 3), or 300 (n = 4) mg/kg of body weight (10 ml/kg b.w.). The following doses of fenofibrate were administered to chimeric mice (12 to 15 weeks old: body weight: 12.2–24.1 g) 67 through 87 days after transplantation of h-heps: 0 (n = 7), 30 (n = 4), or 300 (n = 5) mg/kg of body weight (Table 1).
The mice were euthanized under anesthesia 24 hr after the final injection of fenofibrate at 4 days postadministration. To determine cell growth stimuli of fenofibrate, S-phase analysis was performed by determining the percentage of bromodeoxiuridine (BrdU)-incorporated cells. The mice for the S-phase analysis were given BrdU 1 hr before euthanasia. Protein and genetic analyses were performed on the regions of the chimeric mouse liver that were occupied by m-hep and h-hep cells. The h-hep and m-hep regions were separated from each liver specimen with a razor blade. Whitish areas were composed of m-heps. Red nodules were distributed sporadically in the chimeric mouse liver, which were colonies of transgene-deleted proliferating host hepatocytes. The h-hep region showed an intermediate color between the whitish areas and the red nodules (Tateno et al. 2004). The h-hep regions and the whitish m-hep regions were collected and used for histopathologic examinations. The red m-hep regions were not used in this study.
Cytochemistry and Immunohistochemistry
Liver slices were frozen in liquid nitrogen or fixed in buffered formaldehyde. For cytochemical localization of catalase (CAT), frozen sections (10 μm) were stained for CAT as described previously (Novikoff et al. 1969). To identify h-heps in the chimeric mouse livers, frozen sections (5 μm) were fixed in acetone and incubated with anti-h-CK8/18 antibodies (Supplemental Table 1). Immunoreactivity for h-CK8/18 was visualized with peroxidase- and dextran-conjugated anti-mouse immunoglobulin (Dako Envision+, DAKO Cytomation, Glostrup, Denmark) using 3,3′-diaminobenzidine tetrahydrochloride (DAB) as a substrate. The sections were counterstained with hematoxylin. The RI was calculated as follows: frozen sections were prepared from 5 of the 7 liver lobes, and immunostained with human CK8/18 antibodies and visualized with DAB. Total examined areas and brown colored areas (human hepatocyte areas) of each section were measured using a BZ-II analyzer (Keyence, Tokyo, Japan), and the ratio of human hepatocyte areas to total areas (RI) was calculated (Tateno et al. 2004).
Immunostaining for h-alb, human cytochrome P450 (h-CYP4A11), and BrdU was performed using 3-μm-thick paraffin sections with anti-h-alb antibodies, h-CYP4A11 antibody and BrdU antibodies (Supplemental Table 1), with a VECTAMIN® ABC kit (VECTOR Laboratories, Burlingame, CA) and DAB to visualize the reaction products. The sections immunostained with h-alb and h-CYP4A11 were counterstained with hematoxylin. The anti-h-CYP4A11 antibody cross-reacts with m- and h-CYP4A proteins. For BrdU-staining, the sections were double-stained with h-alb and BrdU and were counterstained with hematoxylin and eosin (H&E). BrdU-positive hepatocytes and all of the hepatocytes were counted on 8 filds of microphotographs for each mouse (×20), and the BrdU-labeling index was calculated.
Electron Microscopy
Small pieces of the liver were fixed with 2.5% glutaraldehyde in 0.2 M phosphate buffer (pH 7.4), post-fixed in osmium tetroxide, and embedded in epoxy resin blocks. Ultrathin sections were stained with uranyl acetate and lead citrate. The samples were subjected to electron microscopic examination using a Hitachi H-7500 electron microscope (Hitachi High-Technologies Corporation, Japan).
Real-Time qRT-PCR
The liver blocks were immersed in RNA LaterTM (QIAGEN®, Valencia, CA), frozen in liquid nitrogen, and stored at −80°C until use. Total RNA was extracted from the blocks using TRIzol reagent (Gibco BRL, Grand Island, NY). RT and PCR were performed using an RT-PCR Kit (QIAGEN® OneStep RT-PCR Kit, QIAGEN, Valencia, CA) according to the manufacturer’s protocol. The SYBR Green PCR master mix (QIAGEN) was used for real-time qPCR analysis using a thermal cycler (ABI PRISM 7700 sequence detection system, Foster City, CA). Gene expression was first normalized to glyceraldehyde 3-phosphate dehydrogenase (GAPDH) for each sample, and then the relative differences between the control and treated groups were calculated and expressed as relative increases, setting the control as 1. The genes and their primer sequences are listed in Supplemental Table 2. The liver blocks contained h-heps and m-heps. But it was confirmed that murine gene–specific primers were capable of amplifying the gene products from the extracted RNA from the m-liver but not from the h-liver, and the human gene–specific primers reacted with the purified RNA from the h-liver but not from m-liver. The cycling conditions consisted of a single incubation step at 50°C for 2 min and subsequent heating to 95°C for 10 min, followed by 40 cycles of 15 sec at 95°C and 60 sec at 55°C.
Proteins differently expressed after fenofibrate treatment.
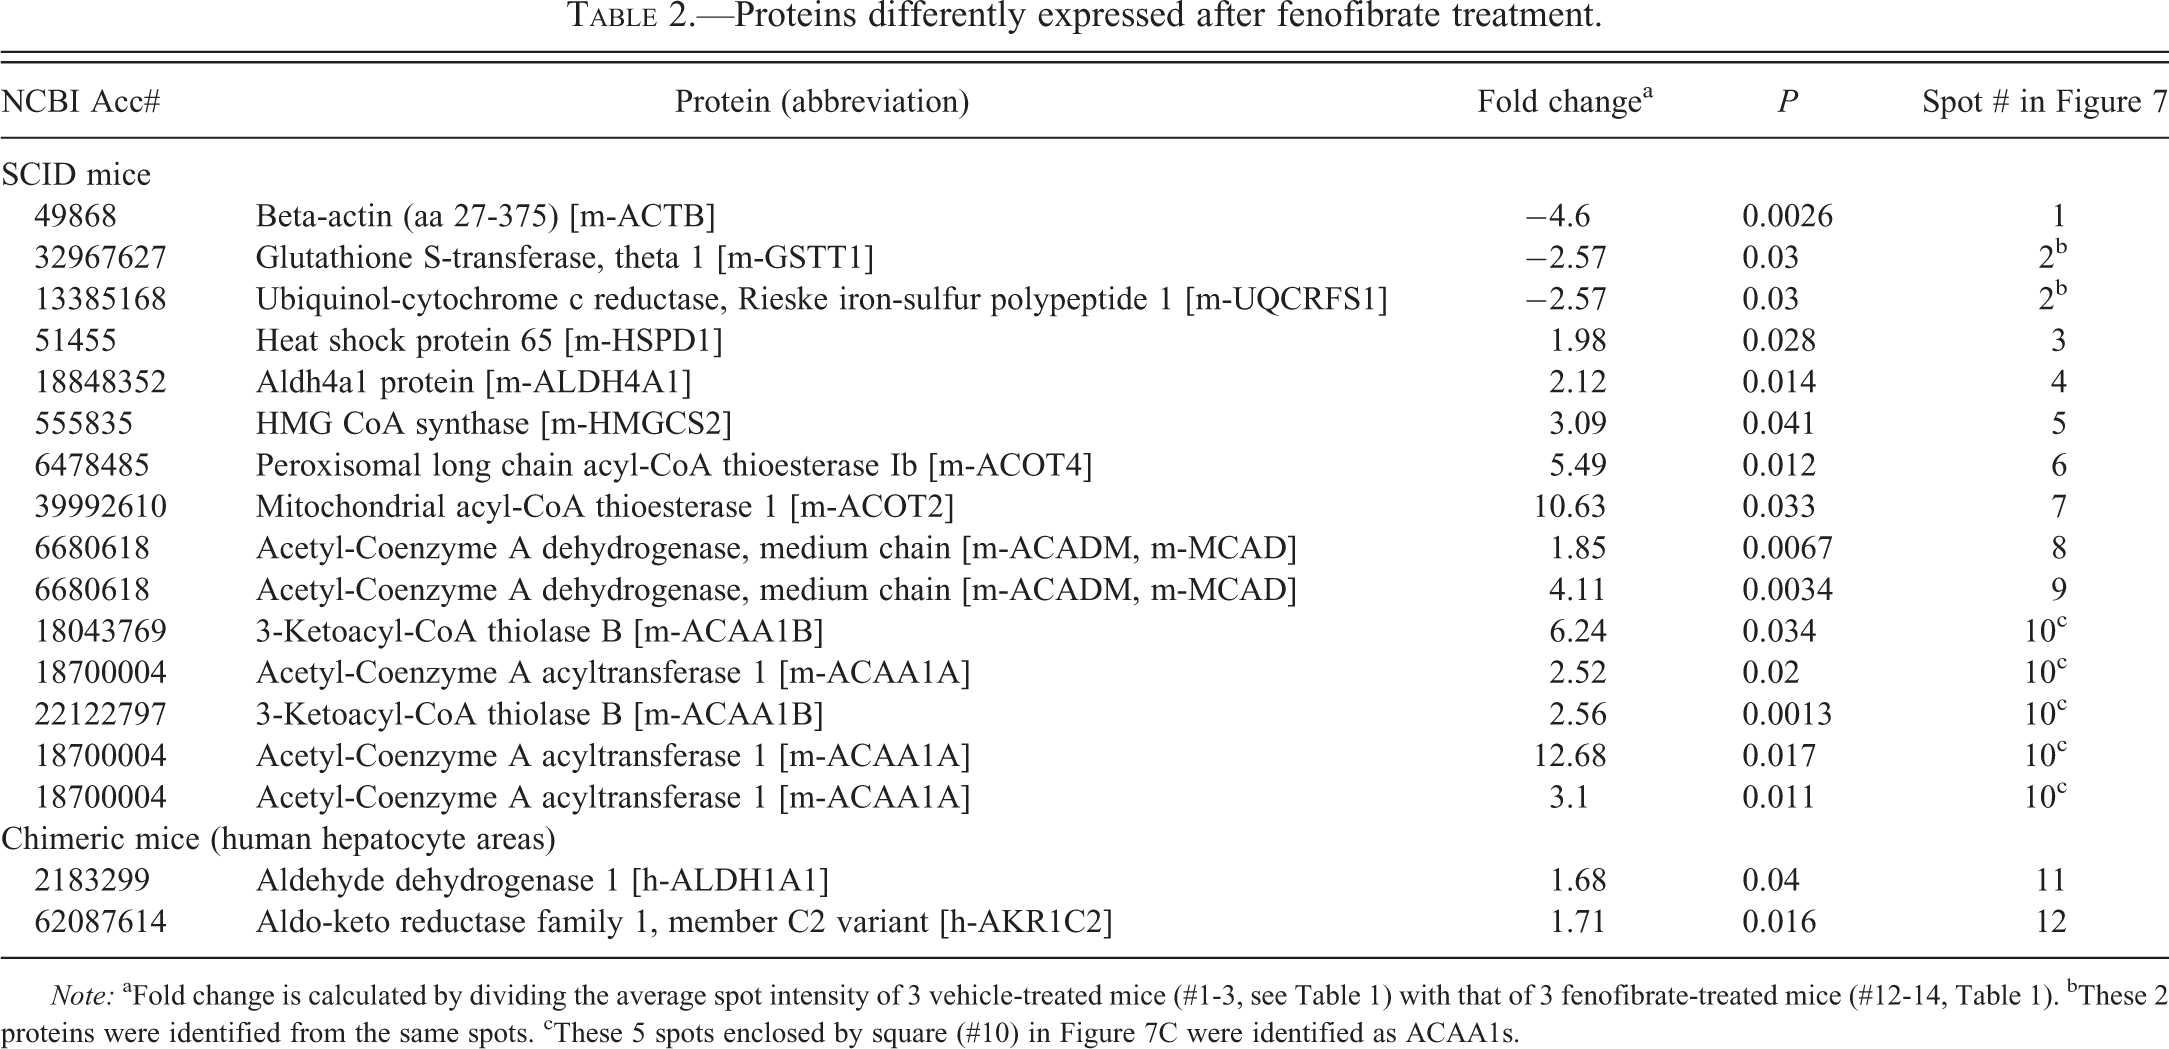
Note: aFold change is calculated by dividing the average spot intensity of 3 vehicle-treated mice (#1-3, see Table 1) with that of 3 fenofibrate-treated mice (#12-14, Table 1). bThese 2 proteins were identified from the same spots. cThese 5 spots enclosed by square (#10) in Figure 7C were identified as ACAA1s.
Two-dimensional Polyacrylamide Gel Electrophoresis (2-D PAGE) and Mass Spectrometric Identification of Proteins
Liver tissues were dissected from h-hep areas of chimeric mice and SCID mice and homogenized with 5 volumes of lysis buffer (5 M urea, 2 M thiourea, 2% CHAPS, 2% SB3-10, 1% dithiothreitol, and 2% ampholine). The protein concentrations of the homogenates were measured with a protein assay system (Bio-Rad). The samples (100 μg of total protein per sample) were subjected to 2-D PAGE, with an isoelectric focusing range of 3 to 10, as the first dimension and to SDS-PAGE in 9% to 18% acrylamide gradient gels as the second dimension, according to the previous work (Kristensen et al. 2000).
Spots were excised from the gels using clean scalpels and digested with trypsin for identification by mass spectrometry using an Ultraflex TOF/TOF mass spectrometer (Bruker Daltonics, K.K., Yokohama, Japan; Yamagata et al. 2002).
Statistical Analysis
The data were analyzed with the SAS Pre-Clinical Package version 4.1 (SAS Institute, Inc., Cary, NC). The results are expressed as the M ± SD; the difference between the 2 groups was analyzed using Student’s t-test when the data were normally distributed; otherwise, differences were analyzed using Welch’s t-test.
Results
Histological Changes in Fenofibrate-treated Livers
The livers from SCID groups were histologically examined on H&E-stained sections. Central hypertrophy in the liver lobules and eosinophilic granular changes were observed in mice treated with 30-, 100-, and 300-mg/kg of fenofibrate compared with vehicle-treated SCID mice (SCID/vehicle); these changes were most prominent at 300 mg/kg fenofibrate (Figure 1A and B). The eosinophilic hepatocytes contained small granular structures (Figure 1B, inset), representing peroxisomes. Step sections are shown for the livers of the chimeric mouse group. As reported previously, the livers of chimeric mice are composed of 2 regions: degenerating m-hep regions (white area) and healthy h-hep regions (Tateno et al. 2004), which are easily recognizable on H&E-stained sections due to the difference in their apparent cytoplasmic density. The cytoplasm of the hepatocytes in the h-hep regions was sparse compared to that of the hepatocytes in m-hep regions in both the m-heps from vehicle-treated chimeric (Chimera/vehicle; Figure 2A) and the m-heps from fenofibrate-treated chimeric (Chimera/fenofibrate) groups (Figure 2B). The cytoplasmic rarefaction is known to be a reflection of the active glycogen deposition (Tateno et al. 2004). The m- and h-hep regions were also confirmed by immunohistochemically staining serial sections for h-alb (Figure 2C and D). Similar to the hepatocytes from the fenofibrate-treated SCID (SCID/fenofibrate) mouse group, the m-hep regions but not the h-hep regions exhibited hepatocellular hypertrophy and granular eosinophilic changes in the fenofibrate-treated chimeric mouse liver (Figure 2B).
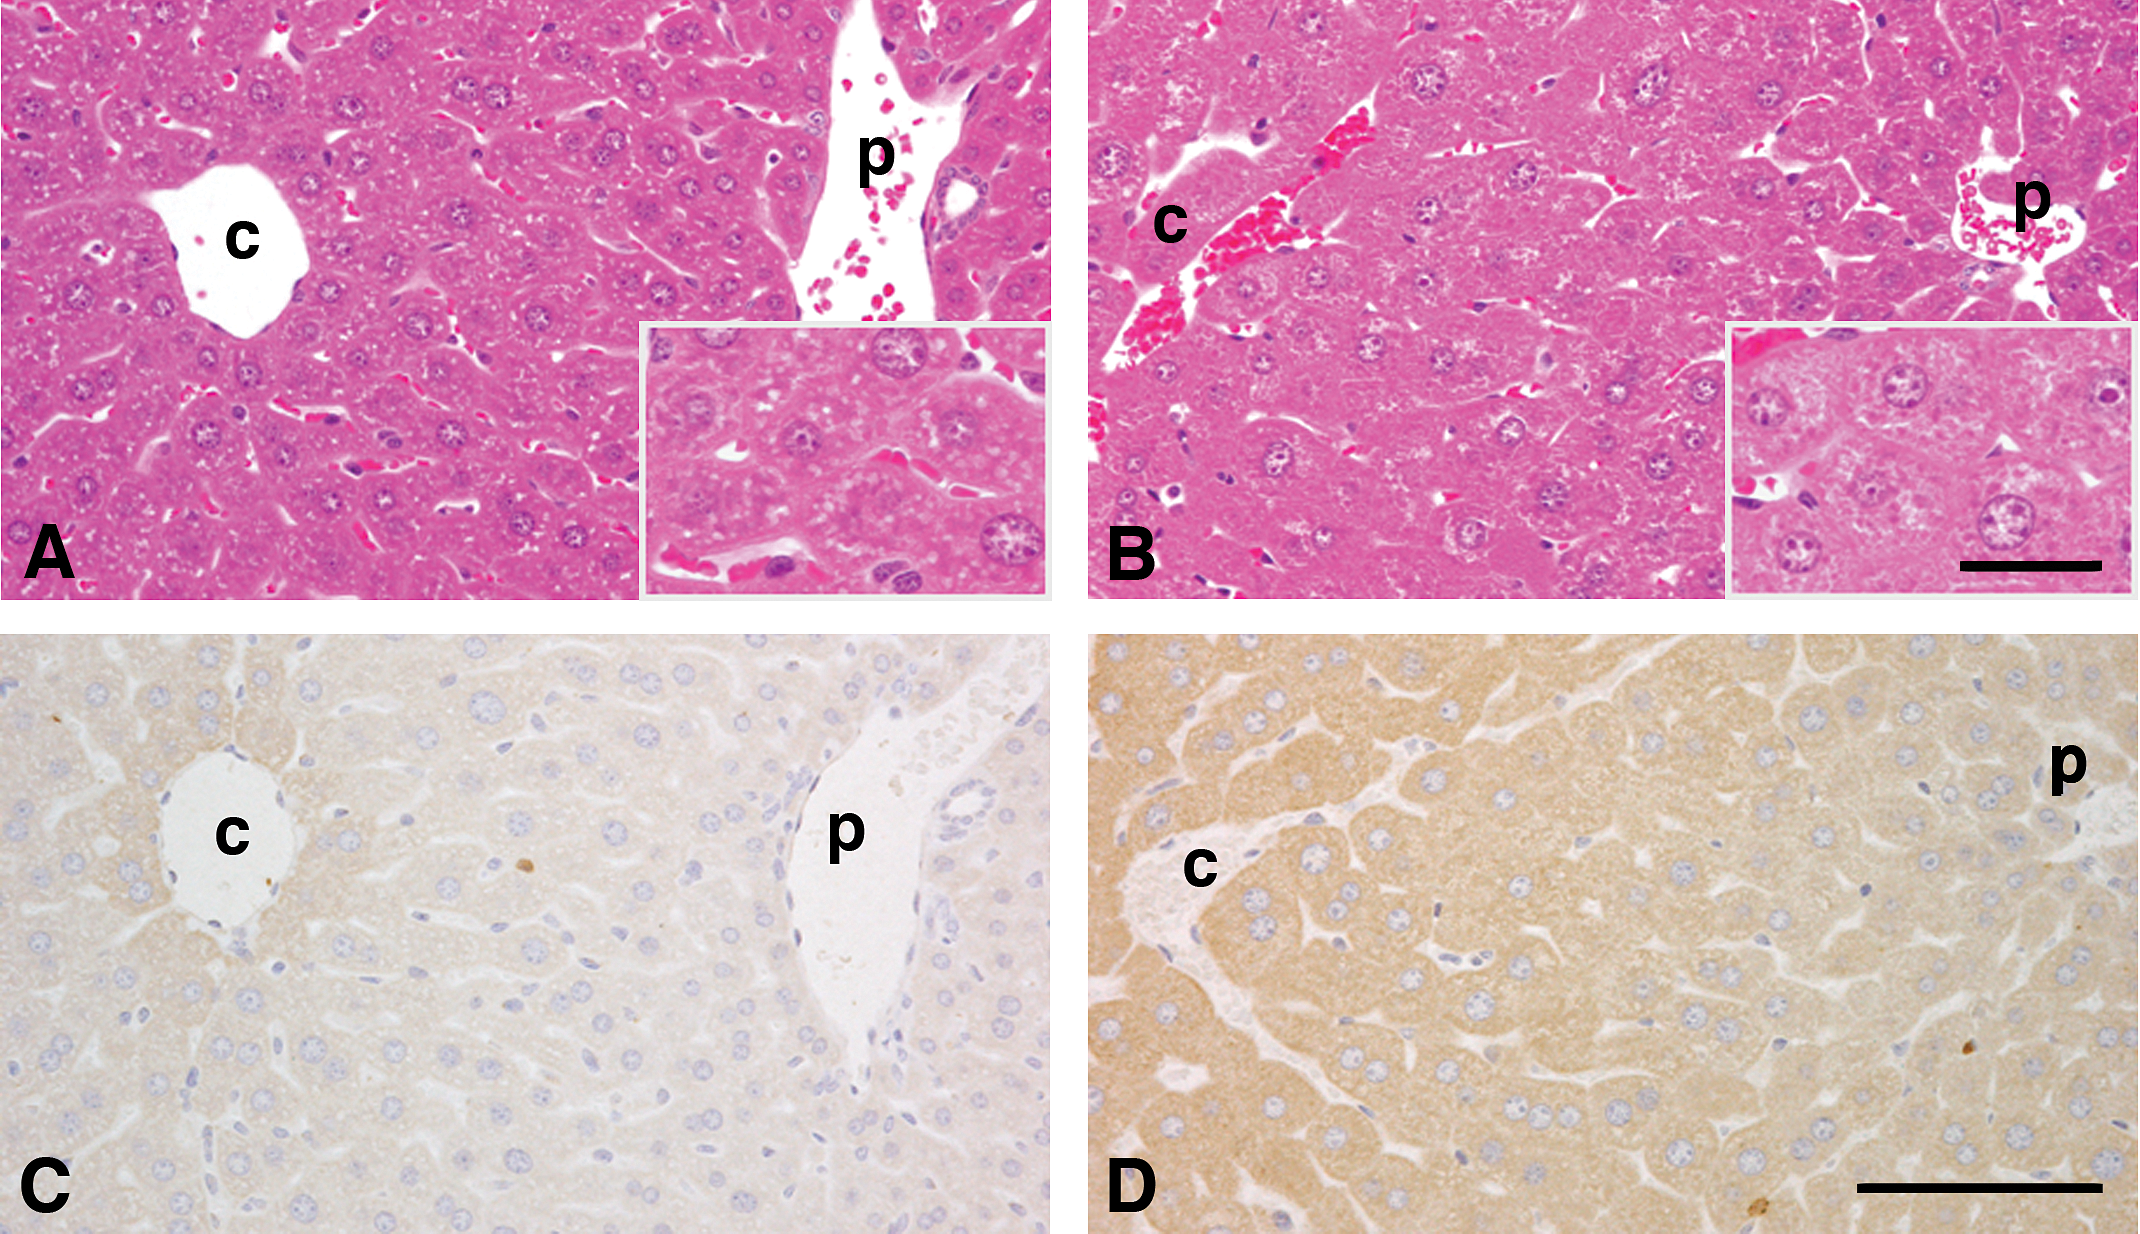
Alterations in histopathological features and CYP4A protein expression of SCID mouse following treatment with 300 mg/kg body weight of fenofibrate. Histological sections were prepared from SCID/vehicle (A and C) and SCID/fenofibrate (B and D) mouse livers and stained with H&E (A and B) or immunostained for CYP4A (C and D). Hepatocytes in the centrilobular regions of the fenofibrate-treated SCID mouse livers (B) were hypertrophic and eosinophilic compared with those of the controls (A). CYP4A immuno-reactivity was enhanced in fenofibrate-treated SCID mouse livers around the central vein (D), compared with the controls (C). “A and C” and “B and D” were from serial sections of SCID/vehicle and SCID/fenofibrate mouse livers, respectively. The insets in A and B are enlarged photos for the areas on A and B, respectively. c: central vein; p: periportal vein; Bar: 100 μm. Inset Bar: 25 μm.
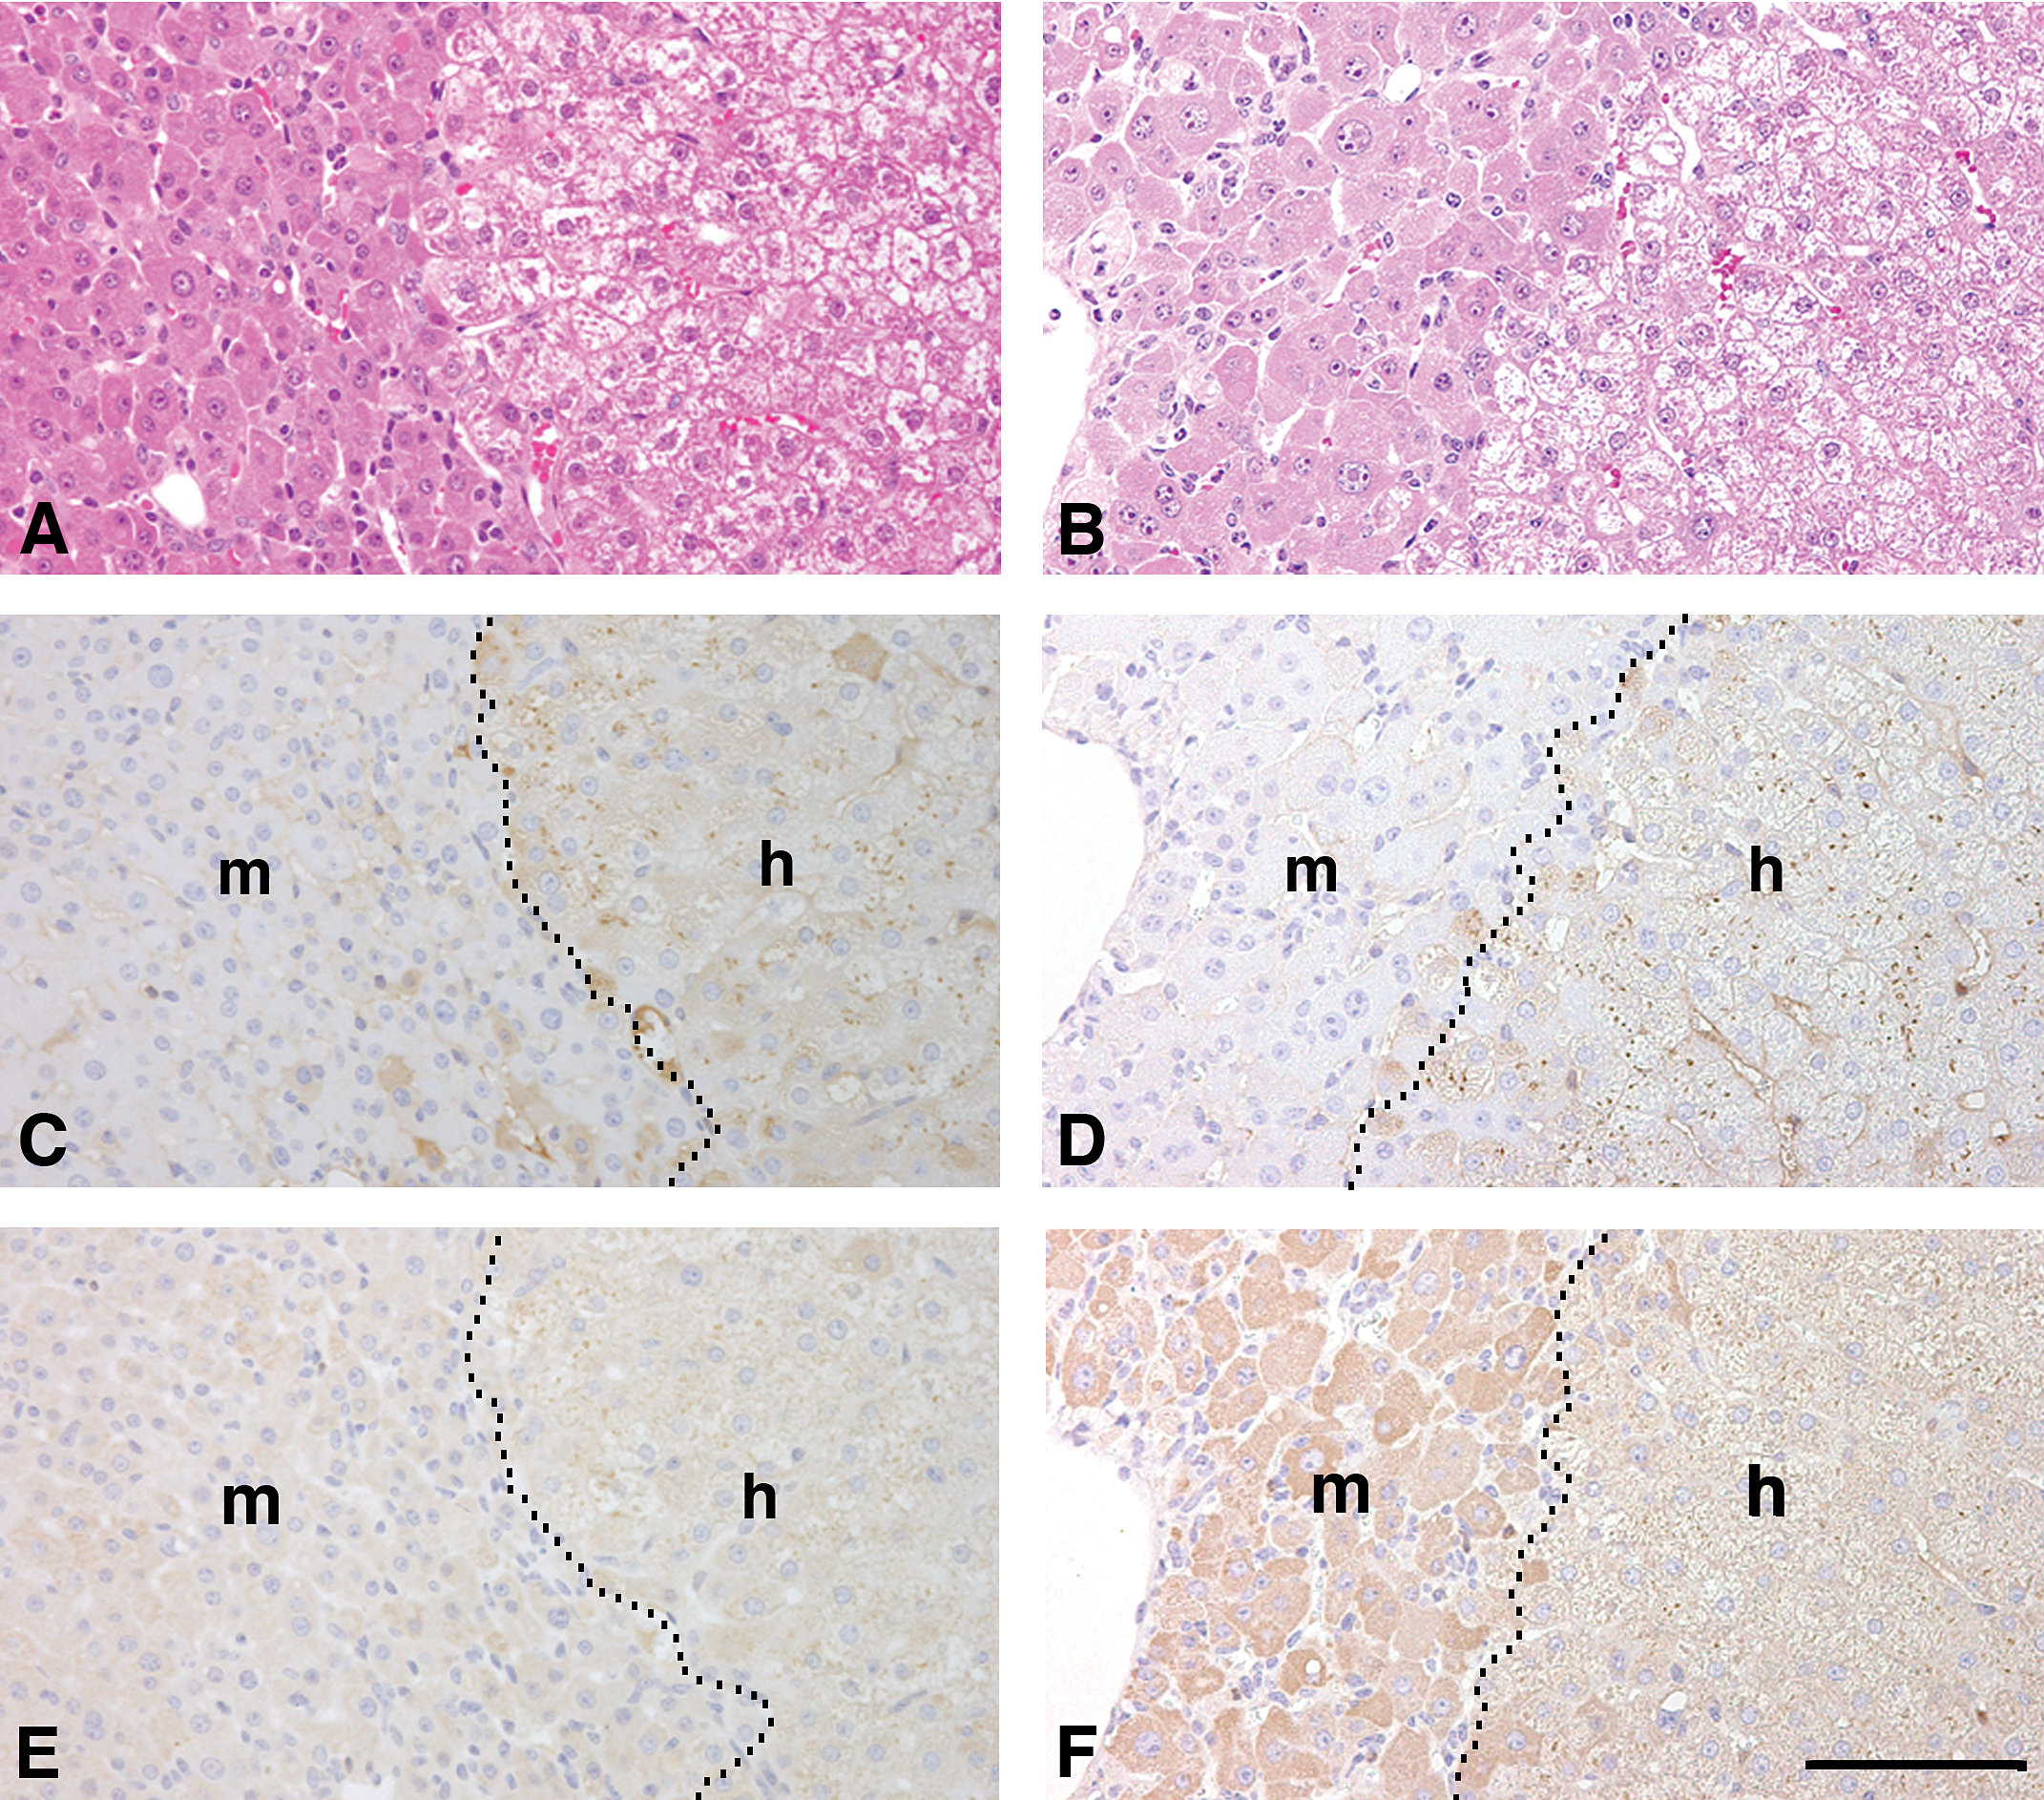
Alterations in histopathological features and CYP4A protein expression of chimeric mouse livers following treatment with 300 mg/kg body weight of fenofibrate. Histological sections were prepared from Chimera/vehicle (A, C, and E) and Chimera/fenofibrate (300 mg/kg body weight, B, D, and F) mouse livers and used for H&E staining (A and B), h-alb immunostaining (C and D), and CYP4A immunostaining (E and F). The h-Alb-positive (brown-colored) areas represent h-hep regions and the h-alb-negative areas indicate m-hep regions. H&E staining showed that the corresponding region of h-alb-positive cells had apparently rarefied cytoplasm, irrespective of fenofibrate treatment (A and B). Fenofibrate enhanced the intensity of CYP4A-staining reactivity in m-heps but not in h-heps (F) in chimeric mouse livers. The boundaries between the h- (h) and m-hep (m) regions are indicated by dashed lines in C, D, E, and F. “A, C, and E” and “B, D, and F” were from the same serial sections of Chimera/vehicle and Chimera/fenofibrate mouse livers, respectively. Bar: 100 μm.
CYP4A is a microsomal ω-hydroxylation/oxidation enzyme and is known to be highly inducible by PPs (Kroetz et al. 1998). Therefore, we semiquantitatively assessed the effects of fenofibrate on the expression of this enzyme using immunohistochemical analyses. As shown in Figure 1C and D, hepatocytes in SCID/fenofibrate exhibited stronger immunostaining for CYP4A than those in SCID/vehicle mice. Similarly, Chimera/fenofibrate expressed a higher level of immunoreactivity for this enzyme than Chimera/vehicle in m-heps (Figure 2F vs. E). However, as expected, there were no differences between the staining intensity in the h-heps from Chimera/fenofibrate and Chimera/vehicle mice (Figure 2F vs. E). These results strongly suggest that fenofibrate increases the microsomal ω-oxidation activity only in m-heps. It is possible that fenofibrate increases the generation of hydrogen peroxidase in m-heps by increasing CYP4A enzyme activity.
We examined the possibility that the small eosinophilic granular structures observed in the hepatocytes from both SCID/fenofibrate mice and in the m-heps from Chimera/fenofibrate mice were fenofibrate-induced peroxisomes. Histological sections were prepared and cytochemically stained for CAT, a marker of peroxisomes. Strongly CAT-positive structures were seen as brown-colored granules in the hepatocytes of SCID/fenofibrate mice treated with 30-, 100- (data not shown), and 300-mg/kg fenofibrate (Figure 3B), but histochemistry was of mild intensity in the SCID/vehicle mouse liver (Figure 3A). These results led us to conclude that the eosinophilic granular structures observed on H&E sections are peroxisomes. In this experiment, h-hep regions were identified in the chimeric mouse liver sections by immunohistochemical staining for h-CK8/18 (Figure 3C and D). As expected, h-CK8/18-negative m-hepatocyte regions in the Chimera/fenofibrate liver contained prominent CAT-positive granules at doses of 30- (data not shown) and 300-mg/kg fenofibrate, but h-CK8/18-positive h-hepatocyte regions did not (Figure 3F).
Identification of peroxisomes as CAT-positive entities in m-heps. Histological sections were prepared from SCID/vehicle (A) and SCID/fenofibrate (B), Chimera/vehicle (C and E) and Chimera/fenofibrate mouse livers (D and F). Fenofibrate was given at 300 mg/kg body weight. Brown-colored spots observed in the hepatocyte cytoplasm represent CAT-positive entities (peroxisomes). Fenofibrate treatment greatly enhanced CAT-positivity in the SCID mouse livers (B). Immunostaining with anti-h-CK8/18 antibodies in Chimera/vehicle (C) and Chimera /fenofibrate mouse livers (D) revealed human (h)- and mouse (m)-hepatocyte regions as the light-brown (positive)- and blue (negative)-colored regions, respectively. The boundaries between human (h) and m-heps (m) regions are indicated by dashed lines. Fenofibrate increased the intensity of CAT-positivity in m-hep regions (m) but not in h-hep regions (h) in chimeric mouse livers (compare F with E). C and D are mutually serial sections of E and F, respectively. The insets in A and B are enlarged photos for the area on A and B, respecitvely. Bar: 50 μm.
These fenofibrate-dependent effects (hepatocellular hypertrophy, increased CYP4A, and proliferation of peroxisomes) in both SCID m-heps and m-heps in chimeric mice strongly suggest that the PPARα agonist stimulated peroxisome proliferation in m-heps. To obtain supportive evidence for this possibility, liver specimens were examined using electron microscopy in Chimera/vehicle mice and Chimera/fenofibrate mice from the 300-mg/kg dosage group. We previously accumulated detailed electron microscopy data on the 3 types of hepatocytes present in the chimeric mouse livers. The h-heps in the medium-colored regions were cells with abundant glycogen and large lipid droplets in the cytoplasm; the original degenerate m-heps in the white regions had abundant small granules (0.1–0.5 μm in diameter), which are small-sized lipid droplets in the cytoplasm; and m-heps in the red regions had normal cellular morphology (Tateno et al. 2013), which were not examined in this study. We utilized these morphological features to identify these 3 hepatocyte types during electron microscopic analysis.
Representative electron microscopic photos of fenobrate-untreated livers are presented in Figure 4: m-heps in the livers of SCID/vehicle mice (Figure 4A); Chimera/vehicle mice (Figure 4C); and h-heps in the livers of Chimera/vehicle mice (Figure 4E). The hepatocytes in these animals contained some peroxisomes in their cytoplasm. Fenofibrate treatment (300 mg/kg) robustly increased the number of peroxisomes in the cytoplasm of hepatocytes in the livers of SCID/fenofibrate mice (Figure 4B) and m-heps in Chimera/fenofibrate mice (Figure 4D), but not in the cytoplasm of h-heps from Chimera/fenofibrate mice (Figure 4F).
Observation of liver tissues by electron microscopy. Specimens from SCID/vehicle (A) and SCID/fenofibrate (B), Chimera/vehicle (C and E), and Chimera/fenofibrate mouse livers (D and F) were analyzed with electron microscopy. Fenofibrate was given at 300 mg/kg body weight. Peroxisomes marked with (*) showed prominent increases in their numbers in SCID/fenofibrate livers (B) and m-hep regions of Chimera/fenofibrate mouse liver (D), but not h-hep regions of the same animal (F). Bar: 1 μm.
These data collectively indicate that fenofibrate induces peroxisome proliferation in the cytoplasm of SCID m-heps and m-heps but not in h-heps. Thus, it was thought that fenofibrate might exhibit pro-proliferative effects like on SCID m-heps and m-heps, but not on h-heps at least in terms of CyclinB1 and CDK1 mRNA expressions. We examined BrdU-labeling indices of hepatocytes in SCID and chimeric mice under the influence of fenofibrate and mainly compared them between SCID m-heps and h-heps in chimeric mice. The data from m-heps in chimeric mice were also obtained, but utilized as a reference, because a publication demonstrating that the BrdU-labeling index was not necessarily a reliable measure for hepatocytes’ proliferative activity in the degenerating uPA/SCID mouse liver. (Sandgren et al. 1991). Four groups of animals, SCID/vehicle (n = 3), SCID/fenafibrate (n = 3), Chimera/vehicle (#1–3, Table 1), and Chimera/fenofibrate (300 mg/kg; #12 to 15, Table 1), were given BrdU for the last 1 hr prior to euthanasia. BrdU-positive hepatocytes were counted in hepatocytes from SCID/vehicle and SCID/fenofibrate mice and h-heps from Chimera/vehicle and Chimera/fenofibrate mice using the immunohistological sections (Figure 5). The images shown in Figure 5A and B clearly demonstrate a higher labeling index for BrdU in hepatocytes from SCID/fenofibrate mice than in SCID/vehicle mice. There was no such difference in h-heps between Chimera/vehicle and Chimera/fenofibrate mice (Figure 5C and D). BrdU-labeling indices, calculated from these photos, were as follows: SCID/vehicle: 0.14 ± 0.19%; SCID/fenofibrate: 0.96 ± 0.16 %; Chimera (h-heps)/vehicle: 0.21 ± 0.16%; and Chimera (h-heps)/fenofibrate: 0.05 ± 0.08% (Figure 5E). Comparisons between the groups showed a statistically significant difference between SCID/vehicle and SCID/fenofibrate mice (p < .005), but no difference between Chimera/vehicle and Chimera/fenofibrate groups, which confirms the hypothesis that fenofibrate treatment increased the BrdU-labeling index only in hepatocytes of SCID mouse livers. BrdU-incorporation of m-heps in Chimera/vehicle and Chimera/fenofibrate were 1.51 ± 0.56% and 1.13 ± 0.66%, respectively, which were higher than SCID mice and h-heps in the chimeric mice, and there was no difference between Chimera/vehicle and Chimera/fenofibrate. We consider that the degenerating m-heps in our model mouse have disorders in cell proliferation, because it was reported that BrdU incorporation is lower in degenerating m-heps than in normalized m-heps during regeneration (Sandgren et al. 1991). Based upon this consideration, we prefer to the notion that the cause of the appearance of the enlarged hepatocytes after 12 to 15 weeks of transplantation is the mitotic disorders, although the possibility remains that the appearance is age-related. Taken together, we considered that the m-heps were not appropriate for determination of cell growth capacity.
BrdU-labeling experiments on liver tissues. BrdU was given to mice of SCID/vehicle (A), SCID/fenofibrate (300 mg/kg], B), Chimera/vehicle (C), and Chimera/fenofibrate (300 mg/kg, D) during the last 1 hr before killing. The sections of A and B were stained with BrdU-antibodies and those of C and D were double-stained with BrdU and h-alb antibodies. BrdU-positive hepatocytes were counted in mouse hepatocytes of SCID/vehicle and SCID/fenofibrate, and in h-heps of Chimera/vehicle and Chimera/fenofibrate, and shown in (E) as BrdU-labeling index. Fenofibrate increased BrdU-labeling frequencies in SCID/fenofibrate mouse livers, but not in h-heps regions of Chimera/fenofibrate mouse liver. *p < .005 Bar: 100 μm.
Gene Expression
To further explore the effects of fenofibrate as a PP in hepatocytes at the molecular level, the expression levels of the genes in the PPARα-associated signaling pathway were determined by real-time qRT-PCR using fenofibrate-responsive SCID and chimeric mice. We measured the expression of PPARα signaling-associated genes (Figure 6A and B), cell cycle–related (Figures 6C–E) genes, and oxidative stress–related (Figures 6F and G) genes in SCID mouse livers and h-hep regions of chimeric mice. Special focus was placed on the genes encoding enzymes in peroxisomal fatty acid oxidation, such as acyl-CoA oxidase 1 (ACOX1) and 3-ketoacyl-CoA thiolase (ACAT, THIOL), as well as CAT, a marker enzyme of peroxisomes. Liver specimens from animals #1–3 (Chimera/vehicle in Table 1) and #12 to 15 chimera/fenofibrate (300 mg/kg; Table 1) were used for this purpose. Fenofibrate caused a significant increase in the expression of m-Acox1 and m-Thiol (Figure 6A) and m-Cat (Figure 6F) in the livers of SCID mice. In contrast, the h-hep regions showed no increase in the expression of the 3 human homologues of these genes in Chimeric/fenofibrate mice (Figure 6B for h-ACOX1 and h-THIOL and 6G for h-CAT).
Expression of PPARα signaling-associated, cell cycle–related, and oxidative stress–related genes in liver tissues. Liver samples from SCID/vehicle, SCID/fenofibrate (300 mg/kg), Chimera/vehicle, and Chimera/fenofibrate mice (300 mg/kg) were subjected to real-time qRT-PCR to measure the expression levels of the indicated genes: PPARα signaling-associated genes (A and B), cell cycle–related genes (C–E) and oxidative stress–related genes (F and G). The results are expressed as ratios of the expression levels of fenofibrate-treated samples to those of vehicle-treated samples (ordinates) against each of the genes (abscissas). *p < .01, **p < .05.
Fenofibrate greatly (∼1,350-fold) stimulated m-Cyp4a14 expression in the livers of SCID mice. In contrast, the h-hep regions of Chimeric/fenofibrate mice showed a low-level induction (∼2-fold), which supported the previously described histological observations.
There are several well-characterized human genes that are PPARα-responsive but are not involved in peroxisome proliferation. From these, we chose 3 representative genes, carnitine palmitoyl transferase-1 (CPT1), 3-hydro-3-gulutaryl-CoA synthase (HMGCS), and medium chain acyl-CoA dehydrogenase (ACADM, MCAD; Hsu et al. 2001), and determined their expression levels (Figure 6A and B). CPT1 and HMGCS were increased in the h-hep regions of Chimeric/fenofibrate mice (Figure 6B) and m-heps in SCID/fenofibrate mice (Figure 6A), indicating that this chimeric mouse liver model adequately mimics the human liver with respect to h-PPARα-associated reactions. m-Mcad was increased in the m-heps of SCID/fenofibrate (Figure 6A), but its human homologue was not stimulated in the h-hep regions of Chimeric/fenofibrate mice (Figure 6B).
Previous studies using mice and rats have shown that PPARα agonists upregulate several cell cycle–regulating genes, such as Cyclins, CDKs, c-myc, p21, and p53 (Peters et al. 1998; Rininger, Goldsworthy, and Babish 1997). We tested the effects of fenofibrate on the expression of these genes in the chimeric mouse model. m-Cyclin B1 (10-fold increase), an M phase–related gene, and m-CDK1, a G2 and M phase–related gene (∼3-fold increase), were stimulated in the liver of SCID/fenofibrate mice (Figure 6C). In the h-hep regions of Chimera/fenofibrate mice, none of these genes were affected (Figure 6E).
Oxidative stress is involved in fibrate-induced carcinogenesis in rodents (Pyper et al. 2012; Fidaleo 2009). We examined the effects of fenofibrate on the expression of 5 oxidative stress-associated genes using SCID mouse and chimeric mouse livers and compared the results between m-heps in the former and h-heps in the latter as described previously: CAT, Superoxide dismutase (SOD), glutathione peroxidase (GPX), thioredoxin reductase (TXNRD), and heme oxygenase (HO-1). Among them, only m-CAT was induced in SCID mouse liver (Figure 6F). The expression of these genes was not significantly affected in h-heps from Chimera/fenofibrate mouse liver (Figure 6G). Fenofibrate treatment had no influence on PPARα expression in the livers of all 3 groups (SCID, m-hep, and h-hep regions of Chimera/fenofibrate mouse livers; data not shown).
In the m-hep region in the chimeric mice, mRNA expressions of m-Acoxl, m-Thiol, m-Cpt1, m-Hmgcs, m-Mcad, and m-Cat were significantly upregulated by fenofibrate treatment (Supplemental Figure). Fenofibrate also significantly increased the m-Cyp4a14 expression level (270-fold) in m-hep regions of Chimeric/fenofibrate mouse liver. Inductions of m-Cat and Cyp4a11 mRNA expression levels supported the CAT-enzyme-histochemical and CYP 4A-immunohistochemical staining data. Fenofibrate increased the expression of m-CDK1 (2-fold) in m-heps of the chimeric mouse liver, which was lower than SCID liver (Supplemental Figure), probably because of the growth inhibitory effects of uPA expression in the host cells (Sandgren et al. 1991).
Proteomics Analysis
To determine the effects of fenofibrate on global protein expression in the liver, proteomic analyses were performed on the liver protein samples from SCID and chimeric mice and compared between fenofibrate (300 mg/kg)-treated and control animals. Protein samples obtained from livers of SCID/vehicle and SCID/fenofibrate and from h-hep regions of Chimera/vehicle and Chimera/fenofibrate were electrophoretically separated on 2-dimensional gels as shown in Figure 7A, B, C, and D, respectively. The profiles of A (SCID/vehicle) and B (SCID/fenofibrate) were compared to each other for identification of the spots that were differentially expressed, resulting in the identification of a total of 21 spots. Of these 21 spots, 8 spots consisting of 8 proteins were >1.5-fold upregulated and 2 spots consisting of 3 proteins were >1.5-fold downregulated, by fenofibrate treatment at a significance level of p < .05. The differentially expressed proteins were identified by mass spectrometry (Table 2). The 8 upregulated proteins included those involved in mitochondrial and peroxisomal β-oxidation. Of these, m-HMGCS2, m-MCAD, and mouse mitochondrial acetyl-coenzyme A thioesterase 1 (m-ACOT2) are involved in mitochondrial β-oxidation. Similar to the results for the mRNA analysis, the protein expression of m-HMGCS2 and m-MACD was also increased in SCID/ fenofibrate mouse livers. Mouse peroxisomal long chain acetyl-coenzyme A thioesterase Ib (m-ACOT4), mouse 3-ketoacyl-CoA thiolase B (m-ACAA1B), and mouse acetyl-coenzyme A acyltransferase 1 (m-ACAA1A; Figure 7, Table 2) are also proteins involved in peroxisomal β-oxidation. Notably, m-ACOT2 and m-ACAA1A exhibited a remarkable upregulation (>10-fold stimulation).
2-D PAGE profiles of liver proteins. Protein samples were obtained from livers from SCID/vehicle mice (A), SCID/fenofibrate (300 mg/kg) mice (B), h-hep regions of Chimera/vehicle mouse livers (C), and Chimera/fenofibrate mouse livers (300 mg/kg; D) and were subjected to 2-D PAGE to identify fenofibrate-responsive proteins in each experimental setting. The profiles of A (SCID/vehicle) and B (SCID/fenofibrate) were compared for identification of the spots that were differentially expressed. Similarly, the profiles of C (Chimera/vehicle) were compared with D (Chimera/vehicle) for the same purpose. The spots identified are circled and protein names are as follows: 1, m-ACTB; 2, m-GSTT1 and m-UQCRFS; 3, m-HSPD1; 4, m-ALDH4A1; 5, m-HMGCS2; 6, m-ACOT4; 7, m-ACOT2; 8 and 9, m-MCAD; 10, m-ACAA1A and m-ACAA1B; 11, h-ALDH1A1; 12, h-AKR1C2. Fold changes of these proteins are shown in Table 2.
The profiles of C (Chimera/vehicle) were compared with D (Chimera/fenofibrate) for identification of the spots that were differentially expressed. Six proteins were identified in the h-hep regions of Chimera/fenofibrate mouse livers as fenofibrate-responsive proteins, of which 2 spots consisting of 2 proteins (human aldehyde dehydrogenase 1 [h-ALDH1A1] and human aldo-keto reductase family 1, member C2 variant [h-AKR1C2]) exhibited >1.5-fold increased expression ( p < .05; Table 2). These proteins are not involved in the microsomal/peroxisomal β-oxidation, which supports the conclusion deduced from the mRNA expression analysis that the PPARα agonist does not induce peroxisomal proliferation-related enzymes in the h-hep regions of chimeric mouse liver.
Discussion
PPARs bind PPs and consequently induce PP-metabolizing enzymes. In rodents, PPs, such as hypolipidemic drugs, industrial plasticizers, and herbicides, are non-genotoxic carcinogens that eventually cause liver tumors (Morimura et al. 2006). Among these PPs, we chose fibrates as a target of this study with 2 reasons. First, fibrates have long been of clinical importance as hyperlipidemic drugs, but fibrate treatment is a major risk factor for coronary heart disease (Cheung et al. 2004). Second, fibrate-activated PPARs induce species-specific responses regarding hepatic peroxisome proliferation, hepatocyte proliferation, and carcinogenesis. This background information prompted us to examine whether the chimeric mouse could be an ideal animal model to predict effects of fibrates on the human liver.
In humans, hypolipidemic drugs function to maintain lipid homeostasis and do not induce peroxisome proliferation. Thus, the toxicity and carcinogenicity of PPARs are highly species-specific (Bentley et al. 1993). Currently, there are 3 known subtypes of PPAR: PPARα, PPARβ/δ, and PPARγ. Of the 3 PPARs, PPARα is expressed at high levels in the liver and is thus considered to play a central role in the metabolism and the effects of xenobiotics, including drugs. There is also an issue of interspecies diversity in the action of this subtype of PPAR. Their ligand-binding domains exhibit a lower degree (∼65%) of identity; PPARα agonists induce seemingly different actions in rodents and humans (Tachibana et al. 2008). Differential gene regulation in human versus rodent hepatocytes was demonstrated by PPAR using rat hepatocytes, human hepatocytes, and h-PPAR overexpressed HepG2 cells (Lawrence et al. 2001). They suggested that factors other than PPARα levels, such as differences in coactivators, coreoressors, or sequence of the promoters in the responsive genes, may cause the species differences in responses to peroxisomal proliferators. To characterize the species-specific action of PPARs, we evaluated the in vivo effect of fibrates on peroxisome proliferation in h-heps using chimeric mice. The effects of the agonist were examined at the levels of histology and expression of related genes/proteins. As a result, we were able to define the generally recognized species-specific effects of PPARα agonists and thus support the notion that rodent data on PPARα-induced hepatocarcinogenesis cannot be accurately extrapolated to human data. Based on the results of this study, we propose the use of the chimeric mouse model for studying the PPARα-associated signaling in the human liver. In this study, we first demonstrated that treatment with the PPARα agonist fenofibrate induced prominent peroxisome proliferation in the liver of SCID mice and the m-hep region in the chimeric liver, but not in its h-hep regions.
We developed chimeric mice with >70% h-heps in their livers (Tateno et al. 2004). The chimeric mice retained human-type metabolic activities, such as CYP, UDP-glucuronosyltransferase (UGT), and transporters (Tateno et al. 2004; Katoh et al. 2004; Katoh et al. 2005; Nishimura et al. 2005). A recent study using microarray profiles supported the similarity of h-hep regions of chimeric mouse liver to the human liver in vivo (Tateno et al. 2013). More than 82% of the 16,605 tested probes were within a 2-fold range difference between h-hep regions in the chimeric mice and those in the human body. Furthermore, chimeric mice are useful not only for determining human-type metabolism but also for detecting the toxicity of human specific hepatotoxins, such as troglitazone (Foster et al. 2012; Kakuni et al. 2012). Troglitazone treatment induces centrilobular hypertrophy in the chimeric mouse liver (Foster et al. 2012) and increases ALT levels in serum (Kakuni et al. 2012). In addition, chimeric mouse livers have been shown to be susceptible to HBV and HCV, which enables researchers to perform efficacy studies of anti-HBV and anti-HCV agents (Yoshizato and Tateno 2013). In this study, we utilized chimeric mice to determine the susceptibility to PPARα agonists.
It is well recognized that fibrates induce peroxisome proliferation in rodent livers and subsequent hepatocellular neoplasia (Pyper et al. 2012; Fidaleo 2009). Low susceptibility in humans has been ascribed to low expression of PPARα. PPARα mRNA expression levels are at least 10-fold less in humans than in mice (Palmer et al. 1998), and PPARα protein is also weakly present in the human liver, even considering broad interindividual variability (Walgren, Kurtz, and McMillan 2000). Researchers reported that the strong PPARα agonist WY-14643 induced genes of microsomal fatty acid oxidation enzymes, including CPT1, MCAD, and HMGCS, but not the peroxisomal fatty acid oxidation enzymes ACOX and THIOL in h-PPARα-transfected HepG2 cells (Hsu et al. 2001). In this study, fenofibrate enhanced the mRNA expression of peroxisomal and microsomal fatty acid oxidation enzymes in the SCID mouse liver and in the m-hep regions but not in the h-hep regions of the chimeric mouse liver. The agonist enhanced only CPT1 and HMGCS mRNA expression levels in the h-hep regions, which is in agreement with a previous study using HepG2 cells (Hsu et al. 2001). Comparing the results of these previous studies with those of this study, we conclude that the chimeric mice exposed to fenofibrate are suitable and adequate experimental animals to determine PPARα-mediated reactivity in human livers.
The BrdU-labeling study clearly showed that fenofibrate treatment induced DNA synthesis in the liver of SCID mouse but not in h-hep of chimeric mice. Real-time qRT-PCR analysis for cell cycle–related genes also supported this finding. We observed a >10-fold stimulation in the expression of m-cyclin B1 in the SCID/fenofibrate mouse liver compared with that in SCID/vehicle mice, but no induction was observed in h-heps of the chimeric mouse. Treatment with WY-14,643 diet for 2 weeks increased cyclin B1 mRNA levels in wild-type mice by 10.2-fold (Maxwell and Yu-Jui 2009), which was comparable to this SCID mouse data.
The chimeric mouse liver is composed of h-heps and 2-kinds of m-heps, one being degenerating m-heps under the influences of overexpressed uPA genes (white region) and the other proliferating m-heps that spontaneously lose uPA genes (red region). If species difference can be determined in h-heps and m-heps within a human/mouse chimeric liver, this mouse model would be practically ideal and innovative. Therefore, we tried to determine protein and gene expression levels by enzyme- and immunohistochemistry and by real-time RT-PCR analyses in h-heps and m-heps of the chimeric mice that had been exposed to fenofibrate. In the degenerating m-heps, microsomal/peroxisomal β-oxidation enzymes were significantly induced by fenofibrate treatment, but induction levels of cell cycle–related genes such as CYCLIN B1 and CDK1 were low compared with those in SCID mouse liver. BrdU incorporation was originally higher in the degenerating m-heps in the chimeric mouse than others, but the m-heps show proliferative disorders due to a high expression of uPA, resulting in a lack of BrdU incorporation during partial hepatectomy-induced regeneration (Sandgren et al. 1991). It was possible to utilize the other type of m-hep, that is, the proliferating m-heps (red region), as an intrahepatic control type of m-hepatocytes. However, these m-heps appeared to be practically inappropriate for such a control cell type, because their region sizes and growth phase are experimentally uncontrollable and, as a matter of fact, we found that the proliferating m-heps showed high activities of CAT (data not shown). Therefore, we assume that the degenerating m-hep regions in chimeric mice may be useful for determining the expression of microsomal/peroxisomal β-oxidation enzymes, but might not be suitable for determining cell growth ability. Therefore, in this study, we utilized mouse hepatocytes in fenofibrate-untreated SCID mice as a control cell type for h-heps in fenofibrate-treated chimeric mice in the BrdU incorporation experiments.
In this study, peroxisomal proliferation and microsomal m-Cyp4a induction were observed in the SCID mouse liver. The microsomal CYP4A is involved in fatty acid ω-oxidation, which is linked to the generation of hydrogen peroxide (H2O2). H2O2 reacts with lipids, resulting in lipid peroxide, a highly reactive oxygen species (ROS; Yu, Rao, and Reddy 2003). ROS can cause damage to DNA and play a role in triggering carcinogenesis in the liver. CAT, SOD, GPX1, and TXNRD2 are known to reduce ROS (Mates 2000; Chang et al. 2005). Among these genes, m-Cat was only the gene induced in the SCID/fenofibrate mouse liver but not in the h-hep regions of Chimera/fenofibrate mice. There is a possibility that the dose we had adopted might be too low and our dosing period was too short to detect expression changes of the genes regulating oxidative stress except CAT. When rats were fed 6,000 ppm fenofibrate for 3 weeks, Gpx2, Cat, and Sod2 mRNA levels were changed to 5.0-, 1.4-, and 1.1-fold, respectively (Nishimura et al. 2007).
Comparative proteome analysis between SCID/vehicle and SCID/fenofibrate mice and between Chimera/vehicle and Chimera/fenofibrate mice supported the results of gene expression analysis. Increased protein levels of HMGCS and MCAD were observed in SCID mice, similar to the mRNA levels. The peroxisomal fatty acid oxidation enzymes ACAA1A, ACAA1B, ACOT2, and ACOT4 were increased in SCID/fenofibrate mouse livers; these genes were reported to be induced by PPARα agonists (Rakhshandehroo et al. 2007). The mechanisms behind the decrease in β-actin and increase in heat shock protein 65 in SCID/fenofibrate mouse livers are currently unknown. Increases or decreases in glutathione s-transferase, ubiquinol-cytochrome c reductase, or ALDL4A1 protein might have occurred because of the metabolism of fenofibrate. In contrast, only 2 proteins, ALDH1A1 and AKR1C2, which are related to the metabolism of alcohol and catalysis of the conversion of aldehydes and ketones to their corresponding alcohols using NADH and/or NADPH as cofactors, respectively, increased in h-hep regions of Chimera/fenofibrate mouse liver.
In an examination of liver biopsy samples from patients receiving therapeutic doses of PPARα agonists, no increase in peroxisome numbers was observed (Gariot et al. 1983; Blümcke et al. 1983). Therefore, studies with a transgenic mouse line humanized for PPARα (h-PPARα mice) demonstrated a very low incidence of hepatocellular tumors compared with the wild-type mice (m-PPARα mice), supporting the notion that humans appear to be resistant to the induction and the development of hepatocarcinoma after chronic exposure to PPARα agonists. However, in h-PPARα mice, the peroxisome proliferation-related peroxisomal enzymes, such as ACOX, were induced as in the case of m-heps (Morimura et al. 2006). Recently, PPARα-humanized transgenic mice were generated using P1 phage artificial chromosome (PAC) genomic clone bred onto h-PPARα PAC mice. The tissue distribution of PPARα is similar to that observed in the wild-type mice, and the h-PPARα in h-PPARα PAC mice is under regulation of its native promoter. h-PPARα PAC mouse model is thought to have an advantage over our model in that the mouse expresses h-PPARα not only in liver but also in other tissues. However, we consider that this model has a major disadvantage when we study the species differences in the role of PPAR gene, because genes and proteins other than PPARα are all of mouse origin in the liver in the h-PPARα PAC mice. In other words, other intrinsic mouse-derived hepatic factors could affect the expression of h-PPARα gene and the nature of the expressed h-PPARα proteins. For example, m-hep-intrinsic factors may affect coregulators (coactivators, coreoressors or sequence of the promoters in the responsive genes) in a species-specific manner that might facilitate or inhibit h-PPARα-mediated gene expression (Lawrence et al. 2001; Yang et al. 2008). In the h-PPARα PAC mice, hepatomegaly and peroxisome proliferation were observed (Yang et al. 2008) without the induction of cell cycle genes such as cycline D1 and CDK4, which apparently contradicts the study that peroxisome proliferation was not seen in the liver of patients receiving fibrate drugs (Peters, Cheung, and Gonzalez 2005). The cited authors suggested that peroxisome proliferation-related effects might be differentially regulated in m-heps compared to human hepatocytes. The slight hepatomegaly observed in h-PPARα PAC mice was in large part due to hepatocyte hypertrophy, which is likely induced by peroxisome proliferation (Yang et al. 2008). In our humanized liver model, hepatocytes were mostly of human origin, which expressed most of the human genes (>82%) at levels similar to those in human livers (Tateno et al. 2013) under the regulation of human factors, which enables us to reasonably expect that the h-heps treated with PP agonists are regulated by human specific coregulators of h-PPARα. In this study, hepatocellular hypertrophy or peroxisome proliferation were not observed in h-heps of the chimeric mouse livers.
In conclusion, the humanized livers of chimeric mice expressed functional h-PPARα, and fenofibrate did not induce peroxisomal proliferation or growth in h-hep regions of Chimera/fenofibrate mouse liver, supporting that extrapolation of PPARα-induced hepatocarcinogenesis from rodents to humans might be inappropriate. We propose that the humanized chimeric mouse is a robust tool for assessing interspecies differences between rodents and humans with regard to biological features and functions and pharmacological responses of the liver.
Footnotes
Acknowledgments
We thank Y. Yoshizane from PhoenixBio Co., Ltd, and H. Kohno, Y. Matsumoto, and S. Nagai from CLUSTER for their technical assistance.
Author Contributions
Participated in research design: Tateno, Yamamoto, Tsutsui and Yoshizato. Conducted experiments: Tateno, Yamamoto, Utoh, Yamasaki, Myoken, Oofusa, Okada and Tsutsui. Wrote or contributed to the writing of the manuscript: Tateno, Yamamoto, Yamasaki, Ishida, Tsutsui and Yoshidato
The author(s) declared no potential conflicts of interest with respect to the research, authorship, and/or publication of this article.
The author(s) disclosed receipt of the following financial support for the research, authorship, and/or publication of this article: This work was supported by Cooperative Link of Unique Science and Technology for Economy Revitalization (CLUSTER), Promotion of Science and Technology in Regional Areas, Ministry of Education, Culture, Sports, Science and Technology, Japan.