
Abstract
The analysis of organ vasculature, and more specifically organ microvasculature, carries special importance for toxicological sciences, and especially for evaluation of drug-induced vascular toxicity. This field presents a special challenge in nonclinical drug safety assessments since there are currently no reliable microvascular toxicity biomarkers. Therefore, we aimed to systematically investigate the use of microvascular 3D geometrical analysis of corrosion casts for evaluation of drug-induced vascular toxicity, utilizing a novel image investigation tool that allows full 3D-quantified geometrical analysis of the entire vascular tree structure. Vascular casts of kidneys from control and low- and high-dose ephedrine/caffeine-treated mice were scanned by a micro CT, and images were processed and analyzed using the VasculomicsTM platform. All evaluations were performed on the kidney cortex. Treatment resulted in a significant and dose-related reduction in overall microvessel density throughout the kidney cortex. This effect was most pronounced for vessels with diameters between 25 µm and 35 µm, and affected mostly vessels located in the superficial part of the kidney cortex. The use of 3D analysis tools in drug-induced vascular toxicity studies allows for very high resolution and characterization of drug effects on the microvasculature and can be used as a valuable tool in drug safety assessments.
Introduction
Vascular function is critical for normal physiological function of the heart, kidney, and brain (Liu et al. 2010). Changes in the anatomy, structure, or function of the vasculature play a prominent role in vascular pathology, which is among the leading causes of mortality—including cardiovascular disease, cancer, diabetes, and thromboembolic disorders (Schambach et al. 2010). Therefore, imaging and analysis of blood vessels, and particularly microvessels, are important tasks for medical and toxicological purposes. Technical advances in 3D image analysis have increased the quality of the vascular information that could be gathered (van den Wijngaard et al. 2013), and allowed visualization of vascular beds of organs, including the renal vasculature of rodents (Nordsletten et al. 2006), permitting analysis of functional vascular networks (van den Wijngaard et al. 2013). There remains, however, a major unmet need for methods to enable the quantitative, 3D assessment of the entire vascular tree down to the level of microvessels.
Drug-induced vascular toxicity can present a major problem in nonclinical drug safety assessments (Clemo et al. 2003; Dunnick et al. 2007; Joseph, Rees, and Dayan 1996; Kerns et al. 2005; Nyska et al. 2005; Zhang et al. 2008), and several compounds have been shown to directly affect human vasculature, leading to vasoconstriction and cardiotoxicity (Cockings and Brown 1997; Ramot and Nyska 2007; Ramot, Nyska, and Spectre 2013; Zaacks et al. 1999). This issue presents a major challenge in preclinical studies, since there are prominent species differences, site specificity, and dose response aspects that make this issue highly complex for interpretation (Brott et al. 2005). Since there are currently no reliable and recognized biomarkers to evaluate vascular toxicity (Dalmas et al. 2011), there is a critical unmet demand for establishing a dependable assessment method for drug-induced vascular toxicity.
Advanced analysis methods such as intravital multiphoton laser scanning microscopy, optical coherence tomography, and orthogonal polarization spectral imaging are limited due to their restricted field of view or superficial penetration (Kiessling, Razansky, and Alves 2010; Schambach et al. 2010), and while X-ray angiography can provide important morphological information, its use was limited due to its 2-dimensional nature (Schambach et al. 2010). It is on this basis that sophisticated 3D imaging and analysis tools are required. The introduction of the microvascular corrosion cast technique, pioneered by Murakami (1971), offered a novel tool for reliable preservation of the microvasculature. However, it is challenging to manually extract and quantitatively assess all the 3D vessel geometric information out of casts, and this is the reason why microvascular corrosion casts used for toxicity research have been very limited (Peao et al. 1994; Valamanesh et al. 2009), although they have been used in different research fields, including research of angiogenesis, anatomy, tumor formation, embryology, and different pathological conditions (van den Wijngaard et al. 2013). This is in spite of the fact that this method provides a highly accurate technique for evaluation of drug-induced vascular toxicity, considering the possibility to view the microvasculature of various tissues and organs at the ultrastructural level (Hossler and Douglas 2001). Fortunately, novel technologies provide us highly precise automated solutions to mining 3D geometric information of the microvasculature out of well-perfused vascular casts, thus making the use of casts to investigate the vascular toxicity feasible.
It is on this basis that we have undertaken to systematically investigate the use of microvascular corrosion casts in combination with a novel vascular analytical software platform in the evaluation of drug-induced vascular toxicity. For this purpose, we used the well-recognized ephedrine/caffeine mouse model (Dunnick et al. 2007; Nyska et al. 2005), and took advantage of the novel investigation tool VasculomicsTM, allowing full 3-dimensional quantified analysis of the entire vascular tree structure, thus enabling the performance of sophisticated analyses to reveal drug-induced toxicity at the ultrastructural level. This platform allows detection of vessels with great accuracy and repeatability, and thus analysis of vascular tree geometry can start from a single point on a single vessel, all the way to the vascular tree of the full organ. This can be utilized for deriving vascular geometric patterns that can indicate normal or diseased tissues including toxic impacts on such tissues.
Materials and Methods
Experimental Design
Female albino CD-1 mice aged approximately 8 weeks old were obtained from Charles River Laboratories. All animal experiments were reviewed and approved by the Brown University Institutional Animal Care and Use Committee.
The study included 3 groups, 2 treatment groups and 1 control group, consisting of 4 CD-1 mice/group. The treated mice were administered orally with 1 dose of 12.5 mg/kg or 25 mg/kg ephedrine (ephedrine sulfate, USP, West-ward Pharmaceutical Corporation, Eatontown, NJ) and 7.25 mg/kg caffeine (Sigma-Aldrich, St. Louis, MO). The dose levels were selected based on the results from previous experiments (Dunnick et al. 2007; Nyska et al. 2005). Following administration, mice were observed for 2 hr before perfusion with the casting material, to reach peak plasma levels of ephedrine (Pickup et al. 1976). Following the 2-hr interim, treated and control mice were systemically heparinized with 0.1 ml of sodium heparin solution (1,000 USP units/ml) intraperitoneally, and under CO2 anesthesia the systemic circulation was perfused with a casting material (Mercox, Ladd Research, Williston, VT). Tissues were then corroded using a corrosion solution, and the kidney-corroded vascular cast was mounted on a scanning pedestal (Figure 1).
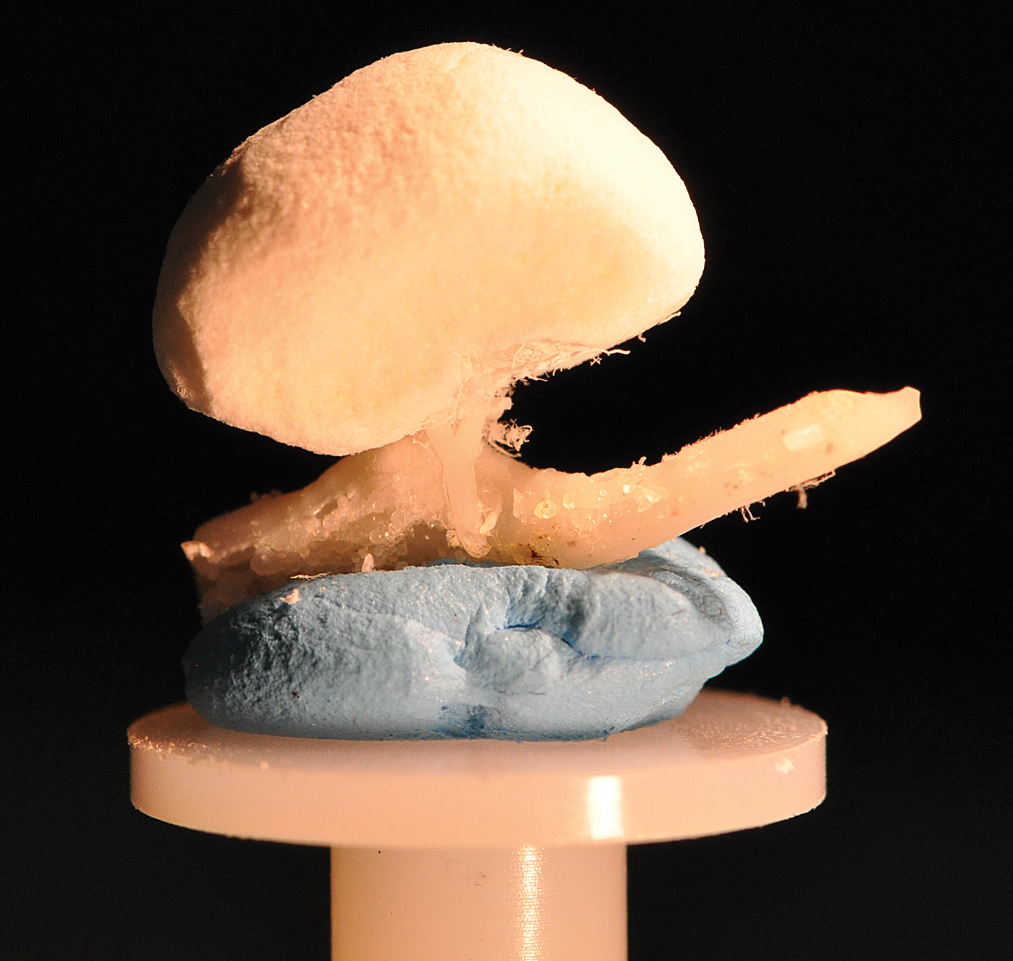
Mouse kidney vascular corrosion cast mounted on a stage.
Imaging and photography of vascular castings by scanning electron microscopy were performed using a Hitachi Model S-2700, Ltd., Tokyo, Japan. For scanning electron microscopy only, vessels were coated using an Emitech K550 sputter coater for approximately 3 min, which resulted in a ∼25-nm layer of gold covering the sample. Micro-CT images of the corroded kidney vascular casts were acquired using a SkyScan 1172 micro-CT system (Bruker, Billerica, MA). Due to incomplete perfusion of 1 animal in each group, only 3 mice per group were included in the study. The data set of the corroded vascular casts of the kidneys was image processed and computer analyzed for microvascular geometrical changes using the VasculomicsTM platform, which allows for visualization, quantification, and analysis of 3-dimensional vascular geometry in vessels as small as 10 μm in diameter. Using this platform, several parameters can be calculated. For microvascular density (MVD) measurement, the percentage taken by the total vascular lumen volume within the region of interest is calculated out of the total volume of the region of interest. For microvolume vessel density (MVVD) measurement, the region of interest is divided into virtual cubes of known sizes, and the percentage of vascular volume present within such collection of contiguous cubes is calculated. Depending on the location of the microvolume cubes, vascular density can be extracted at that specific location. Data collection in this platform is automated and user definable and so is the report generation.
Furthermore, since we were interested to evaluate highly vascularized regions populated with very small diameter vessels (from capillaries up to vessels 40 µm in diameter), all evaluations were performed on the kidney cortex, in a kidney shell located at the outer 5% to 25% of the kidney surface (Garcia-Sanz et al. 1998; Hillman et al. 1982). The major steps of this study are summarized in Figure 2.
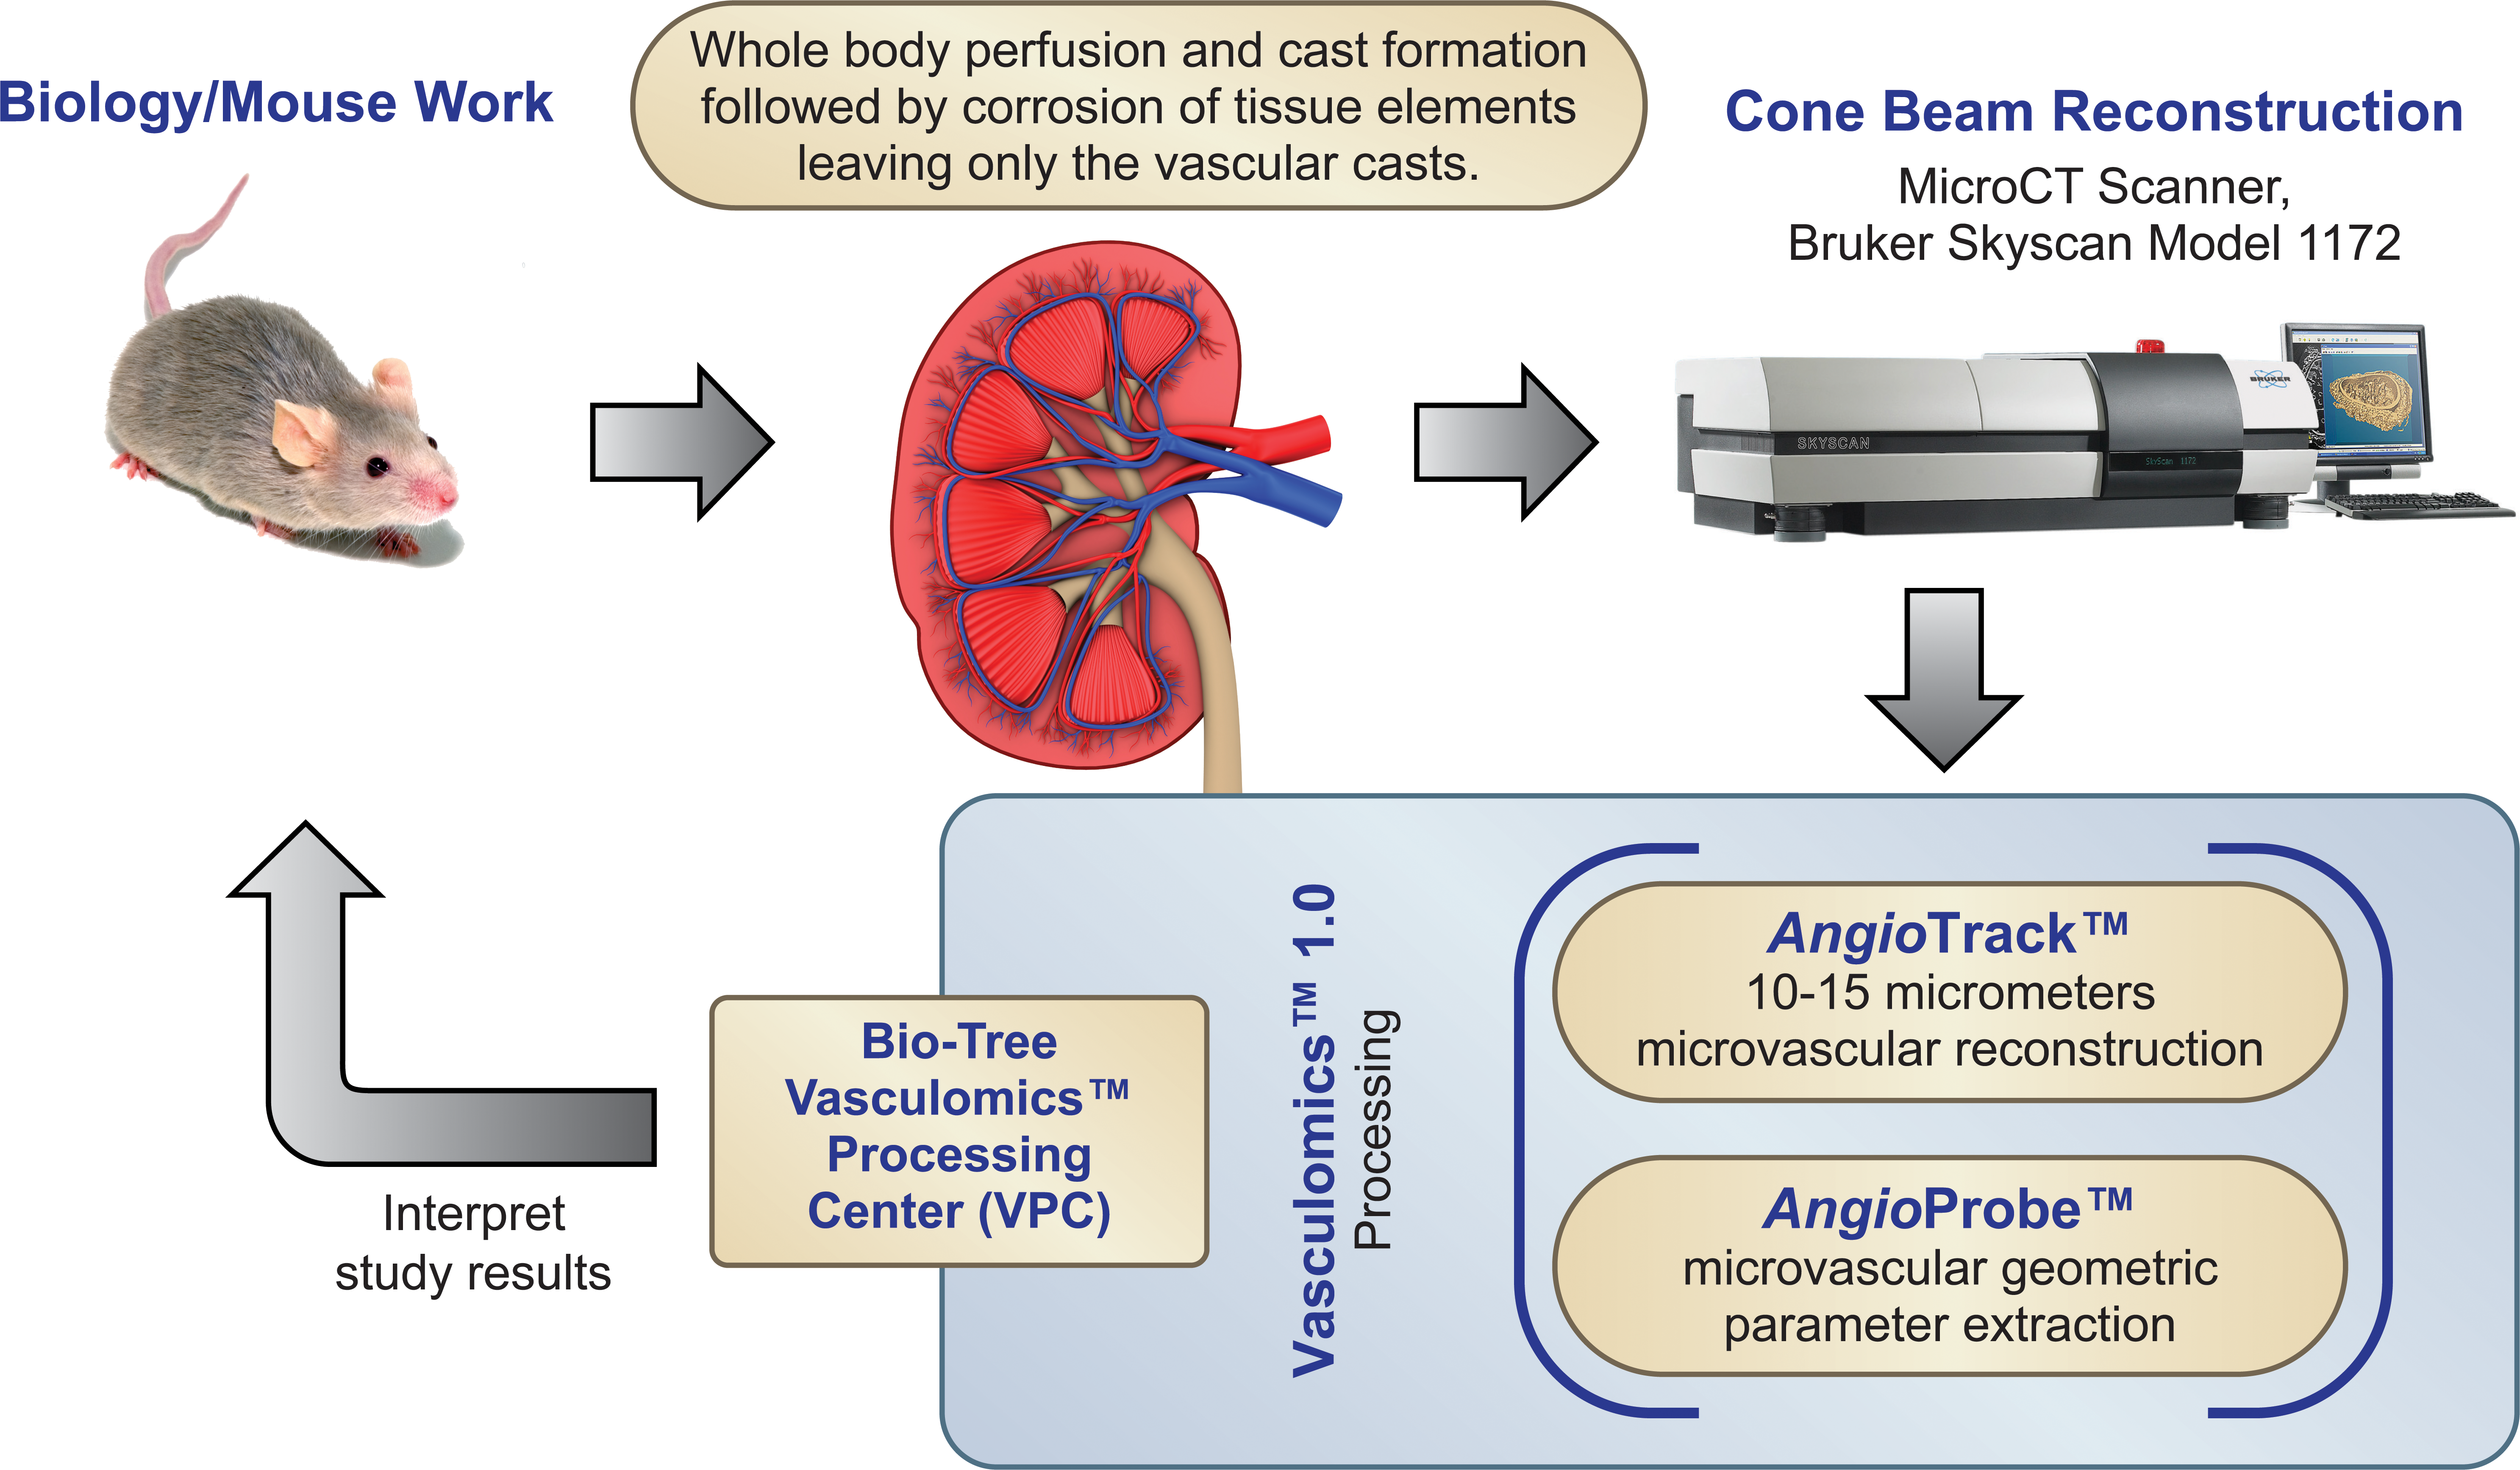
A scheme representing the methods used in the current study.
Statistical Analysis
Results were analyzed using GraphPad Prism (Graphpad Software Inc., California, USA, version 5 for Window). For all analyses, 6 kidneys from 3 animals in each group were included. The mean of 2 kidneys from each animal was calculated, and considered as N = 1. Due to incomplete perfusion, 1 of the 4 animals was not included in the statistical analyses in each group.
Results
Scanning Electron Microscopy of Kidney-corroded Vascular Casts
To demonstrate the ability of the microvascular casting to visualize and detect the small diameter vessels in the kidney, scanning electron microscopy images of the kidney-corroded vascular casts were obtained. A cross section of the dorsal cortex of the kidney vascular cast revealed glomeruli and a dense vascular network comprising numerous capillaries (Figure 3A). Higher magnification demonstrated the completely perfused delicate architecture of the glomerulus, including an afferent arteriole and the endothelial fenestrations (Figure 3B).
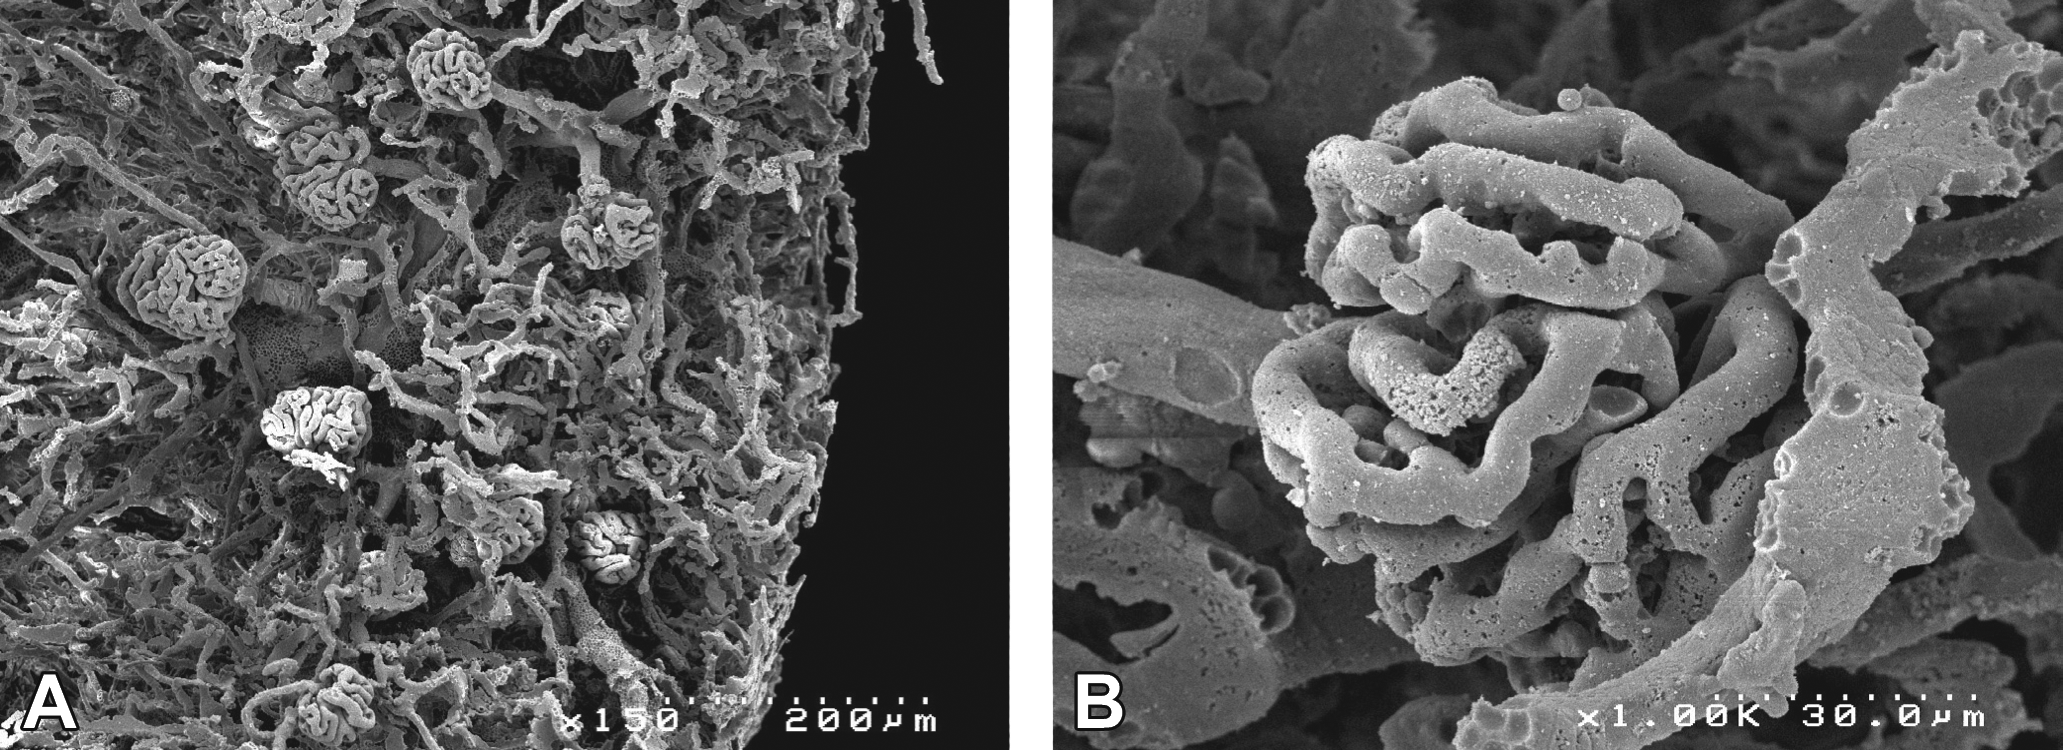
Scanning electron microscopy micrographs of vascular corrosion casts of mouse kidneys in low (A) and high (B) resolution.
MVD for Each Group of Vessel Diameters (Diameter-binned 3D MVD)
Using a novel 3D vascular geometry analysis tool, the effect of ephedrine and caffeine administration on the overall and diameter-binned density of microvessels in the kidney cortex (outer 5–25% of the kidney surface) was quantified. To evaluate which microvascular subpopulations were impacted by the drugs, we constructed a histogram in which the density of vascular segments within a given range of diameters was assessed (Figure 4A). Since scanning was performed in a pixel resolution of 7 µm, diameter ranges analyzed were multiples of 7 (specifically, 14–20 µm, 21–27 µm, 28–35 µm). The spatial distribution of treatment-induced changes was evaluated using cross-sectional maps showing specific vessels color coded by diameter (Figure 4B, upper panels) and by vascular density (Figure 4B, lower panels). Treatment resulted in a significant and dose-related reduction in microvessel density, most pronounced in the vessels with diameters between 21 µm and 28 µm and from 28 µm to 35 µm. No effect was seen in the larger vessels, with diameter larger than 50 µm.
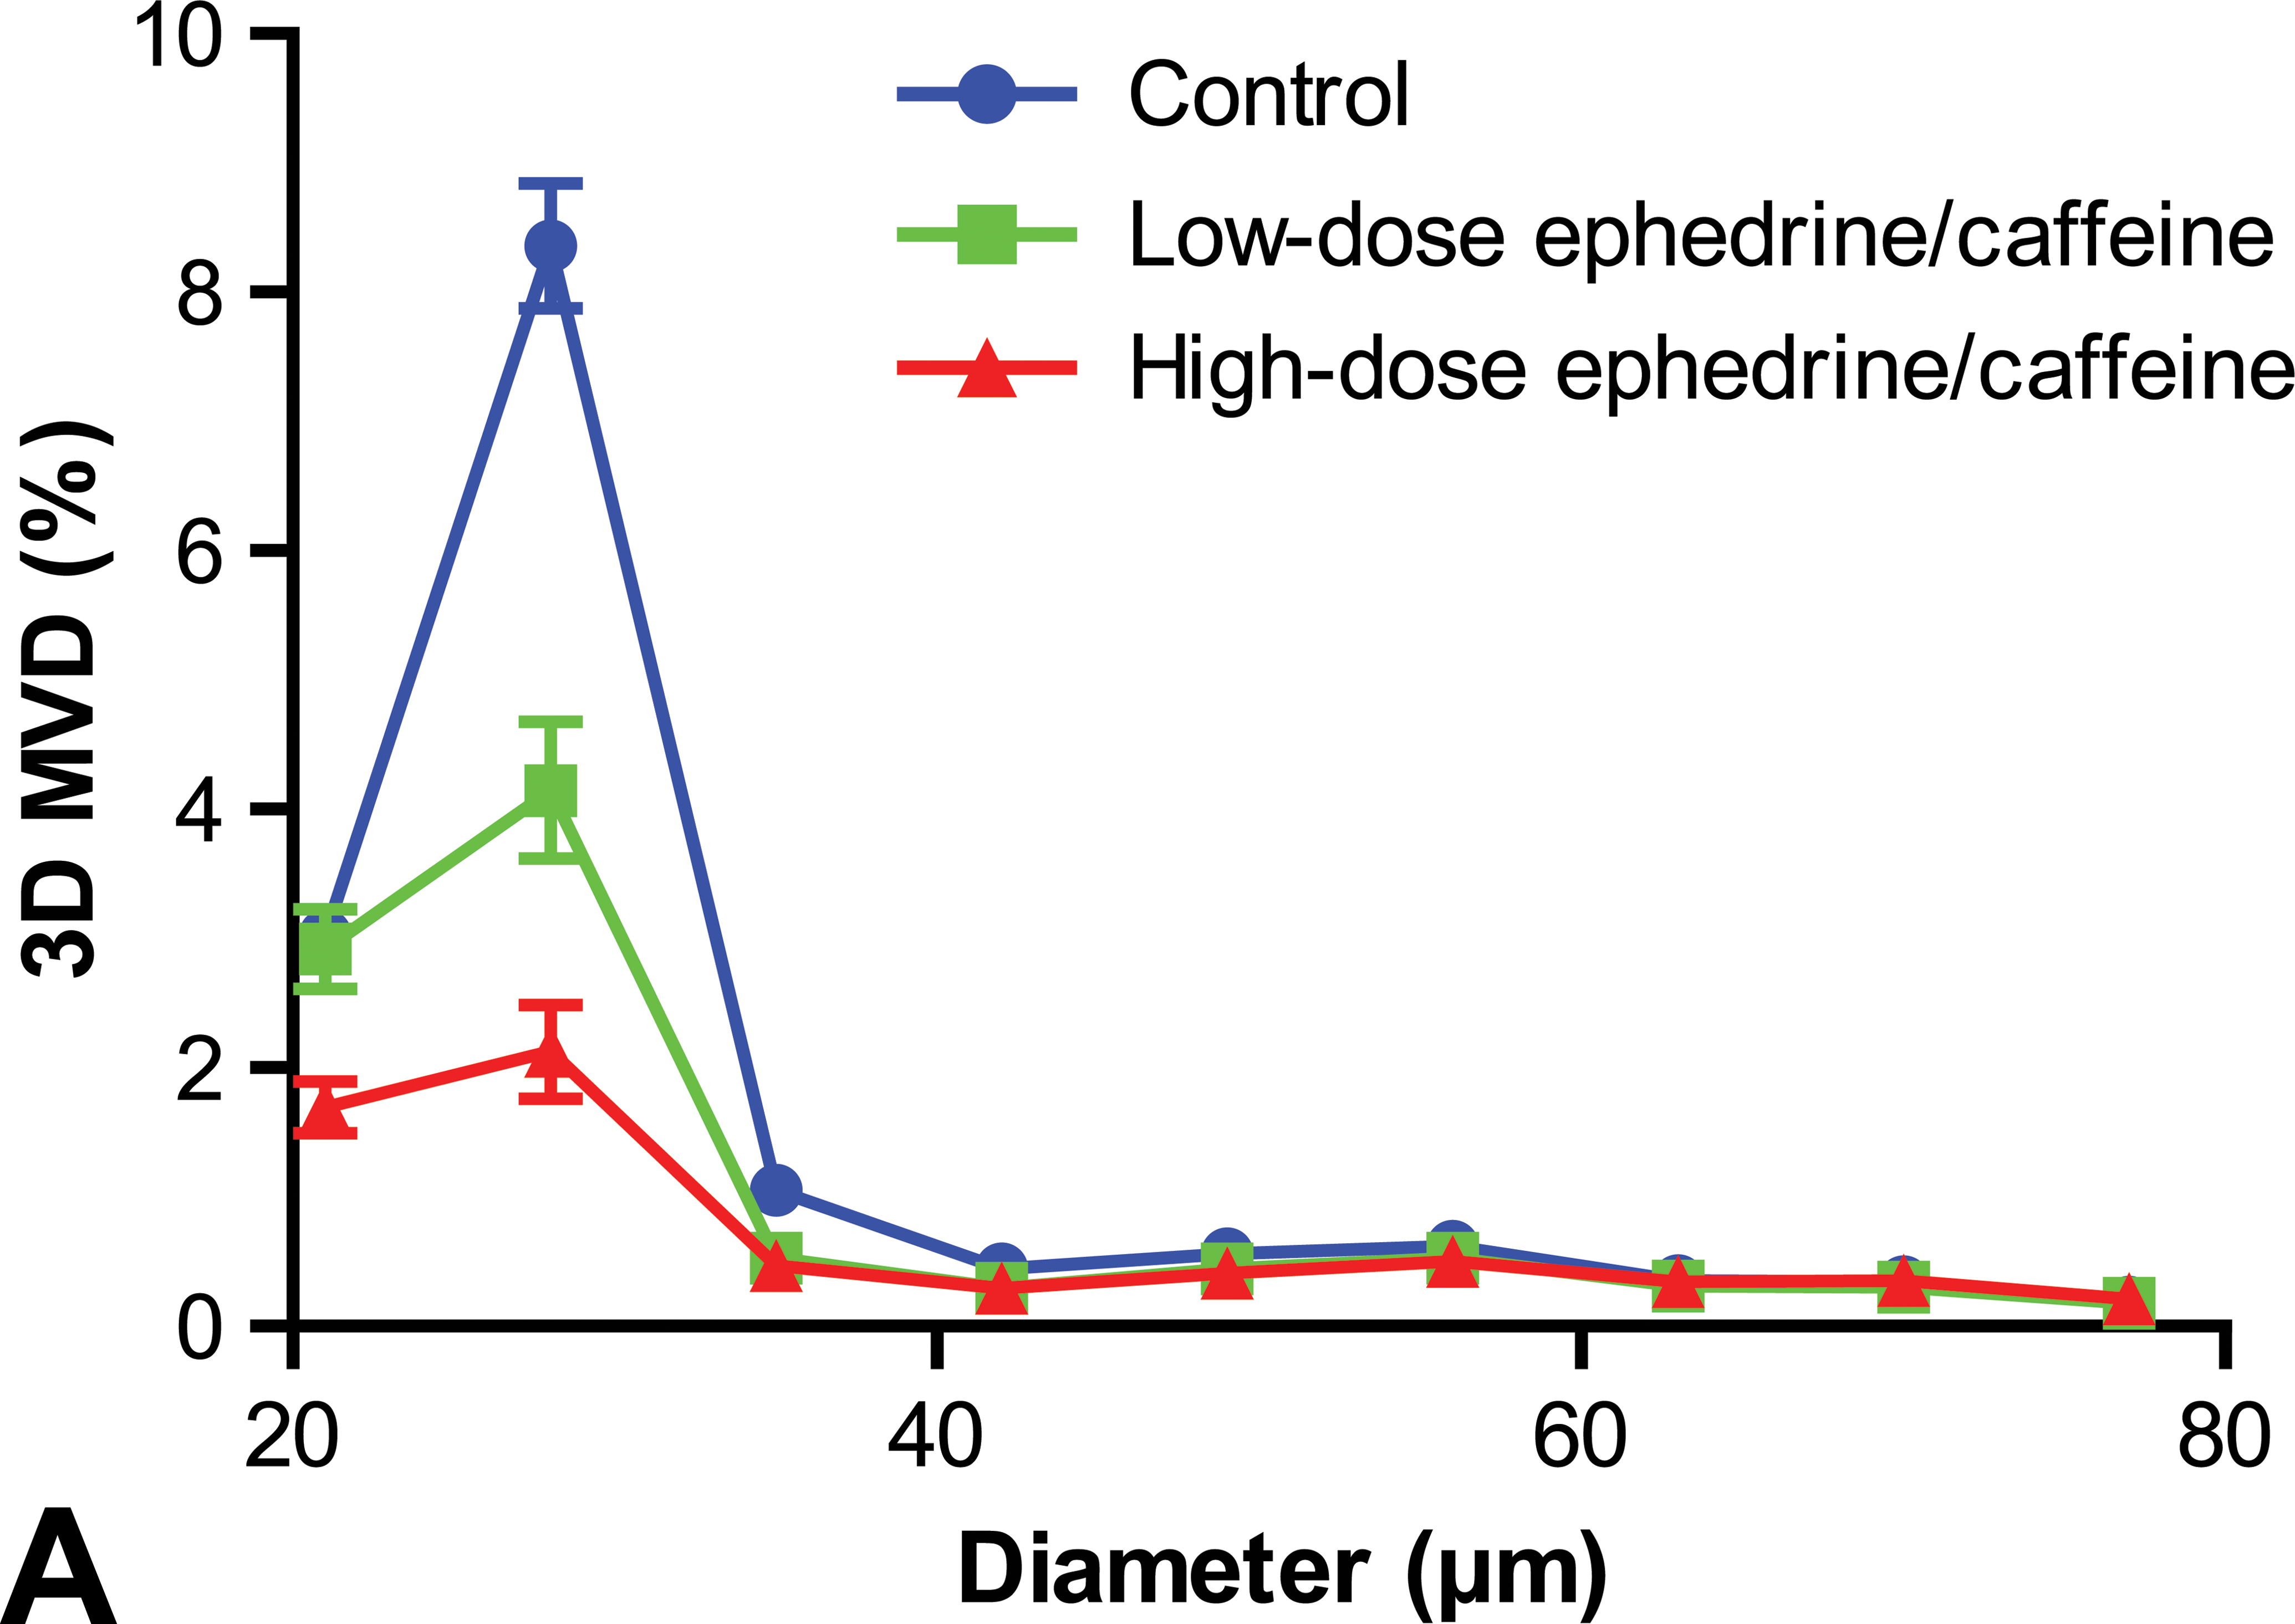
(A) Microvascular density distribution of kidney cortex microvessels as a function of vessel diameter. Mice were treated with 2 different dose combinations as follows: Low dose: ephedrine/caffeine 12.5 mg/kg/7.25 mg/kg, respectively, and high dose: ephedrine/caffeine 25 mg/kg/7.25 mg/kg, respectively. Treatment led to a significant decrease in the density of microvessels. (B) Images show cross section of vascular view (blue color represents low diameter vessels, and yellow and red color high diameter vessels) and cross-section vascular density maps (blue color represents low density and green color higher density). Red circles mark regions with a decrease in the density of low diameter vessels after treatment. vs/mm3, unit of vascular density. N = 3/group. M ± SEM. Note. SEM = standard error of the mean.
MVD Histogram of Vascular Density in Microvolumes (Microvolume-binned 3D MVD, [MVVD] Histogram)
In order to further analyze the observed decreased MVD after ephedrine/caffeine administration, we constructed a 3D microvessel density histogram in which the density of vascular segments was assessed within a population of fixed-sized microcubes populating the entire volume of the kidney cortex, with each side of a microcube measuring 300 µm (termed Microvolume; the size of this cube is driven by the 200 µm maximum intervessel distance required to sustain live tissue). The result of this measurement gives us the microvolume vessel density (MVVD) for a given microlocation within the volume of the kidney cortex. We then plotted the histogram of the MVVD for each microvolume within the kidney cortex resulting in the plots on Figure 5. Furthermore, we have plotted the MVVD histogram for selected ranges of vessel diameters, giving us an additional level of insight on the vasoconstriction effect of the drug combination on specific vessel diameter groups/populations.
Density histogram of kidney cortex microvessels. Mice were treated with 2 different dose combinations as follows: Low dose: ephedrine/caffeine 12.5 mg/kg/7.25 mg/kg, respectively; and high dose: ephedrine/caffeine 25 mg/kg/7.25 mg/kg, respectively. Treatment led to a significantly higher frequency of microvessel low-density areas at the 0- to 84-µm diameter range (A). In the 14- to 20-µm diameter range, treatment significantly increased the frequency of microvessel high-density areas of the low-ephedrine dose (B), while in the 21- to 27-µm and 28- to 35-µm diameter range treatment caused an increase in the frequency of microvessel low-density areas in both ephedrine doses (C and D). N = 3/group. M ± SEM. SEM = standard error of the mean; MVVD = microvolume vessel density, defined as thousands of vessel segments per cubic millimeter.
Indeed, this method of presentation demonstrated that, when the whole range of microvessels was analyzed (0- to 84-µm diameter), treatment led to a significantly higher frequency (the content of each density bin in the histogram) of low microvessels density regions (Figure 5A). To better delineate the exact group of vessels that are mostly affected by ephedrine and caffeine, a 3D microvessel density histogram was assembled for three different diameter ranges. In the 14- to 20-µm diameter range, high-dose ephedrine increased the frequency of low-density areas of microvessels signaling a vasoconstriction effect on capillaries and microvessels by the high-ephedrine/caffeine dose. Similar effect is observed for the high-ephedrine/caffeine dose in the 21- to 27-µm and 28- to 35-µm diameter ranges. Treatment with low-dose ephedrine/caffeine slightly increased the frequency of high-density areas of microvessels in the 14- to 20-µm diameter range (Figure 5B), but significantly reduced the frequency in the high-density areas and strongly increased the frequency in the low-density areas of the 21- to 27-µm and 28- to 35-µm diameter ranges, suggesting vascular populations in these ranges constricted and thereby contributed to the increased frequency of 14- to 20-µm range (Figure 5C and D). Overall, this analysis shows that ephedrine/caffeine cause constriction of microvessels mostly in the 21- to 35-µm diameter range, and while the low-dose ephedrine increases the frequency of the vessels with a diameter lower than 21 µm, the high-dose ephedrine constricts the microvessels also in the 14- to 20-µm diameter range.
Mean MVVD as a Function of Distance from Kidney Surface
After confirming the vasoconstrictive effects of ephedrine/caffeine in the kidney microvasculature, we wanted to explore whether and to what extent these effects vary in specific regions in the kidney cortex. To evaluate this, we examined the mean microvascular density (mean MVVD) as a function of distance from the surface of the kidney. Analysis of the 0- to 84-µm vessel diameter range showed a clear decrease in the mean MVVD after caffeine and ephedrine administration throughout the kidney cortex in a dose-dependent manner (Figure 6A). To further characterize these effects, we analyzed the same vessel diameter ranges as with previous parameters. Using this method, we observed that caffeine and high-dose ephedrine decreased the mean MVVD in the 14- to 20-µm range, but mostly in the deeper parts (further from kidney surface) of the kidney cortex (Figure 6B). The low-dose ephedrine/caffeine actually increased the mean MVVD in the 14- to 20-µm range (Figure 6B). Nevertheless, this effect was evident only in the region closest to the kidney surface. In regions, more than 10% below the surface area, there was no difference in the mean MVVD between low-ephedrine/caffeine treated and untreated mice (Figure 6B). With increasing vessel diameter, the ephedrine/caffeine treatment significantly decreased the mean MVVD, with most significant difference in the more superficial parts of the kidney cortex, and most pronounced in the 28- to 35-µm vessel diameter range (Figure 6C and D). When microvessel density was analyzed for all kidneys in the 0- to 84-µm range, the mean MVVD plots showed an overall dose-dependent vasoconstriction effect.
Mean microvessel density as a function of distance from kidney surface. Mice were treated with 2 different dose combinations as follows: Low dose: ephedrine/caffeine 12.5 mg/kg/7.25 mg/kg, respectively; and high dose: ephedrine/caffeine 25 mg/kg/7.25 mg/kg, respectively. Treatment led to a decrease in vessel density (mean MVVD) throughout the kidney cortex at the 0- to 84-µm diameter range in a dose-dependent manner (A). However, treatment increased density (mean MVVD) of 14- to 20-µm diameter vessels at the outer 5 to 10% of the kidney surface in the low-dose ephedrine group (B). Density of 21- to 35-µm diameter vessels (mean MVVD) was decreased throughout the kidney cortex following treatment with both low- and high-dose ephedrine (C and D). N = 3/group. M ± SEM. Mean MVVD. SEM = standard error of the mean; MVVD = microvolume vessel density.
Mean MVVD in the Cortex of the Kidney
Using the mean MVVD plots as function of distance from kidney surface in the previous section (Figure 6), we calculated the mean value for each of the plots. The bar graphs representing the mean values for each of the plots in the previous section are displayed in Figure 7. These values provide a single value of the quantified effect on the microvessel population in the kidney cortex. As in the previous sections, ephedrine/caffeine caused constriction of microvessels mostly in the 21- to 35-µm diameter range. The low-dose ephedrine increases the mean MVVD for vessels with a diameter in the 14 to 20 µm diameter range, while the high-dose ephedrine reduces the mean MVVD also for vessels in the 14- to 20-µm diameter range.
Bar graph of microvolume mean vessel density in the kidney cortex. Mice were treated with 2 different dose combinations as follows: Low dose: ephedrine/caffeine 12.5 mg/kg/7.25 mg/kg, respectively; and high dose: ephedrine/caffeine 25 mg/kg/7.25 mg/kg, respectively. N = 3/group. Mean MVVD. M ± SEM. Student’s t-test. SEM = standard error of the mean; MVVD = microvolume vessel density. *p < .05. **p < .01. ***p < .0001.
Discussion
The present investigation describes the application of the VasculomicsTM platform technology in the ephedrine/caffeine model. Ephedrine is a strong sympathomimetic agent, which can affect the adrenergic receptors both directly and indirectly. It comprises a α- and β-adrenergic activity, combined with increased release of norepinephrine from sympathetic neurons (Nyska et al. 2005). Therefore, it possesses a systemic vasoconstriction ability (Tong and Eisenach 1992), which usually leads to increased blood pressure (Persky et al. 2004). Its use in humans, mostly as part of the herbal remedy Ephedra, has led to adverse effects involving the cardiovascular and central nervous systems (Asif 2012; Dunnick et al. 2007; Nyska et al. 2005). Caffeine also has a potent vasoconstrictive effect, mediated by blockage of adenosine and stimulation of ryanodine receptors and intracellular Ca2+ release, leading to vasoconstriction (Braun et al. 2001; Broad et al. 2001; Burt 2004; Luo et al. 2001b, 2001a; Luo et al. 2005; Vansal and Feller 1999; Wellman, Miller, and Ho 2003; Bennett, Rodrigues, and Klein 2013). The use of caffeine together with ephedrine was previously used to induce systemic vasoconstriction, and this effect was utilized previously as a model to induce myocardial necrosis (Dunnick et al. 2007; Howden et al. 2005; Nyska et al. 2005). However, the effects of these compounds on kidney vasculature in an ex vivo model have not been previously systematically explored.
The kidney is a highly suitable model for exploring the effects of drug-induced vascular toxicity, considering its rich network of vessels and unique vascular structures (i.e., the glomerulus), and it is for that reason that it has been previously explored as a model for visualization of microvessels (Wagner et al. 2011). These microvessels can be clearly visualized at the surface by scanning electron microscope (Figure 2), and later on, using micro CT, for further analysis of micro-CT-derived 3D image data sets (Folarin et al. 2010; Marxen et al. 2004). Therefore, we explored this model for the evaluation of drug-induced vascular toxicity using corroded vascular casts, which are the only model today for 3D examination of organ microvessles and capillaries. Since the vascular volume of the kidney is highest in the kidney cortex (Garcia-Sanz et al. 1998; Hillman et al. 1982), we focused in our analyses on this region of the kidney. By starting to measure not from the kidney outer surface but from 5 to 10% below the surface, we wanted to avoid introducing surface variations into the measurements. In order to obtain as much information as possible, we utilized a unique image-based vascular analysis software (VasculomicsTM), which allows for precise quantification of different geometric parameters of the kidney vasculature, with great resolution and repeatability. Using this method, it was possible to clearly demonstrate that the most affected vessels were in the 21- to 35-µm diameter range, and further analysis also showed that the most affected region of the kidney is the superficial part of the kidney cortex, mostly at the outer 5 to 10% of the kidney surface. Furthermore, it is possible to show that, while low-dose ephedrine/caffeine possesses moderate constricting abilities, the high-dose ephedrine/caffeine has a much stronger effect, leading to a significant constriction of vessels, including vessels with diameters below 14 µm. Such detailed analysis, which encompasses a specific region of the whole organ, has never before been shown in drug-induced vascular toxicity studies.
Although in this study we evaluated the possibility to use the VasculomicsTM platform for quantifying vasoconstricting effects of drugs, since this platform measures vessel diameter, it can be easily applied also for examination of vascular toxicity of vascular dilators, such as, for example, inhaled nitric oxide (Hess et al. 1997; Siobal and Hess 2010).
The VasculomicsTM platform (which combines capillary perfusion optimization with highly precise 3D vascular and microvascular geometric analysis) enables high-resolution (down to capillaries in preclinical models) 3D analysis of vascular and microvascular beds and detection of microvascular patterns, including subtle but relevant patterns in response to therapy or its toxic effects. Such analysis includes quantification of vascular size, spatial distribution, branching, and global or regional microvessel density, all in full 3D.
These analytical tools can be used to conduct: Automatic tissue discrimination including, discrimination between diseased or adversely affected tissue and healthy, normal tissue. Since VasculomicsTM uses pattern detection and recognition, it would be possible in future developments to identify morphologic vascular injury by assessing a variety of vascular shapes and by looking in disruptions in the organized vascular trees; automatic, precise, and repeatable quantitative vascular geometric assessment of: Diseased tissue within an organ and its response to therapy Healthy tissue affected by toxic substances.
Examples of drug/toxic substance effects detectable with VasculomicsTM include the following: Detection of microvascular subpopulations targeted by specific drugs or toxic substances; Detection of spatial therapeutic or toxic effects in an organ or a diseased tissue within an organ (e.g., therapeutic effects as a function of distance from organ/diseased tissue periphery to its center). In the future, it will also be possible to automatically distinguish between glomeruli and intertubular regions inside the kidney, thus allowing much higher resolution when assessing drug-induced vascular toxicity.
The above tasks can be accomplished with higher insight, sensitivity, and specificity over conventional vascular analysis methods, such as, histology or immunohistochemistry, which is 2-dimensional and allows for only a few slides from select locations of the organ.
The above-mentioned advantages of VasculomicsTM have been previously harnessed to quantify the mechanism and efficacy of discovery-stage anticancer compounds, specifically Bevacizumab and sunitinib, in Colo205 human colorectal cancer xenograft model (Brauner et al. 2013). Such analysis provided important mechanistic and efficacy insights into the vascular effects of these compounds, by quantifying the decrease in total tumor MVD and revealing the exact diameter of vessels affected by these drugs. Although detailed information regarding the entire vascular tree can be obtained from the use of corroded vascular casts combined with analysis by 3D analysis tools, this technique has several limitations. High-resolution analysis of microvessels and capillaries obtained here is currently restricted to the vascular cast model and cannot be currently used for visualization and quantification of dynamic in vivo changes in vessels in this size range.
Additionally, in the past, researchers reported that the possible inclusion of air bubbles in the casting resin or cast shrinkage upon polymerization (van den Wijngaard et al. 2013) were potential sources of error. In the current analysis, however, significant “holes” in casts were not observed and perfusion of glomeruli appeared to be complete.
It is also believed that anesthesia and the euthanasia procedures, which are obligatory as part of the humane care of animals, might have affected vascular tone, probably by inducing vascular relaxing effects (Yu et al. 2004). Such changes are also thought to be strain-dependent (Zuurbier, Emons, and Ince 2002). Therefore, it is important that all experiments will be performed with appropriate controls, using the same mice strain.
This study demonstrates that the impact of a drug combination with known vascular toxicity, ephedrine/caffeine, can be quantitatively assessed to provide a characteristic “signature” of microvascular changes. This technique may enable investigators to identify more subtle microvascular characteristic changes induced by drugs or disease processes that would otherwise be undetectable by existing methods. It can also be applied to examine drug-induced vascular toxicities in other organs, such as the heart, the central nervous system, or the liver. We expect the ability to have a global and local analyzable and quantifiable 3D picture and source of geometric data from microvessels to open new avenues of investigation and provide valuable information in preclinical studies of drug mechanism and toxicity.
Footnotes
Acknowledgments
We would like to acknowledge and extend our heartfelt gratitude to Mr. Josh Sung and Mr. Yanchun Wu for their support that made the completion of this article possible.
Authors’ Note
Yuval Ramot, Raul Brauner, Kongbin Kang and John V. Heymach contributed equally to this article.
The author(s) declared the following potential conflicts of interest with respect to the research, authorship, and/or publication of this article: Raul Brauner and Kongbin Kang, are employees of Bio-Tree Systems, Inc. John V. Heymach is Bio-TreeTM cofounder and Acting Chief Medical Officer. Stacia Furtado is a consultant to Bio-Tree on the animal portion of Bio-Tree’s studies and a member of Brown University research staff. Abraham Nyska serves as a consultant for Bio-TreeTM. Yuval Ramot has received an honorarium from Bio-TreeTM.
The author(s) disclosed receipt of the following financial support for the research, authorship, and/or publication of this article: The study was funded by Bio-TreeTM.