
Abstract
The safety of Aquaflor® (50% w/w florfenicol [FFC]) incorporated in feed then administered to tilapia for 20 days (2× the recommended duration) at 0, 15, 45, or 75 mg/kg body weight/day (0, 1, 3, or 5× the recommended dose of 15 mg FFC/kg BW/d) was investigated. Mortality, behavioral change, feed consumption, body size, and gross and microscopic lesions were determined. Estimated delivered doses were >96.9% of target. Three unscheduled mortalities occurred but were considered incidental since FFC-related findings were not identified. Feed consumption was only affected during the last 10 dosing days when the 45 and 75 mg/kg groups consumed only 62.5% and 55.3% of the feed offered, respectively. There were significant, dose-dependent reductions in body size in the FFC-dose groups relative to the controls. Treatment-related histopathological findings included increased severity of lamellar epithelial hyperplasia, increased incidence of lamellar adhesions, decreased incidence of lamellar telangiectasis in the gills, increased glycogen-type and lipid-type hepatocellular vacuolation in the liver, decreased lymphocytes, increased blast cells, and increased individual cell necrosis in the anterior kidney, and tubular epithelial degeneration and mineralization in the posterior kidney. These changes are likely to be of minimal clinical relevance, given the lack of mortality or morbidity observed. This study has shown that FFC, when administered in feed to tilapia at the recommended dose (15 mg FFC/kg BW/day) for 10 days would be well tolerated.
Introduction
Aquaflor®, a feed premix containing the antibiotic florfenicol (FFC) at a concentration of 50% (w/w), is presently registered for use globally in Brazil, Canada, Chile, China, Columbia, Costa Rica, Ecuador, Honduras, Japan, Norway, Philippines, United Kingdom, United States, Venezuela, and Vietnam for the treatment of susceptible bacterial diseases in several fish species. FFC is a fluorinated analog of thiamphenicol (Fukui, Fujihara, and Kano 1987) specifically developed for use in veterinary medicine with registered uses in fish and large animal medicine (e.g., Nuflor). In fish, FFC is administered in medicated feed for 10 consecutive days at doses of 10 or 15 mg/kg body weight (BW)/d.
Worldwide, tilapia (Oreochromis sp.) are the most widely grown of intensively reared farmed fish (farmed in at least 85 countries) and second only to carp in importance (Burden 2011). Streptococcal disease is an important disease in tilapia and other farmed finfish (Agnew and Barnes 2007); streptococcal outbreaks combined with severe winter weather were linked to a decrease in Chinese tilapia production of nearly 13% in 2010. FFC has been successfully used to control Streptococcus iniae in both laboratory and clinical outbreaks in Nile Oreochromis niloticus × O. niloticus or hybrid O. niloticus × O. aureus tilapia and sunshine bass Morone saxatilis × M. chrysops (Bowker et al. 2010; Darwish 2007, 2010; Gaunt et al. 2010). In those trials, FFC administered in medicated feed at a dose rate of 15 mg/kg BW/d for 10 consecutive days significantly reduced mortality compared to untreated controls. FFC has been developed to control streptococcus disease in warmwater fish.
Although target animal safety data were available to describe the effects of administration of FFC-medicated feed to Atlantic salmon Salmo salar (Inglis et al. 1991) and channel catfish Ictalurus punctatus (Gaikowski et al. 2003), similar data were not available for a scaled, warmwater finfish such as tilapia until recently when data were developed in sunshine bass (Straus et al. 2012) and yellow perch Perca flavescens (J. Bowker, U.S. Fish and Wildlife Service, personal communication, April 10, 2012). Target animal safety data are a required part of the drug registration process in most countries and the lack of data available to demonstrate the potential effects of FFC-medicated feed administration in tilapia limited its registration to control susceptible bacterial pathogens. The subject study was thus conducted in which juvenile tilapia were fed FFC-medicated feed for 20 consecutive days (2× the proposed 10-day treatment duration) at target doses of 0 (control), 1, 3, and 5× the recommended dose rate of 15 mg FFC/kg BW/d. Since drug metabolism is considered to be temperature dependent in poikilotherms and xenobiotic toxicity is generally greater at higher temperatures, the study was conducted at 29°C
Materials and Methods
Test Fish
All procedures involving test fish were reviewed and approved by the Upper Midwest Environmental Sciences Center (UMESC) Animal Care and Use Committee. A single lot of (∼2,200, ∼40-day-old tilapia) pure Nile and hybrid tilapia were received from Aquasafra, Inc. (Lakewood Ranch, FL). As fry, Aquasafra fed these fish feed containing 17α-methyltestosterone to produce a phenotypic male tilapia population. Pure and hybrid Nile tilapia are commonly reared in mixed culture in U.S. aquaculture. No attempt was made to segregate tilapia gender or strain in this study, and all fish were used regardless of gender or strain; strain was assessed visually and recorded at necropsy but was not considered a useful predictor of treatment outcome. The fish did not possess individual identifying marks on receipt nor at transfer to the test tanks; each fish was assigned a unique number when individual information was collected on that fish (e.g., when a fish died during the course of the study or when fish were euthanized on the day of scheduled necropsy). Tilapia were housed in two circular fiberglass holding tanks and fed standard nonmedicated tilapia diets (Rangen, Inc. Buhl, ID) prior to assignment to the test tanks.
Eight days prior to dosing, 300 tilapia (∼107-day-old) were transferred to 15 circular fiberglass test tanks (∼0.55 m diameter, ∼0.46 m depth, ∼80 L volume), which received continuous flow well water supplied at a constant temperature of 29°C
Behavioral responses and clinical observations were noted daily during the acclimation and dosing periods before tank cleaning. Normal behaviors included swimming to the top of the water column when a person was present (presumably a feeding-habituated response) and aggressive feeding behavior directed toward water chemistry probes placed into the test tanks. Abnormal behavior was generally described as subdued, that is, fish in the tank generally did not exhibit any of those behaviors characterized as normal. Feeding activity was visually assessed after each feeding (three times daily) during the acclimation and dosing periods. Feeding activity was recorded as active (fish immediately fed on pellets after offering and consume 50% to 100% of feed offered), average (consume <50% of feed offered), or inactive (fish not responsive to feeding, do not take pellets from surface, or are not observed to feed within 5 min of placing feed into tank). Clinical observations were noted daily during the acclimation and dosing periods and were limited to gross observations of discoloration on external surfaces and clinical indication of disease.
Study Design
The study was designed to determine the safety of FFC-medicated feed fed at target doses of 0, 1, 3, or 5× times the recommended dose rate of 15 mg FFC/kg BW/d, equating to nominal dose rates of 0, 15, 45, or 75 mg/kg BW/d, respectively. The FFC-medicated or nonmedicated control test diets were offered as the sole ration for 20 consecutive days (twice the proposed 10-day treatment duration). The study was conducted in 15 replicate test tanks supplied with temperature-controlled water. Treatments were assigned to tank according to a randomized-block design consisting of three blocks with five tanks per block. The fifth tank in each block was used to monitor fish growth to adjust feed rates for fish growth every fifth day during the 20-day study period; fish in these “fish growth” tanks were fed the nonmedicated control diet. There were three tanks per treatment group with one tank per treatment group per block. The experimental unit was the individual tank to which 20 fish were assigned. Fish were selected for necropsy according to a completely randomized selection code prepared for each tank.
Masking of treatment assignment was accomplished by separation of function. With the exception of the “fish growth” tanks, study personnel collecting data (e.g., mortality, water chemistry, offering feed, assessing feed consumption or behavior, or conducting gross necropsy) were unaware of treatment assignment. Masking of treatment assignment was broken only after all fish had been euthanized and scheduled necropsy samples were collected. The study pathologist received a copy of the treatment code prior to the histopathological examination of tissues.
The fish were fed with the nonmedicated control feed or one of the three FFC-medicated feed levels as the sole feed source during the 20-day dosing period. All remaining live fish were euthanized 1 day after the end of the dosing period. The following procedures were performed each day during the acclimation and dosing period. Test tanks with live fish present were cleaned daily about 1 hr before the first feeding. Fish were observed daily for mortality before tank cleaning.
The fifth test tanks per block were designated as “fish growth” tanks and were fed the nonmedicated feed during the acclimation and dosing periods as the sole diet. Fish in the “fish growth” tanks were only used to determine growth during the acclimation and dosing periods so that the mass of feed offered to test fish could be adjusted to accommodate fish growth. The use of the “fish growth” tanks precluded handling test fish, thus avoiding potential decreases in feed consumption in test fish associated with handling. These fish were weighed individually during allocation to the test tanks then en masse the day prior to dosing and on dosing days 4, 9, and 14. All weights were determined by placing the fish into a container of water whose weight had been tared from a calibrated balance. The change in mean fish weight in the “fish growth” tanks was then applied to the estimated mean weight of fish in the test tanks to increase the feed mass offered.
Feed Preparation and Evaluation
The four experimental feeds (∼680 kg each) were prepared at Delta Western Research Center (DWRC; Indi-Bel, Inc., Indianola, MI). The nonmedicated control feed was formulated first and was similar to tilapia feed formulations commercially prepared for use in the United States. The same formula and ingredients (soybean meal, wheat middlings, corn, poultry by-product, vitamin and mineral premixes, menhaden oil) were used for producing the three medicated feeds except that Aquaflor Type-A Medicated Article premix (50% FFC [R-(R*,S*)-2,2-dichloro-N-[1-(fluoromethyl)-2-hydroxy-2-[4-(methylsulfonyl)phenyl)ethyl] acetamide] w/w; Intervet Inc.) was included at rates sufficient to dose fish at 15, 45, or 75 mg/kg BW/d when fed at 2% BW/d. The calculation to determine the target feed FFC concentration was

The target feed FFC concentrations prepared were therefore 750, 2,250, and 3,750 mg FFC/kg feed. Medicated feed batches were produced in order of increasing FFC concentration. Approximately, 113 kg of the nonmedicated control diet and each medicated diet was transported to UMESC. Nonmedicated and medicated diets were stored at UMESC at ambient temperature for about 40 days and then stored at ∼−20°C to extend the feed expiry. Aliquots of the nonmedicated control and FFC-medicated feed used during the dosing period were withdrawn from frozen bulk storage, placed into separate bulk storage bags assigned to a specific test tank, and stored under ambient conditions until fed; the bags holding an aliquot of feed were only labeled with test tank assignment so as to maintain masking of treatment assignment.
FFC concentration was confirmed in samples collected from each experimental diet at three time points: (1) after preparation, (2) at the initiation of the dosing period, and (3) at the completion of the dosing period. The samples to determine feed FFC concentration at the completion of the dosing period were taken at the initiation of dosing and then stored under the same conditions as the feed offered during the dosing period. A 200- to 300-g subsample was taken (from the approximate top, middle and bottom of feed bags) from selected bags of each diet then aggregated together into a ∼600-g sample by diet. Each ∼600-g sample was hand mixed and then split into two ∼300-g aliquots. One aliquot was submitted for FFC determination and the other reserved at ∼−80°C at UMESC. The mean feed FFC concentration was determined from feed FFC concentrations determined at the initiation and completion of dosing and was used to estimate the daily and total delivered dose. FFC concentrations were determined by high-performance liquid chromatography at Eurofins AvTech Laboratories (Kalamazoo, MI) using methods derived from Hayes (2005); analyses conformed to good manufacturing practice (GMP) regulations (21 CFR Part 225). FFC was not detected in any nonmedicated feed samples. The mean FFC level in the medicated feed was 82.8%, 90.8%, and 91.8% of the target feed FFC concentration (target FFC concentrations were established for a protocol target 2% BW/d feed rate) for the 15, 45, and 75 mg/kg BW dose groups and remained stable through the dosing period. Feed FFC concentrations are summarized in Table 1.
Florfenicol (FFC) concentration determined in the four experimental diets prepared to administer, through voluntary feeding, FFC at target daily doses of 0, 15, 45, and 75 mg/kg body weight (BW)/d.
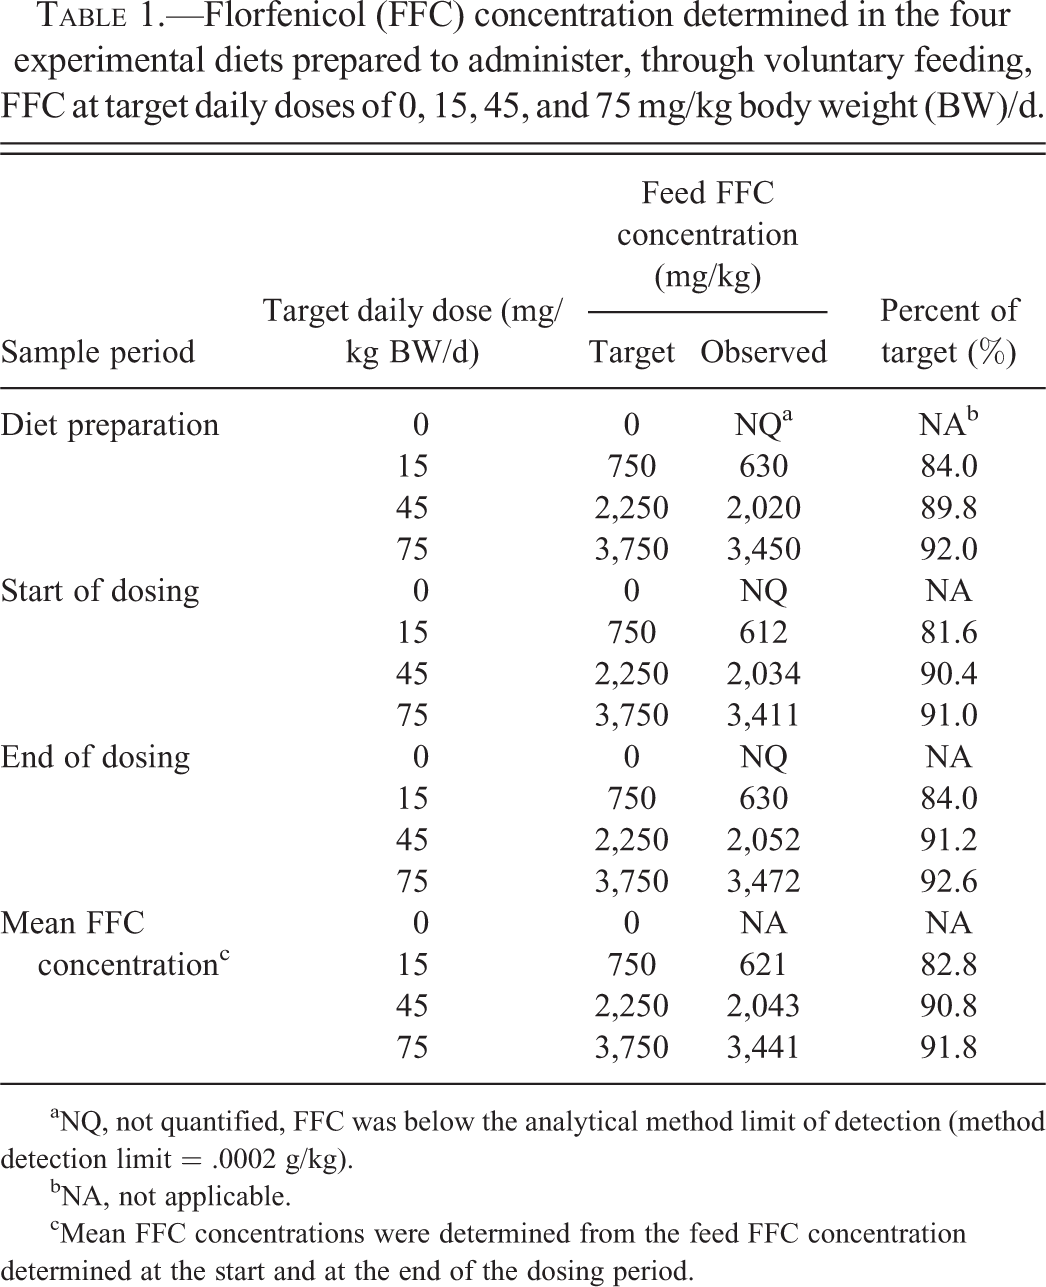
aNQ, not quantified, FFC was below the analytical method limit of detection (method detection limit = .0002 g/kg).
bNA, not applicable.
cMean FFC concentrations were determined from the feed FFC concentration determined at the start and at the end of the dosing period.
Two ∼4-kg samples of the nonmedicated feed representative of the nonmedicated feed lot were taken after preparation and split into four ∼2-kg aliquots. Two aliquots were shipped to Eurofins Scientific Inc. (Des Moines, IA) and the others retained at UMESC at ∼−80°C. Two additional ∼1-kg samples of the nonmedicated feed were taken concurrent with the end of the dosing period and split into four ∼0.5-kg aliquots. Two aliquots were shipped to Eurofins Scientific Inc. and the others were retained at UMESC at ∼−80°C. One sample at each time point was analyzed for proximate nutrient content and the other for potential contaminants. Proximate nutrient assays (e.g., ash—8.5%, carbohydrates—40.3%, crude fat—7.7%, fiber—3.7%, moisture—7.8%, protein—35.7%) completed on the sample taken after preparation indicated that the feed formulation was similar to commercial tilapia feed formulations. Potential organic and inorganic contaminants (oxytetracycline, Romet [sulfadimethoxine + ormetoprim], chlorinated hydrocarbons, and organophosphates, N-methyl carbamates, arsenic, cadmium, lead, mercury, oxidized lipids, and aflatoxin) surveyed in the sample taken after preparation were below the assay limits of detection or quantitation or were otherwise not at levels of concern.
The last dosing day (the last day that the experimental diets were administered to tilapia through voluntary feeding) was within 82 days of preparation of the experiment diets. Proximate and contaminant analyses of the samples taken at the end of the dosing period indicated that ascorbic acid levels remained constant and that oxidized lipid levels had not changed appreciably during feed storage.
Dose Administration and Calculated Delivered Dose
FFC was delivered through voluntary feeding. Although the medicated feeds were prepared assuming a feeding rate of 2% BW/d, we chose to adjust the actual feed rate used during dosing based on the FFC concentration in the medicated feed prepared for the 15 mg/kg BW dose group to deliver ∼100% of the FFC dose to the 15 mg/kg BW dose group. The nonmedicated and FFC-medicated feeds were therefore offered at the slightly increased rate of 2.4% BW/d, a rate sufficient to deliver ∼100% of the target dose to the 15 mg/kg BW dose group when fed medicated feed with an FFC concentration of 630 mg/kg (630 mg FFC/kg feed × 2.4% BW/d = 15.12 mg FFC/kg BW/d). Nonmedicated or FFC-medicated feeds were offered as the sole diet for 20 consecutive days.
The amount of feed offered was calculated separately for each tank based on the estimated biomass in that tank; tank biomass was adjusted every 5 days based on the growth observed in the “fish growth” tanks and to account for unscheduled mortality. Feed was preweighed and stored in sealed containers at ambient temperature for 1 to 4 days during the dosing period. The daily ration was divided into three approximately equal portions and fed by hand three times a day. The first feeding was given at least 1 hr after tank cleaning. The second and third feedings were each offered 4 hr after the previous feed.
Feed consumption was determined daily during the last 5 days of acclimation and daily during the dosing period. Feed remaining in the tank ∼1 hr after each feeding was siphoned from the tank into a preweighed container. After the uneaten feed from the final feeding of the day was collected, the preweighed container and feed were dried (60°C–75°C) overnight and then weighed the following morning. A conversion factor (0.8154) was applied to the recovered uneaten feed mass to estimate the original mass of the uneaten feed. Eighteen feed samples (three samples each of 1, 5, and 10 g of the control and high-dose feed) were immersed in UMESC well water at ∼29°C for 1 hr. The portion of mass loss during immersion (the conversion factor) was determined by dividing the feed mass determined after immersion and drying of the feed sample by its original mass before immersion. The overall mean conversion factor was used in all calculations because of the minimal difference in the conversion factor determined for the control (0.8120) and high-dose medicated feed (0.8187).
The calculated delivered dose of FFC was determined based on the amount of feed consumed (feed consumed = feed offered − feed recovered), the fish mass, and the feed FFC concentration. The calculated delivered dose was determined using the following calculation:
The superscript number 1 denotes that FFC feed concentration was determined based on the FFC feed concentration determined in samples collected before and after dosing (Table 1).
Necropsy and Pathology of Test Subjects
Test tanks were daily checked for dead or moribund fish. Three unscheduled mortalities occurred during the dosing period and were subjected to gross necropsy. Tissues were collected from two of the three unscheduled mortalities; the third preserved specimen was found entangled in the netting covering the test tank to which it was assigned and considered too desiccated to provide tissues adequate for histopathological evaluation.
The day after the last dosing day (the scheduled necropsy day), all fish remaining in the test tanks and “fish growth” tanks were euthanized. All fish in a test tank were removed as a group, immobilized by immersion in ice water then euthanized by cervical severance (Close et al. 1996, 1997). Fish were indiscriminately (based on the order removed from the ice bath) assigned a unique sampling number and then weighed and the total length (TL) was recorded. With the exception of the “fish growth” tanks, 10 fish from each test tank were randomly selected for gross necropsy and tissue sample collection in accordance with a random selection code. Those fish not selected for necropsy, including all fish assigned to the “fish growth” tanks, were subjected to gross external examination.
Standard necropsy procedures were used to collect tissue samples from fish selected for necropsy. Scheduled necropsies were performed under the supervision of the board-certified study pathologist. The study pathologist and prosectors were unaware of treatment assignment during necropsy of test fish and collection of tissue samples. The following list of tissues were collected from 10 fish randomly selected for necropsy from each test tank (excluding “grow out” fish): gill arch, eye, brain, heart, skin and muscle, stomach, intestine (hepatic loop and distal major coil), liver, spleen, anterior kidney, posterior kidney, and gross lesions (as needed). Harvested tissues and the residual carcass of each fish were placed in an individual liter container of modified Davidson’s fixative (Fournie, Krol, and Hawkins 2000) for 48 to 72 hr before transfer to 60 to 70% (v/v) ethanol. Tissues that contained bone, such as the brain (partially encased by the skull), gill arch, eye (bony sclera), skin (bony scales), and posterior kidney (attached to the spine) were decalcified for ∼16 to 23 hr in a commercial formic acid/ethylenediaminetetraacetic acid (EDTA) solution (Formical-2000, Decal Chemical Corporation; Tallman, NY). All collected tissues were then processed to 4- to 6-µm thick, paraffin-embedded, H&E-stained sections on glass slides according to routine histopathologic methods.
The study pathologist was aware of the identity of the different treatments and any clinical signs observed for each fish during histopathologic sample examination. The following tissues were the subject of histopathological examination of all selected fish: gill arch, liver, and anterior and posterior kidney and gross lesions (if collected). Two fish from each tank were randomly identified for histopathological examination of the following additional tissues: brain, eye, heart, muscle with attached skin, spleen, stomach, and intestine (hepatic loop and distal major coil). Tissues from the nonmedicated control group and 75 mg/kg BW dose group were examined first. If treatment-related histopathological changes were not observed in a tissue, then no further examination of those tissues were completed. Tissues of fish from the 45 or 15 mg/kg BW dose groups were evaluated when treatment-related histopathological changes were observed in the 75 or 45 mg/kg BW dose groups, respectively.
Lighting and Water Conditions/Chemistry
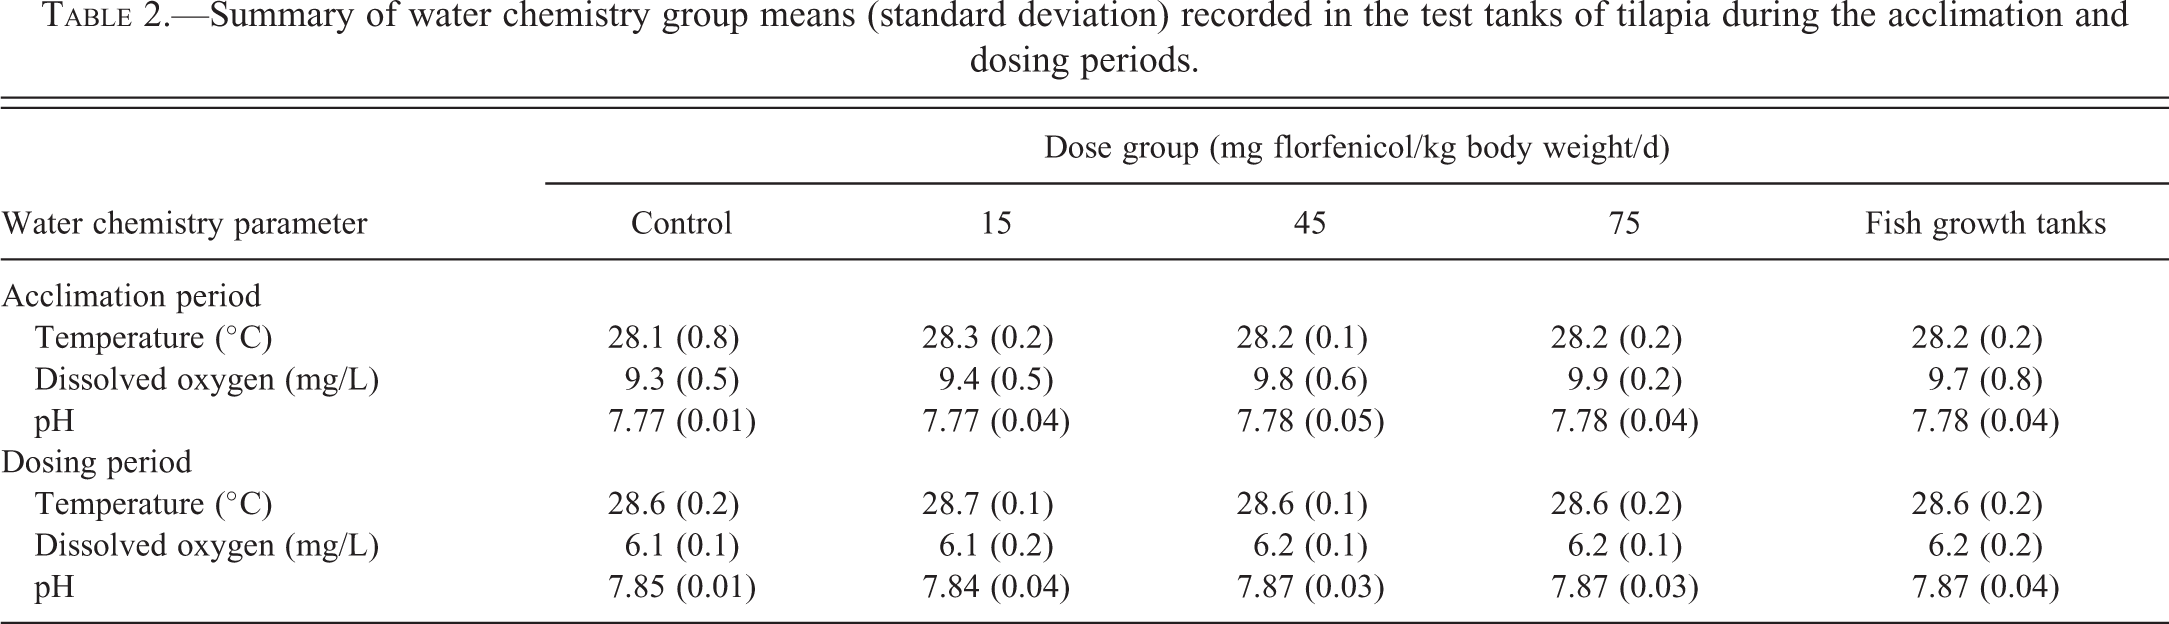
Water chemistry (dissolved oxygen, temperature, and pH) was measured daily concurrent with tank cleaning. Light intensity was measured over each tank on the first and on the final day of dosing and alkalinity and hardness in water samples are taken from the growth tanks on dosing days 4, 9, and 18. The mean test tank temperature of the treatment groups during the dosing period ranged from 28.6°C to 28.7°C (Table 2) and was well within the targeted 29°C
Summary of water chemistry group means (standard deviation) recorded in the test tanks of tilapia during the acclimation and dosing periods.
Data Analysis
Gross and microscopic pathological findings were tabulated to determine incidence and severity of changes. Statistical analyses of unscheduled mortality and gross lesions were not performed because of the paucity of observed findings.
The variation in BW and weight gain and total fish length as a function of treatment assignment was analyzed by analysis of variance (ANOVA). The variation in feed consumption as a function of the interaction between treatment and block assignment was analyzed using mixed-model ANOVA for repeated measures. Pairwise comparison tests compared each FFC treatment group to the nonmedicated control group using unadjusted least squares means as needed. Statistical significance was observed at p < .1.
Good Laboratory Practices
All phases of this study were conducted in compliance with U.S. Food and Drug Administration guidelines for Good Laboratory Practice Standards (21 CFR 58) with the following exceptions: feed preparation; determination of FFC in test feed; determination of nutrients and possible contaminants in test feed; determination of possible contaminants in test water.
Results
Mortality
There were no mortalities during the acclimation period. There were three mortalities during the dosing period, one in each FFC dose group. The mortality that occurred in the 15 mg/kg BW dose group was not considered to be related to FFC administration since the fish was found dead entangled in the netting suspended over the test tanks. Although gross necropsy was completed and tissue samples were reviewed for histopathological changes for the other two mortalities, the cause of death of the unscheduled mortality in the 45 mg/kg BW dose group on dosing day 13 and the unscheduled mortality in the 75 mg/kg BW dose group on dosing day 16 could not be definitively determined. Because test article–related histopathlogical lesions were not observed in these fish, they were considered incidental.
Medicated Feed Consumption and Calculated Delivered Dose
FFC dose and dose duration significantly affected daily feed consumption (Figure 1) during the dosing period (df = 57; F = 6, p < .01). There were no significant differences in medicated feed consumption in the different treatment groups during the first 10 dosing days (dosing days 0–9). However, during the last 10 dosing days (dosing days 10–19) there was a statistically significant decrease in feed consumption in the 45 and 75 mg/kg BW dose groups (df = 83.4, t
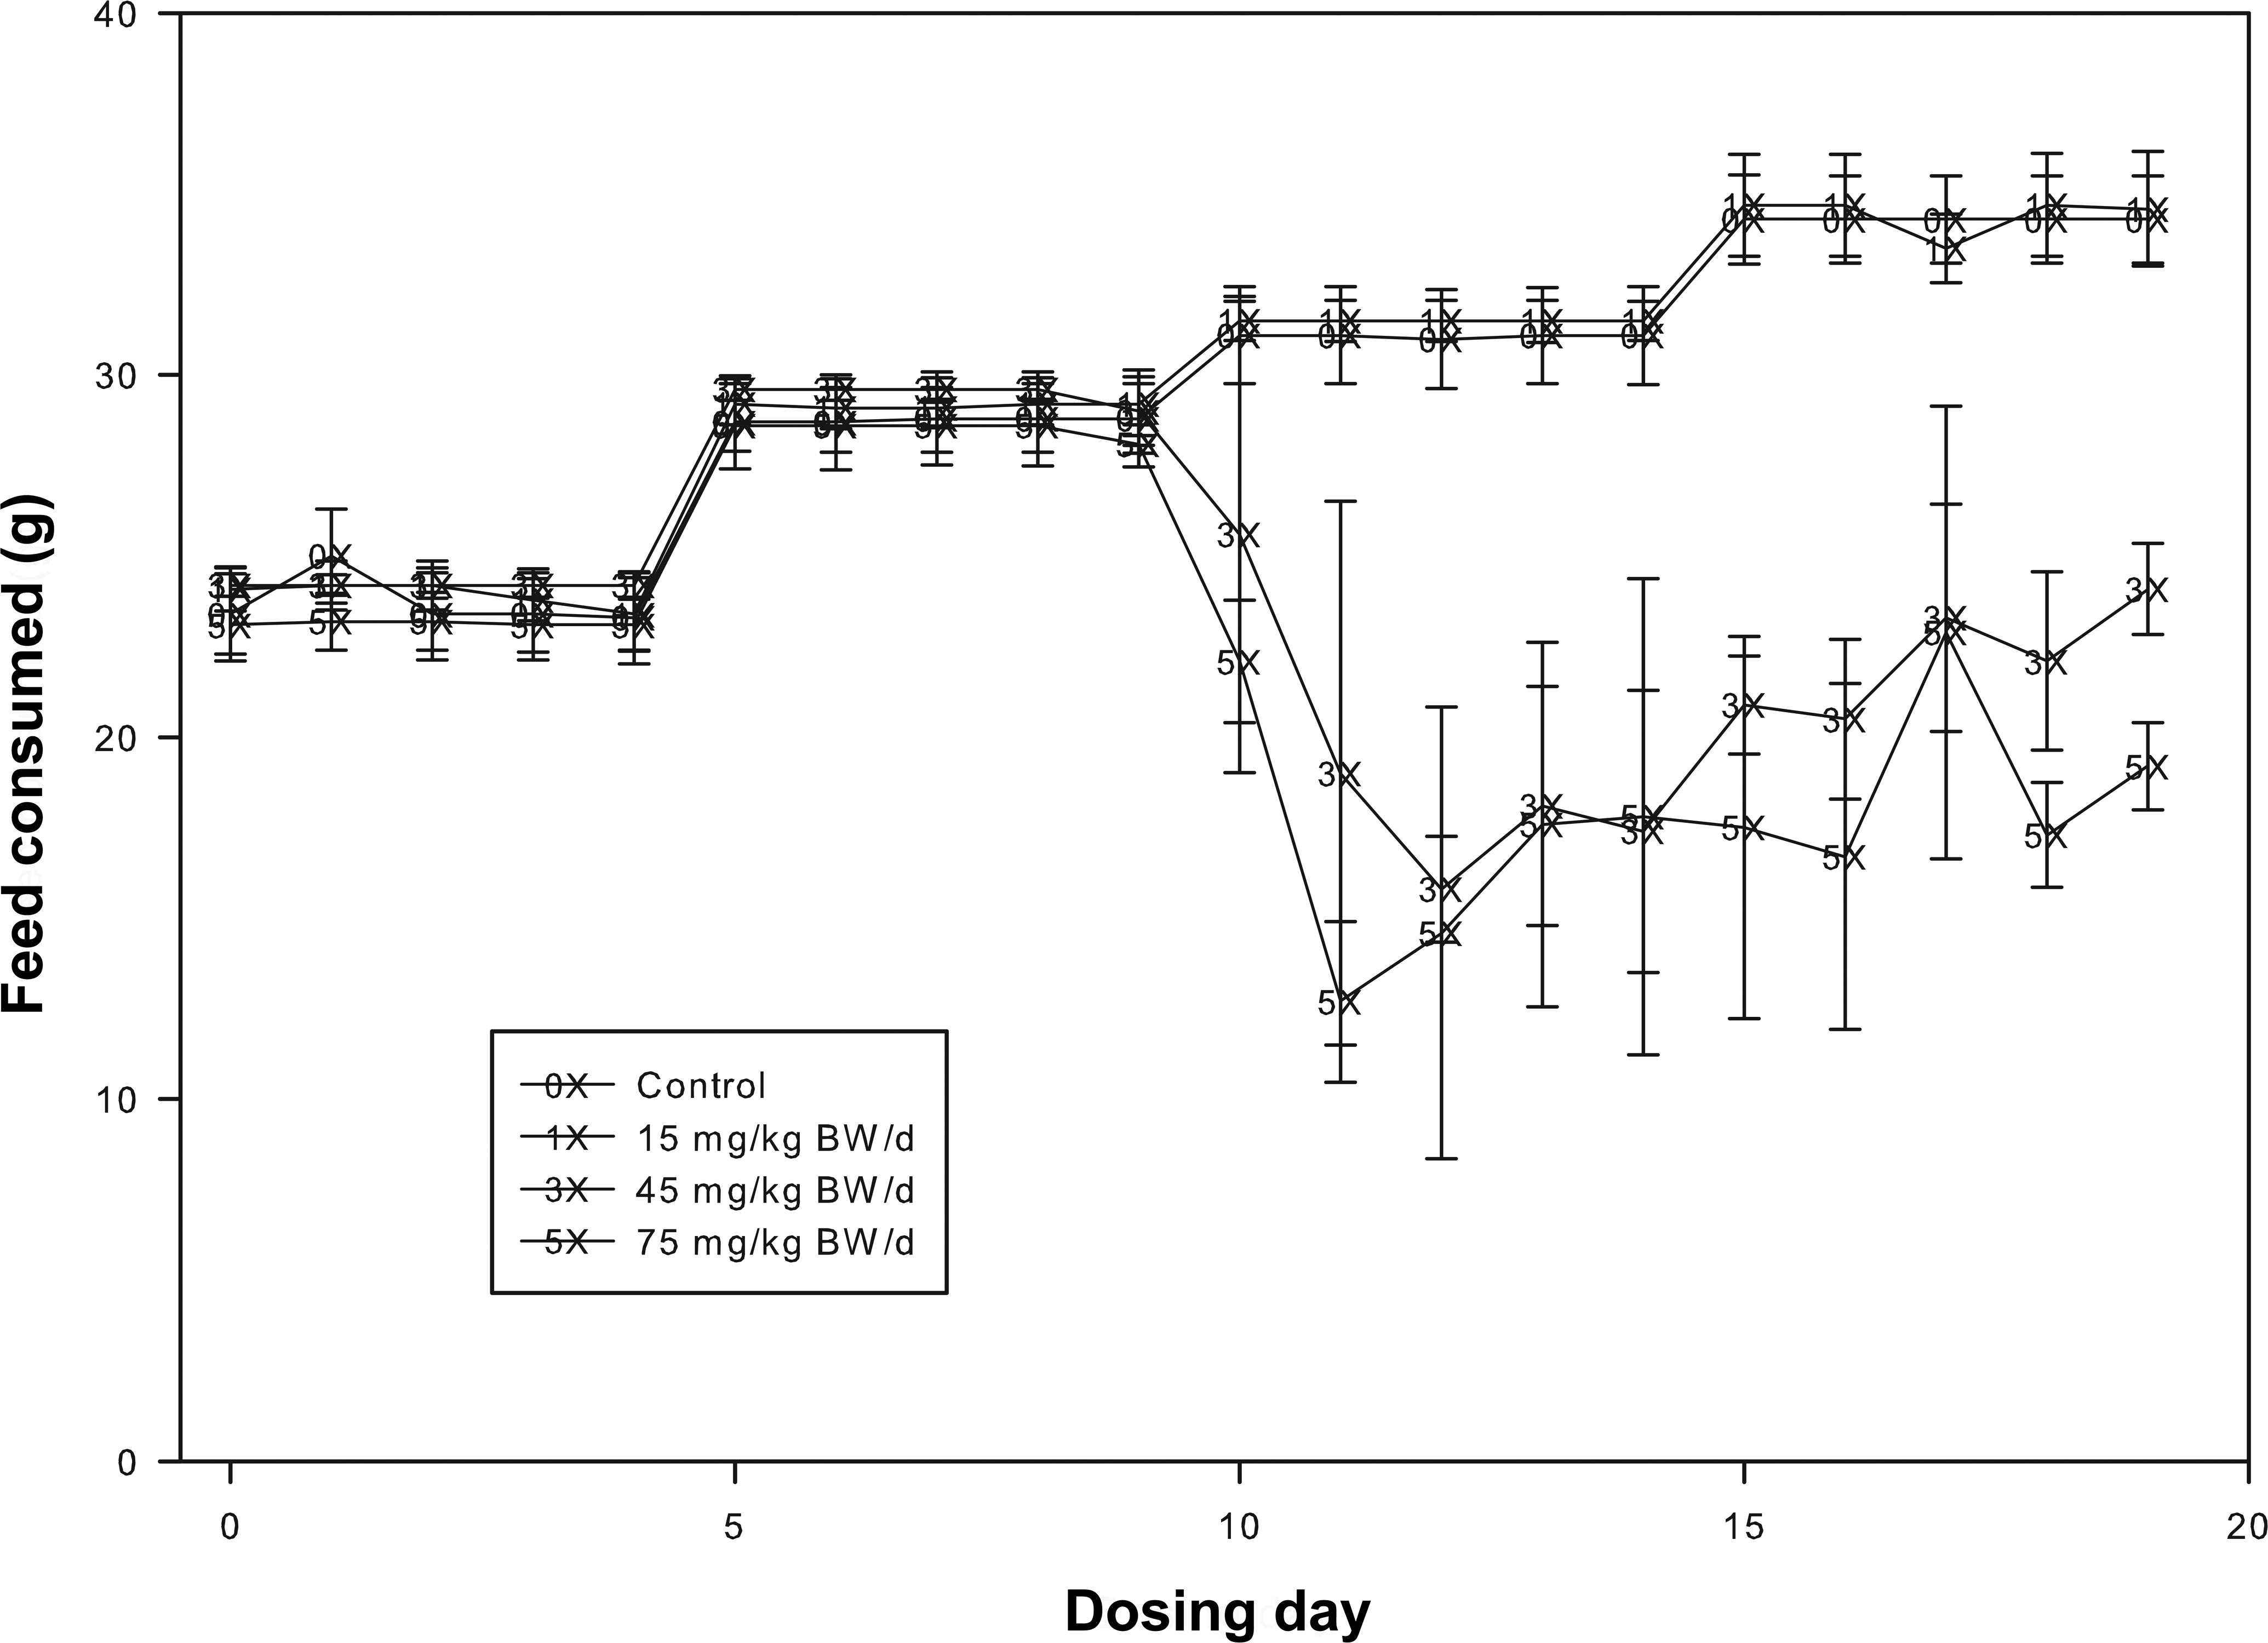
Mean feed consumption (bars represent standard deviation) of tilapia offered florfenicol (FFC)-medicated feed to achieve dose rates of 0, 15, 45, or 75 mg FFC/kg body weight (BW)/d for 20 consecutive days.
The mean daily delivered FFC doses were 0, 15.01 (100.1% of target), 43.87 (97.5% of target), and 72.65 (96.9% of target) mg/kg BW/d. The mean total delivered doses over the 20-day dosing period were 0, 300.2, 877.4, and 1,453 mg/kg BW. The daily delivered FFC dose was lower between dosing day 10 to 19 concomitant with the decreased feed consumption by tilapia in the 45 and 75 mg/kg BW dose groups. However, because there were higher daily FFC doses (105–126% and 108–131% of target, respectively, for the 45 and 75 mg/kg BW dose groups) from dosing day 0 to 9 in these two dose groups, the mean daily and total delivered doses in the 45 and 75 mg/kg BW dose groups remain within ∼3% of the target dose.
Growth
There was a test article–related, statistically significant, dose-dependent decrease in the mean BW and weight gain of tilapia at the end of the dosing period (df = 3, F = 43.2, p = .01; Table 3). Though significant, the BW of the 15 mg/kg BW dose group was only ∼3% less than that of the control group at the end of the dosing period. The BW of the 45 and 75 mg/kg BW dose groups were ∼16% and 23% lower than that of the control group at the end of the dosing period. BW gain of the control group (34.5 g) during the study period was significantly greater (df = 2, t
Mean body weight and total length (standard deviation) of test fish at assignment to test tanks and terminal sampling.
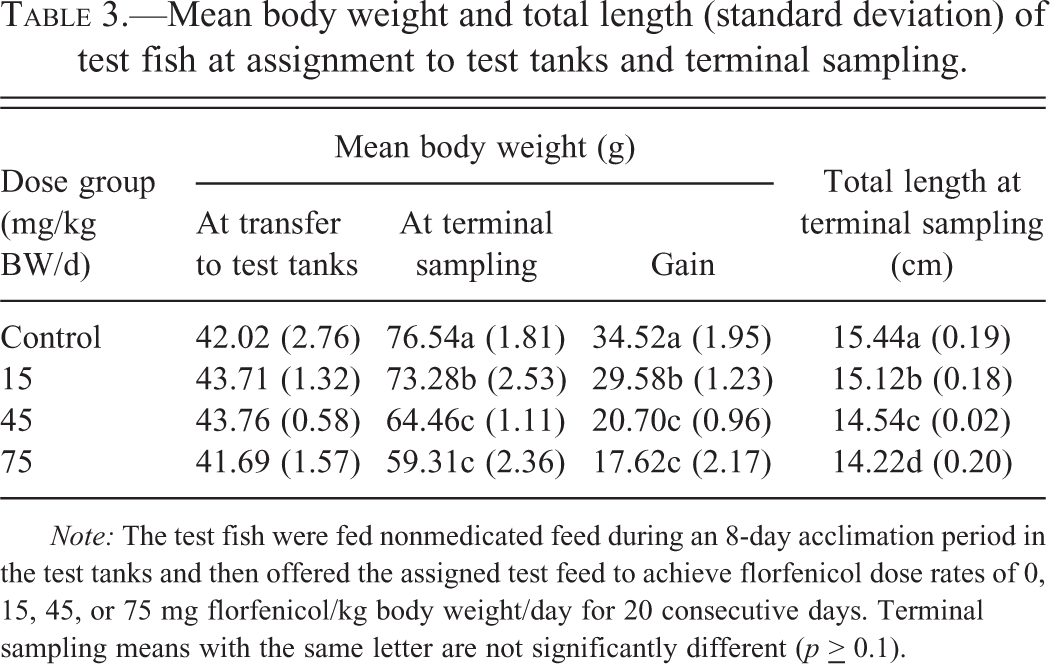
Note: The test fish were fed nonmedicated feed during an 8-day acclimation period in the test tanks and then offered the assigned test feed to achieve florfenicol dose rates of 0, 15, 45, or 75 mg florfenicol/kg body weight/day for 20 consecutive days. Terminal sampling means with the same letter are not significantly different (p
There was a test article–related, statistically significant, dose-dependent decrease in the mean TL of tilapia at the end of the dosing period (df = 3, F = 33.6, p < .01; Table 3). The mean TL of the nonmedicated control group (15.4 cm) was significantly (df = 6, t
Behavioral and Clinical Observations
Abnormal behavior was not observed during the acclimation period in any tank. Test article–related increased frequency of subdued behavioral responses was noted in all treated groups by the end of the dosing period. Subdued responses were noted only in the 45 and 75 mg/kg BW dose groups intermittently during the first 10 days of dosing. Even when subdued behavior was identified during the first 10 days of dosing, no tank had more than 2 days in which the fish displayed a subdued response. The frequency with which fish were characterized as having a subdued response increased during the last 10 days of dosing in a dose-dependent manner. The average days per tank that fish were characterized as subdued during the last 10 dosing days were 1.3, 4.7, and 9 days for the control and 15, 45, and 75 mg/kg BW dose groups, respectively.
There were a total of 60 feeding activity observations recorded per tank during the dosing period (3 feeding periods/days × 20 dosing days). There were no observations of inactive feeding at any dose levels. The prevalence of average feeding was greater in the 45 and 75 mg/kg BW dose groups (5 and 9 recordings of average feeding activity per tank, respectively) than in the control and 15 mg/kg BW dose groups (1 recording of average feeding activity per tank). Most ratings of average feeding activity were recorded during the last half of the dosing period.
Abnormal clinical signs were not observed during the acclimation period. Clinical observations during the dosing period were limited to gross observations of discoloration on external surfaces. The most common abnormal clinical sign was a mild reddening of the jaw epithelium which manifested during the last 4 days of the dosing period. This sign was observed in all treatment groups but was slightly more prevalent in the 45 and 75 mg/kg BW dose groups. The finding was considered to be of minimal clinical significance as it was not noted grossly during scheduled necropsy. Two fish in one tank assigned to the 75 mg/kg BW dose group were also noted to have abnormal coloration. This finding was also considered to be of minimal clinical significance as it was not noted grossly during scheduled necropsy.
Pathology
There were no FFC-related gross lesions noted in this study. The small number of incidental gross findings recorded at necropsy affected relatively few fish and were no more prevalent in FFC-treated fish as compared to controls. Test article–related microscopic findings extended from the 75 mg/kg BW dose group down to the 15 mg/kg BW dose group and were observed in the following tissues: gill, liver, anterior kidney, and posterior kidney. There were no FFC-related microscopic findings in scheduled mortalities from the 0 or 75 mg/kg BW dose groups in the following issues: brain, eye, heart, intestine (hepatic loop or distal major coil), muscle/skin, and stomach.
The principal test article–related microscopic findings in the gill (note: primary lamellae were termed filaments and secondary lamellae were termed lamellae) included increased lamellar epithelial hyperplasia (LEH; moderate) and lamellar adhesions (minimal to mild) and decreased incidence of lamellar telangiectasis (minimal to mild) in all three treated groups. All but one fish in the study (including the control group; Figure 2A) were diagnosed with LEH to varying degrees of severity. Fish from all three treated groups, unlike the controls, tended to have moderate (Figure 2B) rather than minimal to mild LEH and the proportion of fish with moderate LEH increased in a dose-related fashion. The distribution of LEH was consistently diffuse, although most pronounced at the distal ends of filaments. Projecting lamellar tips that were not completely covered by hyperplastic epithelium were often edematous. Infectious agents or other inciting causes were not evident in the histologic sections taken from scheduled mortalities. The single fish not recorded as having LEH was an unscheduled mortality, which was determined to have moderate gill autolysis.
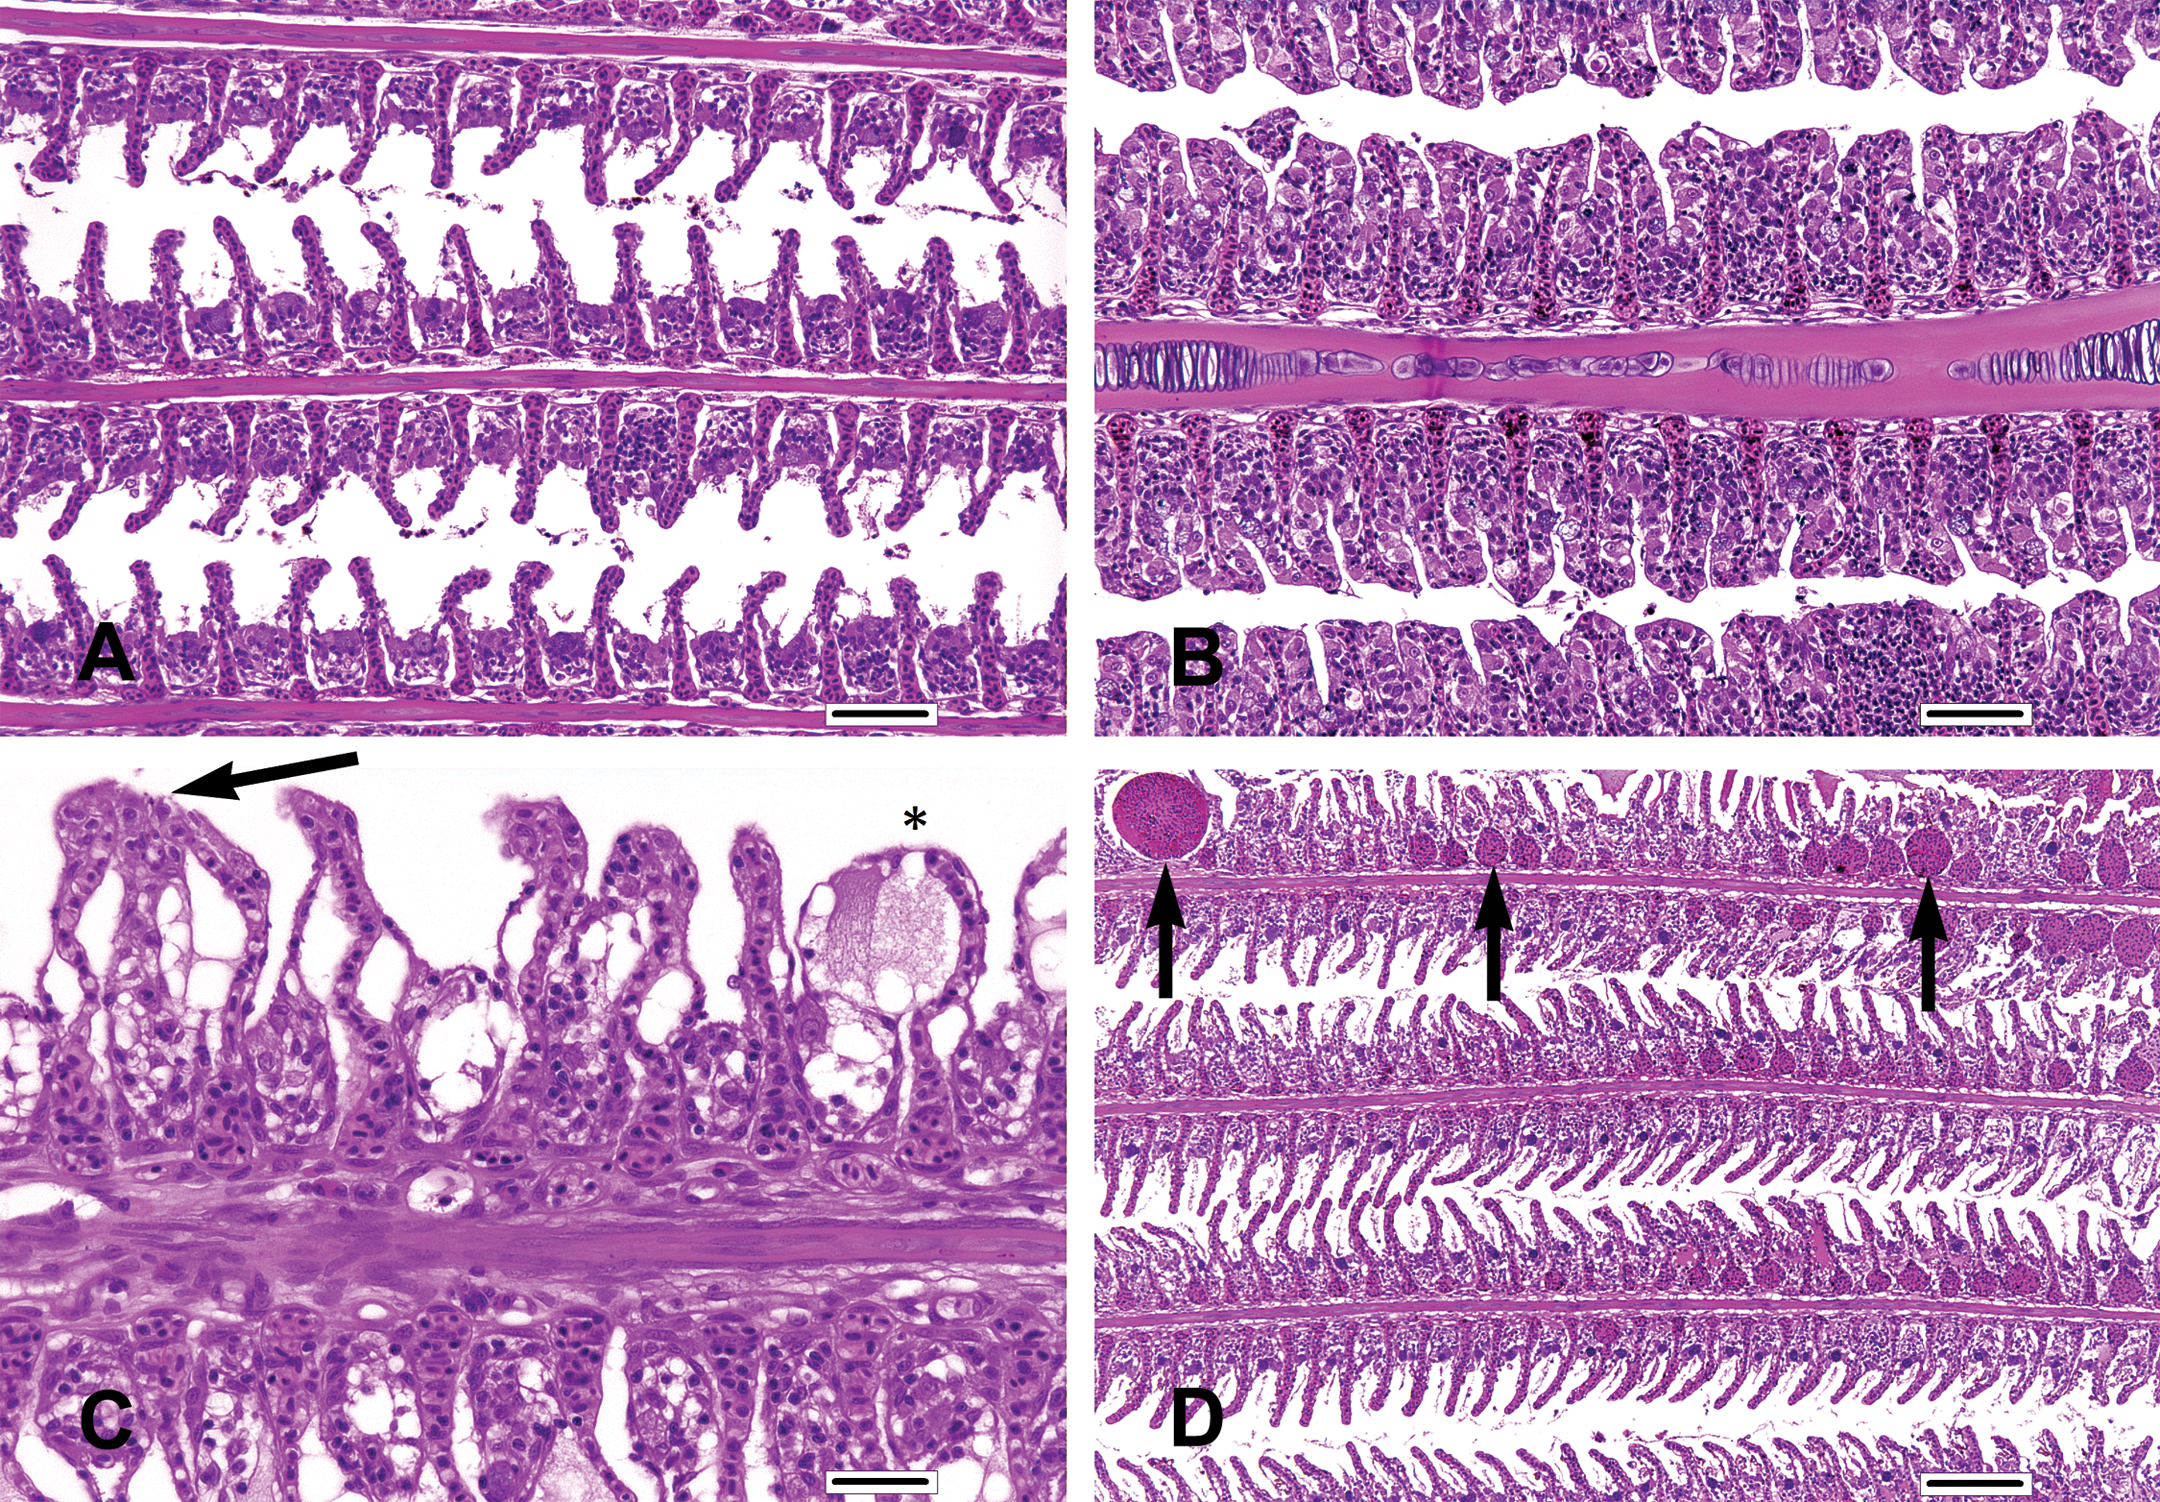
Gill findings. (A) Mild lamellar epithelial hyperplasia (LEH) in a control tilapia. (B) Moderate LEH in a tilapia assigned to the 75 mg florfenicol (FFC)/kg body weight (BW) dose group. In this particular instance, interlamellar sulci are almost completely filled by a combination of chloride cells, pavement cells, mucus cells, and mononuclear inflammatory cells. (C) Lamellar adhesions (arrow) and lamellar edema (asterisk) in a tilapia assigned to the 45 mg FFC/kg BW dose group. (D) Lamellar telangiectasis (arrows) in a control tilapia. (A, H&E, bar = 50 µm; B, H&E, bar = 50 µm; C, H&E, bar = 25 µm; D, H&E, bar = 100 µm).
The incidence of gill lamellar adhesions (minimal to mild; Figure 2C) was increased in the 15, 45, and 75 mg/kg BW dose groups and tended to co-occur with moderate LEH. The adhesions were characterized by a conjoining of adjacent lamellar tips without complete interlamellar fusion. Although lamellar adhesions were observed in only the 15, 45, and 75 mg/kg BW dose groups, neither the incidence nor the severity of lamellar adhesions were dose related. The decrease in the incidence of lamellar adhesions in the 75 mg/kg BW dose group relative to the 15 and 45 mg/kg BW dose groups may have been related to filling of interlamellar sulci (due to the concurrent LEH), which was on average slightly more complete in samples taken from the 75 mg/kg BW dose group. The physical presence of the intervening cells may have caused neighboring lamellar tips to remain separate, thereby reducing adhesion formation.
The incidence of gill lamellar telangiectasis (minimal to mild; Figure 2D) tended to decrease relative to dose. The occurrence of this finding in the control group was likely the result of the immobilization method (ice water immersion) coupled with the dose-dependent increase in the proportion of fish with moderate LEH (which may have stabilized the capillaries in the 15, 45, and 75 mg/kg BW dose groups and reduced the incidence of telangiectasis). Thus, the observed dose-related decreased incidence of lamellar telangiectasis was considered secondary to the aforementioned LEH, rather than a direct FFC-related effect.
Hepatocellular vacuolation (glycogen type and lipid type) was the only dose-related microscopic finding in the liver (Figure 3). Diffusely distributed glycogen- and lipid-type hepatocellular vacuolation was present within the same hepatocyte to varying degrees. The proportion of fish with glycogen-type vacuolation (moderate; Figure 3B) was increased in the 15 and 45 mg/kg BW dose groups and substantially increased in the 75 mg/kg BW dose group relative to the control group (Figure 3A). The proportion of fish with lipid-type vacuolation (mild; Figure 3C) was slightly higher in the 15, 45, and 75 mg/kg BW dose groups relative to the control group. The proportion of fish with lipid-type vacuolation (moderate) was similar in the control, 15, and 45 mg/kg BW dose groups but substantially less than the 75 mg/kg BW dose group.
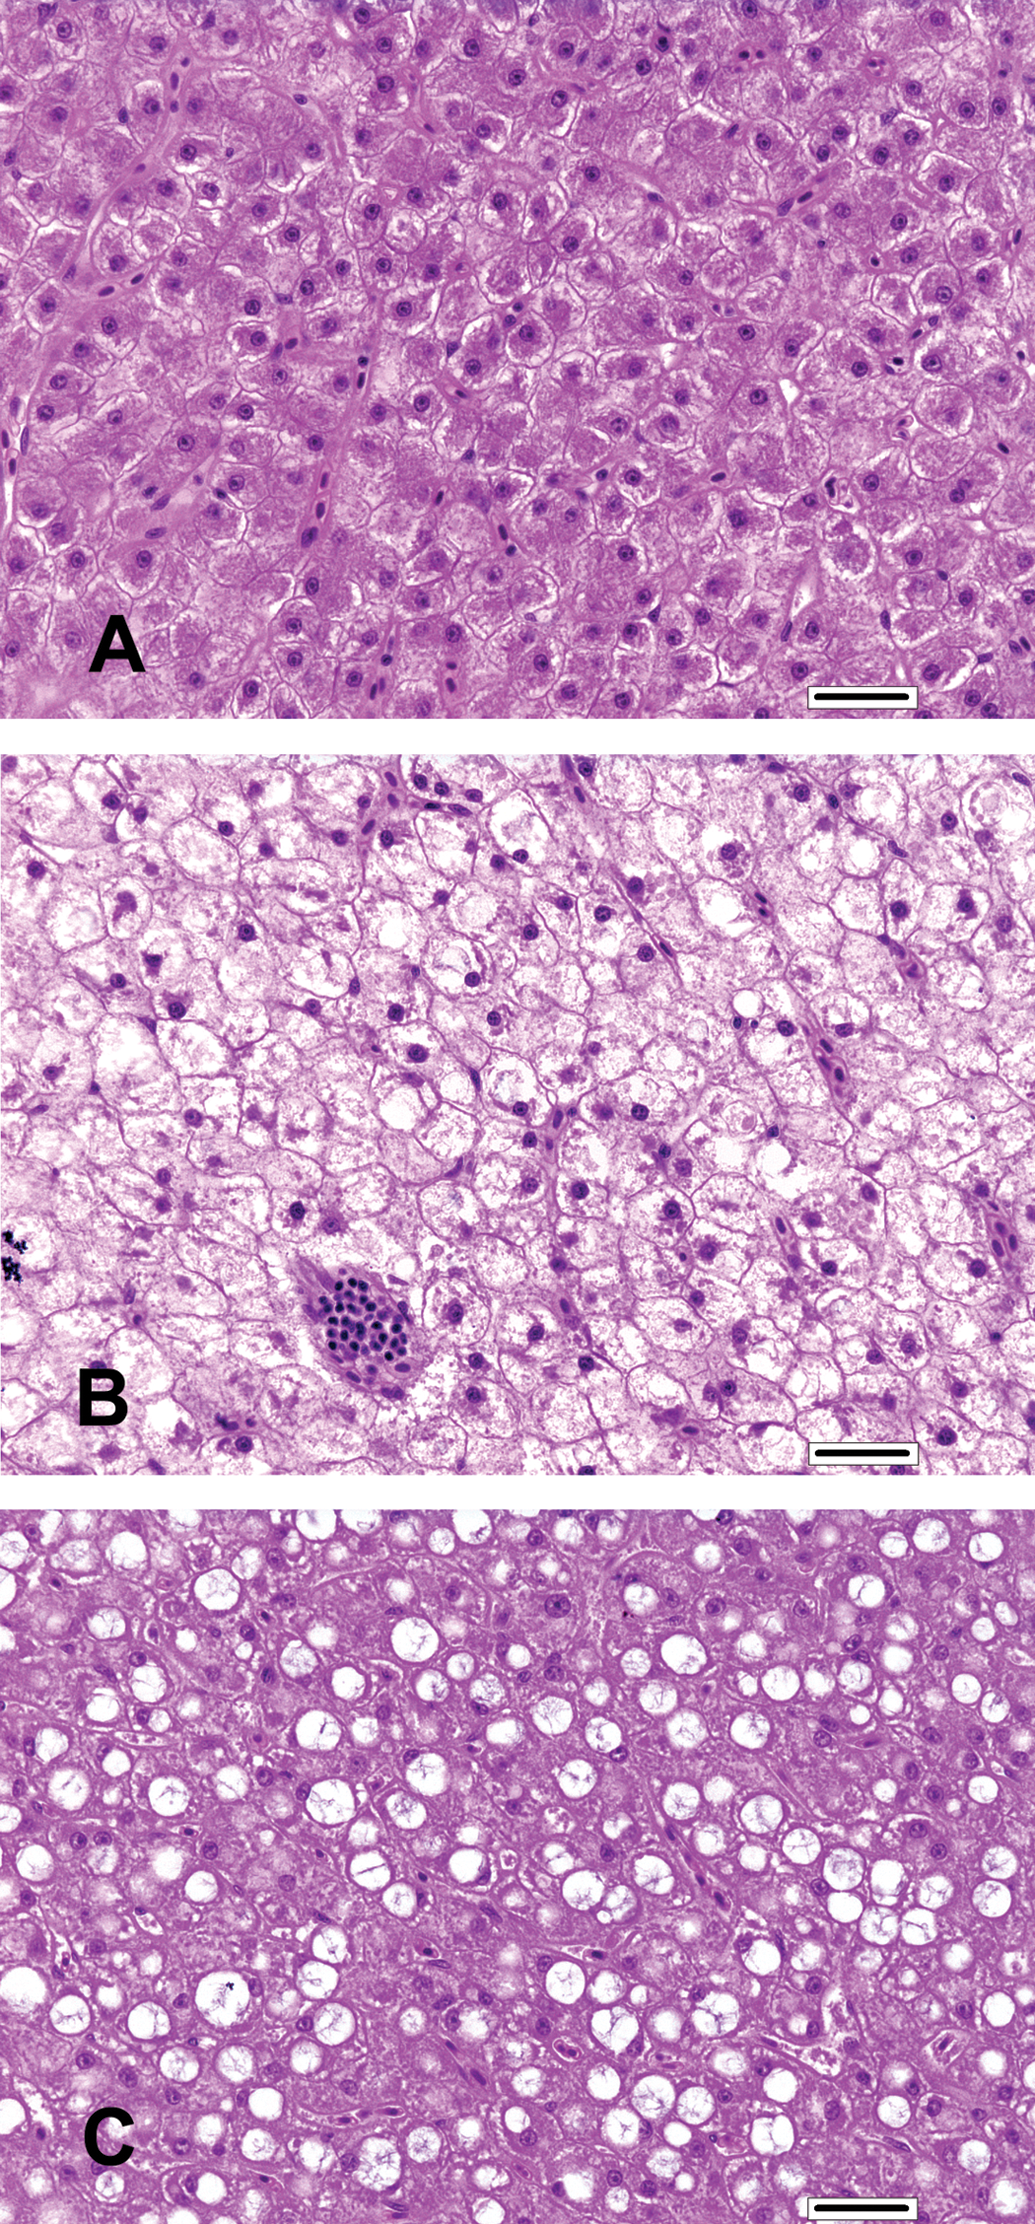
Liver findings. (A) Liver from a control tilapia. (B) Liver with increased glycogen-type vacuolation from a tilapia assigned to the 75 mg florfenicol (FFC)/kg body weight (BW) dose group. (C) Liver with increased lipid-type vacuolation from a tilapia assigned to the 75 mg FFC/kg BW dose group. (A, H&E, bar = 25 µm; B, H&E, bar = 25 µm; C, H&E, bar = 25 µm).
Elevations in the incidence and severity of decreased lymphocytes and increased blast cells, and nondose-related increases in the incidence and severity of increased individual cell necrosis, occurred in the anterior kidney (hematopoietic and lymphopoietic tissue; H&L tissue) of fish from the 15, 45, and 75 mg/kg BW dose groups. Anterior kidney lymphoid tissue (evident as multifocal to coalescing, patchy, irregular to dendritic cords of densely basophilic cells in the control group; Figure 4A) was often clearly reduced in a dose-related fashion (increased incidence and severity) in FFC-treated fish, appearing instead as comparatively small, indistinct, isolated, sparsely populated islands of lymphocytes (Figure 4B).
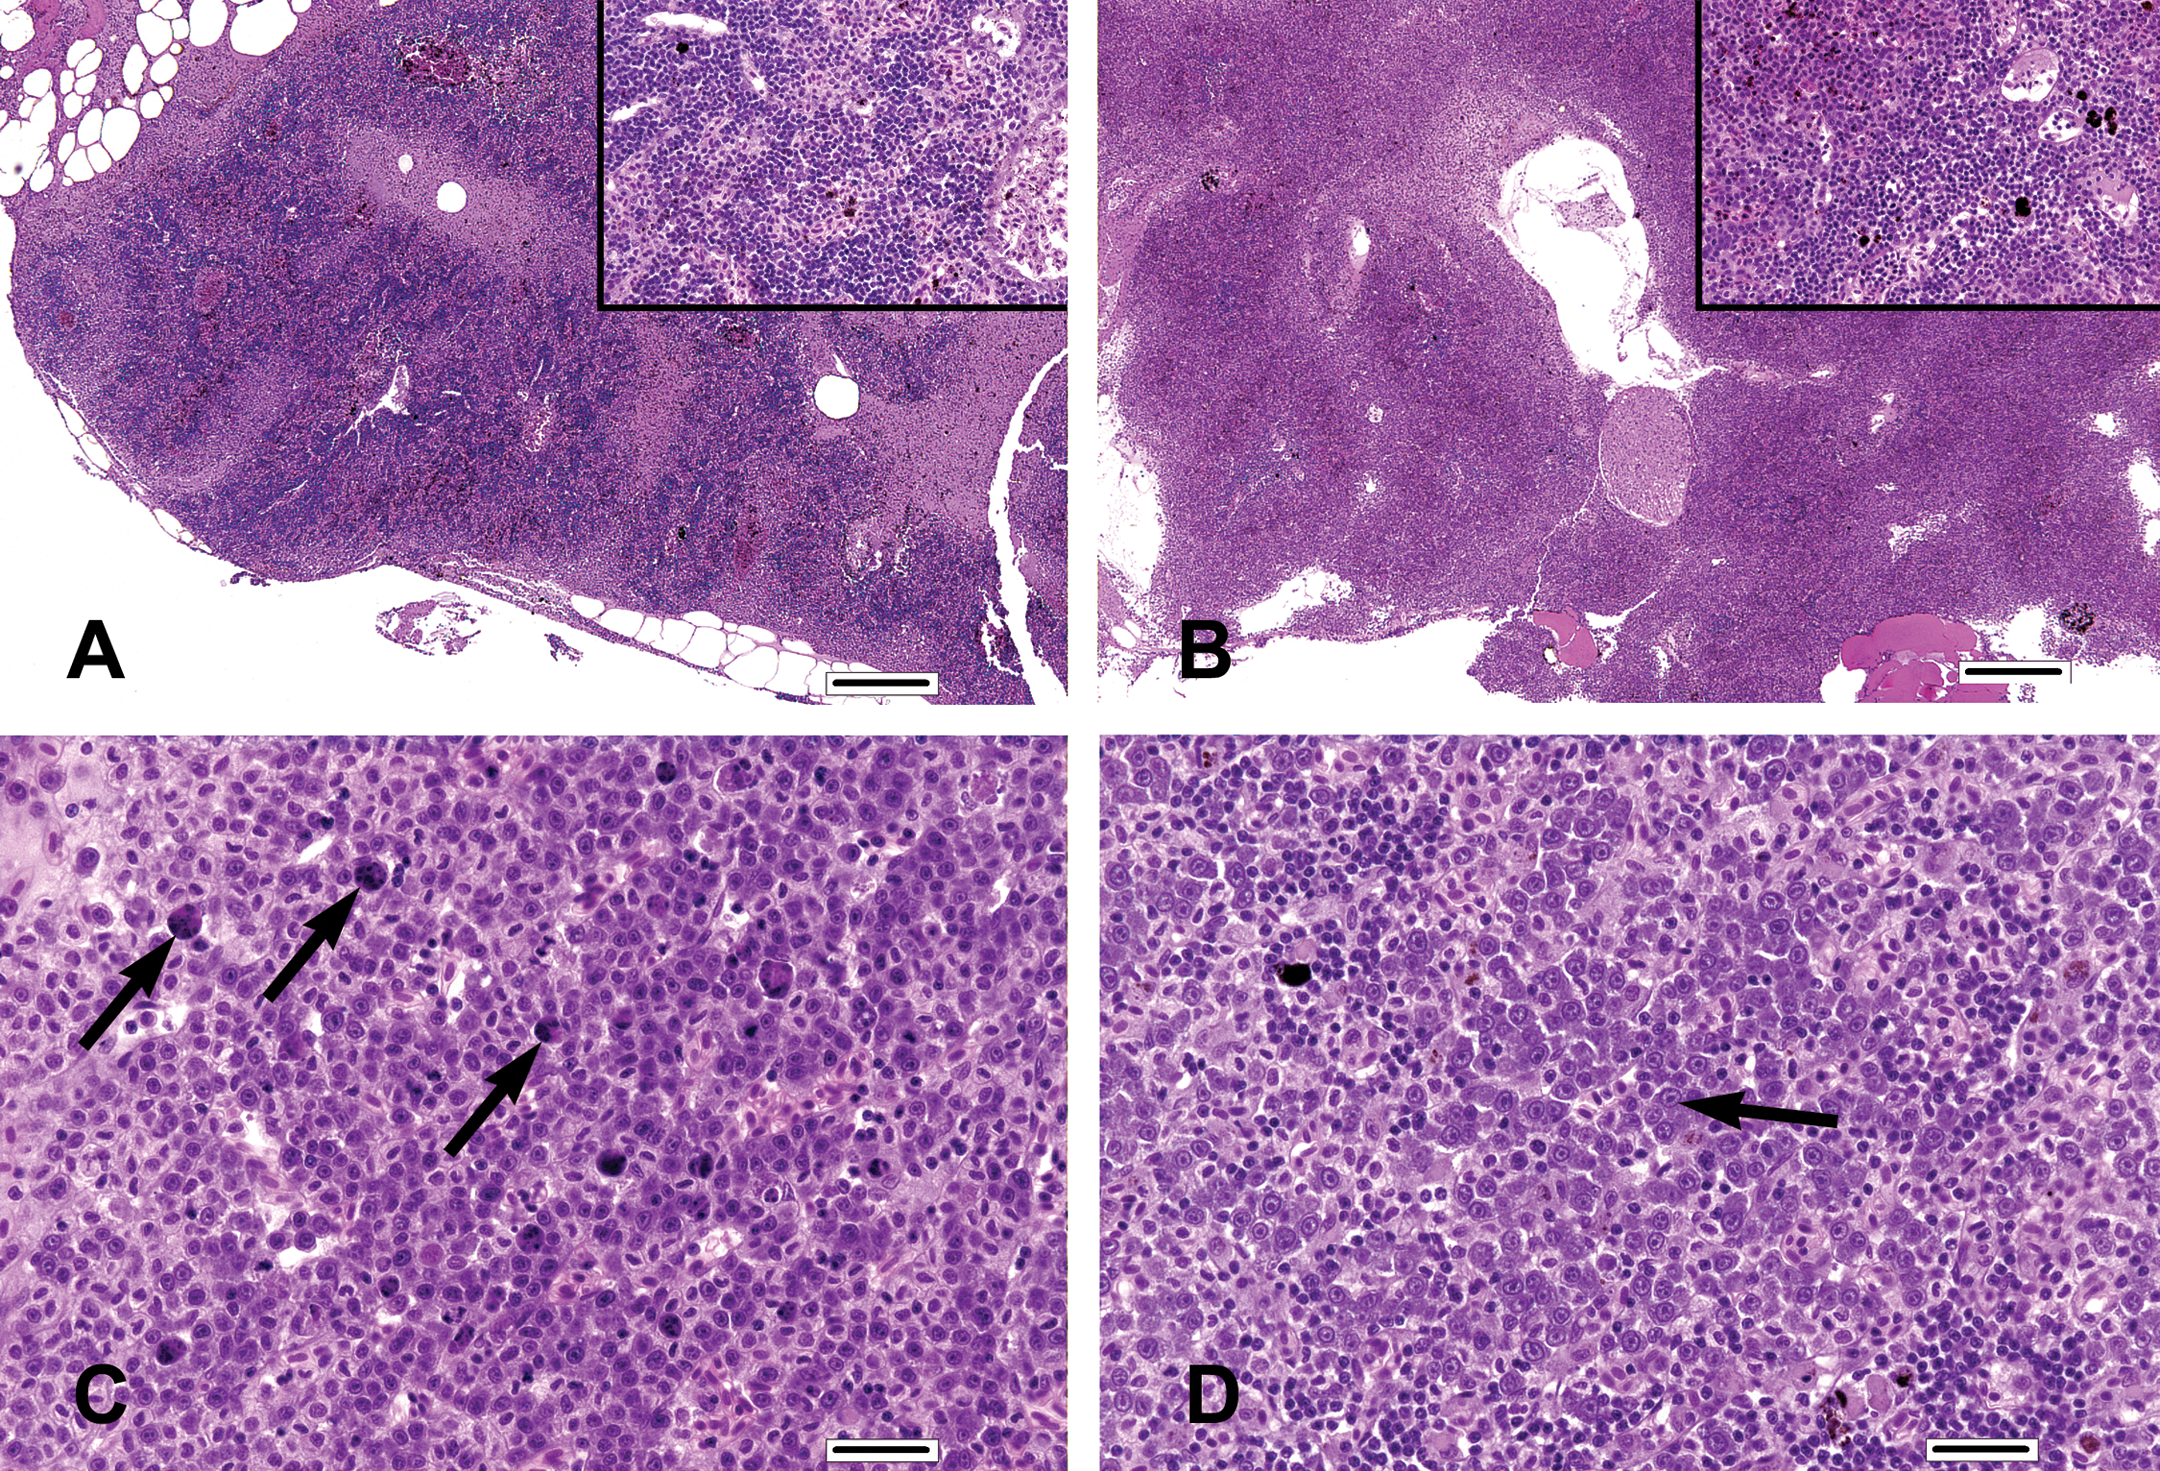
Anterior kidney findings. (A) Mature lymphoid tissue exists as dense cords of basophilic cells in the anterior kidney (low magnification and in high-magnification inset) of this control tilapia. (B) Lymphoid tissue is comparatively sparse in the anterior kidney of a tilapia assigned to the 75 mg florfenicol (FFC)/kg body weight (BW) dose group. (C) Apoptotic necrosis of individual cells (arrows) in the anterior kidney of a tilapia assigned to the 75 mg FFC/kg BW dose group. (D) Increased blast cells (arrow) in the anterior kidney of another tilapia assigned to the 75 mg FFC/kg BW dose group. (A, H&E, bar = 250 µm; B, H&E, bar = 250 µm; C, H&E, bar = 25 µm; D, H&E, bar = 25 µm).
Increased incidence and severity (minimal to moderate; Figure 4C) of individual cell necrosis in the anterior kidney was noted in the 15, 45, and 75 mg/kg BW dose groups but was not noted in the control group. However, there was no dose-related increase of this finding among the FFC-treated groups. The proportion of fish with increased blast cell presence (minimal to moderate; Figure 4D) in the anterior kidney increased in a dose-related fashion, primarily in the 45 and 75 mg/kg BW dose groups.
Increased incidence and severity of tubular epithelial degeneration (minimal to mild; Figure 5A) and mineralization (minimal to mild; Figure 5B) occurred in the posterior kidneys of all test article–treated groups. The incidence and severity of tubular epithelial degeneration were only slightly higher in the 45 and 75 mg/kg BW dose groups in comparison to the 15 mg/kg BW group. The incidence and severity (minimal to mild) of mineralization in the posterior kidney was similar among the 15, 45, and 75 mg/kg BW dose groups. Though not qualitatively different, mineralization was slightly more prevalent in the FFC-treated groups than in the control group.
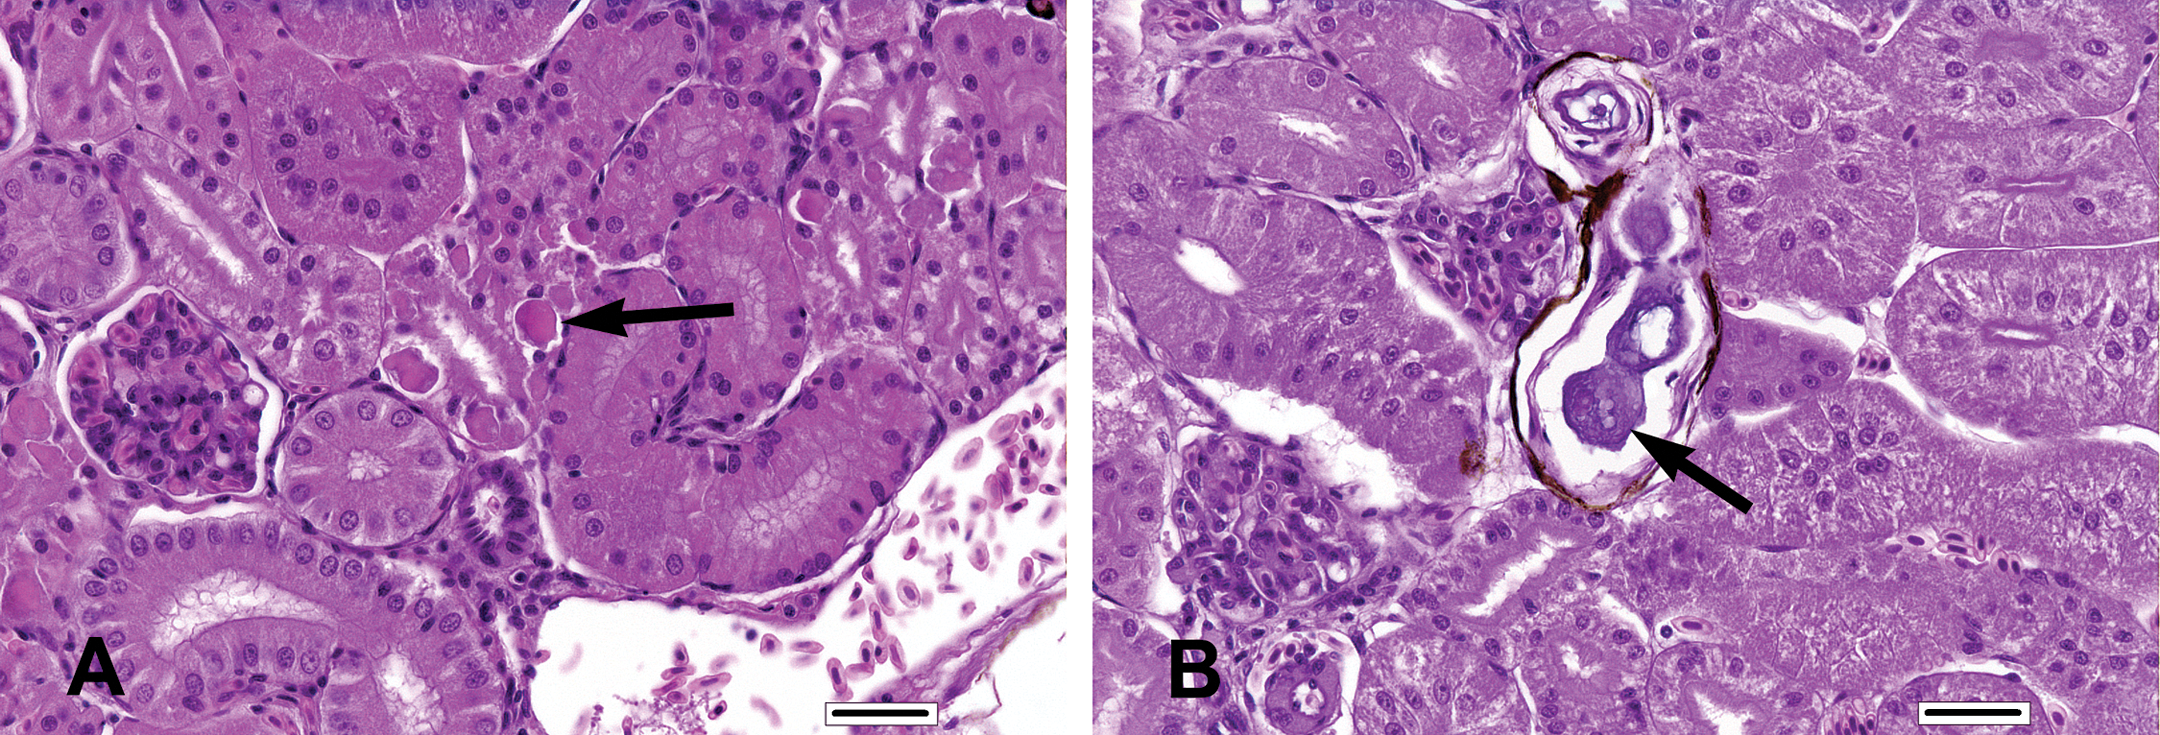
Posterior kidney findings. (A) Tubular epithelial degeneration (arrow) characterized by irregular hyaline cytoplasmic inclusions in the posterior kidney of a tilapia assigned to the 75 mg florfenicol (FFC)/kg body weight (BW) dose group. (B) Periglomerular interstitial mineralization (nephrocalcinosis, arrow) in the posterior kidney of a tilapia assigned to the 15 mg FFC/kg BW dose group. In this case the lamellated, basophilic mineralized material is surrounded by a narrow rim of flattened multinucleated macrophages surrounded by pigmented membranous connective tissue. (A, H&E, bar = 25 µm; B, H&E, bar = 25 µm).
Additional kidney findings of low incidence and minimal severity included tubular casts, mononuclear cell infiltrates, and granulomatous inflammation. Though found in slightly higher incidence in the FFC-treated groups, there was no apparent dose-related increase in any of these additional findings. These particular posterior kidney lesions were considered to be secondary FFC-related effects primarily because of the frequent co-occurrence with mineralization and/or tubular epithelial degeneration.
Discussion
In the present study, feed consumption and growth in tilapia were significantly reduced in a dose-related fashion. The scientific reports on the effect of FFC on feed consumption and growth in different species of fishes are conflicting. FFC therapy in Atlantic salmon parr (Inglis et al. 1991), hybrid striped bass (Straus et al. 2012), or yellow perch (J. Bowker, U.S. Fish and Wildlife Service, personal communication, Janurary 10, 2011) did not alter feed consumption or growth. Feed consumption, but not growth, in channel catfish fed FFC-medicated feed at 30 or 50 mg/kg BW/d was significantly less than the nonmedicated control or fish dosed at 10 mg/kg BW/d (Gaikowski et al. 2003). In preliminary trials with tilapia (R. G. Endris, Merck Animal Health, personal communication, January 10, 2011), FFC-related declines in both feed consumption (at nominal doses of 45 and 75 mg/kg BW/d) and growth (at nominal doses of 15, 45, and 75 mg/kg BW/d) were observed. In the present tilapia study, feed consumption declined significantly after 11 days of FFC-medicated feed administration in the 45 and 75 mg/kg BW dose groups, similar to previous observations in tilapia (R. G. Endris, Merck Animal Health, personal communication) and in channel catfish (Gaikowski et al. 2003). Although tilapia in the 15 mg/kg BW dose group in the present study were significantly smaller than those in the nonmedicated control group, the 4.94 g difference in weight gain represents a difference whose clinical significance is likely minimal given that in clinical practice FFC-medicated feed would be administered for only 10 days. The larger decreased feed consumptions in the 45 and 75 mg/kg BW dose groups correlated with decreased BW gain and TL and were considered test article–related. In the present study, the clinical significance of the decreased feed consumption is again likely of minimal importance as decreased feed consumption was only realized at levels three or five times the proposed dose and only after administration for longer than the proposed 10-day dosing period. Tilapia actually may self-limit exposure to severe FFC intoxication by reducing feed consumption. This potential protective capacity could reduce the probability of FFC overdose in tilapia and other fishes.
In this animal safety study in tilapia, test article–related histopathologic lesions were noted in the gills, liver, and anterior and posterior kidneys. The potential histopathologic effects of FFC administration in fish have been investigated in Atlantic salmon (Inglis et al. 1991), channel catfish (Gaikowski et al. 2003), hybrid striped bass (Straus et al. 2012), tilapia O. niloticus (R. G. Endris, Merck Animal Health, personal communication), and yellow perch (J. Bowker, U.S. Fish and Wildlife Service, personal communication). FFC administered in feed to Atlantic salmon parr at 100 mg/kg BW/d for 10 days or at 50 mg/kg BW/d for three 10-day on/off cycles did not induce treatment-related histopathologic lesions in the gill, liver, or kidney (the only tissues evaluated; Inglis et al. 1991). Similarly, FFC administered in medicated feed at up to 75 mg/kg BW/d for 20 days to hybrid striped bass (Straus et al. 2010) and yellow perch (J. Bowker, U.S. Fish and Wildlife Service, personal communication) did not induce treatment-related tissue alterations (note: the same list of tissues were evaluated in hybrid striped bass and yellow perch as were evaluated in tilapia in this study). When administered to tilapia in a previous study (R. G. Endris, Merck Animal Health, personal communication), FFC-related lesions were not observed (note: the same list of tissues were evaluated as in present report except that most anterior kidney samples were inadvertently not taken). Conversely, when FFC was administered in feed to channel catfish at doses of 10, 30, or 50 mg/kg BW/d for 20 days, histopathologically evident changes were restricted to a dose-dependent decrease in hematopoietic/lymphopoietic tissue in the anterior kidney, posterior kidney, and spleen (Gaikowski et al. 2003). In the present tilapia study, the treatment-related finding of decreased lymphocytes in the anterior kidney bears a strong morphologic resemblance to the hematopoietic/lymphopoietic change described in the anterior kidneys of channel catfish by Gaikowski et al. (2003). The lack of a similar response in the posterior kidneys and spleens of tilapia is most likely due to a comparatively low constitutive presence of lymphocytes in the tilapia spleen and the fact that the posterior kidney is not a lymphopoietic organ in tilapia (Sailendri and Muthukkaruppan 1975).
In the present tilapia study, the treatment-related, minimal to moderate decrease in anterior kidney lymphoid tissue was predominantly a loss of mature lymphocytes which was accompanied by concurrent increases in individual cell necrosis and blast cell proliferation. The net effect was a shift toward a more immature lymphoid cell population, suggestive of a toxic or stress-related effect of treatment on lymphoid cells with the increase in blast cells occurring as a compensatory proliferative response to cell loss, that is, the decrease in mature lymphocytes and increase in individual cell necrosis. In contrast to the findings in channel catfish, in which there was no evidence of lymphopoietic tissue destruction, for example, cytoplasmic vacuolation, karyorrhexis, pyknosis, toxic basophilia, or cellular debris in kidney or spleen, the present study found a treatment-related, minimal to moderate increase in individual cell necrosis in the anterior kidney of fish in the 75 mg/kg dose group. The finding of individual cell necrosis represents the first observation of cytotoxicity associated with exposure to FFC in fish. Although individual cell necrosis was observed in the anterior kidney, the cytotoxic changes observed were exceedingly minor relative to the clinical manifestations of amphenicol (chloramphenicol, thiamphenicol, and FFC)-induced impairment of the myeloid function (e.g., decreased number of circulating white blood cells [especially neutrophils], cytologic/histopathologic change [vacuolation, degeneration, necrosis, maturation arrest, and reduced cellularity]; Ferrari and Pajola 1981; Keiser and Buchegger 1973; Penny, Watson, and Moyle 1973; Watson 1977) in laboratory rats and dogs at high doses (200–300 mg/kg BW).
Antibiotic effects (in vitro and in vivo) on the immune system of mammals and fish have been previously described. In mammals, several classes of antibiotics have been shown to suppress immune response (e.g., macrolides—Guan et al. 2010; amphenicol—Guan et al. 2011). In fish, FFC exposure in vitro and in vivo suppressed immune response including decreased macrophage phagocytic ability (common carp Cyprinus carpio—Sieroslawska et al. 1998; rainbow trout—Lundén et al. 1999; Lundén & Bylund 2000) and reduced head kidney lymphoid cell proliferation following mitogen stimulation (common carp—Sieroslawska et al. 1998; rainbow trout—Lundén and Bylund 2000). Similarly, oxolinic acid and oxytetracycline suppressed humoral and cellular immune responses in fish (common carp—Grondel et al. 1987, Rijkers et al. 1980; rainbow trout—Lundén et al. 1998). However, FFC therapy, unlike oxolinic acid or oxytetracycline, did not suppress circulating leucocyte levels or antibody production in fish (rainbow trout—Lundén et al. 1998, 1999). Antibody production and circulating leucocytes were not suppressed in rainbow trout that received concomitant FFC therapy and vaccination (with a divalent vaccine [an antigen stimulus]; Lundén et al. 1999); FFC therapy in the absence of immune system stimulus (antigen) suppressed the mitogenic response of rainbow trout head kidney cells (Lundén and Bylund 2000).
Although amphenicol antibiotic effects on immune system responses are relatively well described, their effects on cellular respiration, especially in fish, are less well described. Several antibiotics, including FFC, are known to accumulate in the teleost kidney (Horsberg, Martinsen, and Varma 1994; Grondel et al. 1987), where they could inhibit cellular metabolism. Amphenicol antibiotics exert their antibacterial effect by binding to the 70S ribosomes (50S subunit) of prokaryotic cells and inhibit protein production (Cannon, Harford, and Davies 1990; Nagabhushan, Miller, and Varma 1992; Yunis 1988). One effect of amphenicol exposure on eukaryotic 70S ribosomes is the inhibition of heme synthesis in erythroid mitochondria (Abou-Kahil et al. 1987; Ferrari and Pajola 1981; Yunis, Manyan, and Arimura 1974).
FFC administration in this study may have reduced antigen stimulation by reducing gut microflora in FFC-treated tilapia. As observed in both common carp and rainbow trout, FFC therapy in the absence of antigen stimulation caused reductions in immune system response (Sieroslawska et al. 1998; Lundén et al. 1999; Lundén and Bylund 2000). Germ-free rats and mice have lower circulating leukocytes, below the historical control range, and have lower cellularity in the thymus, lymph nodes, spleen, and/or bone marrow than their specific pathogen–free (SPF) counterparts in the same laboratory (Klausen and Hougen 1987; Burns, Timmons, and Poiley 1971; Uno, Sumi, and Sakura 1968; Iijima and Yamane 1968; Hashimoto and Hashimoto 1968). Reduced antigen stimulation, however, does not explain the minimal to mild individual cell necrosis observed in the lymphoid tissue of the tilapia anterior kidney.
Unfortunately, appropriate supporting studies in fish to elucidate potential cause/causes of treatment-related, minimal to moderate decrease in anterior kidney lymphoid tissue of tilapia do not yet exist. The present study did not assess cellular respiration or lymphopoeisis, two end points that may have provided insight about the clinical significance of the minimal to moderate decrease in anterior kidney lymphoid tissue observed. Also, the design of this study did not allow determination of whether this histomorphological change was transient because the fish were necropsied immediately after administration of FFC-medicated feed.
There is no precedent in the FFC literature for the other treatment-associated changes that were observed in the gill, liver, and posterior kidney of tilapia. In the gills, there was a dose-related increased incidence of moderate LEH. LEH is a common response in fish to suboptimal rearing conditions (e.g., water quality, diet, and/or stress; J. Wolf, Experimental Pathology Laboratories, Inc., personal communication, March 22, 2011), infectious agents, physical irritants, and local or systemic toxicants (Mallat 1985; Speare and Ferguson 2006) and has been postulated to serve as a defensive response to increase the diffusion distance as a toxicant passes. In the present tilapia study, the baseline severity of LEH among the nonmedicated control group was slightly higher than anticipated. However, the severity of LEH was clearly, albeit modestly, exacerbated in a dose-dependent fashion. In a previous study in which tilapia were overdosed with FFC, the incidence and severity of LEH did not differ between the nonmedicated control group and those in the 75 mg/kg BW dose group (J. Wolf, Experimental Pathology Laboratories, Inc., personal communication). In the present study, LEH was not detected by gross inspection at necropsy probably because of the diffuse distribution of the lesion throughout the gills and because essentially all fish were affected to varying degrees. Unfortunately, the design of this study did not allow us to determine whether this histomophological change was transient because the fish were necropsied immediately after administration of FFC-medicated feed. However, the toxicological literature is rich in studies that describe LEH as a transient lesion, and in such cases LEH often resolves to baseline conditions in fish that survive the initial challenge (Jauch 1978; Daoust and Ferguson 1986; Patel and Bahadur 2010; Perera and Pathiratne 2005; Tamse, Gacutan, and Tamse 1995; Temmink et al. 1983).
There was a dose-related increased incidence of mild to moderate hepatocyte vacuolation noted in this tilapia study. Healthy, captive-raised fish are expected to have varying amounts of glycogen- and/or lipid-type hepatocellular vacuolation, often dependent on the amount of lipid or carbohydrate present within the diet (Royes et al. 2004; Wolf and Wolfe 2005). Disease states or disorders that affect energy balance in general, or the liver specifically, may result in increased or decreased levels of vacuolation (Wolf and Wolfe 2005). In the current tilapia study, the degree of hepatocyte vacuolation varied widely, even among control fish; however, FFC-treated tilapia tended to have a slightly greater groupwise abundance of both glycogen-type and lipid-type vacuolation. The dose-dependent significant decrease in food consumption, especially during the latter part of the dosing period in the 45 and 75 mg/kg BW dose groups, may have impacted energy balance, and thus possibly hepatocyte vacuolation, in FFC-treated fish.
In the posterior kidney, FFC-related changes included minimal to mild tubular degeneration and mineralization. Except for a single control fish, renal tubular degeneration occurred exclusively in FFC-treated fish. This lesion had a consistently unique appearance of coagulated granular to globular hypereosinophilic cytoplasmic swelling with relatively undisturbed nuclei; it neither resembled acute tubular necrosis, nor was it similar to the more discrete proteinaceous eosinophilic droplets that can be observed in the tubular epithelia of both normal and diseased fish kidneys (Reimschuessel and Ferguson 2006). Reported causes of tubular damage in fish include exposure to toxic levels of several metals, excessive doses of aminoglycoside antibiotics, algal microcystin toxins, or hydrocarbon-containing pollutants (Reimschuessel and Ferguson 2006). Minimal mineralization in the urinary (posterior) kidney of untreated farmed fish is not an uncommon finding and cited causes include elevated ambient CO2 levels and dietary mineral imbalances (Reimschuessel and Ferguson 2006). In the current study, the cause of mineralization in control tilapia is undetermined; however, the fact that renal mineralization occurred in both control and treated fish, and lacked a dose-related increase in incidence and severity, suggests that the increased mineralization in treated fish is not test article–related.
Histopathologically evident treatment-related findings were observed in the gills, liver, anterior kidney, and posterior kidney of tilapia from the 15, 45, and 75 mg/kg BW dose groups. However, the treatment-related changes were generally mild, and fish did not appear to be impacted clinically as evidenced by no treatment-related mortality or morbidity, and scarcity of secondary infectious disease. The potential transient nature of these findings cannot be evaluated based on the study design used, nor did the study design allow for an accurate assessment of which, if any, lesions would be present after 10 days of dosing, which is the recommended clinical duration. Given the wide use of FFC-medicated feed to control infectious disease in tilapia globally and the lack of adverse event reports associated with its administration, it is reasonable to conclude that these relatively mild histologic lesions are not likely to be clinically important.
Conclusions
The present study has shown that feeding FFC-medicated diets at elevated doses of 45 and 75 mg/kg BW, for an extended duration (beyond 10 days), will cause significantly decreased feed consumption, BW gains, and total fish length.
The clinical impacts of the histopathological changes induced by the FFC administration in feed were likely minimal as there was no increase in morbidity or mortality across all treatment groups. The results of this study indicate that Aquaflor feed premix, when incorporated into feed to deliver a consumed dose of 15 mg/kg BW for the recommended clinical duration of 10 days, would be well tolerated by tilapia.
Footnotes
The author(s) declared no potential conflicts of interest with respect to the research, authorship, and/or publication of this article.
The author(s) disclosed receipt of the following financial support for the research, authorship, and/or publication of this article: This study was fully funded by Merck Animal Health through a Cooperative Research and Development Agreement with the U.S. Geological Survey. Any use of trade, product, or firm names does not imply endorsement by the U.S. Government.
Abbreviation
Acknowledgments
The authors thank Mr. Aaron Cupp, Mr. Nick Schloesser, Ms. Theresa Schreier, Mr. Todd Severson, and Ms. Maren Tuttle-Lau for their technical assistance in conducting this study. The data generated in this study were accepted by the U.S. Food and Drug Administration as evidence to address the target animal safety of FFC administration in tilapia.