
Abstract
Islets of Langerhans represent a heterogeneous population in insulin resistant and diabetic animals and humans as histological appearances and function vary substantially. Mathematical representation that reflects this morphological diversity will assist in assessment of degeneration and regeneration, enabling comparisons between species, strains, and experimental investigations. Our investigative approach used a model of islet degeneration in diabetic male obese Zucker Diabetic Fatty (ZDF) rats and evaluated its prevention using rosiglitazone treatment. Immunohistochemical staining (insulin and collagens I/III) with automated image analysis reliably measured numbers, area, clustering, and staining intensity of β-cells and degree of islet fibrosis. Finite mixture mathematical modeling for the joint probability distribution of seven islet parameters to represent islet numerical data variation provided an automatic procedure for islet category allocations as normal or abnormal. Allocations for obese ZDF controls and rosiglitazone-treated animals were significantly different, with no significant difference between the latter and lean ZDF controls, indicative of differences within islet populations of individual animals, between lean and obese rat strains and following drug treatment. Islet morphology showed clear association with mathematical characterization. Information on islet morphology obtained by histopathological assessment of single pancreatic tissue sections was confirmed by this method showing drug-induced retardation of islet of Langerhans degeneration.
Keywords
Introduction
The influences of numerous dietary regimes, drugs, and genetic models of diabetes on functional and morphological characteristics of islets of Langerhans have been widely explored in investigations of the cause and effect of β-cell perturbation in insulin resistance and type II diabetes (Homo-delarche and Calderari 2006; Janssen et al. 2001; Kaiser et al. 2005; Kawano et al. 1992; Koyama et al. 1998; Lewandowski et al. 1998; Masuyama et al. 2004; Peterson et al. 1990; Riccillo et al. 2004; Tokuyama et al. 1995; Walter and Lubben 2005). Such experimental approaches have provided important insights, usually into islet failure (Homo-delarche and Calderari 2006; Janssen et al. 2001; Kaiser et al. 2005; Kawano et al. 1992; Koyama et al. 1998; Lewandowski et al. 1998; Tokuyama et al. 1995) but also in prevention or amelioration of islet degeneration (Buckingham et al. 1998; Diani et al. 2004; Higa et al. 1999; Lewandowski et al. 1998; Smith et al. 2000; Shimabukuro et al. 1998). In studies of the effects of diet in several rodent species and strains, islet degeneration can be induced or accelerated by increasing certain dietary constituents and energy content (Butler et al. 2003; Kaiser et al. 2005; Koyama et al. 1998; Lewandowski et al. 1998), and protection afforded by dietary restriction (Ohneda, Inman, and Unger 1995). Furthermore, several studies of the effects of drugs on islet degeneration and glycemic control (Buckingham et al. 1998; Diani et al. 2004; Higa et al. 1999; Ko et al. 2004; Shimabukuro et al. 1998; Smith et al. 2000; Walter et al. 2005), most notably the thiazolidinediones (rosiglitazone, troglitazone, and pioglitazone) that act via peroxisome proliferator activated receptor-γ agonism (PPAR-γ agonists), have demonstrated substantial protection.
In consideration of data submitted for drug registration and licensing, regulatory agencies now require additional differentiation of new antidiabetic drugs in order to achieve complementary health benefits. Potential new drugs for the treatment of type II diabetes require demonstration of further benefits in addition to glycemic control such as, hypolipidemic effects, weight loss, or improvements in islet function. While improvements in islet function can be assessed in a variety of ways such as, glucose stimulated insulin secretion, increased β-cell mass, and increased pancreatic insulin content, histological assessments provide evidence of pathological changes such as amyloid deposition, inflammation, or fibrosis that pertain integrally to β-cell and islet functional capabilities and their reversal or prevention (Buckingham et al. 1998; Clark et al. 1988; Donath et al. 2008, 2009; Ehses et al. 2007, 2009; Homo-delarche and Calderari 2006; Janssen et al. 2001; Jones, Nugent, and Jenkins 2010; Kaiser et al. 2005; Koyama et al. 1998; Richardson et al. 2009; Tokuyama et al. 1995).
Pancreatic endocrine tissue consists of many individual islets of Langerhans, which in several animal models of type II diabetes show substantial structural diversity (Jones, Nugent, and Jenkins 2010; Kaiser et al. 2005; Koyama et al. 1998; Tokuyama et al. 1995). It is inaccurate to view all islets obtained from a single animal as being equally representative of a certain structural condition relating to a distinct physiological functional state, as normal and variably hypertrophic or hyperplastic islets may be present together with those which are inflamed, fibrotic, and failing. In animal models of type II diabetes, islet failure or prevention of degeneration is marked by substantial changes in β-cell degenerative (necrosis or apoptosis) or adaptive (hypertrophy or hyperplasia) states, inflammatory cell infiltrates, and in fibroproliferation (Janssen et al. 2001; Jones, Nugent, and Jenkins 2010). Conventionally, islet morphological condition is assessed by histopathological examination of suitably prepared histological tissue sections. Essential as this subjective assessment is, quantitative assessments of islet parameters are required to provide summary information of the extent of islet morphological heterogeneity in multiple islets of a tissue section that can subsequently be compared between individual animals, species, and strains. Numerous previous approaches to islet morphometry and stereology in animals and humans (Butler et al. 2003; Stefan et al. 1982) in disease and experimentally manipulated conditions have been employed to assess, for example, β-cell area and volume fractions of the endocrine population (Clark et al. 1988; Girman et al. 2008; Jorns et al. 2002; Kaiser et al. 2005; Ko et al. 2004; Montana, Bonner-Weir, and Weir 1993; Mulder et al. 2000; Ohneda, Inman, and Unger 1995; Paris et al. 2003; Paulsen et al. 2010; Pick et al. 1998; Sakuraba et al. 2002), β-cell turnover involving proliferation, and/or apoptotic measures (Bonner-Weir 2001; Butler et al. 2003; Kaiser et al. 2005; Paris et al. 2003; Rankin and Kushner 2009).
We sought to develop an automated image analytical method whereby the morphological condition of all islets in tissue sections could be determined quickly and accurately in a representative tissue sample, namely, a single histological section, rather than undertaking stereological measurements. Although a complete stereological analysis of islet diversity in the pancreas of nondiabetic, insulin resistant, and overtly diabetic animals should also be feasible using an appropriate adjustment of this method, our purpose was to provide an accurate and reproducible assessment that reflects and communicates the histopathologist’s diagnosis. This automated image analytical approach is based on dual immunohistochemical staining for insulin and collagens I and III in order to define the magnitude of the β-cell cohort and morphological characteristics, especially those of inflammation and fibrosis, of all islets in a single tissue section. The clear differences between normal and failing islets are plain to see and in numerous rodent models of euglycemia and type II diabetes, among numerous degenerative features of both islets and β-cells, separation of β-cells into many small clusters by inflammatory cells, fibrosis and neovascularization is an important and characteristic morphological feature. Therefore, in addition to assessing numerous parameters that demonstrate islet failure either alone or in combination, a critical part of the analyses undertaken by us was the identification and measurement of clusters of β-cells within individual islets and interrogation of whether or not this feature could be determined via automated analyses and was a reliable indicator of islet degeneration. The striking effects of rosiglitazone on degenerative islet morphology in obese male Zucker Diabetic Fatty (ZDF) rats (Buckingham et al. 1998) offered an opportunity to evaluate measurement of altered islet characteristics by this method. Therefore, we used this approach to assess these parameters in obese male ZDF rats given rosiglitazone for 28 days and compared them with appropriate controls, namely untreated obese ZDF and lean ZDF rats.
Materials and Method
All animals were male, aged 6 to 7 weeks at the beginning of the study, and housed singly in polycarbonate cages in a controlled environment room at 20°C and 55 to 70% humidity with a 12-hr reverse light/dark cycle. They were given ad libitum access to potable tap water and standard rodent maintenance diet (RM1, Special Diet Services UK Ltd, Witham, Essex, United Kingdom) and were weighed before and at weekly intervals throughout the study. A group of seven male obese ZDF rats (Gmi-fa/fa) was administered 3 mg/kg/day rosiglitazone daily in vehicle (0.5% HPMC in 0.1% Tween) by gavage intubation for 28 days (rosiglitazone test group). Control groups of seven obese ZDF rats and six lean ZDF rats (Gmi-fa/+) received daily gavage administration of vehicle only and were otherwise treated in the same way. The latter group was maintained for 24 days under the same conditions and used as nondiabetic controls.
All animal procedures were conducted in accordance with Home Office (United Kingdom) and local ethical review committee guidelines and complied with the Animals Scientific Procedures Act 1986.
In order to ensure that all animals were representative of their reported genotype, their physiological status was determined by generation of plasma biochemical profiles on days 1 and 28 (obese ZDFs) or 24 (lean ZDFs): blood samples were taken for analysis of glucose, insulin, glycated hemoglobin, triglycerides, nonesterified fatty acids (NEFAs), cholesterol, and fructosamine. Plasma glucose was determined using a Roche Accuchek™ monitor (Roche Diagnostics, West Surrey, United Kingdom); glycated hemoglobin measured following dilution in deionized water with a Biorad Variant II Analyzer (Bio-Rad, Hemel Hempstead, United Kingdom); and insulin assessed by enzyme linked immunosorbent assay (ELISA; Ultrasensitive rat Insulin ELISA kit, Mercodia, Sweden). All other parameters were measured photometrically using a Roche Modular P analyzer (Roche Diagnostics, West Surrey, United Kingdom). The cholesterol, triglyceride (modular GPO-PAP [glycerol-3-phosphate + oxygen − phenol + aminophenazone] system), and fructosamine assay kits were supplied by Roche. The NEFA assay kit manufactured by Wako Chemicals GmbH was supplied by Alpha Laboratories (Eastleigh, Hampshire, United Kingdom).
Lean and obese ZDF rats were killed by terminal narcosis with 5:1 CO2/O2 mixture on day 25 or 29, respectively, and the pancreas removed, bisected in the head–tail orientation (one half used for other purposes, not reported here), and immersed in 10% neutral phosphate buffered formalin fixative (pH7) for 48 hr prior to further standard processing and embedding into paraffin wax. Tissue sections (3–4 µm thick) were stained with hematoxylin and eosin and submitted to histopathological assessment. Adjacent serial sections were also dual stained in order to demonstrate β-cells (insulin) and fibrous tissue (collagens I and III).
Imunohistochemistry
Sections of 4 µm thickness were cut and mounted on SuperFrost Plus® electrostatically charged glass slides (Thermo Fisher Scientific, Runcorn, United Kingdom). Sections were dried at 37°C overnight in an incubator before being dewaxed in xylene, passed through graded alcohols, and rehydrated with water. Immunohistochemical staining was performed, at room temperature, on a Lab Vision Autostainer 720 (Lab Vision, Newmarket, United Kingdom). The diluent and wash buffer was 0.05M Tris-buffered saline plus 0.05% Tween 20 (TBST), pH 7.6.
Endogenous peroxidase activity was quenched by incubation in 3% hydrogen peroxide in TBST for 15 min. Slides were then washed and incubated for 20 min with serum free protein block (X0909, Dako UK Ltd, Ely, United Kingdom). Polyclonal guinea pig antihuman insulin (A0564, Dako UK Ltd), diluted 1:50, was applied to the sections for 1 hr at room temperature. Following washing, biotinylated swine antigoat/mouse/rabbit immunoglobulins (E0453, Dako UK Ltd), diluted 1:200, was applied for 30 min. This reagent also recognizes guinea pig immunoglobulin. After further washing, the horseradish peroxidase–conjugated VectaStain ABC kit (U0226, Vector Laboratories Ltd, Peterborough, United Kingdom) was applied for 30 min. Visualization was achieved by application of DAB (K3468, Dako UK Ltd) for 10 min. Slides were rinsed thoroughly in deionized water, removed from the Autostainer, and heat-mediated antigen retrieval performed in a Milestone RHS-2 microwave (Milestone, Sorisole, Italy) at 110°C for 2 min in 10 mM citrate buffer, pH 6.0. The slides were replaced on the Autostainer and serum-free protein block reapplied for 20 min. A cocktail of rabbit polyclonal antibodies against collagens I and III (2150-1908 and 2150-1948, AbD Serotec, Oxford, United Kingdom) both diluted 1:10 were applied for 60 min, followed after washing by incubation in goat anti-rabbit IgG (H+L) alkaline phosphatase conjugate (G21079, Invitrogen, Paisley, Scotland, GB), diluted 1:100 for 30 min. Visualization of primary antibody binding was achieved by incubation in Permanent Red (K0640, Dako UK Ltd) for 10 min. The slides were counterstained for 1 min using Carazzi’s hematoxylin (Clin-Tech, Guildford, United Kingdom) and stained sections dehydrated and mounted under glass coverslips with DPX (BIOS Europe, Skelmersdale, United Kingdom).
Staining was negatively controlled by substituting either guinea pig or rabbit Ig fraction for either one or both of the primary antibodies, diluted to the same immunoglobulin concentration as the primary antibodies, or by omission of either one or both of the primary antibodies. All sections were stained simultaneously in order to eliminate batch processing variations.
Image Analysis
Immuolabeled sections were imaged with an Aperio Scanscope (T3, Aperio Technologies Inc., CA) using a ×20 objective lens magnification. Stored images were analyzed automatedly by a rule set designed in-house using Definiens Developer software (version 7.0.6 Definiens AG, Munich, Germany). In brief, the program developed for analysis of pancreatic samples comprised of three stages (Figure 1). Stage 1 created subsets of islets at a reduced digital resolution (image magnification equivalent to ×2.5 objective lens) of the entire pancreatic section image, followed by stage 2, employing higher resolution analysis of all islets in order to assess relative numerical data representative of morphological changes observed in size and shape of islets and the associated distribution of β-cell insulin and fibrosis. Stage 3 measured β-cell cluster size and number in individual islets. Stage 1: Identification of islets of Langerhans as regions of interest and the creation of subsets for secondary classification of the islet cell population. Schematic showing algorithm sequence of automated islet image analysis. Stage 2: Analysis of individual islets, characterizing cellular and interstitial tissue components. Stage 3: Location and measurement of β-cell cluster parameters in islets of >25 β-cells.
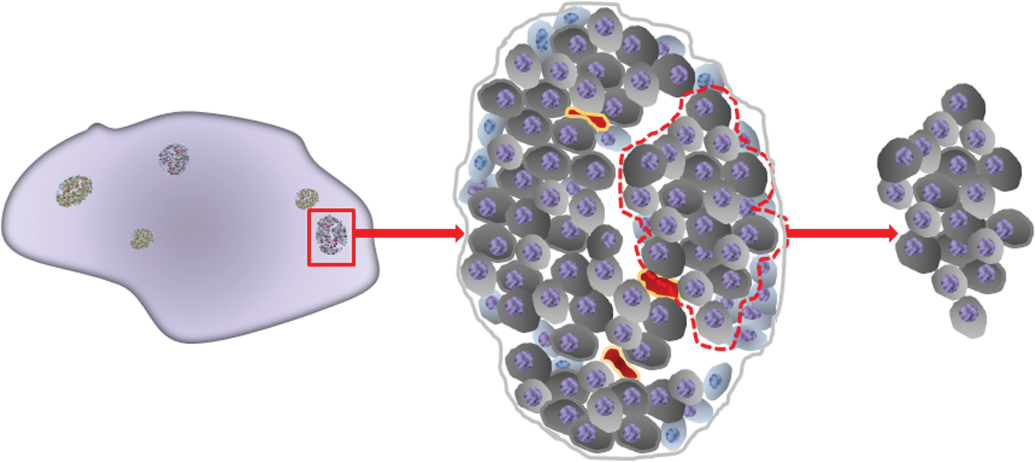
Additional image layers, using pixel level and object-based arithmetics were created in order to characterize morphological features and generate hue (H), saturation (S), and intensity (I) layers (HSI) to assist in the separation of spectral (color) components of the image. Temporary image layers created for analysis included the subtraction of layer 1 (R) gray-level intensities from layers 3(B) and 2(G) to enhance nuclear definition and enable the classification of islet cell nuclei (Figures 1–4). HSI transformed image layers enabled the separation of red-stained collagen (ranges H 0.83–0.99; S 0.2–0.6; I 0.6–0.85) from other stained components. To further refine the islet cell and connective tissue classifications, spatial relationships including feature-enclosing factors, distance maps, and neighborhood associations within defined limits were applied. The shape of each islet was determined by a form factor, based on the islet perimeter and filled area (4πarea/border length2). Juxtaposed islets (i.e., those islets that at low magnification were in close proximity to each other with touching edges) were separated by this routine. Much rarer, ostensibly morphologically conjoined islets were counted as one.
Microscopical examination revealed the presence of individual β-cell clusters that were clearly separated from one another by strands of connective tissue, positively immunostained red for collagen (Figures 2 and 4). Section thickness effects interfered with the discrimination of cell boundaries and as individual β-cell boundary definition was a key requirement for cluster analysis, the partitioning of these boundary effects in conjunction with retention of connectivity between confluently labeled β-cells was important and therefore required an artificial separation of cell borders. In islets of >25 β-cells, cluster separation was performed by geometric shrinking of insulin-stained regions until a single pixel partition was generated between cluster interfaces and was achieved irrespective of homogeneous or heterogeneous insulin immunostaining. Individual β-cell clusters were therefore defined by connected β-cell staining surrounded by neighboring non-β-cells or interstitial tissue within the previously defined islet boundary.
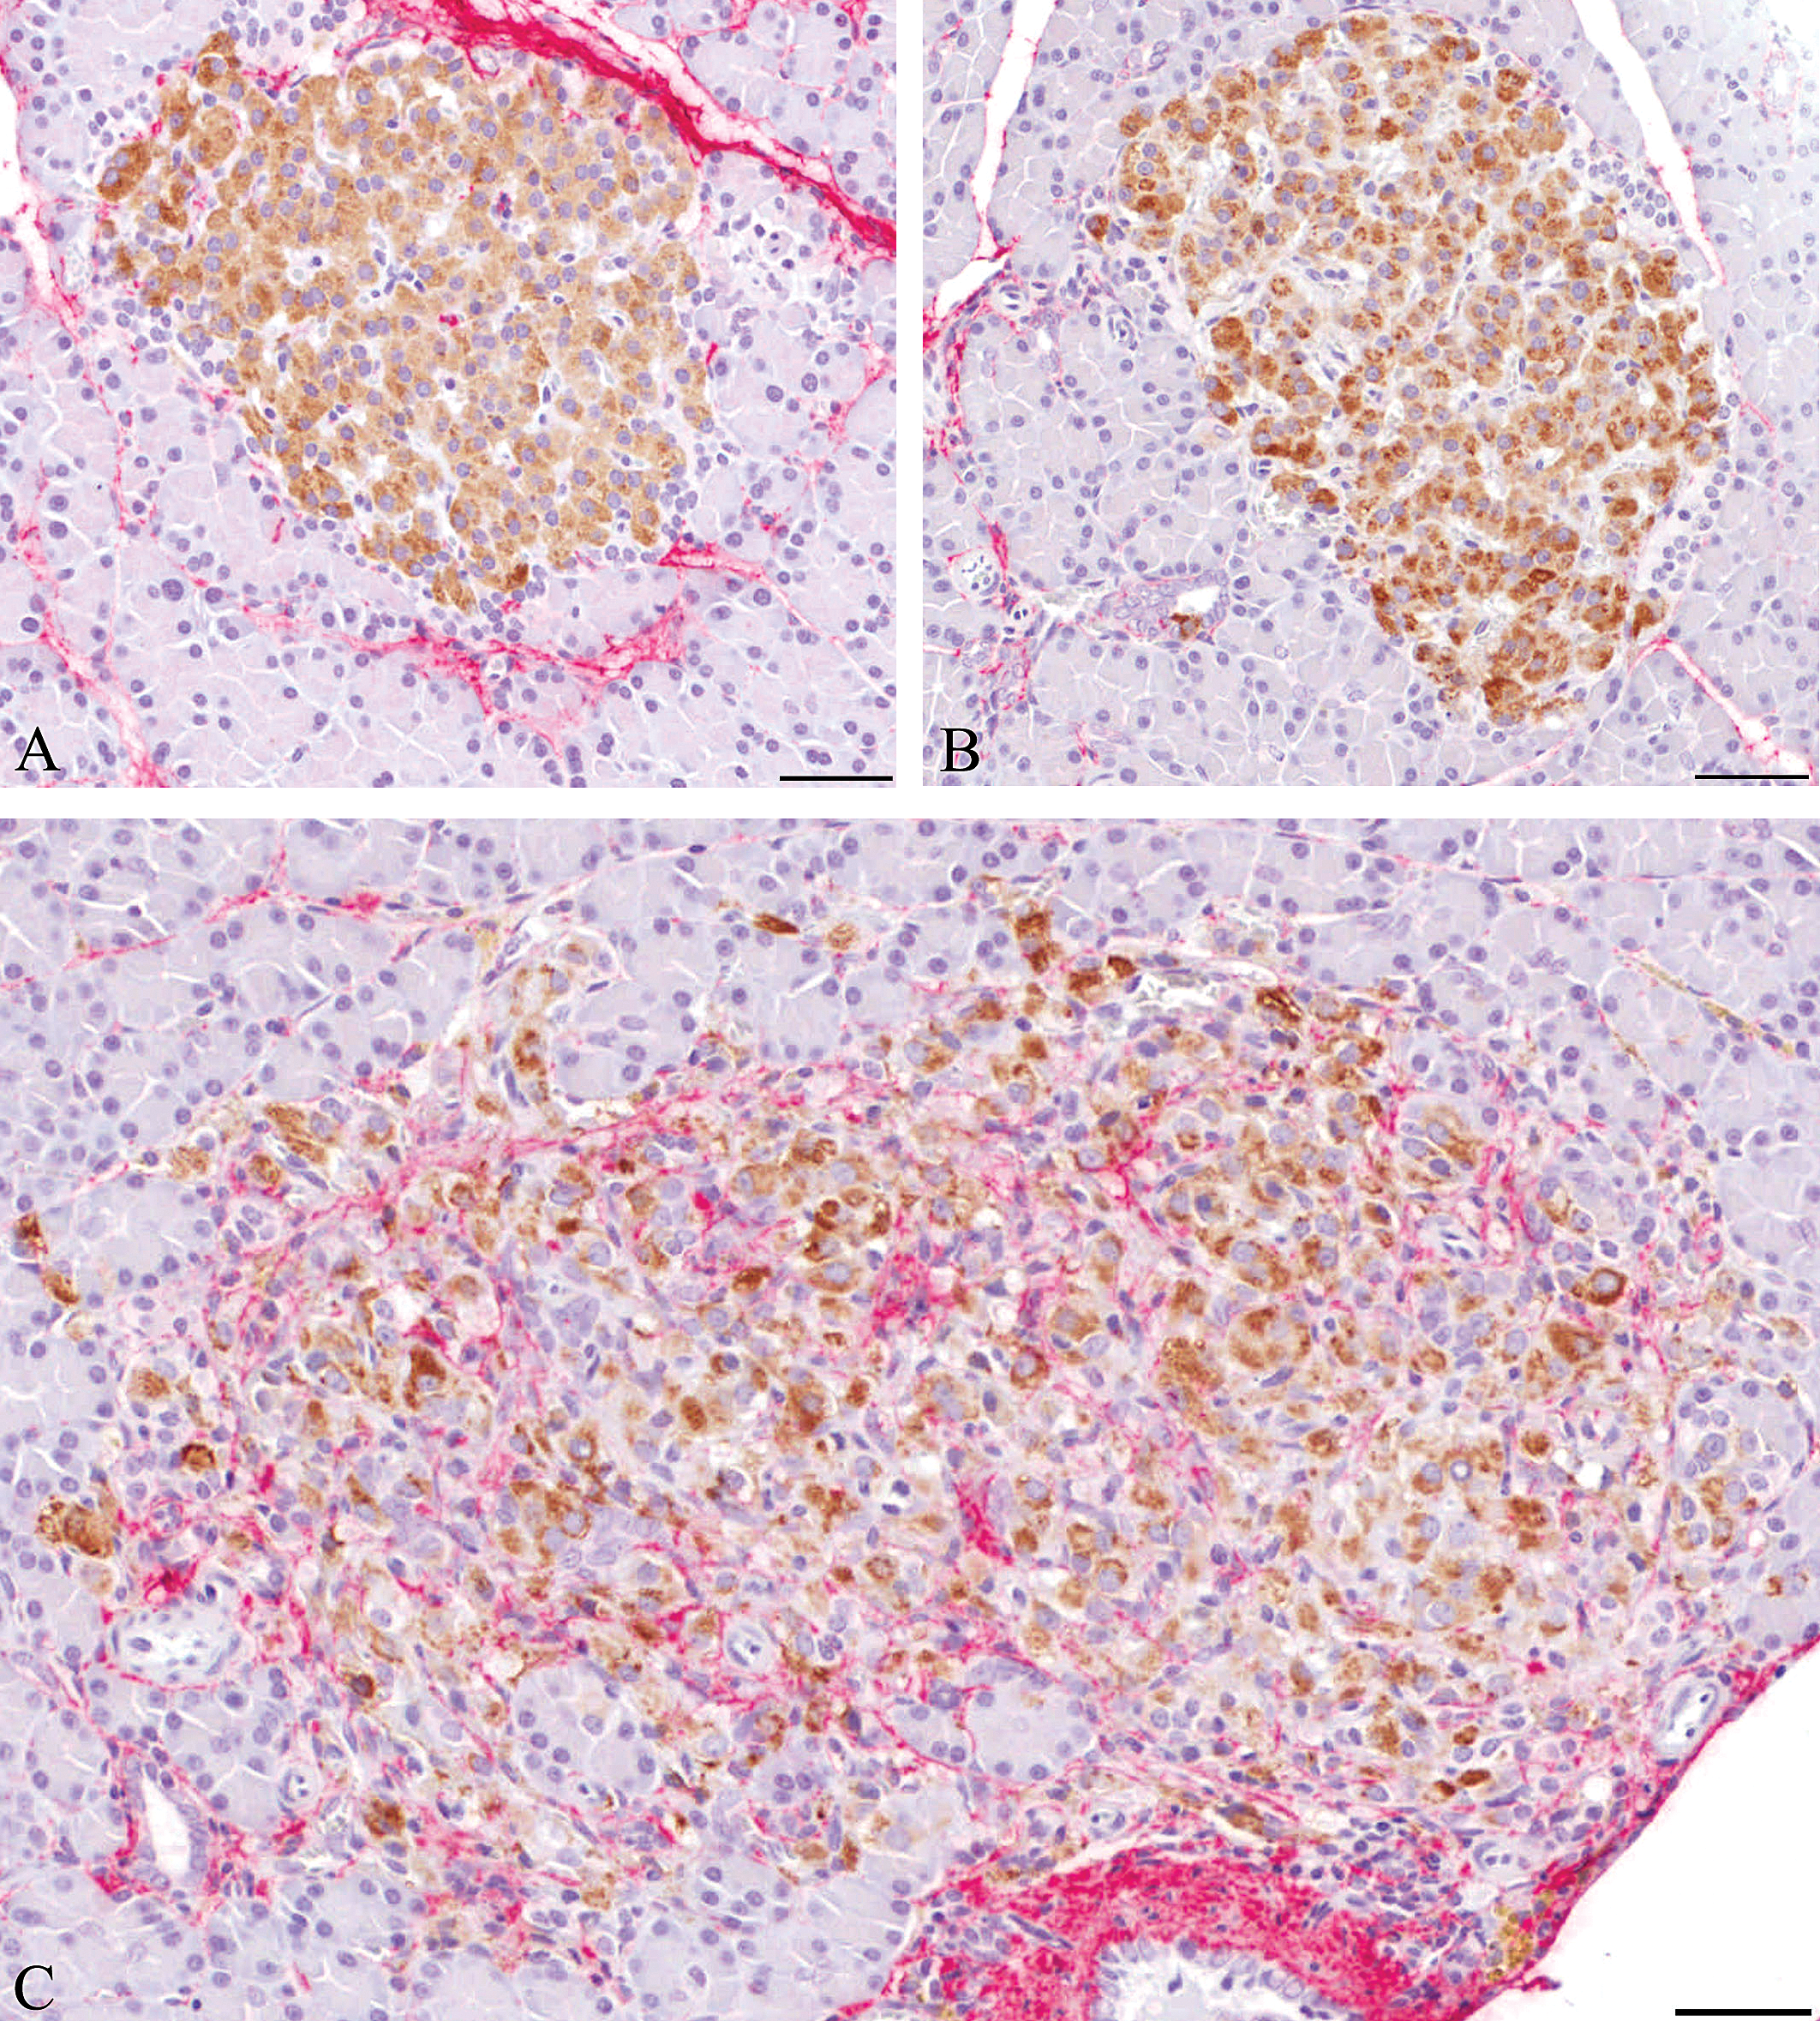
Islets from dual immunostained sections (insulin–brown; collagens I and III–red) from (A) lean ZDF, (B) rosiglitazone-treated obese ZDF and (C) obese ZDF animals. Note the compact appearance and generally homogeneous staining in (A) and (B) with little collagen present. In (C) the staining intensity is more heterogeneous with pale and heavily stained, widely dispersed β-cells within the islet tissue which shows substantial inflammatory cell infiltration and collagen deposition (haematoxylin counterstaining). Scale bar = 50µm.
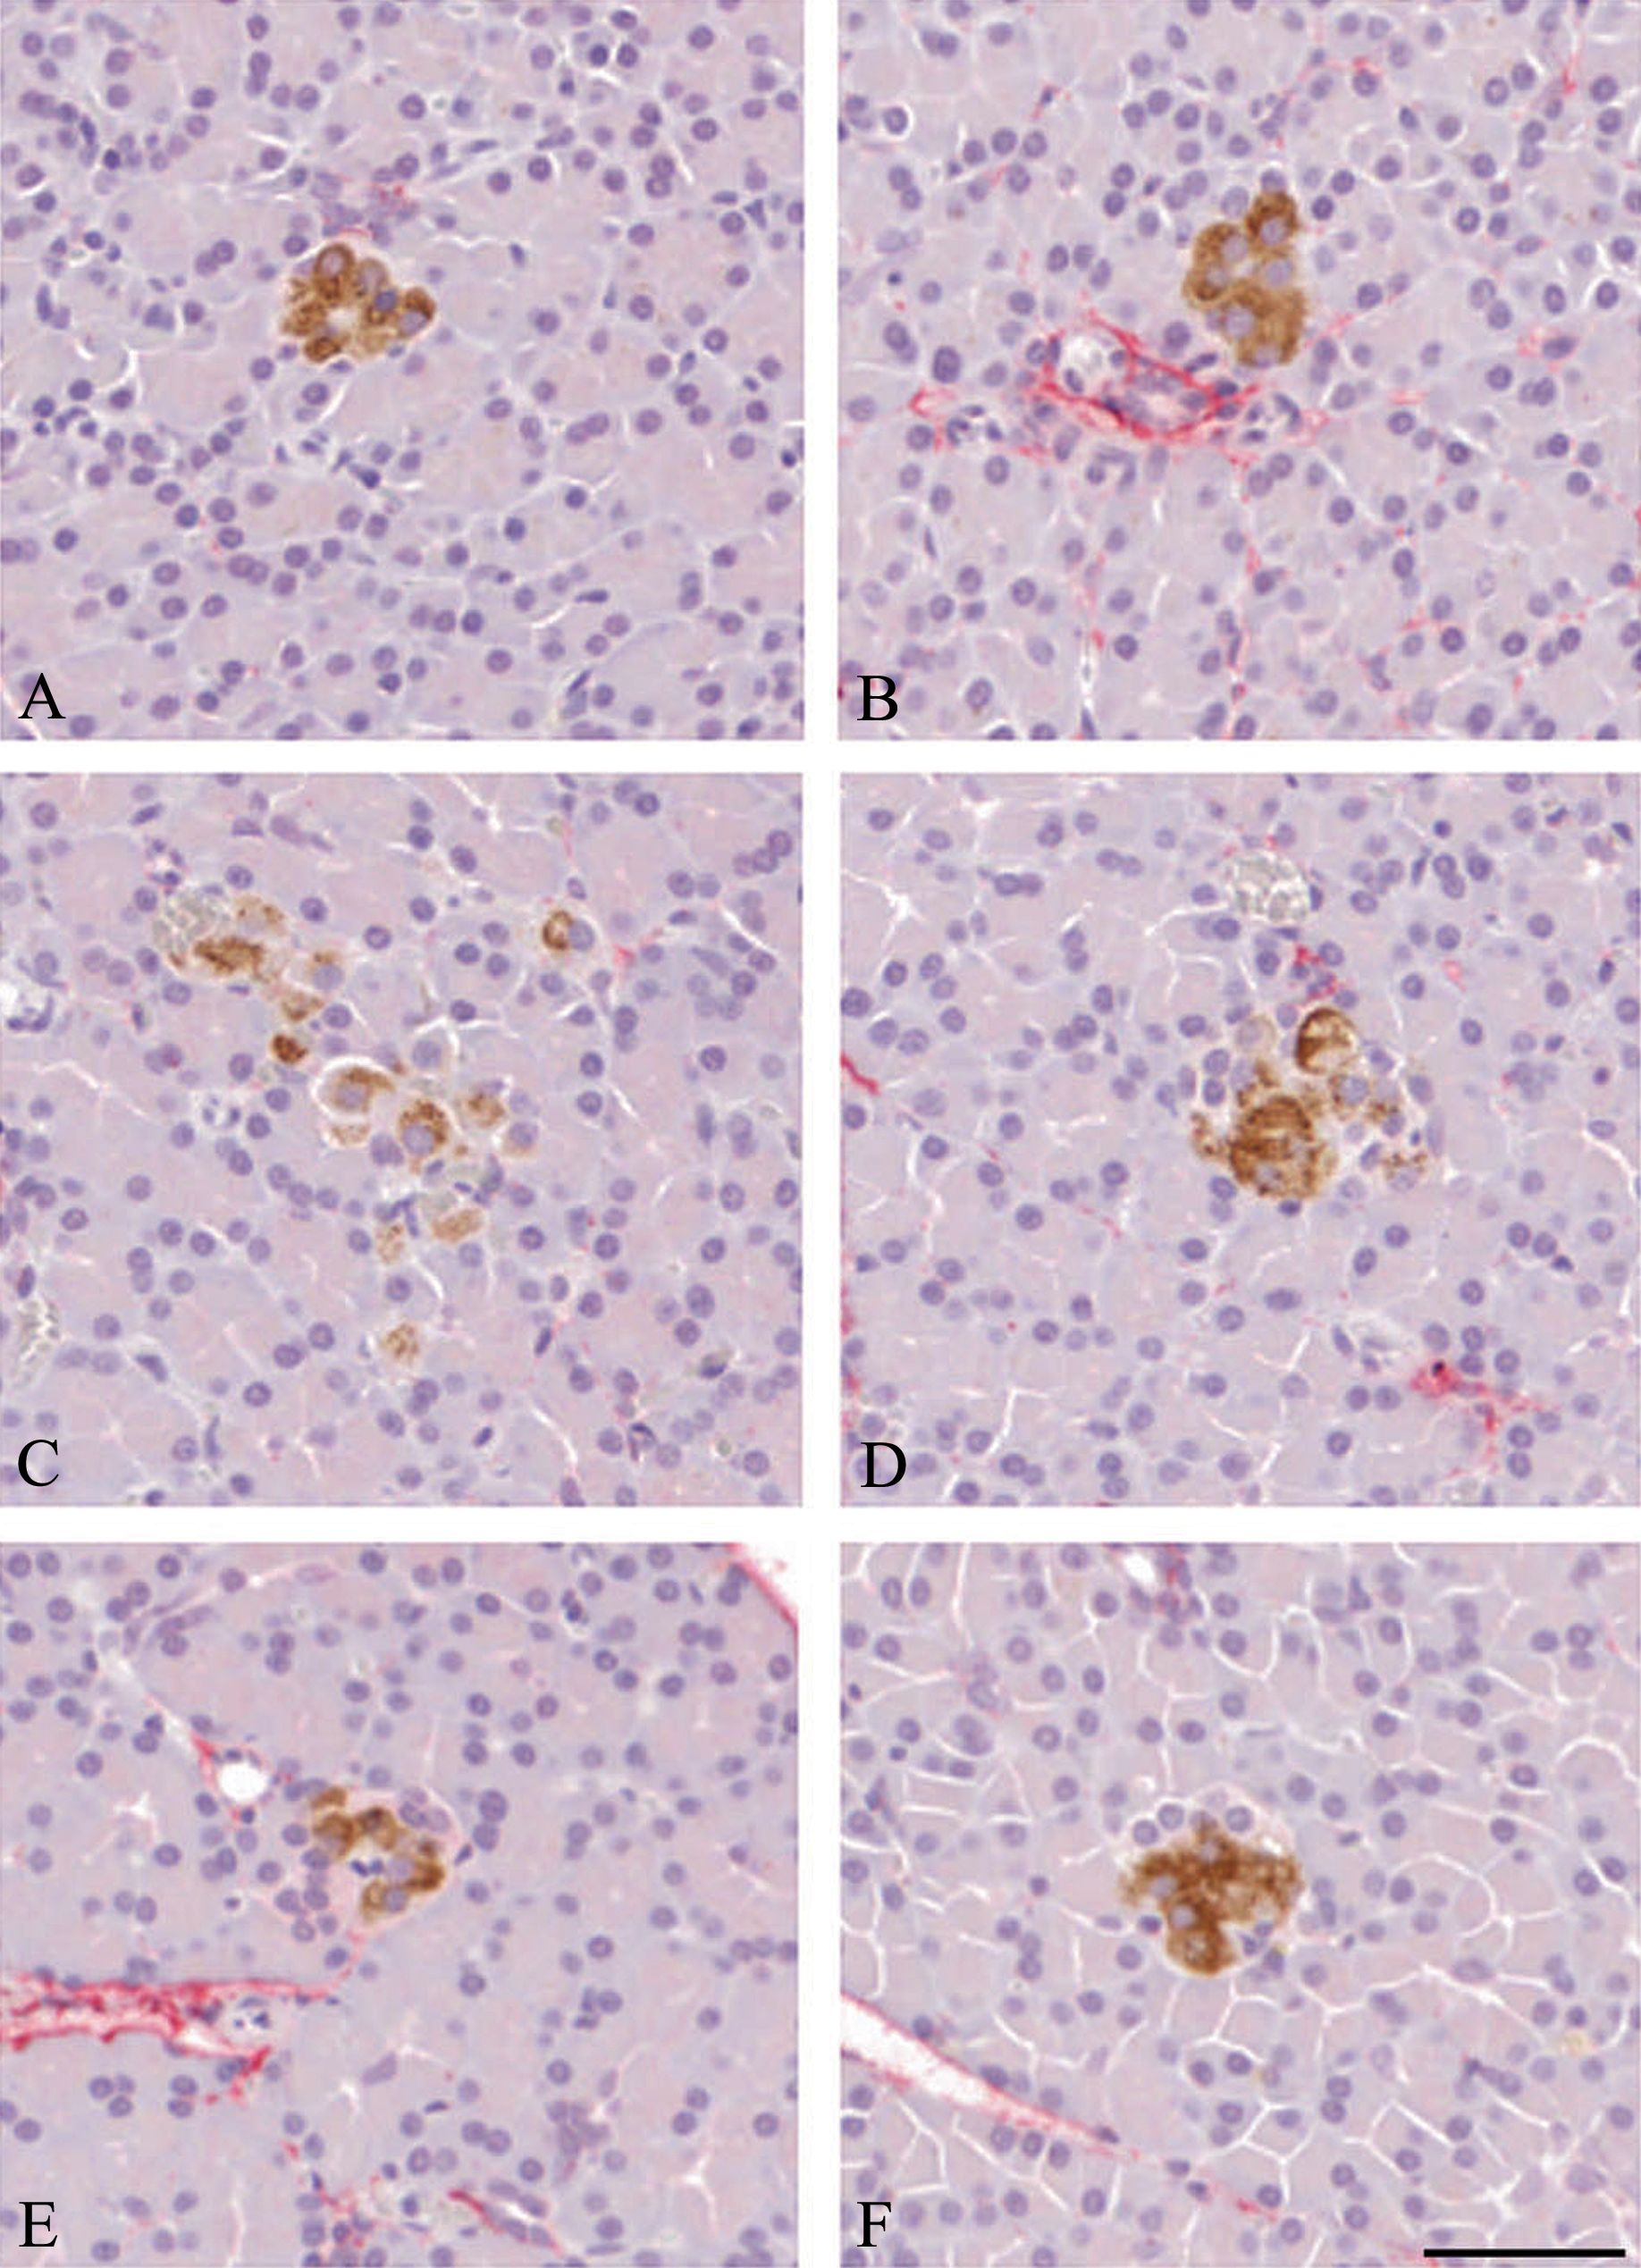
Dual immunostained extra-islet β cell aggregates from (A and B) lean ZDF, (C and D) obese ZDF, and (E and F) rosiglitazone-treated obese ZDF rats. Note first, the absence of inflammatory cells and collagen in all examples shown, and second, that the insulin staining characteristics of these small aggregates are identical to that of islets from the same animals. Neither inflammatory cell infiltrates nor collagen deposition is present in any instance illustrating the apparent islet size dependence of these features. Scale bar = 50μm.
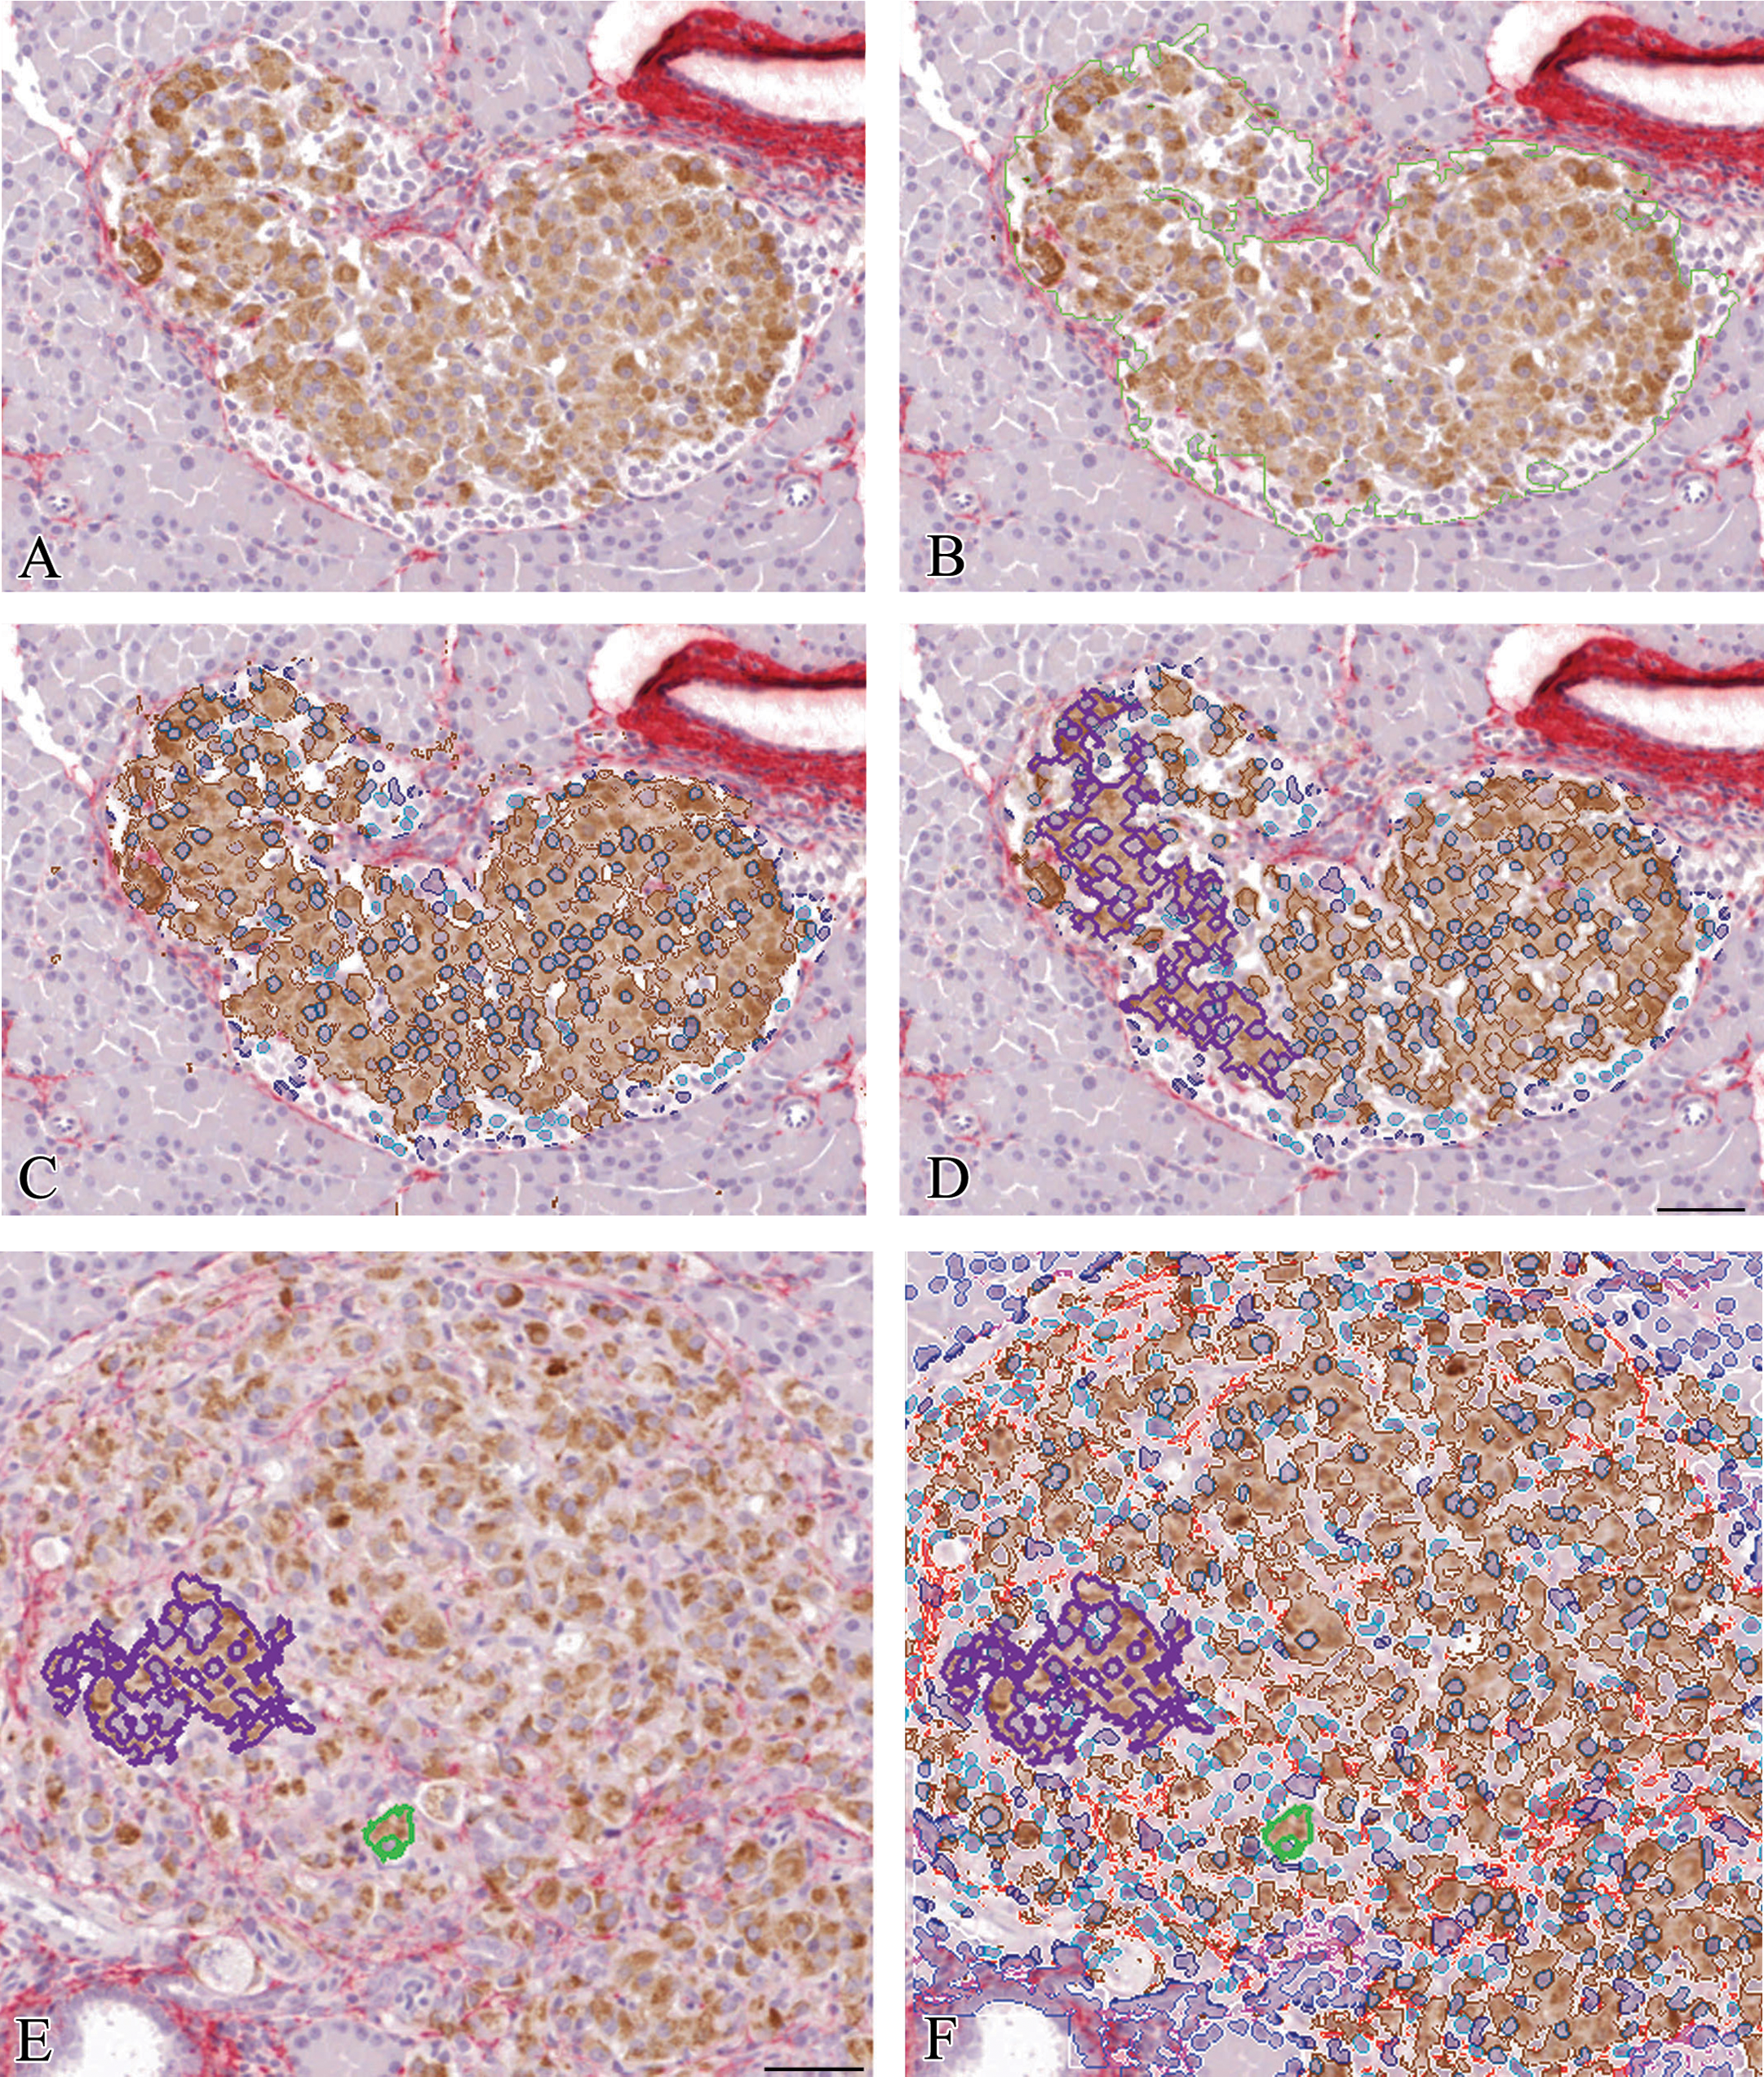
Illustration of regions of interest identified during image analysis of this lean ZDF rat islet, (A) original dual immunostained image ×10, (B) outline of islet generated during automated islet detection (green outline), (C) overlays generated during automated detection of insulin staining (brown), β cell nuclei (dark blue) and other islet nuclei (light blue), and (D) typical islet cluster (purple outline). Note the separation between the islet margin and red-stained periductal collagen. Figures 4E. and 4F. show smaller β cell clusters in an obese ZDF rat islet. A single β cell (green outline) and β cell cluster containing few cells (purple outline) with heterogeneous β cell insulin staining and many nonendocrine cells present illustrate the differences between this islet and that shown in Figure 4A. Scale bar = 50μm.
Calibration of measurements obtained by image analysis was performed using a 0.1 mm per interval graticule (Leica Microsystems, Milton Keynes, United Kingdom) at an objective lens magnification of ×20.
In order to confirm that automatedly measured linear data and nuclear counts were accurately assessed by the image analytical protocol, a total of 57 islets of small to large dimensions from the total of 180 islets (three groups) were compared. Stored islet images, employed for the automated analyses, were used to manually define the perimeter using an operator interactive drawing tool and the numbers of β-cell nuclei (identified by surrounding brown, insulin-immunopositive cytoplasm) counted. The values of manually and automatedly derived values of islet area (µm2) and number of β cells/islet are represented graphically in Figure 5.
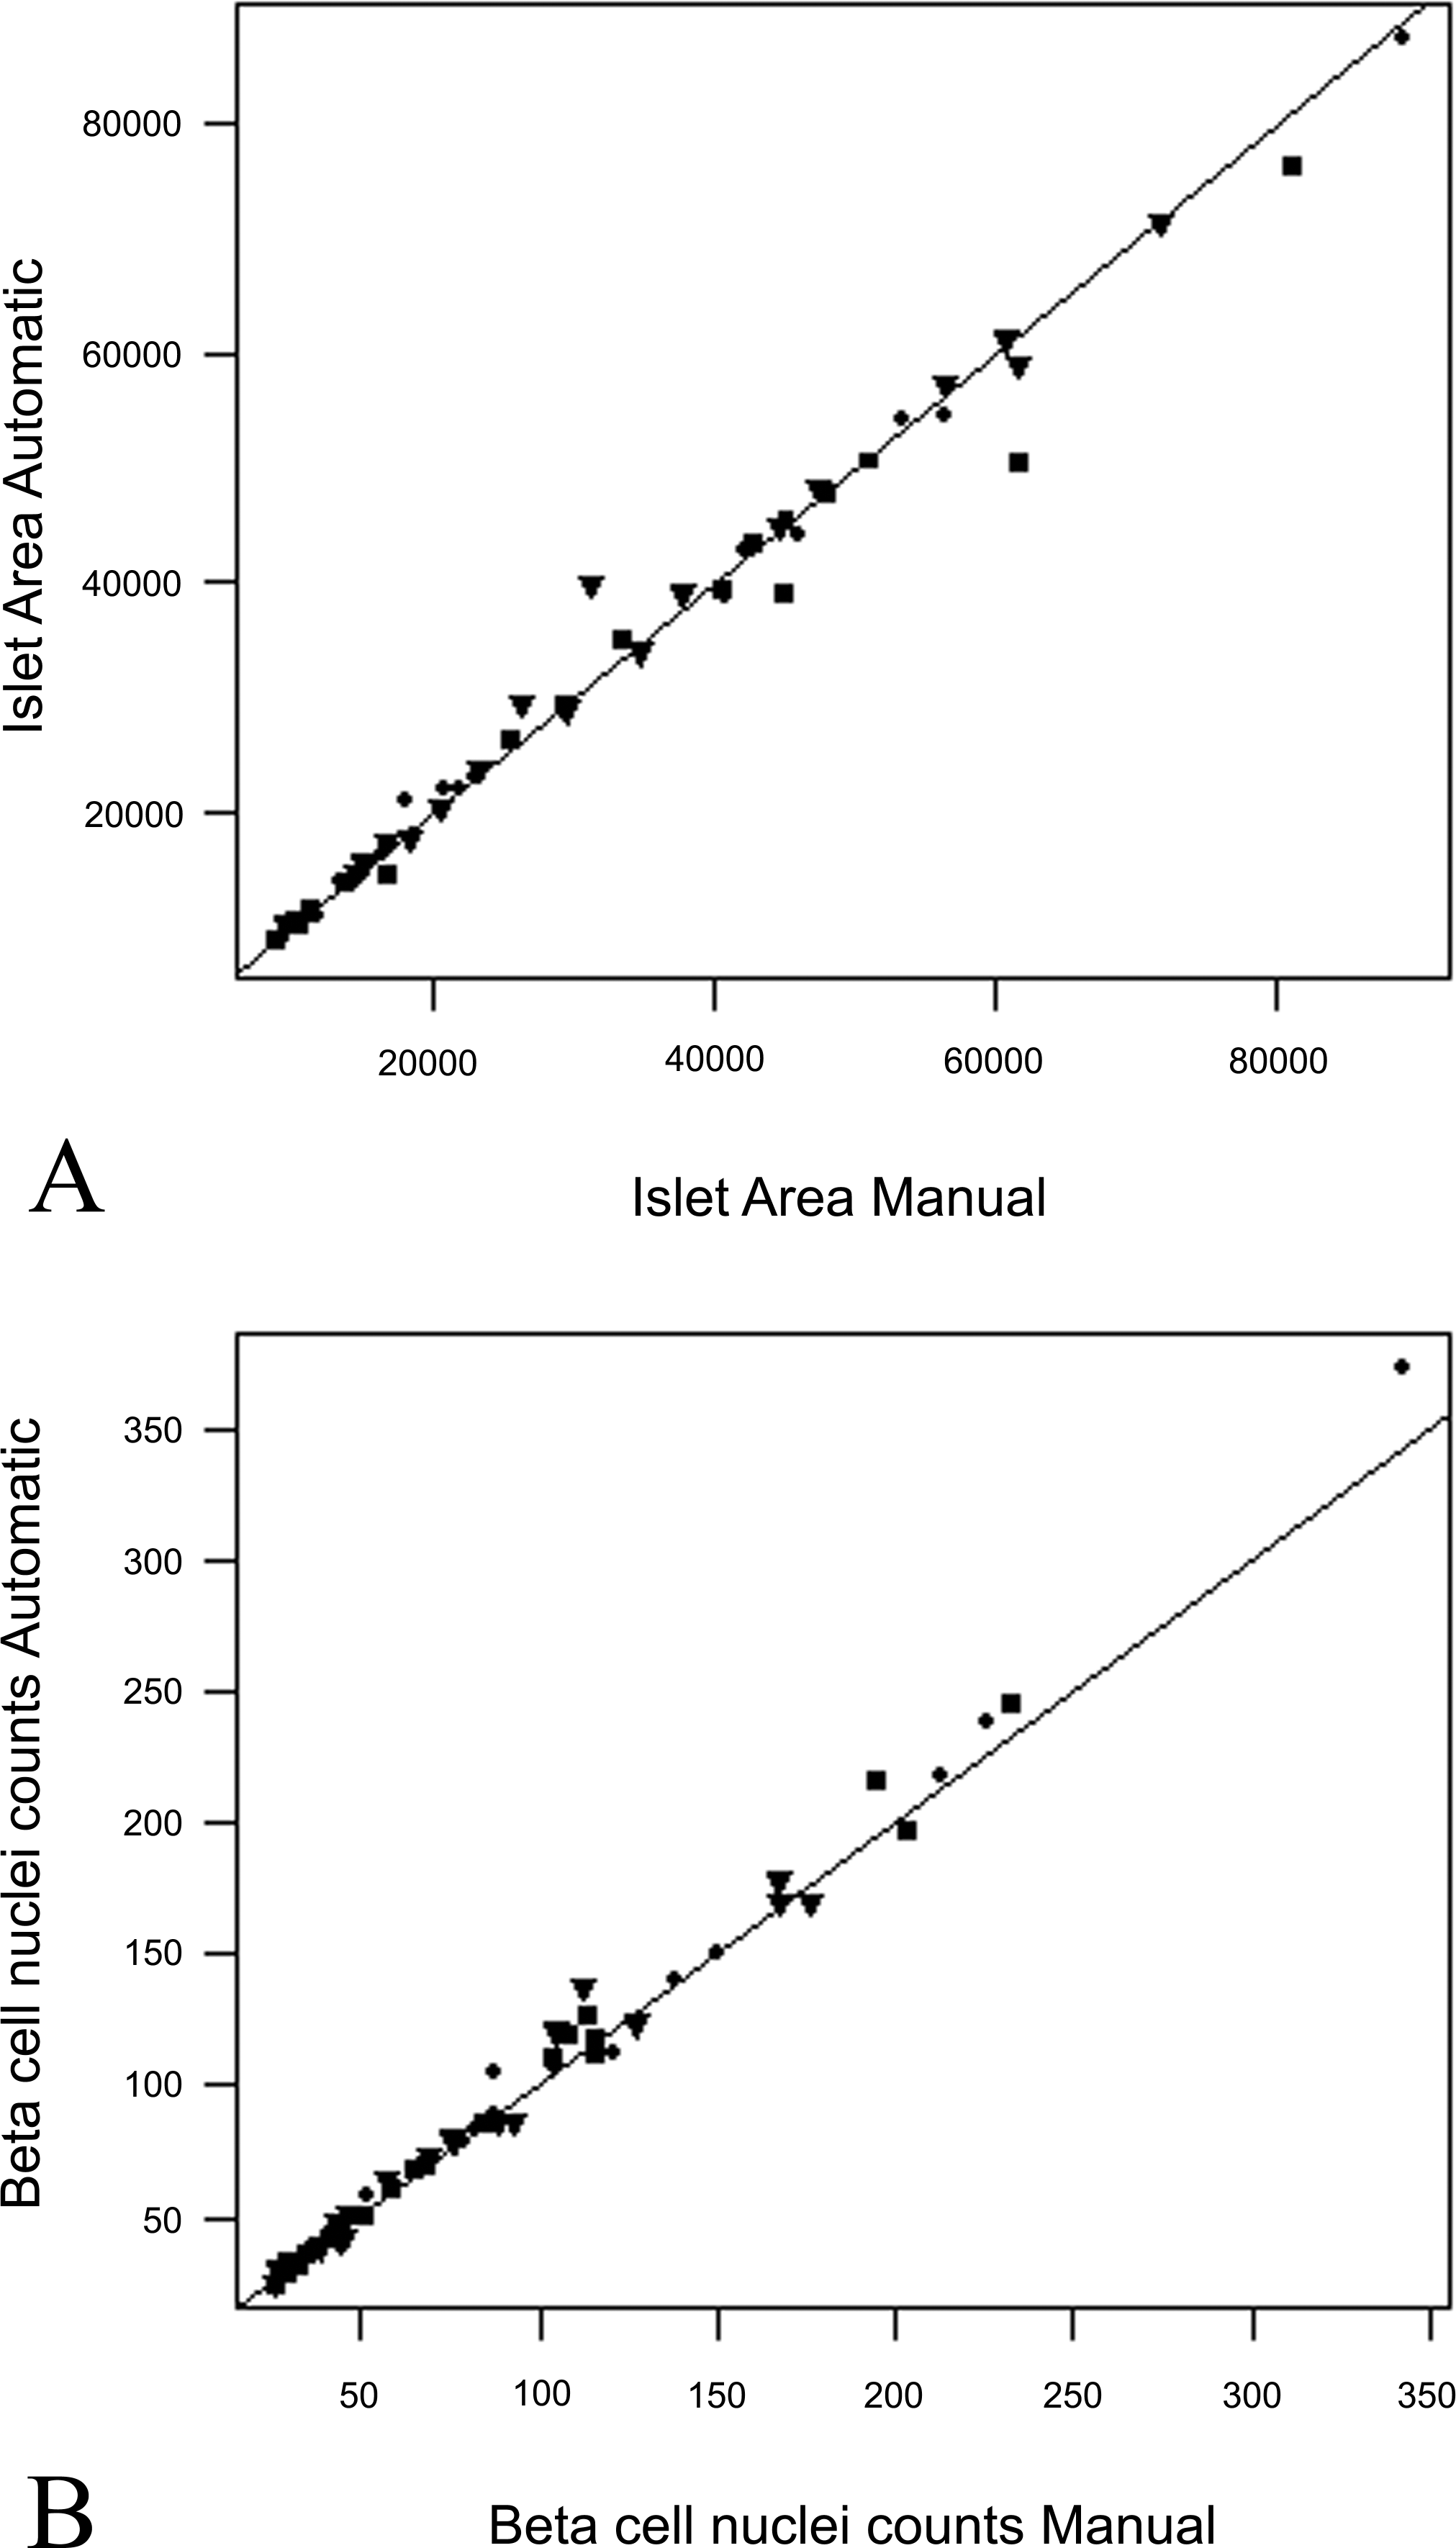
Graphs showing striking agreement between manual and automated measurements of (A) islet area (in each case derived from islet perimeter measures) and of (B) β-cell nuclei numbers per islet from 57 islets from all groups: • lean ZDF controls, ▪ obese ZDF controls, ▾ rosiglitazone-dosed obese ZDF rats.
Measurements obtained from designated islet components in individual tissue sections for incorporation into the statistical model were number of islets, area of insulin, islet-associated collagen and islet area, the number of β-cell and other islet cell nuclei (including other non-β-cell islet endocrine cells, inflammatory cells, fibroblasts, endothelial cells, etc.), an islet form factor (assessing roundness), and the number of β-cell clusters. In addition, intensity of insulin, integrated optical density, area of β-cell clusters, and numbers of β-cells per cluster were gathered to assist in tissue identification and classification during the implementation of the image analysis algorithm. The assessment of islet insulin intensity was measured as the amount of transmitted light: pale staining generated higher intensity and vice versa. When combined with islet area, to create integrated optical density (IOD) (−log10 [insulin intensity/clear glass intensity] × islet area) this integration enabled the relative amount of light absorbing stains and scattering to be determined (Joyce Loebl 1989). In this context, although not a true stoichiometric relationship, an increase in insulin content was represented by a higher IOD and vice versa. The program design specifically selected all islets from the pancreatic sections analyzed but excluded exocrine pancreas, blood vessels, adipose, and connective tissue. It was notable and important for accurate analyses that abundant perivascular and periductal collagen, although vividly stained red, was not incorporated into adjacent islets for subsequent analysis.
Statistical Modeling and Islet Classification
The crux of the statistical problem lay in the diverse array of islet morphological appearances, which appeared in different ratios within all groups of animals rather than individual animal differences within and between groups. We considered that the islet population should be evaluated in its entirety and regarded as consisting of a number of characteristic features, with any pancreatic tissue section providing a random sample of islets from this population. The joint probability distribution of the seven selected islet parameters contains a complete description of their variation and our aim was to determine the best and simplest statistical model for this distribution, using the standard, parametric families of distributions. Note that two standard meanings of “parameter” are used throughout this report. One refers to the measured characteristics of the islets, a meaning based in histopathological description, while the other is the statistical meaning associated with parametric families of probability distributions, whereby a distribution is fixed once its parameter values are known or estimated.
In order to make an independent assessment of the effects of drug treatment in obese ZDF rats, the 7 parametric measurements for the 135 islets from all lean ZDF and obese ZDF control animals only (with the 45 rosiglitazone-treated obese ZDF islets excluded) were used to create the model. The outcome of the histopathological assessment showed that islets reside in a single population of multiple, morphologically characteristic cohorts, and our objective was to use the image analysis data to estimate the number of cohorts and categorize all (180) islets uniquely to a specific cohort. This equated to consideration of the probability distribution of the islet population as a finite mixture of one or more components, with components corresponding to cohorts, which offered a mathematical description of the morphological observations, within which Bayes’ theorem provided the means of islet categorization. We anticipated that the image analysis data contained sufficient information to reflect the underlying diversity of islet morphological types and that the estimated model, particularly the number of components, captured this feature. In short, we used the data to estimate the optimal number of components that accurately reflect islet morphology in terms of the 7 islet parameters measured. We searched throughout a wide family of distributions for a parsimonious model and estimated the number of components together with other distributional parameters.
Our analyses suggested that a two-component model, namely, that which describes islets as either morphologically normal or abnormal, accurately reflects the variety of islet types.
Statistical methodology for fitting and selecting a mixture model and its subsequent application for allocation of islets to a unique component using Bayes’s theorem is well established and implemented in software packages in the R language (Fraley and Raftery 2002, 2010; McLachlan and Cuang 2004; McLachlan and Peel 2000; Mengerson, Robert, and Titterington 2011; Peel and McLachlan 2000).
Data Transformation and Modeling Paradigm
We applied appropriate transformations prior to modeling the data in order to render them amenable to the modeling process and standard transformations were adopted, namely square roots for count variables and log transforms for continuous variables. The negative logit of the square root of the Form Factor was employed to extend its theoretical range from the interval (0,1) to the entire real line. In reality, the square root makes little difference to statistical outcomes, but its employment induced more symmetry to the data. The logit is the primary function that extends the range, the sign change bringing its direction into line with other variables, for which low and high values correspond to normal or abnormal islet morphology, respectively. Such transformations bring about various desirable properties in data analysis, such as stabilizing variance or improving normal distribution assumptions. Our aim was to reduce data skewness and variation for the sake of computational accuracy and to simplify the family of probability distributions that adequately model the data by restricting the number of distributional parameters that need to be estimated. Simultaneously, this approach also retained sufficient flexibility to capture any relationships within the data that might partition the islets into two or more morphological types.
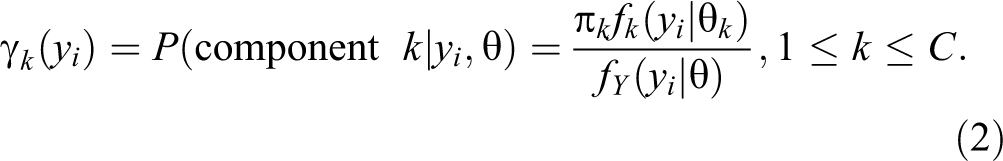
In order to avoid presumption regarding the composition of the islet population, we assumed that it contained an unknown number of components, C ≥ 1. For each component, the seven dimensional random vector of islet parameters, Y, had a different joint probability density function, f
k
, so that the probability density function of Y for the entire population was a finite mixture of these latter components:

For C > 1, the category probabilities of any observational vector y
i
, are given through Bayes’ theorem as:
With two categories of islets identified, our decision rule is expressed as a single number calculated from the value of

In order of increasing complexity (i.e., number of distribution parameters), candidate families of probability distributions for individual components are the multivariate normal and the multivariate t distribution (heavier tails to allow for the possibility of more extreme values), and for modeling skewness, the skew-normal and skew-t, and so on (Fraley and Raftery 2002; Lin 2009; Kotz and Nadarajah 2004; McLachlan and Peel 2000). We used 7-dimensional distributions in which case normal distributions require up to 35 parameters (a mean vector and variance–covariance matrix), 36 parameters (t distribution), 42 parameters (skew normal distribution), 43 parameters (skew-t), and so on. Clearly, each statistical distribution component requires this number of parameters, so that an additional component increases complexity to a substantial degree. The Bayesian Information Criterion (BIC) was used to choose the final model and is designed to select parsimonious models, achieved through balancing goodness of fit and complexity, and is reported to work well for mixtures (Fraley and Raftery 2002). The method begins with the simplest models (here, those with multivariate normal components) and shifts to the next layer of complexity as long as BIC is reduced, and stopping when the next level gives an increase in BIC. An increase of BIC equates with improvement in the fit of the model being outweighed by the extra complexity required to achieve it.
For multivariate normal components only, the R package MCLUST (Fraley and Raftery 2010) performs maximum likelihood estimation via the EM (Expectation Maximization) algorithm for fixed
Results
Plasma Biochemistry (Table 1)
Obese ZDF rats at day 1 showed few differences in parameters between lean ZDF controls and rosiglitazone-dosed obese ZDF groups. On day 28, obese ZDFs displayed moderate or marked increases in glucose, insulin, glycated hemoglobin, triglycerides, NEFAs, and fructosamine. By comparison, those obese ZDF rats given rosiglitazone showed substantially smaller increases in glucose, insulin, and glycated hemoglobin only, and no changes or reductions in triglycerides, NEFAs, and fructosamine. Cholesterol was unchanged in both groups at both times. Lean ZDF rats showed low glucose, insulin, and glycated hemoglobin values characteristic of noninsulin resistant or nondiabetic animals. These physiological data are indicative of distinct differences between lean and obese ZDFs and that rosiglitazone treatment of obese ZDFs results in a shift toward the lean phenotype.
Plasma biochemistry showing substantial and characteristic differences between groups.
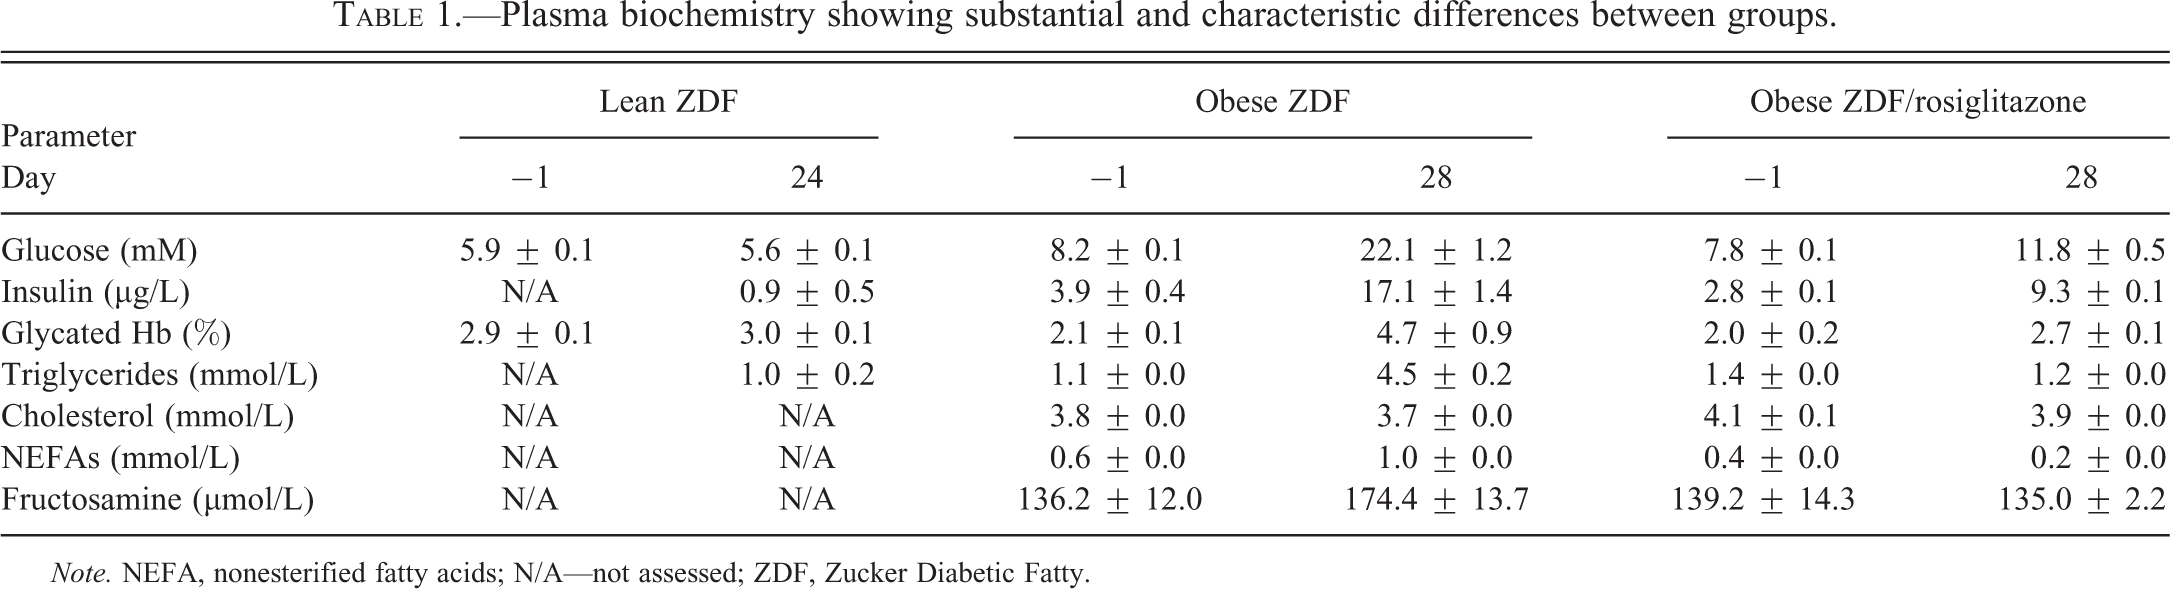
Note. NEFA, nonesterified fatty acids; N/A—not assessed; ZDF, Zucker Diabetic Fatty.
Histopathology
The appearances of lean ZDF islets regarded as “normal” were comparable to those of non-insulin resistant or non-diabetic rat strains such as Han or AP Wistar rats and characterized by generally small, rounded islets consisting of centrally located β-cells, with the remainder of the islet endocrine cell types circumferentially situated in a narrow marginal rim (Figure 6A and B). Neither inflammatory cell infiltration nor substantial fibrosis was present. Obese ZDF rat islets (Figure 6C–F) showed the features detailed previously (Buckingham et al. 1998; Janssen et al. 2001; Jones, Nugent, and Jenkins 2010), namely β-cell vacuolation, degeneration, apoptosis, vascular congestion, frequently with associated mononuclear inflammatory cell infiltration and fibrosis, these degenerative characteristics being definitive of “abnormal” islets. Often, the variation in the degree of islet degeneration in individual animals was considerable and varied from some small islets that showed little or no change in appearance from those of nondiabetic rat strains (although some showed substantial β-cell hypertrophy) and others that were often markedly hyperplastic/hypertrophic with varying degrees of degeneration, inflammatory cell infiltration, and fibrosis. A small minority were effete, resembling a fibrous scar containing a few degenerate β-cells within. Individual tissue sections displayed small, rounded islets together with larger, hypertrophic/hyperplastic islets, some of which were irregularly shaped and showed substantial degenerative features as described above. Islets of rosiglitazone-treated obese ZDF rats (Figure 6G and H) were remarkable in that they more closely resembled those of lean ZDFs (Jones, Nugent, and Jenkins 2010) and showed reductions in both β-cell degenerative features and inflammation/fibrosis by comparison with obese ZDF controls. Following rosiglitazone administration, the irregular shape of islets seen in obese ZDF controls was strikingly altered; most islets showed a more regular-contoured perimeter although features of hyperplasia remained, that is, protrusions of islet tissue into adjacent exocrine tissue. Furthermore, retained features of obese ZDF rat islets following rosiglitazone treatment (Figure 6G and H) were irregular profiles (more and less respectively than lean and obese ZDF controls) and vascular dilatation; although this latter was much reduced in severity it remained more prominent than in lean ZDF controls.
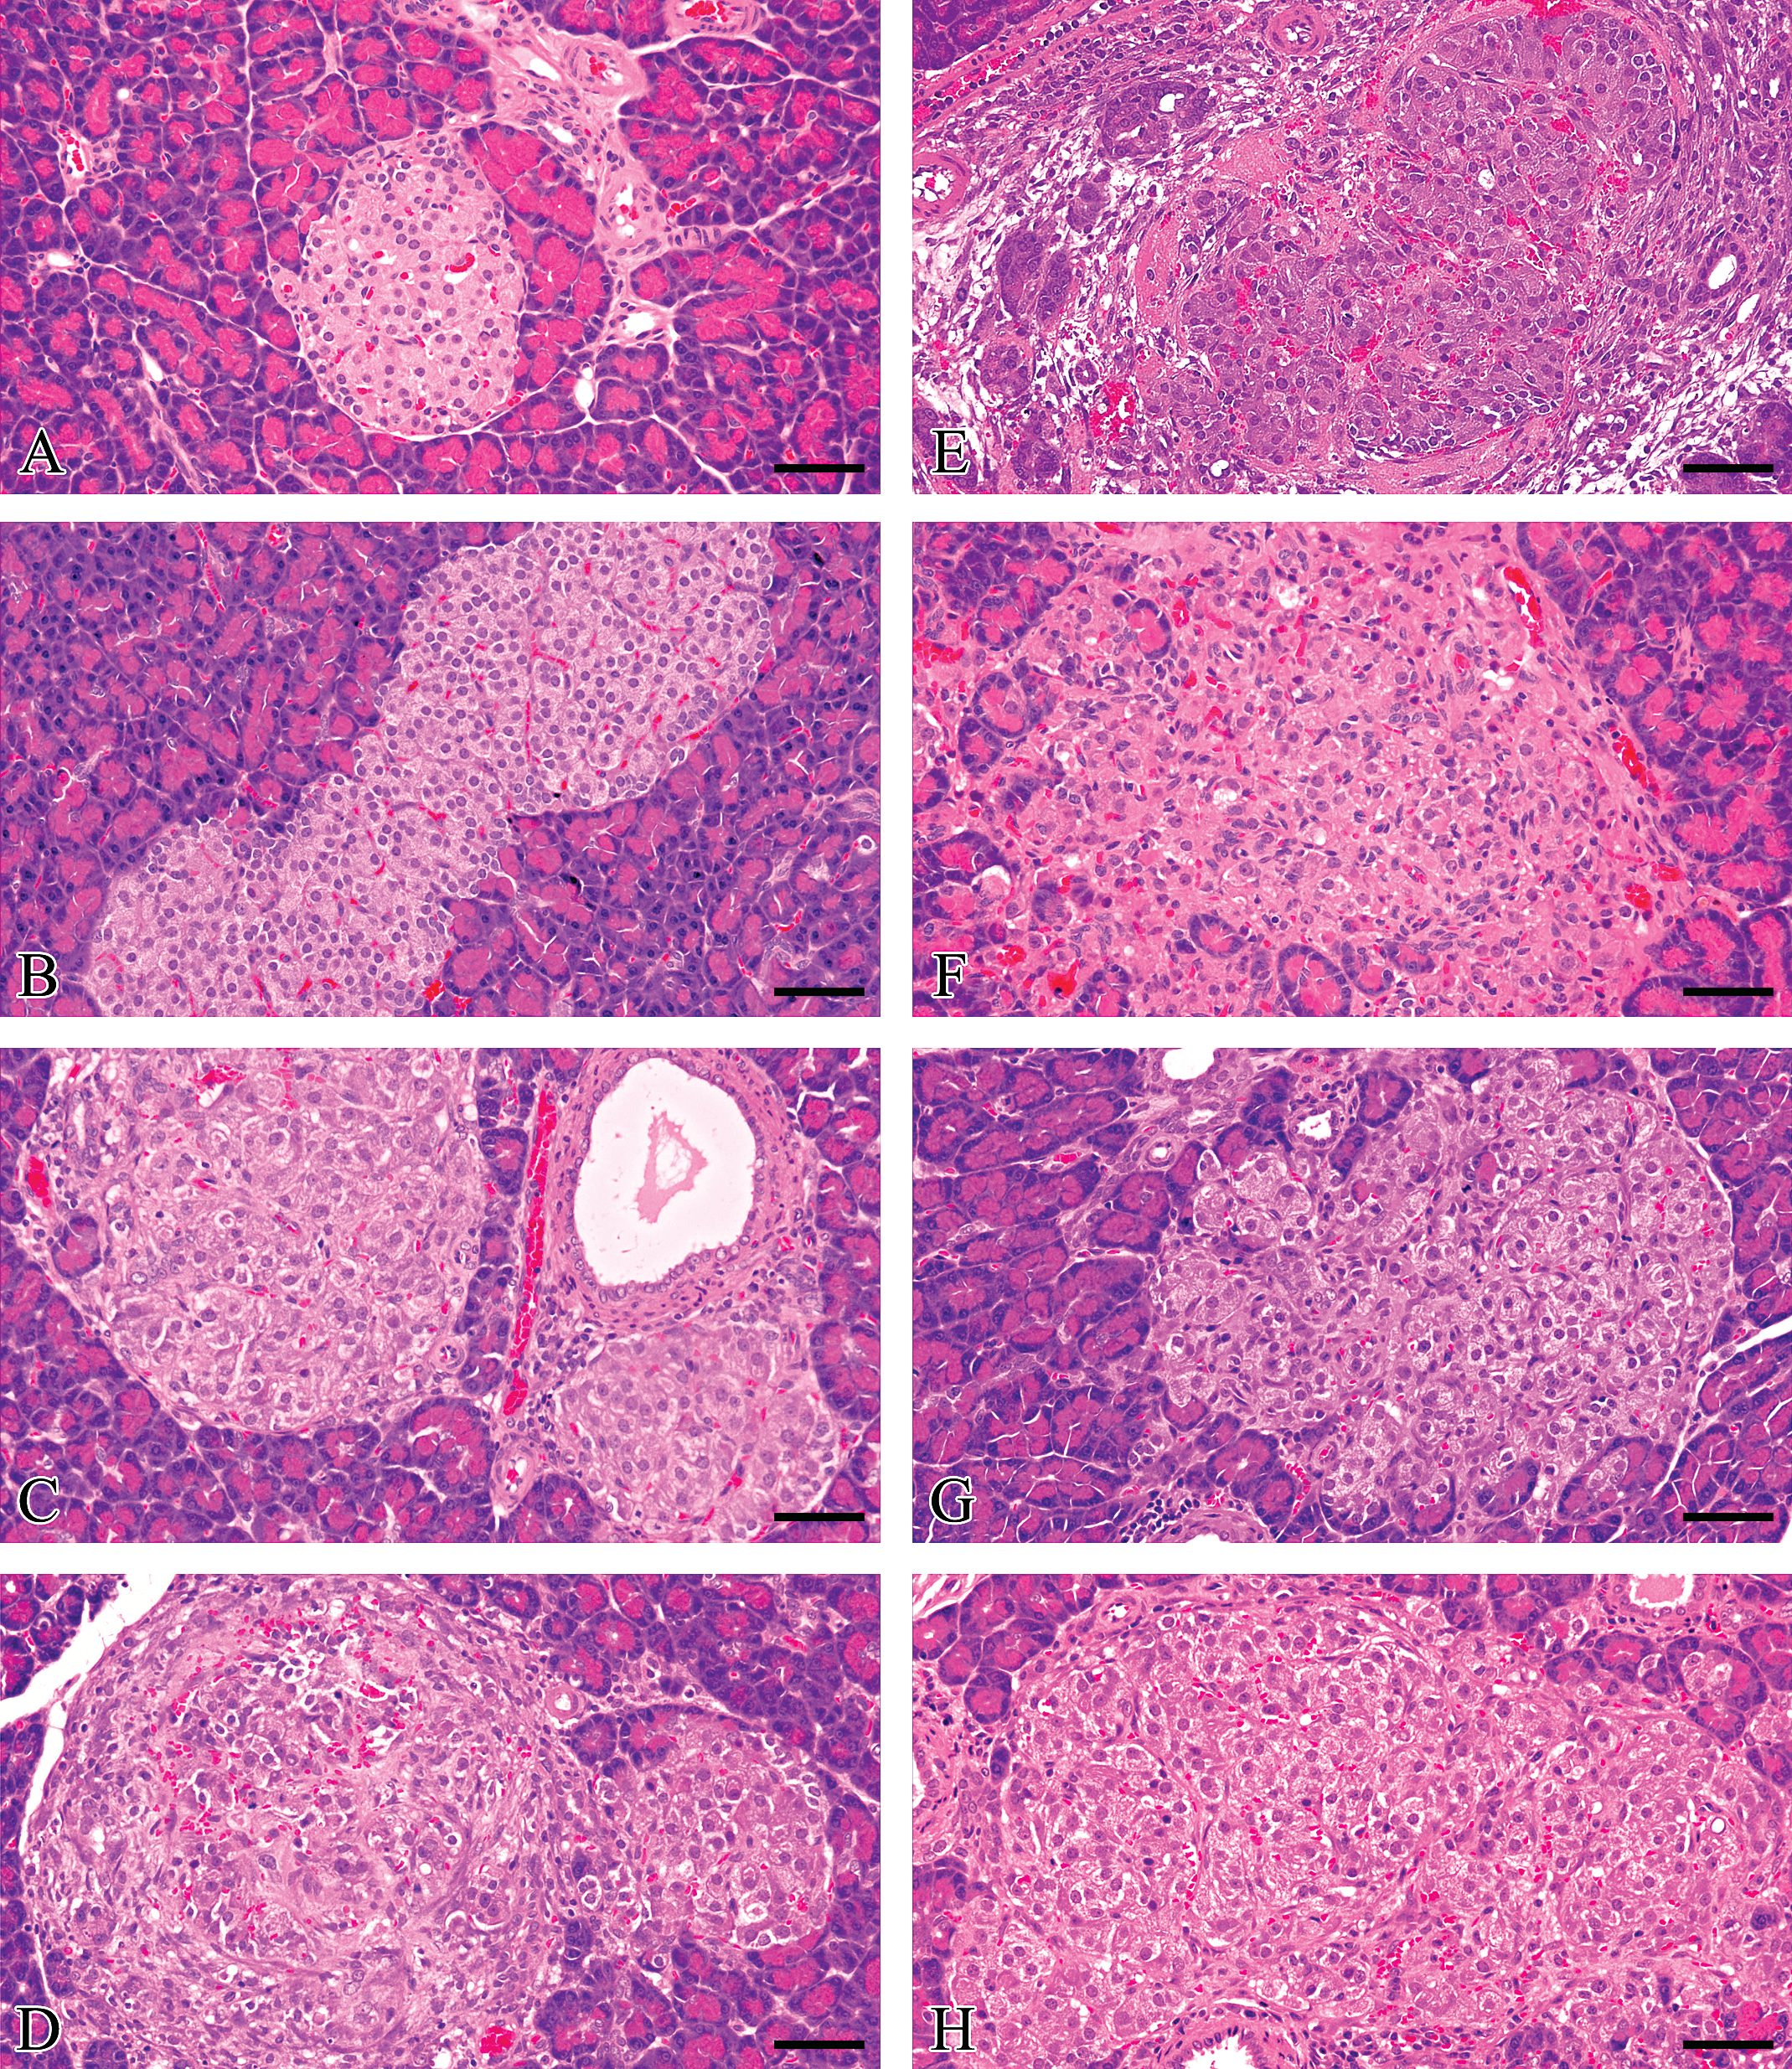
Representative images of several islets per group to illustrate the range of histopathological characteristics present in single pancreatic tissue sections. (A, B) Small and large islets from lean ZDF rats showing smooth-contoured perimeter with centrally situated β cells enveloped by other non-β cell endocrine cells and neither inflammatory cell infiltration nor fibrosis; (C–F) obese ZDF islets showing (C) two islets displaying mild hypertrophy and vascular congestion, (D) two adjacent islets with irregular contours, one showing hypertrophy alone while the other exhibits β cell degeneration/necrosis, hemorrhage, inflammatory cell infiltration, and fibroplasia/fibrosis, (E) irregular contoured islet with marked acute inflammatory cell infiltration, vascular congestion, and hemorrhage, (F) irregular contoured degenerate islet showing few β cells with cytoplasmic vacuolation and minor chronic inflammatory cell infiltrate/fibrosis; (G, H) rosiglitazone-treated obese ZDF rat islets with retained irregular contours, very little or absent inflammatory cell infiltration/fibrosis. Scale bar = 50μm.
Dual insulin/collagen immunohistochemical staining revealed brown-stained β-cells in centrally located clusters within islets and red-stained collagen both within and around islets and adjacent to blood vessels and exocrine ducts (Figure 2). This red-stained collagen that effectively defined the site of fibrous connective tissue was present as interlacing thin threads or skeins and separated islet β-cells into small and larger clusters. In obese ZDF controls, insulin staining intensity was heterogeneous but overall paler when compared with lean ZDFs and rosiglitazone-treated obese ZDF rats in which it was, in most islets, strikingly intense and consistently homogeneous (Figure 2). The heterogeneous insulin staining was characterized by focally dense β-cell cytoplasm adjacent to less dense staining of the same cell, resulting in a reticulated staining pattern of the islet β-cell population.
The dual staining method revealed small, extra-islet aggregates of β-cells unassociated with other islet endocrine cells or inflammatory cells (Figure 3). While the intensity of insulin staining in these aggregates resembled closely that seen in adjacent islets, indicating that their insulin functional state paralleled that of islets within the same tissue section, their collagen content was unremarkable and suggests the absence of associated overt inflammatory processes.
Image Analysis: Corroboration of Automatedly Derived Measurements
The comparison between automated analysis and manual counts for 57 islets demonstrated a good relationship between the two data sets, for both islet area and β-cell nuclear counts (Figure 5).
Mathematical Model Estimation and Evaluation
The smallest BIC value of approximately 2,602 from normal component models estimated by MCLUST was achieved by a two-component model that also had the most complex general covariance structure. The next level of complexity provided a two component multivariate t distribution with an improved BIC value of 2,570, a substantial improvement at the expense of just two additional distribution parameters. It is noteworthy that a decrease in BIC of 10 represents very strong evidence of model improvement (Fraley and Raftery 2010). Experimentation with skew families of distributions gave BIC values in excess of 2,603, indicating that the extra complexity of seven skewness parameters per statistical model component was unnecessary.
Assessment of Fit and Categorization of Islets
Due to the very general nature of the final chosen model, assessment of quality of data fit was performed through a parametric bootstrap method. The 135 values of each of the 7 islet parameters (i.e., all islets from both control groups used to estimate the model) were transformed using the cumulative distribution function (CDF) derived from the fitted mixture model, each of which would produce observed values from a standard Uniform distribution if the model was exact. In any one dimension, this forms the basis of a P-P plot, from which it is possible to test the hypothesis of uniformity using the correlation between the ordered CDF values and the expected Uniform order statistics (Gan and Koehler 1990). We used an extension of this test applied to the multidimensional case, by taking the smallest of the 7 correlations as the test statistic: a value far from 1 would indicate a poor fit. The observed value of the test statistic was 0.996 and the p value (the probability of obtaining a value from the fitted model that is worse), that is <0.996, was estimated to be 0.62 using 10,000 simulated samples of 135 data vectors from the fitted model. This p value equates to an estimated 62% of samples of 135 data vectors from the fitted model being worse than our observed sample as measured by this test statistic and as this is well above the 5% level of significance, this predictive model can be employed with confidence. A selection of 9 contour plots (of the possible 21 available) of the marginal bivariate density functions from the fitted model, superimposed on the total number of data points (islets), for pairs of 7 islet parameters are shown in Figure 7. Using two dimensions at a time allows visualization of the high degree of agreement between the 7 dimensional models and data, and clearly indicates the separation of islet types into two distinct cohorts.
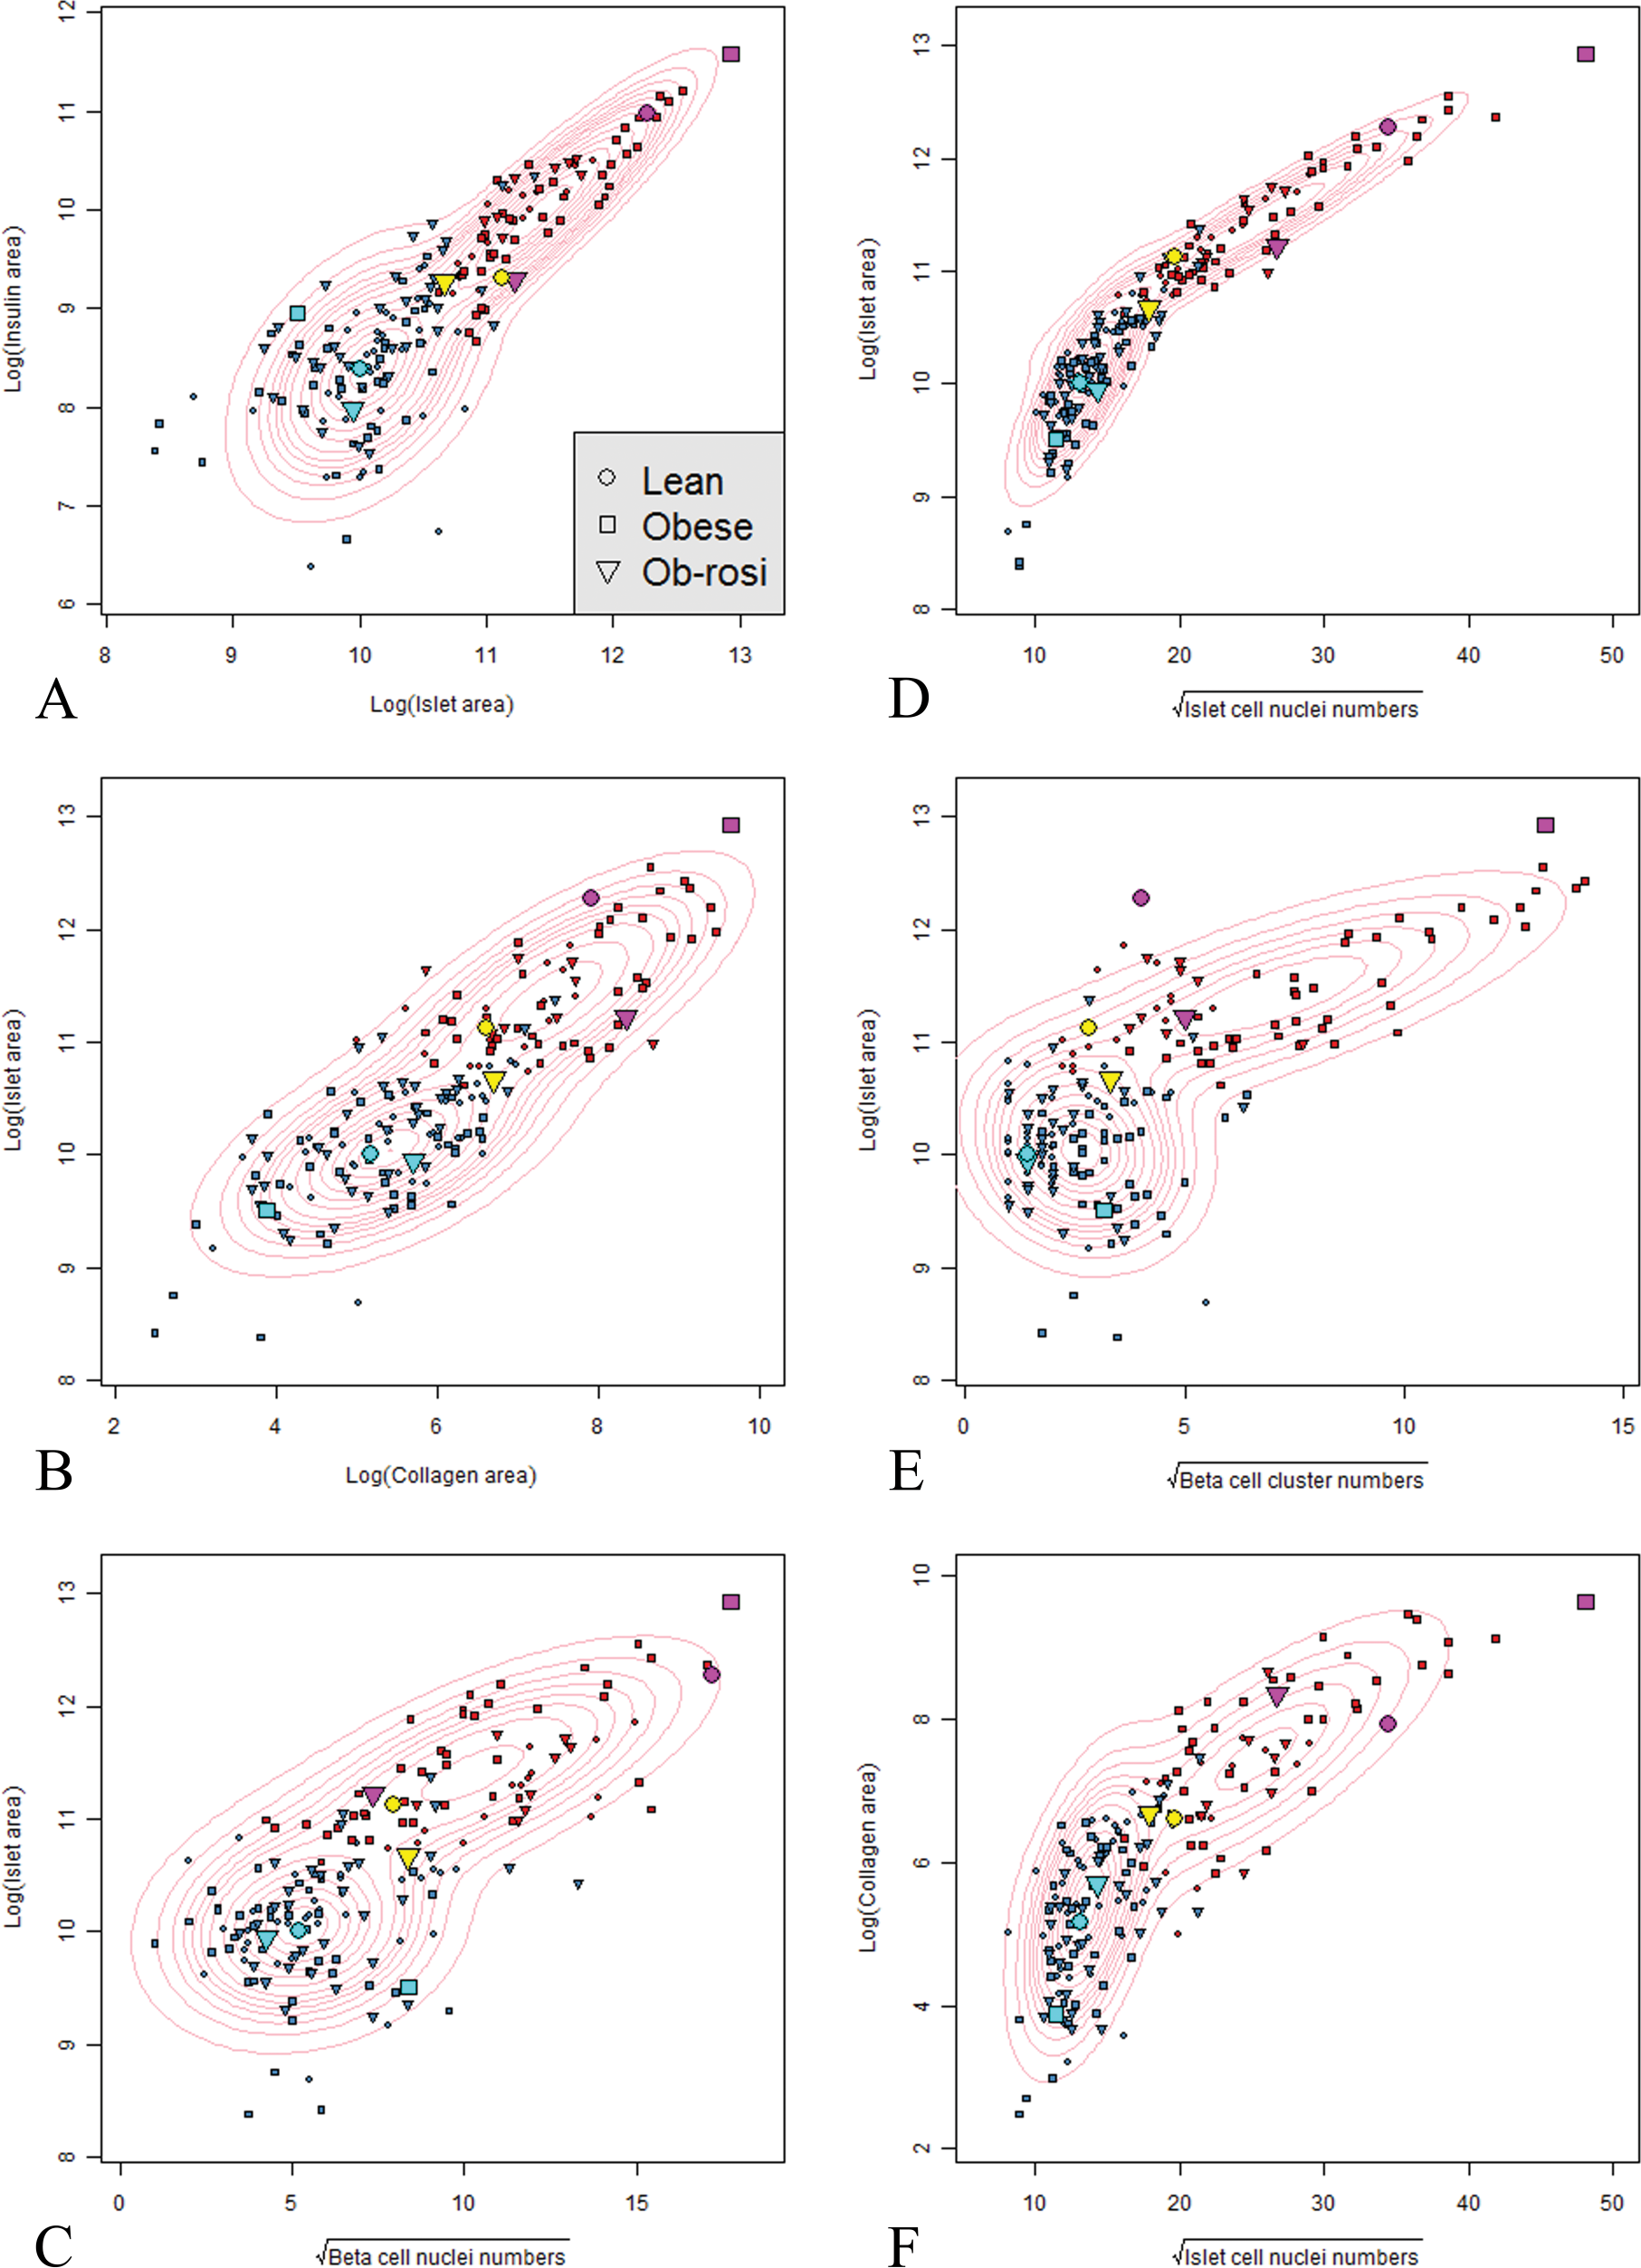
Contour plots of multiple, paired islet parameters (A–I). Each islet is shown color-coded for its calculated categorization as normal (blue) or abnormal (red) and its group identity (symbol shape: • lean ZDF controls, ▪ obese ZDF controls, ▾ rosiglitazone-dosed obese ZDF rats). Specific islet data points are also identified by increased symbol size and color for comparison with image analysis micrographs of these same islets in order to illustrate normal and abnormal islet appearances and features that relate to certain or uncertain prediction of fit as calculated by the model. There is good agreement between the data and model distributions especially in the way the model has captured and highlighted distinct differences in cohort shapes and directions between the identified normal and abnormal islet categories within these two dimensional projections. Note that the appearance of cohort profiles within the contour plots changes in relation to different pairs of variables. (J–Q). Photomicrographs of islets identified by enlarged colored symbols in (A–I). Examination of the morphological appearances of 6 islets highlighted in either pale blue or magenta shows that they display features typical of normal (J, K, L) or abnormal islets (M, N, O), respectively: they are well classified by the model having uncertainties of essentially zero. Those 2 islets defined by yellow points (P and Q) have greater uncertainty of categorization, that is, are near-boundary points as defined by the model in all 7 dimensions. It is noteworthy that individual islets may be classified as abnormal based on single or multiple extreme parameters (scale bar—50 µm).
The uncertainty of the categorization of individual islets plotted against D(y) (Equation 3) for all observations, by experimental group (Figure 8) demonstrates that the majority of islets were well categorized, that is, had low uncertainty. Our model defined a very large majority of islets (170/180) with uncertainty values of <0.1, effectively categorizing them as either normal or abnormal with only 10/180 having uncertainty in excess of 0.1 (See Figure 8 and Table 2).
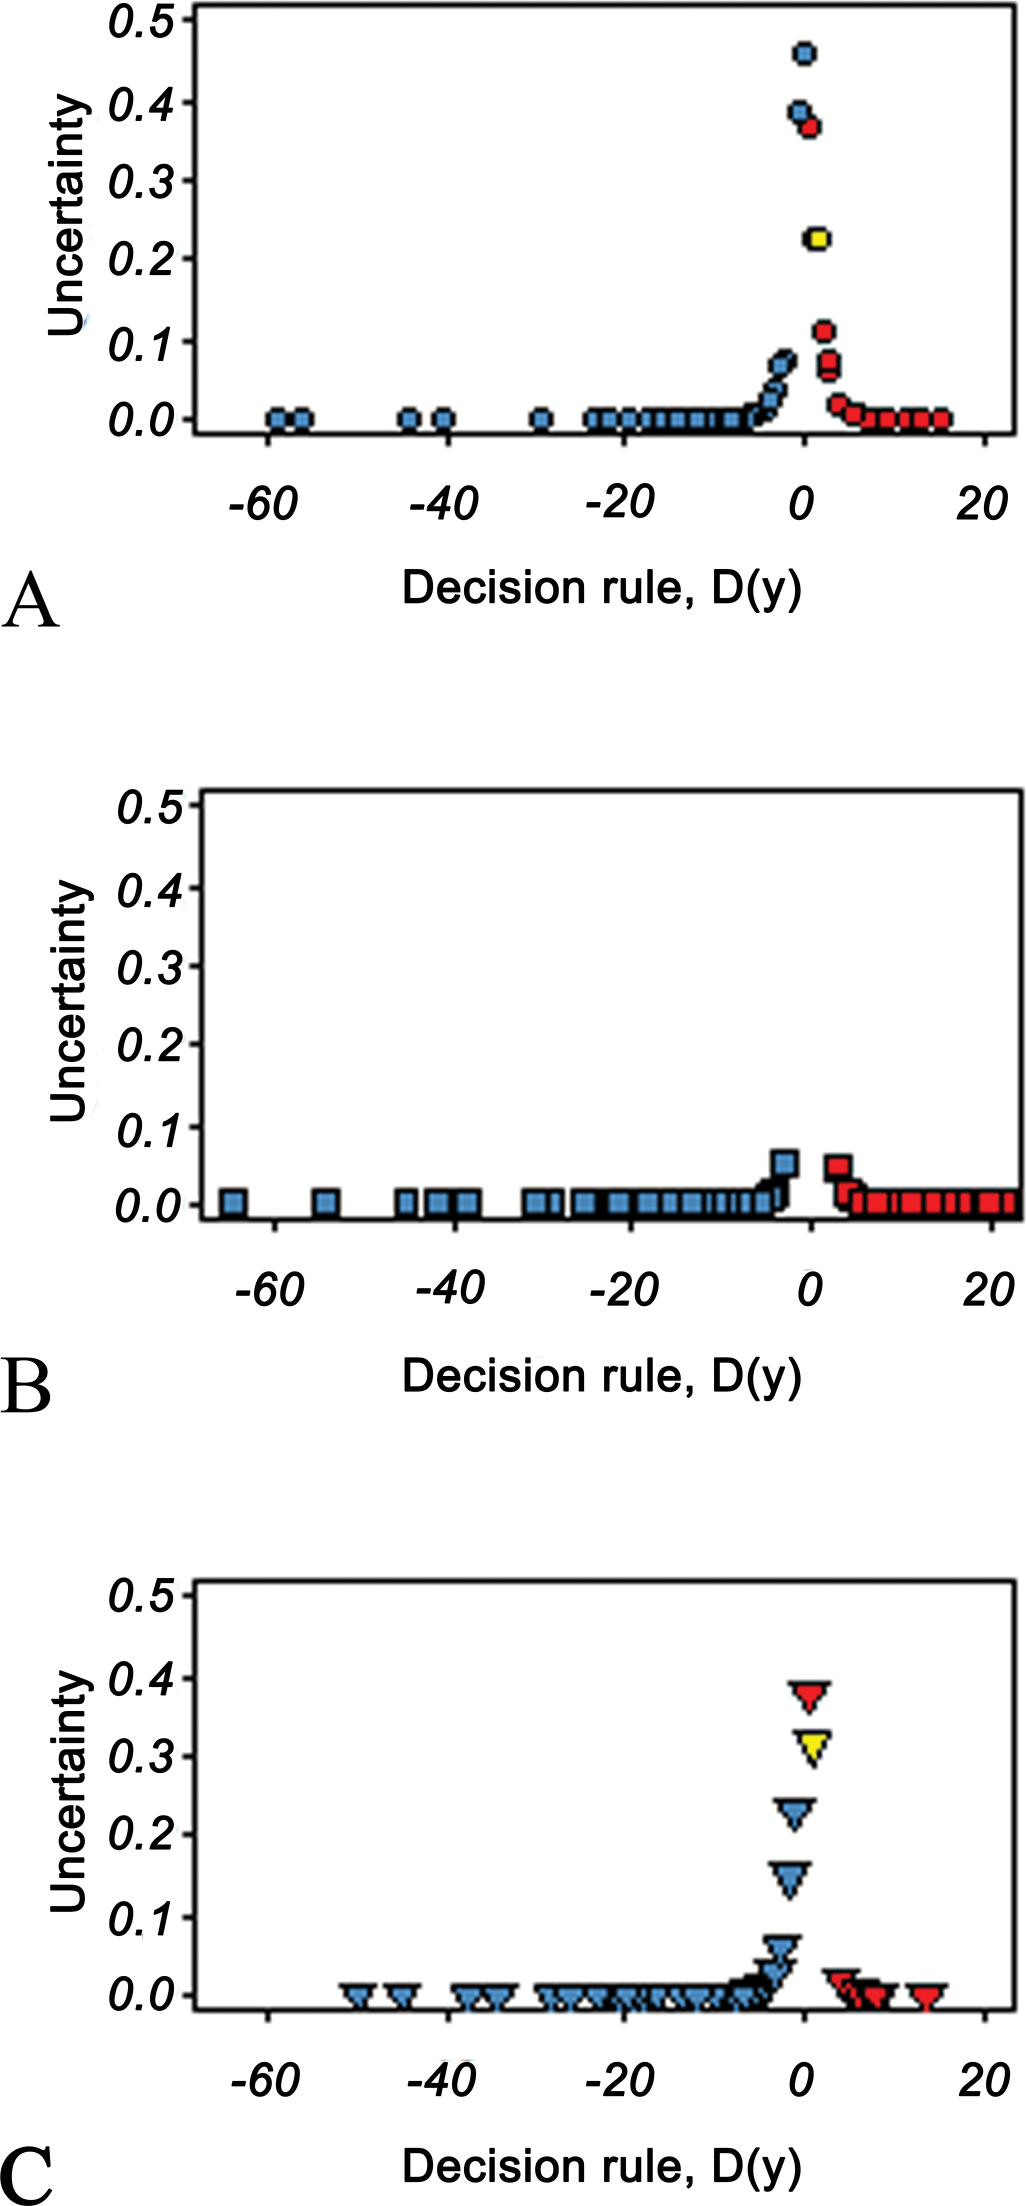
Plot of uncertainty of islet categorization based on 7 islet parameters against the decision rule (D (y)) designating individual islets as either normal or abnormal (to left or right of 0, respectively) by the model. Data from (A) lean ZDF rat islets, (B) obese ZDF rat islets and (C) rosiglitazone-treated obese ZDF rat islets. The peaks show near-boundary islets, that is, those with high uncertainty. The majority of islets have an uncertainty near 0, demonstrating the high quality of islet categorization.
Upper quantiles of the uncertainty distribution of islet categorization.

Therefore, with relatively few “near-boundary” points where the uncertainty is greatest, the outcome generates confidence in islet categorization.
Assessment of Islet Partition by Group
We defined component 1 as the “normal” islet category, corresponding to visual (microscopical) categorization as normal islets that are characteristic of euglycemic (nondiabetic) animals and component 2, as those islets that are morphologically distinct from these former and were characteristic of “abnormal” islets in obese ZDF diabetic rats. Table 3 shows the frequency of islet categorization as either normal or abnormal by animal group and the proportions of abnormal islets in each group as 31.5%, 51.9%, and 22.2%, respectively, indicating that substantial differences exist in obese ZDF control animals by comparison with other groups that display substantial similarity. Comparison of obese ZDF controls with rosiglitazone-treated obese ZDFs, using Fisher’s exact test, gave a p value of 0.001 and for lean ZDFs against rosiglitazone-treated obese ZDFs, a p value of 0.4. Clearly, there is substantial evidence of a difference in the categorization between obese ZDF controls and rosiglitazone-treated animals, with almost no evidence of a corresponding difference between the lean controls and rosiglitazone-treated group.
Classification of islets from lean and obese ZDF controls and rosiglitazone-dosed obese ZDFs using t mixture model.
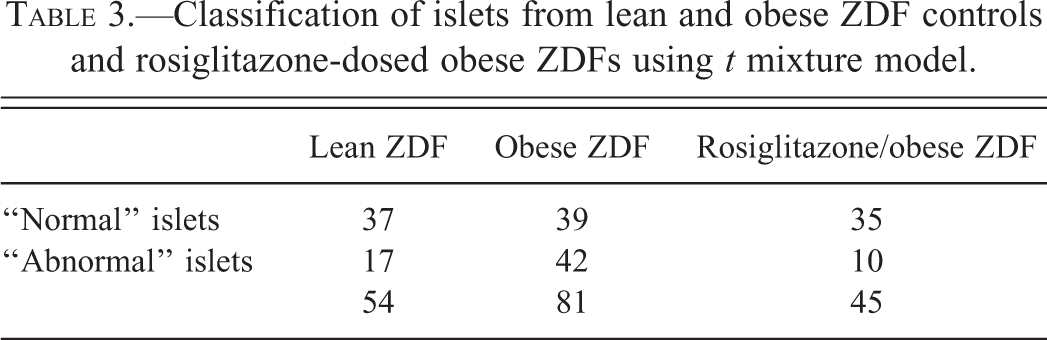
Image Analysis and Statistical Assessment
Image analysis demonstrated quantitative changes in specific cell and matrix components of islets with combinations of morphological features and staining characteristics indicating distinct differences between individual islets and formed the basis of an assessment of islet morphological diversity (Figure 7). Data distribution was not normal and standard statistical analyses were therefore inappropriate. The box plots (Figure 9) provide a visual summary of the distribution of the seven islet parameters (and additionally, β-cell cluster area, Figure 9H) and define median, upper, and lower quartile boundaries and range, and show very little difference between groups with data ranges (especially of the obese ZDF control group) being insufficiently narrow to allow separation. The single exception by comparison with lean ZDF controls and rosiglitazone-treated obese ZDFs is the substantial increase in median β-cell cluster numbers per islet in obese ZDF controls being 5, 6, and 28, respectively. Furthermore, the box plot of β-cell cluster areas (Figure 9H) shows that a substantial range of cluster size exists in all animals. β-cell numbers per cluster and cluster area were small in obese ZDF controls by comparison with lean ZDFs and rosiglitazone-treated obese ZDFs. In lean ZDFs, obese ZDFs and rosiglitazone-treated ZDFs, median cluster area respectively, was 115, 73, and 98 µm2: median β-cell numbers per cluster were 3, 1, and 2, the maxima of the ranges being 255, 28, and 98. These data illustrate that the features of β-cell clusters in islets from obese ZDFs given rosiglitazone resembled more closely those from lean ZDFs than obese ZDF controls demonstrating a remarkable reversal of islet morphological decline.
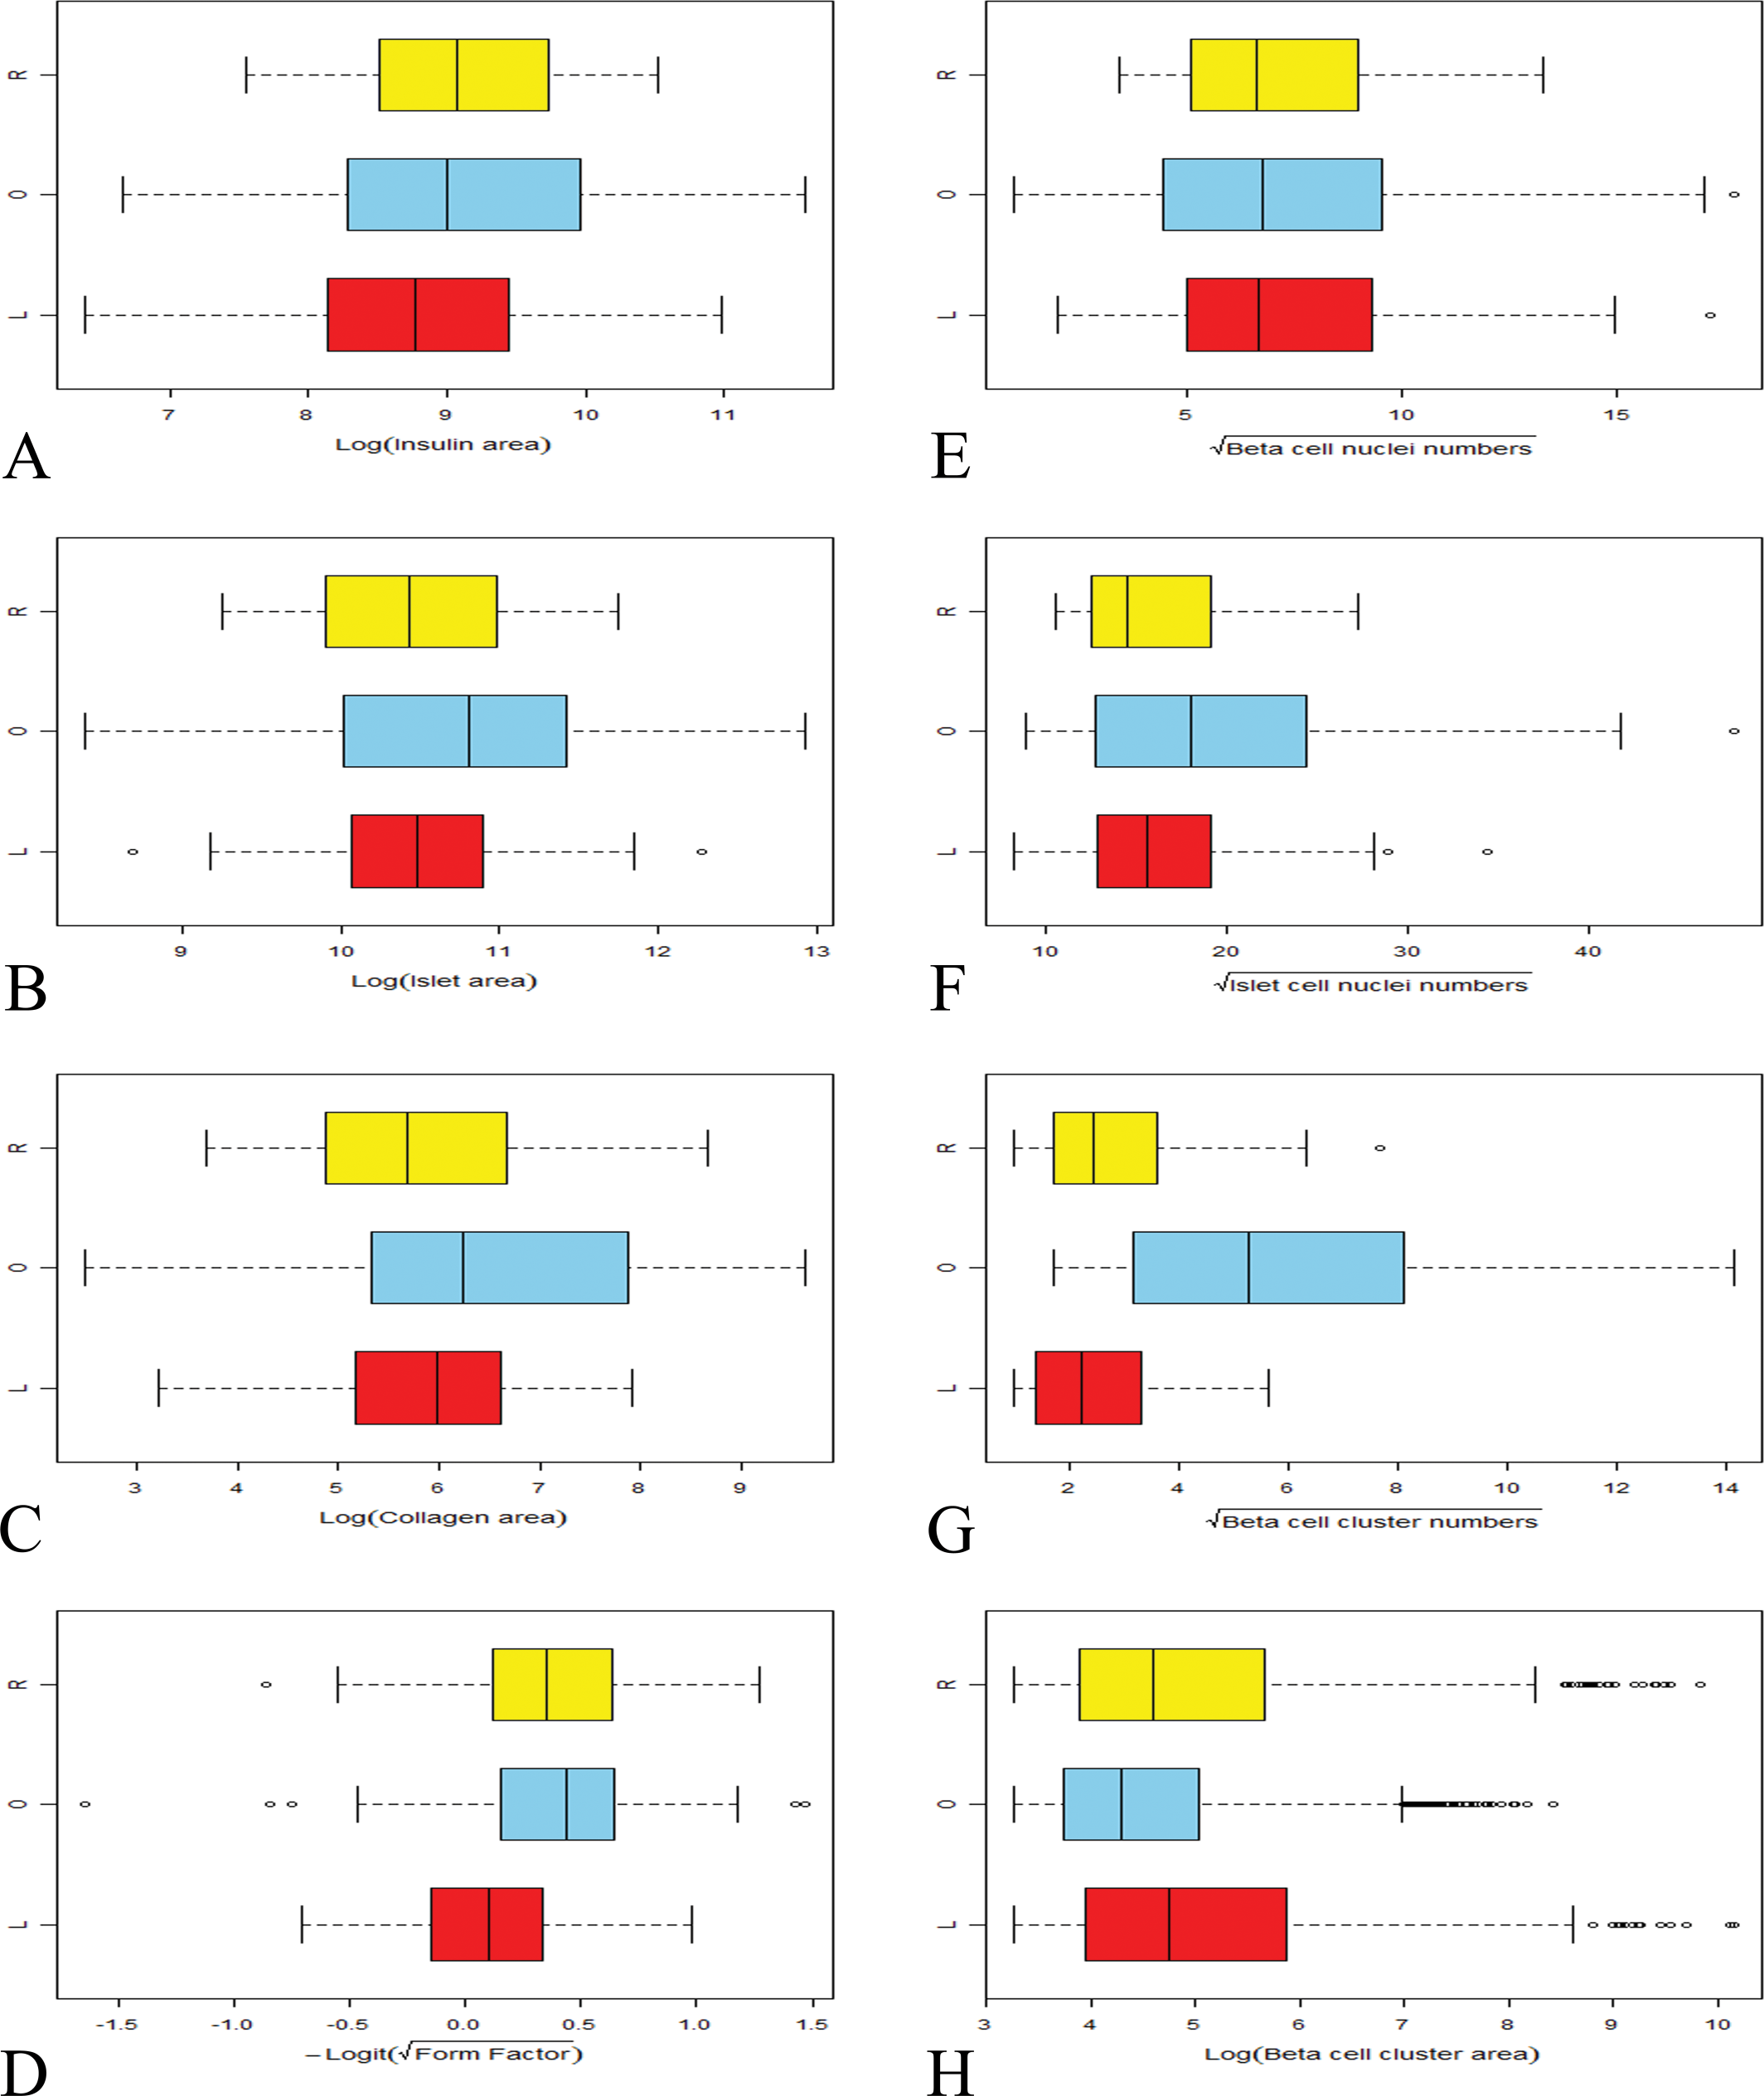
Box plots of data obtained by islet image analysis comparing lean ZDF (L, red), obese ZDF (O, blue), and rosiglitazone-dosed obese ZDF (R, yellow) groups. Transformed scales employed in the subsequent statistical analysis are shown. Each plot shows the median line, lower, and upper quartiles, whiskers extending to no more than 1.5× the interquartile range from the quartiles, and other more extreme outlying values. Obese ZDF controls generally exhibit a greater range, although for some parameters the difference is slight. For most parameters, substantial overlap in values between groups exists, although a single parameter, namely β-cell cluster numbers, effectively defines intergroup differences. This basic analysis of islet data is inadequate for the purpose of elucidation of islet cohort and population characteristics. For this purpose, a multivariate mixture analysis provides the incisive and definitive separation required.
In Figure 7, pairs of islet parameters for all 180 islets are plotted with marginal bivariate probability density contours calculated from the model which illustrate the congruity of data fit. Each islet is shown color-coded for its calculated categorization as normal or abnormal and its group identity (symbol shape). Some points are also identified by color and increased size for comparison with image analysis micrographs of certain islets in order to illustrate normal and abnormal islet appearances as defined by model categorization. Note that the location of these highlighted points changes on examination of different pairs of variables. The model shows good agreement with the data distributions especially in the way it has captured and highlighted distinct differences in distributional shapes and orientations of islet cohorts between the identified normal and abnormal islet categories within these two dimensional projections. It is clear that in all animal strains, and within individual animals, a heterogeneous population of islets exists, each islet identified as unique on the basis of multiple measured parameters. All plots show a tightly associated cohort of normal islets to the left of each scatter gram with a separate, often more widely dispersed cohort to the right. Each cohort is orientated singularly and in different directions and contains islets from each rat strain, although the majority of those that constitute the left cohort are derived from the lean ZDF controls and the rosiglitazone-treated obese ZDF groups while that on the right is comprised principally of obese ZDF controls (Figure 7). The 8 islets highlighted by enlarged and differently colored points are illustrative examples and were selected on the basis of either the certainty or uncertainty of their categorization by the model: two yellow points from lean ZDF and rosiglitazone-treated groups categorized as abnormal with high uncertainty; three magenta points, one from each islet group categorized as abnormal with high certainty;three cyan points, one from each islet group categorized as normal with high certainty.
It is clear that islets change their positions in individual two-dimensional plots according to single or multiple parameters. In relation to the model, the two yellow points are “near-boundary” points, being characteristically close to the uncertainty boundary. The positions of many points shift in some two-dimensional plots with red and blue points (normal and abnormal islets) also shifting into other regions. This reflects and reinforces that these categories were obtained from a model derived from 7 parameters and where it is natural on examination of two dimensional projections that individual points will be present in different locations according to the unique placement of individual parameters in individual islets.
In order to ascertain any association between islet size and degenerative features, individual islet size and collagen content were evaluated. It was clear that in all groups, the smallest islets and β-cell aggregates showed the least collagen staining with no associated inflammatory cell infiltration.
Discussion
Our aim in evaluating automated image analytical assessment of islet parameters and comparing with histopathological diagnoses was to provide numerical data that communicate not only the morphological condition of individual islets but also permit profiling of multiple islet states in a single histological section of the rat pancreas. Key advantages of such an approach lie in experimental consistency, reduced subjectivity, and reproducibility. Our purpose therefore was to define the often diverse morphological differences in islet structure present in such tissue sections and was not targeted at measurement of parameters in all pancreatic islets such as total pancreatic β-cell volume or mass, islet-associated fibrous tissue, islet-associated inflammation, and so on. Such an approach as is used for example in the calculation of β-cell mass is eminently feasible by adaptation of this method but requires multiple tissue sections and stereology. We assessed dual immunohistochemical staining for collagen and insulin with hematoxylin counterstaining of pancreatic tissue sections in combination with automated image analysis and found that this approach permitted effective definition and quantitation of the size and shape of islets, β- and other islet cell numbers, β-cell clustering parameters, and islet collagen content. Moreover, interanimal and intergroup differences clearly distinguishable on histopathological assessment were determinable with this approach. It is noteworthy that the statistical mixture analytical model works to strictly defined criteria whereas the pathologist considers multiple features, weighing each to obtain a view tempered subjectively by previous experience.
The employment of defined image analytical (spatial and spectral) criteria, namely cell–cell and cell–intercellular tissue distances, neighborhood relationships, and relative staining intensity within the algorithm, effectively demarcated islet perimeters, separating these from surrounding exocrine and other tissues and, critically, thereby preventing incorporation of adjacent extra-islet, periductal and perivascular collagen into islet areas, and eliminating such tissue from quantitative assessment, which, given the amount present in these areas, especially in aging obese ZDF rats (Janssen et al.2001; Jones, Nugent, and Jenkins 2010), is a clear and essential benefit. Additionally, association of parameters such as insulin staining, islet size, islet fibrosis, inflammatory cell infiltration, and β-cell clusters generates islet population profiles regarded as phenotypic fingerprints. These reflect the degree of islet variation present within animals, strains, and following drug treatment as observed following histopathological examination and does not focus on merely the abnormal appearances of individual islets. Histopathological assessment of pancreatic sections revealed variable amounts of islet inter-β-cellular tissue that consists of blood vessels, intercellular matrix, inflammatory cell infiltrates, and fibroproliferative cells, and the amount of such islet tissue constituents varied considerably between nondiabetic and diabetic rat islets. Rosiglitazone treatment of obese ZDF animals resulted in very substantial differences in islet parameters by comparison with obese ZDF rat controls such that the former more closely resembled those islets present in nondiabetic, lean ZDF rats. Characteristically, following rosiglitazone treatment, features relating to islet size, insulin area, collagen area, and total islet nuclei were reduced and related directly to absence or reduction of islet inflammation and fibrosis.
All islets are unique, and as such, any measured morphological parameter from islet populations is drawn from a mixture distribution: the key to accurate characterization of islet population state lies in modeling of that distribution. We have successfully applied a novel, nonstandard statistical technique of mixture modeling to the problem of categorizing islets that occur in a range of diverse morphological types. We obtained a very good fit using only multivariate t distributions of seven islet parameters. Examination of islet images demonstrates excellent conformity between the model-defined categories and the morphological characteristics of islets. The approach described provides a model for the most fundamental representation of variation in islet parameters, namely, their joint probability distribution which makes possible employment of numerous statistics to view analytical outcomes. The contour plots of the bivariate marginal probability density functions derived from the fitted model compare well with the superimposed islet data points, giving some views of the seven-dimensional distribution through its two-dimensional projections. The model has drawn out two distinct patterns within the distribution that demonstrate its success in choosing two categories. Furthermore, the definition of individual islets as of certain or uncertain, normal or abnormal nature is amenable to ready interrogation with clear visibility of the causes of categorization such as is seen in (1) the lean ZDF islet classed as certain abnormal based on shape and large size, it being large and elongated by comparison with the population norm of primarily rounded islets (magenta circle point, Figure 7M), (2) the degenerative obese ZDF control islet classed as certain normal to that group due to multiple complimentary factors, namely, large size, irregular shape, elevated collagen content, and many small β-cell clusters with increased total islet nuclei (magenta square, Figure 7N), and (C) the incompletely restored rosiglitazone-treated obese ZDF islet deemed certain abnormal due to numerous small β-cell clusters, abundant pervading collagen, and elevated total islet cell nuclei (magenta triangle, Figure 7O).
The full structure of islet variation has been modeled, and therefore, the covariance and mean parameters of islet populations within each animal strain are available as different combinations of the parameters of the two model components. The major differences between experimental groups is not illuminated by examination of these summary statistics as these are not sufficiently discriminative, but is seen in the different ratios of normal/abnormal islet phenotypes obtained following data interrogation by mixture analysis. We found significant differences between these ratios and, crucially, between the rosiglitazone-treated obese ZDF group and the obese controls, none being observed between the former group and lean controls. It is plain that the basic statistical approaches commonly used for intergroup comparisons are inadequate for elucidation of the multicohort composition of islet populations and that mixture analyses enable such discrimination between normal and abnormal.
Evidence presented in this study suggests that measurement of the size and number of β-cell clusters that constitute individual islets reflects their structural integrity and when considered together are an indicator of normal versus abnormal structure. These findings also correlate with measures of islet functional capability (plasma biochemistry). Achievement of this cluster definition employed programing of the image analysis system to assign contiguous β-cells that were not separated by collagen as distinct units irrespective of cellular insulin staining intensity or homogeneity and defined externally by interstitial tissue containing collagen. Islets from lean ZDF rats consisted of few β-cell clusters, each containing numerous β-cells, while those from obese ZDF islets comprised many, small clusters, with few β-cells per cluster. Image analytical methods that use insulin distribution alone as an assessor of β-cell clustering and make conclusions of islet integrity on the basis of cluster separation are unlikely to provide the most comprehensive information on islet pathology as no associated islet nonendocrine tissue is evaluated. In addition to β-cell parameter measurements, the advantages of the approach described here lies in visualization, identification, and quantitation of nonendocrine islet tissue, whether it be inflammatory cell infiltration, fibrosis, amyloidosis, and so on to obtain numerical indications of islet state, that is, provide numerical communication of islet histopathological condition. Data indicating prevention or delay of islet degeneration following the treatment of obese ZDFs with rosiglitazone for 28 days reveal a striking but an incomplete islet phenotype shift toward that of lean ZDFs that may be remedied by longer duration drug exposure.
The preservative actions of rosiglitazone on islet structure in obese ZDF rats (Buckingham et al. 1998; Finegood et al. 2001; Walter and Lubben 2005) are partly due to reduced apoptosis that occurs during the prediabetic and diabetic phases following thiazolidinedione treatment (Higa et al. 1999; Walter and Lubben 2005). These observations formed the basis of our investigation to assess our approach to quantitation of islet histopathology. Similar effects have been reported in rodent models of type II diabetes, namely troglitazone given to obese ZDF rats caused lowered islet fat, restored failing β-cell function, and prevented β-cell destruction and diabetes (Higa et al. 1999; Shimabukuro et al. 1998a,b); pioglitazone administered to three genetic models of type II diabetes namely, KKA(y), C57BL/6J ob/ob, and C57BL/KsJ db/db mice (Diani et al. 2004) all showed greater β-cell granulation, reduced stress, and 1.5- to 15-fold higher insulin levels. Ramipril treatment for 24 weeks suppressed islet fibrosis and islet degeneration in Otsuka Long-Evans Tokushima fatty rats (Ko et al. 2004) and improved glycemic control. It is clear that dietary influences, the administration of certain drugs, and key genetic factors are either primary or secondary factors in the etiology and pathogenesis of type II diabetes. The basis for such important changes in glycemic control is outside the scope of this communication, but the alterations in islet structure involving inflammation and fibrosis are commonly encountered features of the animal models employed in investigations of type II diabetes that are also seen in human islets (Clark et al. 1988; Donath et al. 2008, 2009; Richardson et al. 2009; Ehses et al. 2007, 2009).
The clear advantages of utilization of the approach described by us in the assessment of islet parameters have substantial potential for modification. Changes in β-cell size due to proliferative or adaptive pressures, multiple endocrine cell cohort analyses, amyloid deposition, inflammatory cell infiltrates, and vascularity (such as our histopathological observations in this study of retained but substantially reduced islet vascular dilatation in rosiglitazone-treated animals) are examples of important features of islet characteristics in insulin resistance and type II diabetes that may be present in both animals and human. Utilization of specific antibodies or in situ hybridization probes in combination with automated image analytical quantitative assessments of islet tissue composition is likely to provide opportunities for critical evaluation of disease progression and pathogenesis in animal models and human diabetes. This opportunity is yet to be evaluated and offers a route for incisive interrogative enquiry into islet morphology, disease progression, and its modification during and after diabetogenesis.
Footnotes
Acknowledgments
We are obliged for the contributions of the AstraZeneca Diabetes group, Clinical Pathology, Histology and Analytical Morphology groups in these investigations.
The authors declared no potential conflicts of interest with respect to the research, authorship, and/or publication of this article.
The authors received no financial support for the research, authorship, and/or publication of this article.