
Abstract
This article presents an overview of microscopy and its ability to assist in understanding what happens in cells and tissues. From the 1960s to 1980s, electron microscopy was the best way to understand cell processes, but the advent in the mid-1980s of light microscopy and the ability to do fluorescence imaging displaced electron microscopy in this area. However, the 21st century has seen several improvements in electron microscopy that, along with the need for more detailed ultrastructural information, make it again very attractive in the study of cells, tissues, and organs, and electron microscopy has resumed its place as the preeminent method in understanding cell processes.
Keywords
For those unfamiliar with electron microscopy, some explanation of terminology is in order. An instrument called a scanning electron microscope (SEM) gains information mainly from a structure’s surface, where the electron beam is a focus probe that scans along the surface and collects data from secondary or backscattered electrons. A transmission electron microscope, or TEM, gets its information from internal structures, rather than the surface, and it does this by passing a beam through the sample. A relatively newer instrument in biology is the DualBeam, a combination of a focused ion beam (Ga ions in this case) used for cutting the sample with an SEM used for imaging. It is sometimes referred to as SEM/FIB for its two beam types. The DualBeam functions like a microtome and SEM, which allows you to deconstruct large tissue volumes slice by slice so that you can very accurately observe the internal structure in the newly cut surface.
Let us start by examining what is new in the world of TEM. Improvements in computer control have resulted in new software that makes automation of the microscope available to every lab. On the purely mechanical side, this automation allows the microscope to do electron optical system alignments, align the electron source, focus, and in general reduce time to results. This automation also allows for better integration of different types of signals to help make the analytical process much simpler. We can integrate images and signals from many different sources such as x-ray detectors, secondary electron detectors, signals from bright field and dark field detectors, as well as imaging from electron energy loss spectroscopy, all of which can then contribute to a coherent understanding of what is happening inside a tissue. As for applications of the technique, this automation allows rapid and automated examination of things such as very large two-dimensional (2D) maps and the collection of 2D data that will eventually be turned into 3D volumes.
The traditional role for TEM has been the examination of fixed embedded and thin section samples. This fairly simple technique has allowed scientists to monitor the progression of disease and observe the process of viral infections for more than 60 years. Observing morphological changes alone cannot give a full set of answers to today’s complex questions, but the development of new gold labeling of antibodies has helped us better understand specific cellular processes. Also, the ability to incorporate fluorescent proteins into cells and bacteria has helped us better understand many biological processes, and this knowledge has allowed us to take real steps in doing correlated electron microscopy. Correlative microscopy can incorporate any number of techniques, from light microscopy to in vivo imaging, which can help give a much fuller understanding of ongoing biological processes. Using labeled fluorescent light and electron microscopy has allowed us both to see the location of certain molecules and to fully understand how those molecules are transported and stored or moved between cells (Figure 1).
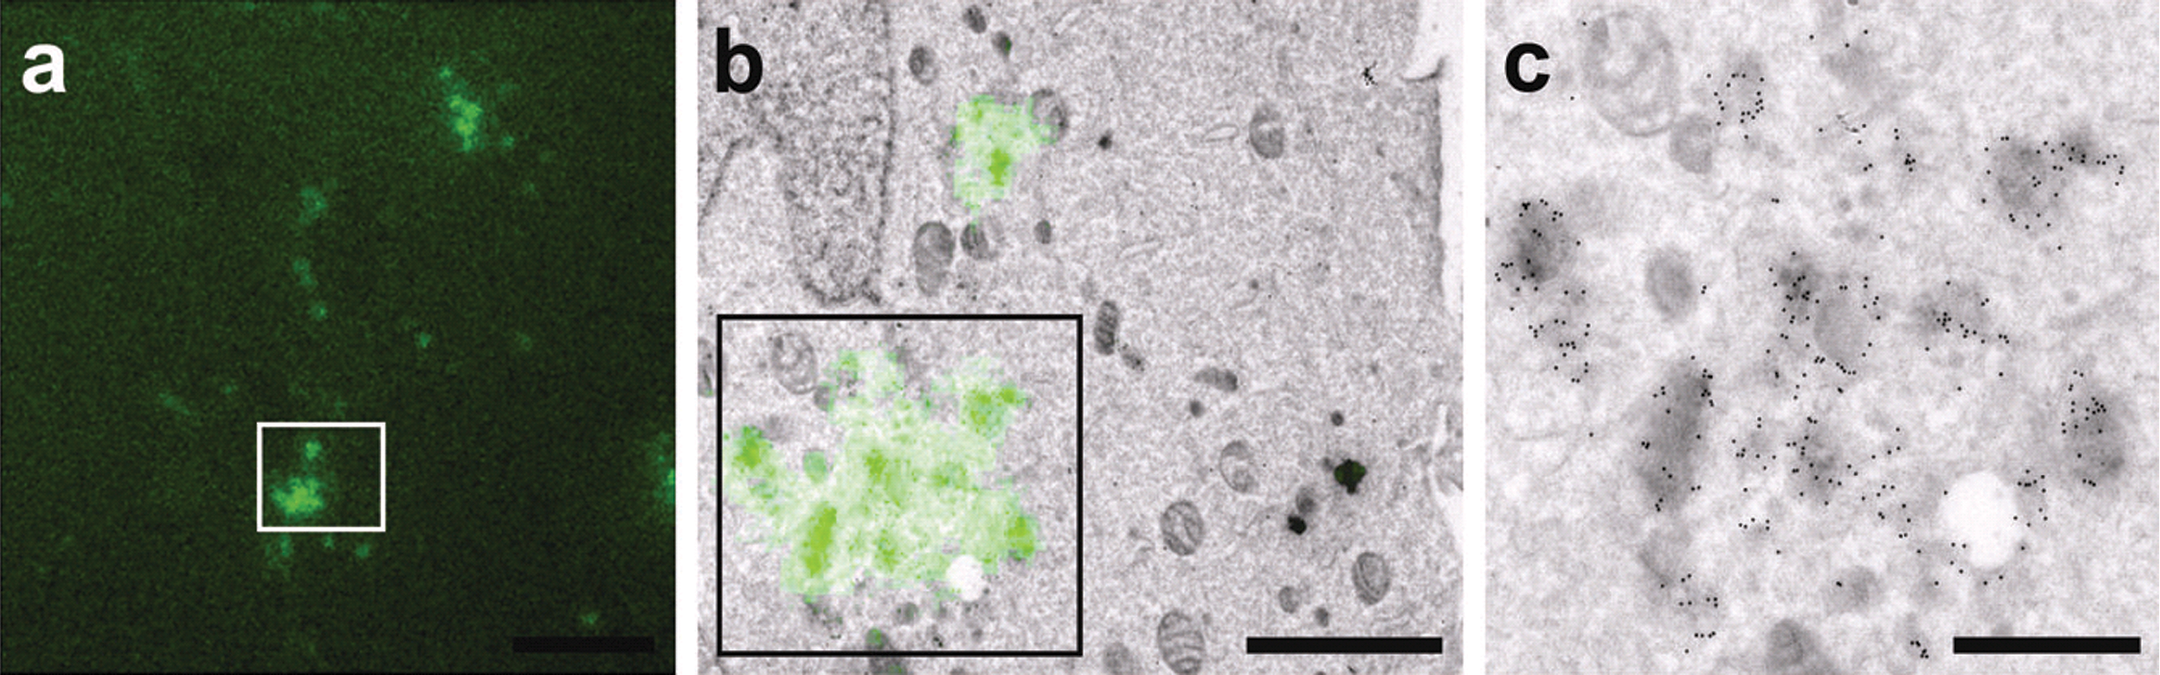
(a) Fluorescence image of cells labeled with a mouse monoclonal anti-LAMP2. (b) Ten-nanometer protein A-gold followed by Alexa488 conjugated goat anti-mouse. (c) Detail of boxed area in (b). (Karreman et al. 2011).
Traditional imaging in the TEM produces only 2D images. But by using a technique called electron tomography, we can take a thick section (normally two or three times as thick as traditional TEM examination calls for) and using automated data collection, we can then tilt and image the sample to give a data set of tilted images. In an ideal world, this data set would be tilted ±70°. The data set is then taken out of the microscope, aligned, and an algorithm applied to it. This aligned set of images then can produce a back projection of the 3D volume. This 3D volume can have a normal resolution of between 3 and 5 nm, with a thickness usually ranging from 200 to 300 nm. Through available software, the structures inside the volume can be segmented to give an understanding of the spatial relationships that exist in that volume (Figure 2; Movie 1). The information available from 3D volumes is far greater than what can be realized from 2D images, and this 3D information can also help clarify information obtained through light microscopy (Zhang et al. 2005).
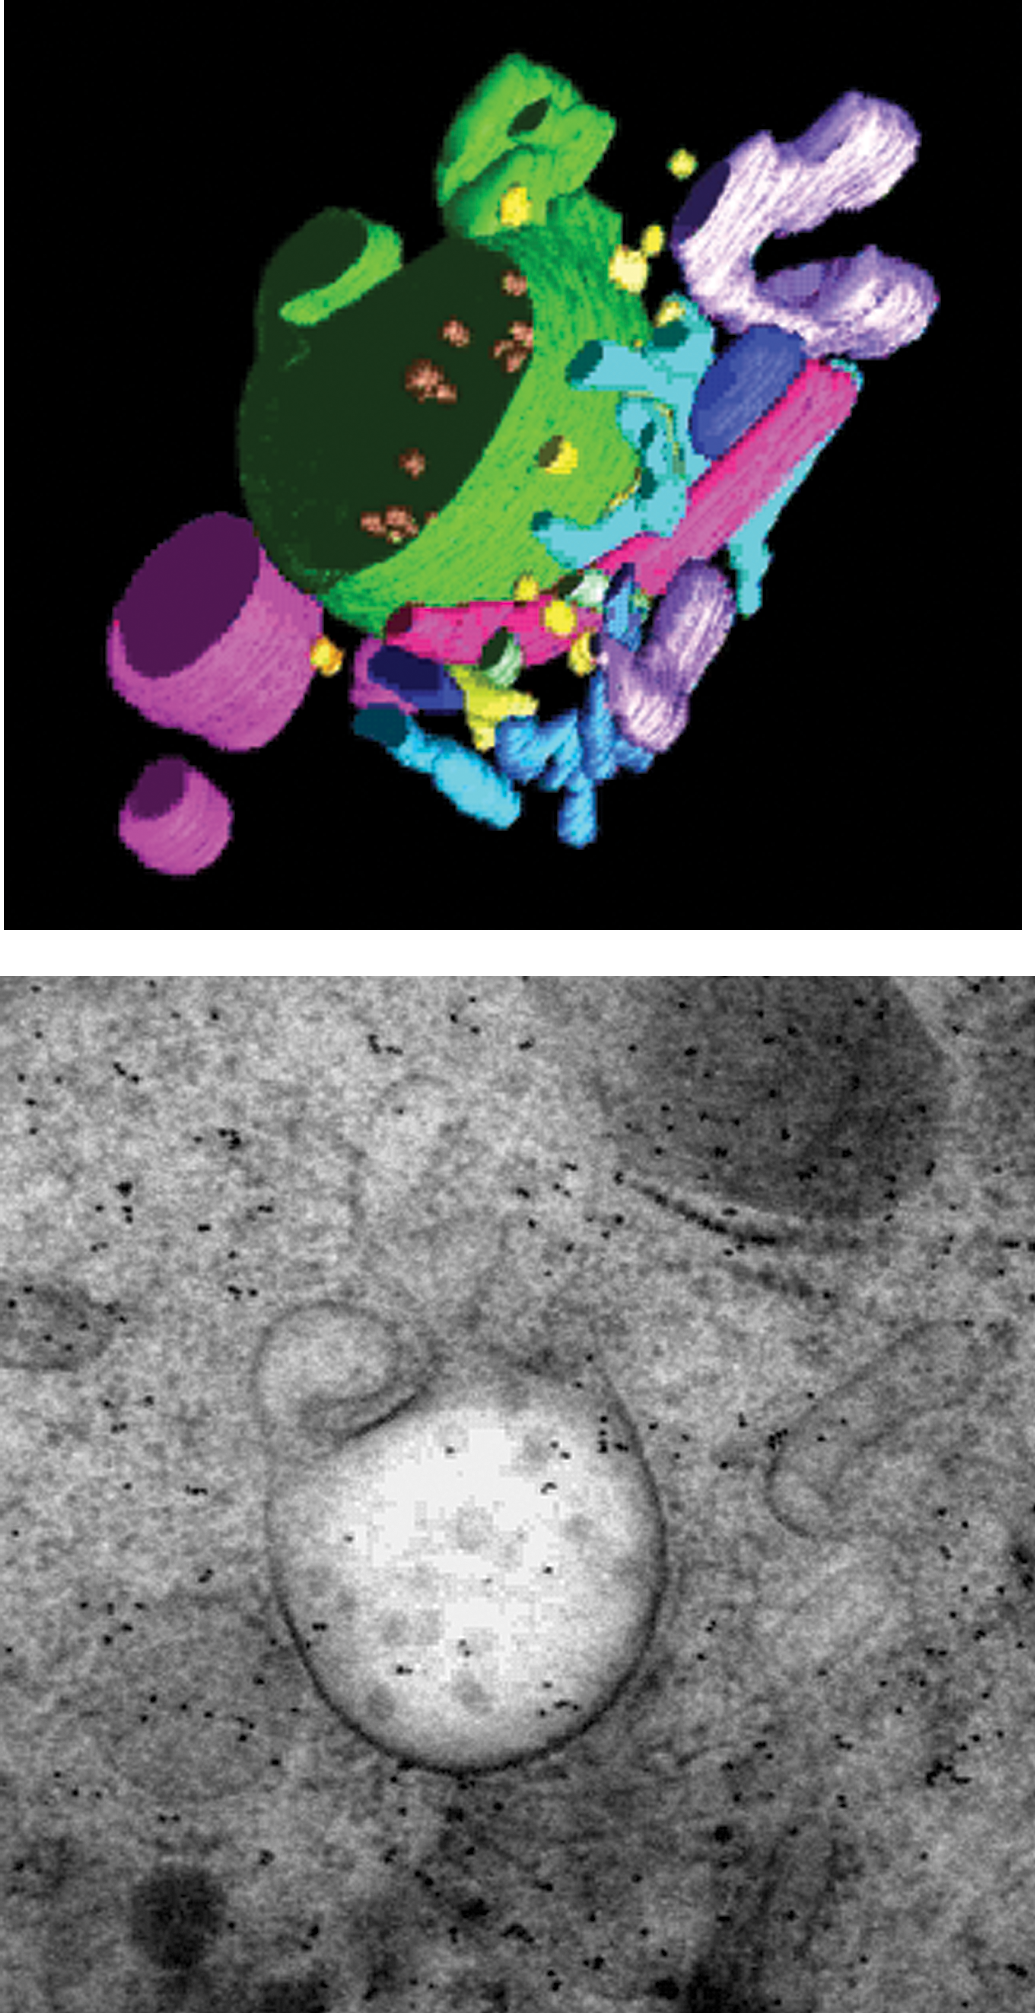
Tomography and segmentation. See supplementary material at http://tpx.sagepub.com/supplemental for Movie 1 depicting segmentation of the multivesicular compartment in a 250-nm-thick section of high-pressure frozen, freeze-substituted, and Epon-embedded mouse dendritic cells. (enhanced online). Multivesicular compartment in a 250-nm-thick section of high-pressure frozen, freeze-substituted, and Epon-embedded mouse dendritic cells. Courtesy of J. L. Murk, B. M. Humbel, U. Ziese, H. J. Geuze, A. J. Koster, and M. J. Kleijmeer.
In the TEM, there is a technique called scanning transmission electron microscopy (STEM). This technique takes full advantage of the design of the TEM but uses a very fine probe to extract crystalline and chemical information from the sample. While this technique may seem very foreign to most biologists, it has been used for decades by materials scientists. However, over the past few years, this STEM technique has been used to collect tomography data in samples that are as much as 1-µm thick, opening a new world for biological electron microscopy (Sousa et al. 2011; Figure 3; Movie 2).
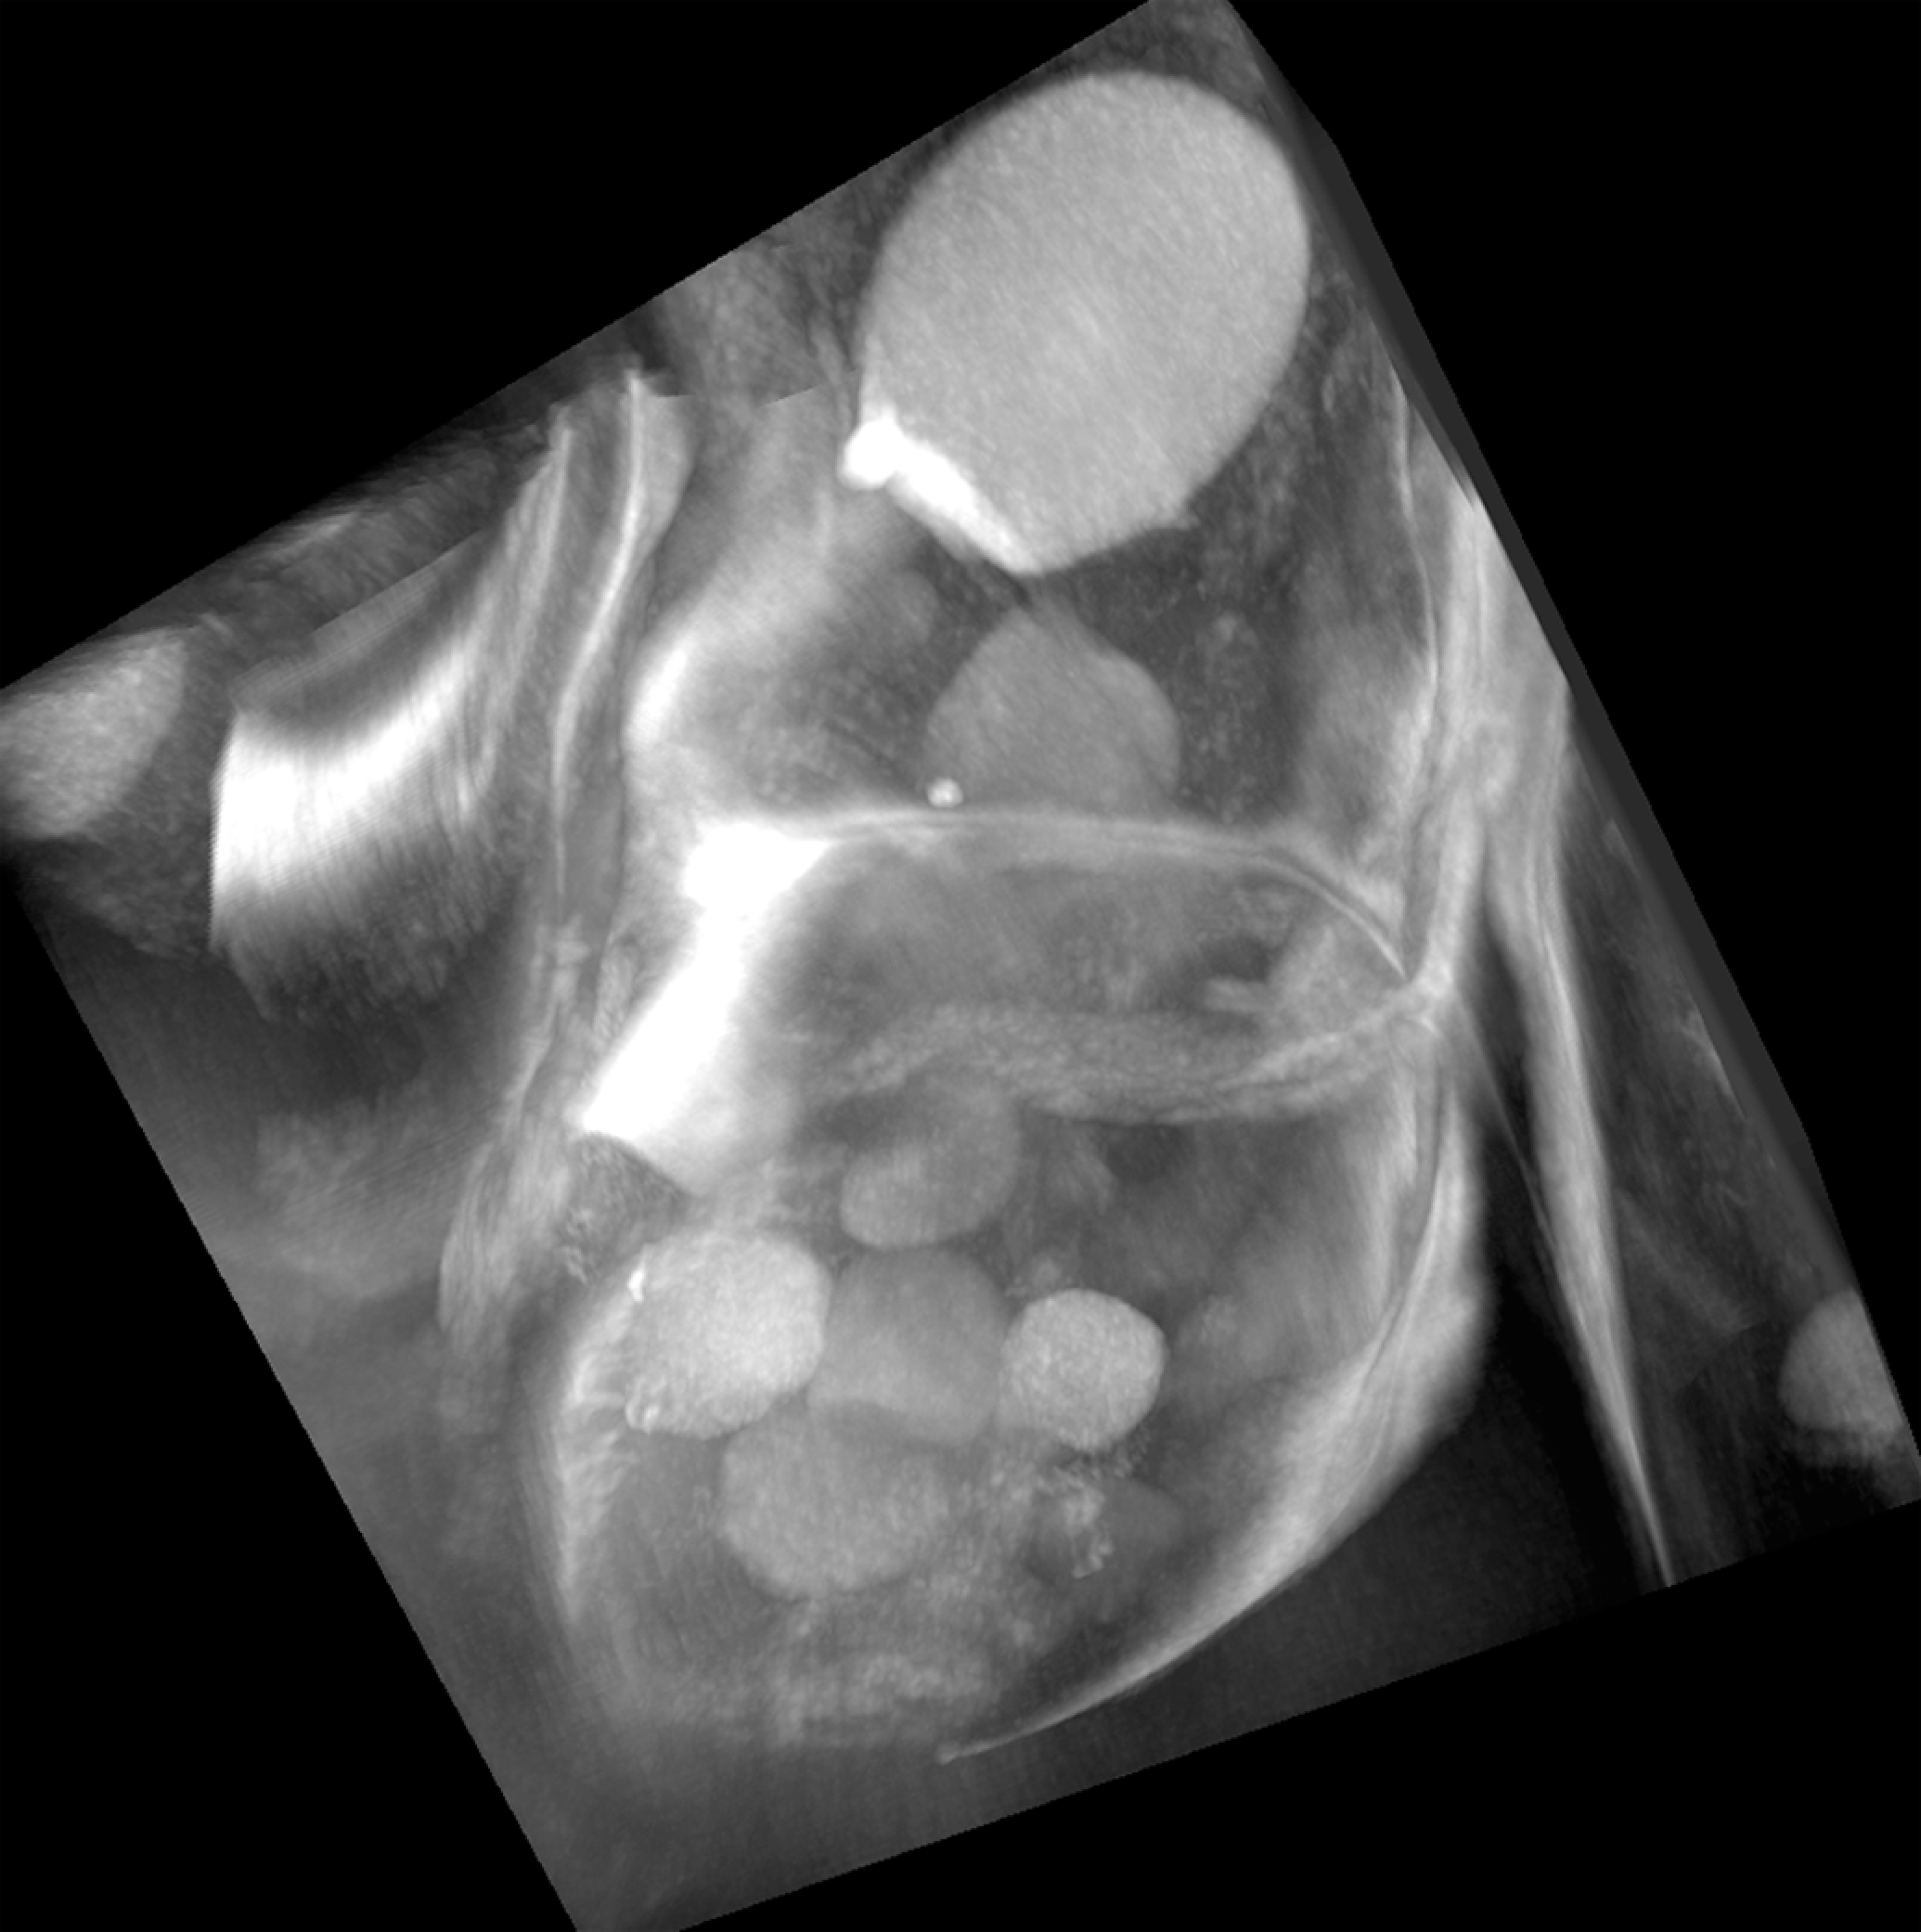
See supplementary material at http://tpx.sagepub.com/supplemental for Movie 2 depicting STEM tomography volume of yeast cells (1.0 µm) thick section (enhanced online). Yeast cells (Schizosaccharomyces pombe cells, wild strain). Cytokinesis, the thick (1.0 µm) sectioned image of high-pressure frozen, freeze-substituted cells showed the invaginated cell membrane at the medial region of septum formation. These images of dividing cells clearly showed nuclei, vacuoles, and secretory vesicles in the cytoplasm (Aoyama et al. 2008).
As mentioned earlier, with computer control of the microscope, we have available to us a wide variety of signals in the TEM. Electron energy loss spectroscopy (EELS) is another technique used for decades by materials scientists but only recently employed by biologists. EELS allows signal from specific elements to be highlighted or mapped, which gives a great deal more information to our images. The automated technique of imaging while using the Gatan Imaging Filter is called energy-filtered TEM (EFTEM). Recently, researchers have been able to use this EFTEM technique to map elemental distribution in three dimensions with very high accuracy in thin sections. This, coupled with the electron tomography technique, gives both spatial and elemental information at a very high level of detail (Figure 4; Aronova et al. 2007).
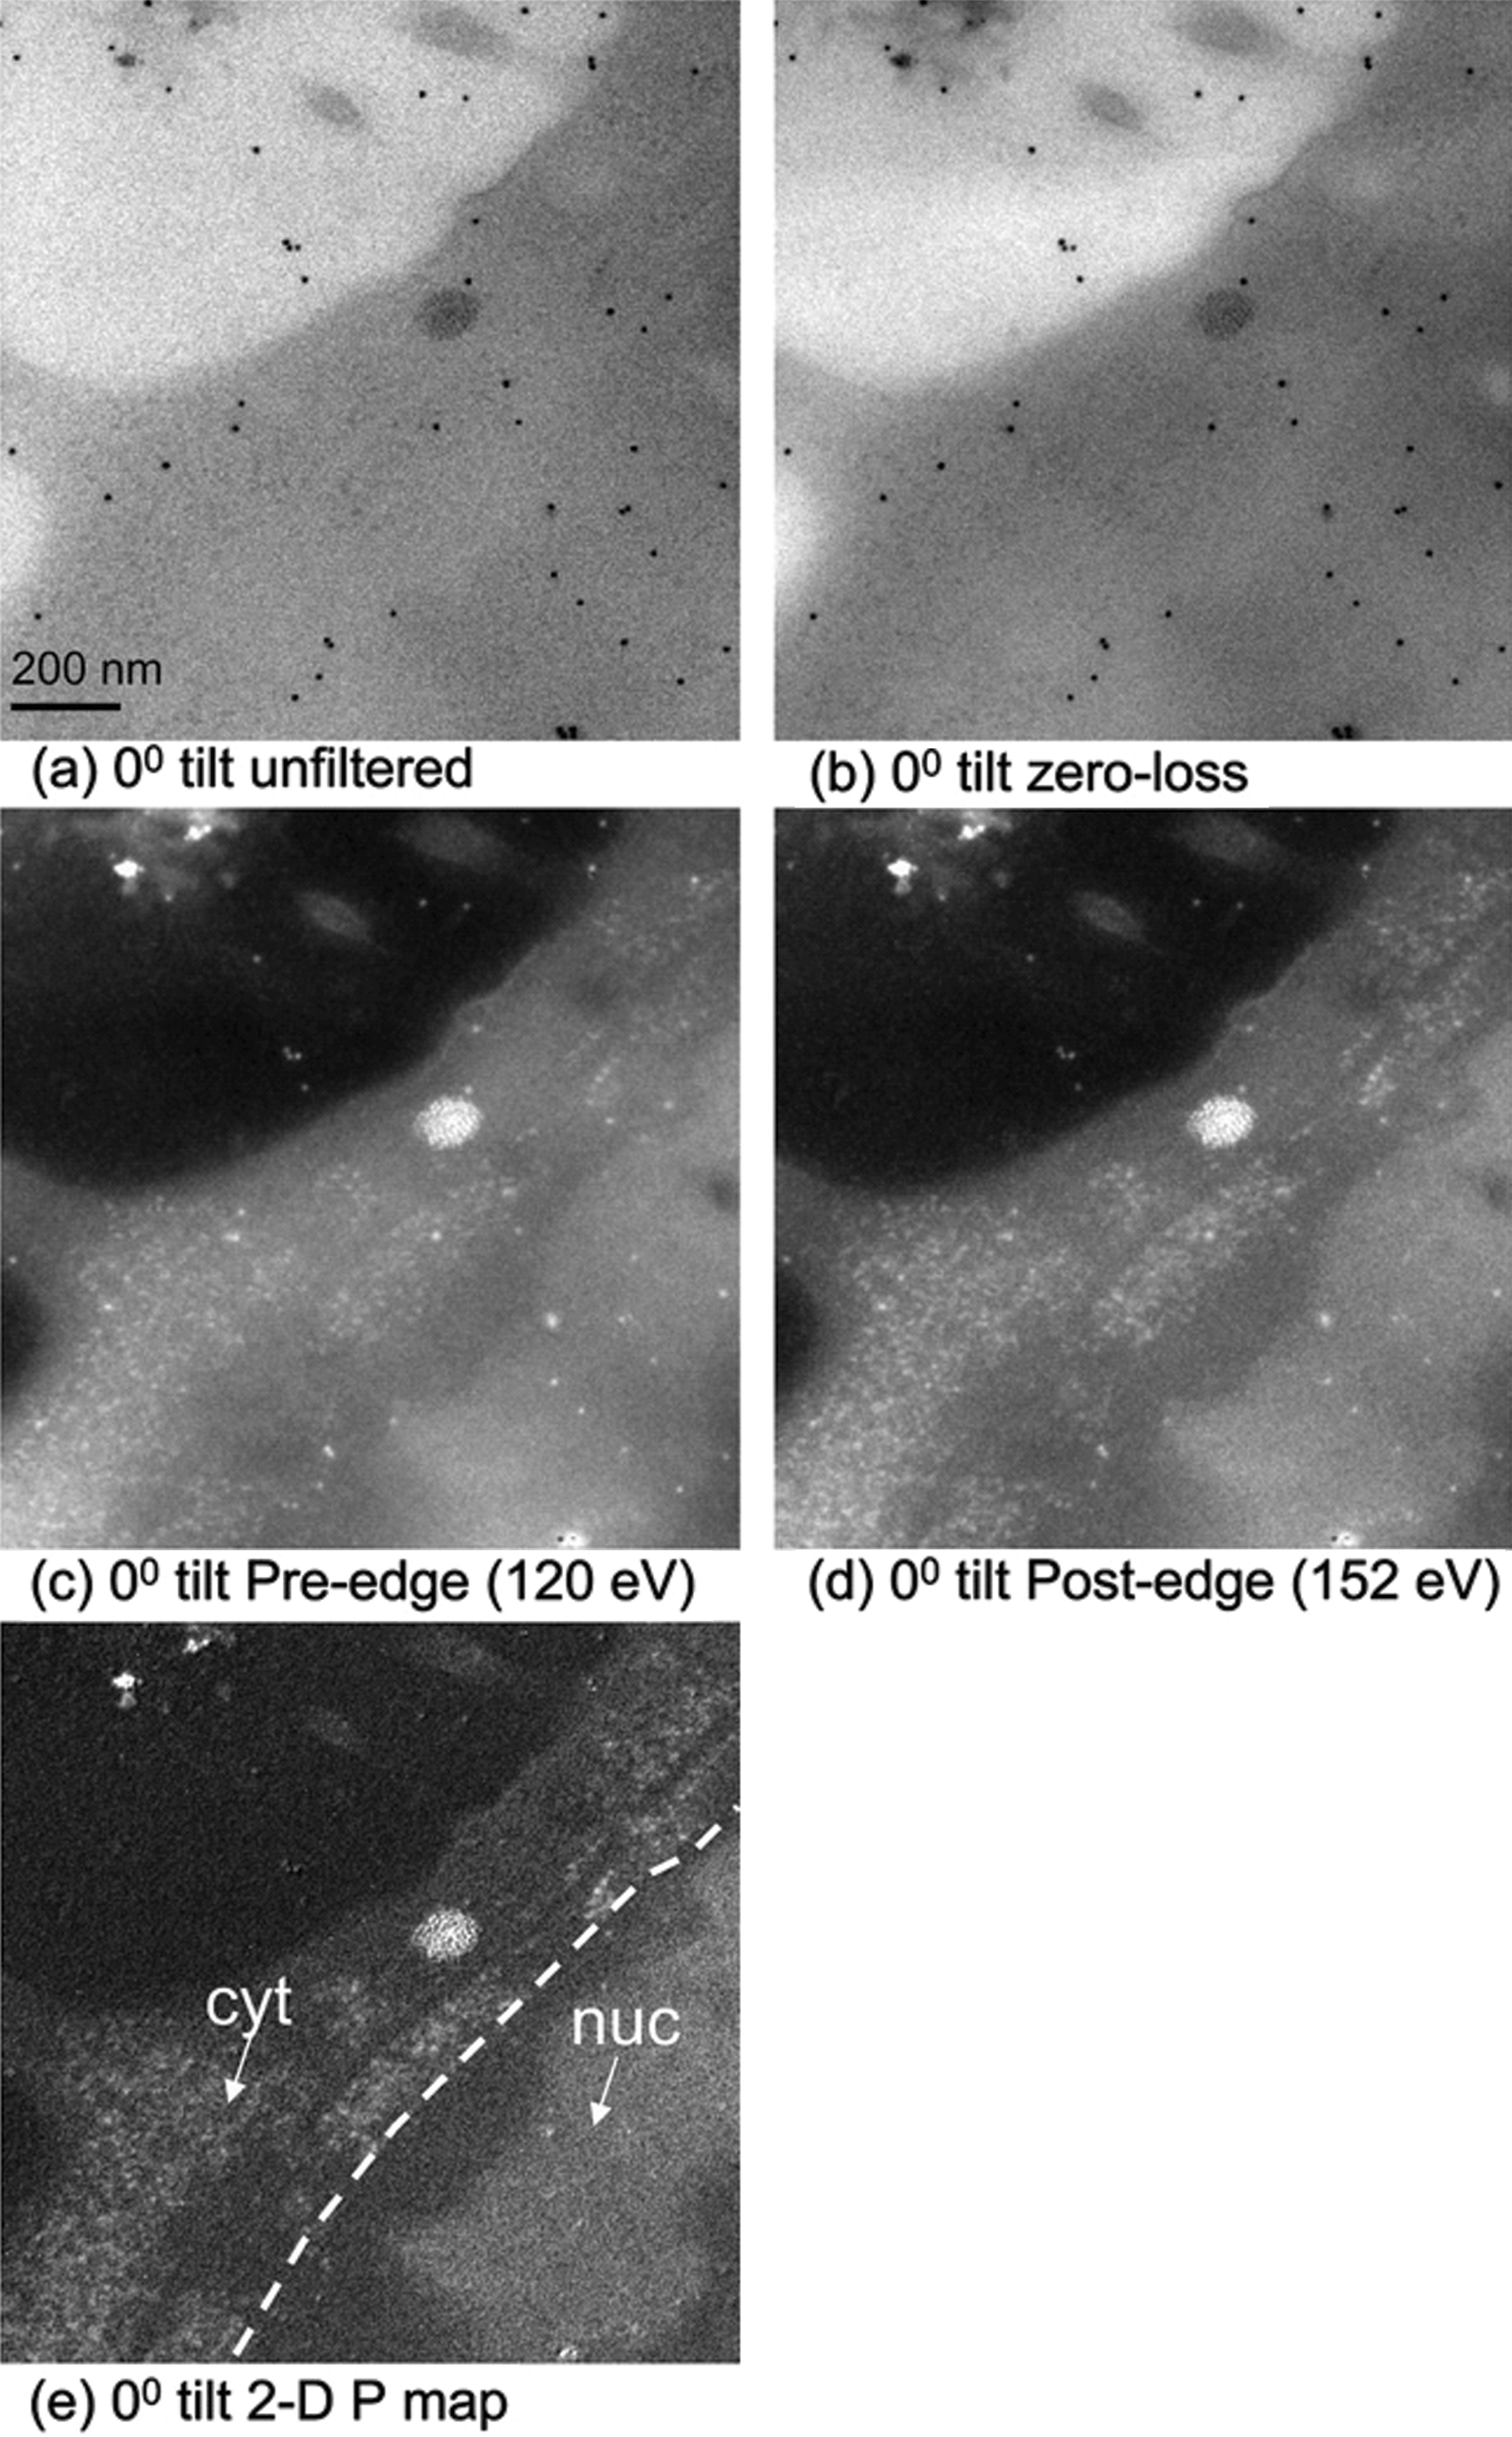
Images from an 80-nm section of a Drosophila larval cell using automated energy-filtered transmission electron microscope tomography; 0° tilt angle is shown. (a) Raw image at 0 tilt. (b) Zero loss image. (c, d) Filtered images used to detect phosphorous. (e) The boundary separating the nucleus from the cytoplasm is shown as a dashed line (Aronova et al. 2008).
There have been significant improvements in the application of STEM in instruments that are commonly called ESEM. An ESEM is an environmental scanning microscope, and that refers to the environment that the sample experiences, which is closer to a normal biological environment than the vacuum of deep space, as is found in normal electron microscopes. This technique is called wet STEM and allows researchers to examine hydrated materials such as suspensions and emulsions in an extremely rapid manner requiring little or no specimen preparation (Figure 5). The wet STEM technique has several advantages over light microscopy, the first being high resolution and the second the ability to do energy-dispersive spectroscopy, delivering elemental information about the sample that can help track nanoparticles or cellular chemical processes.
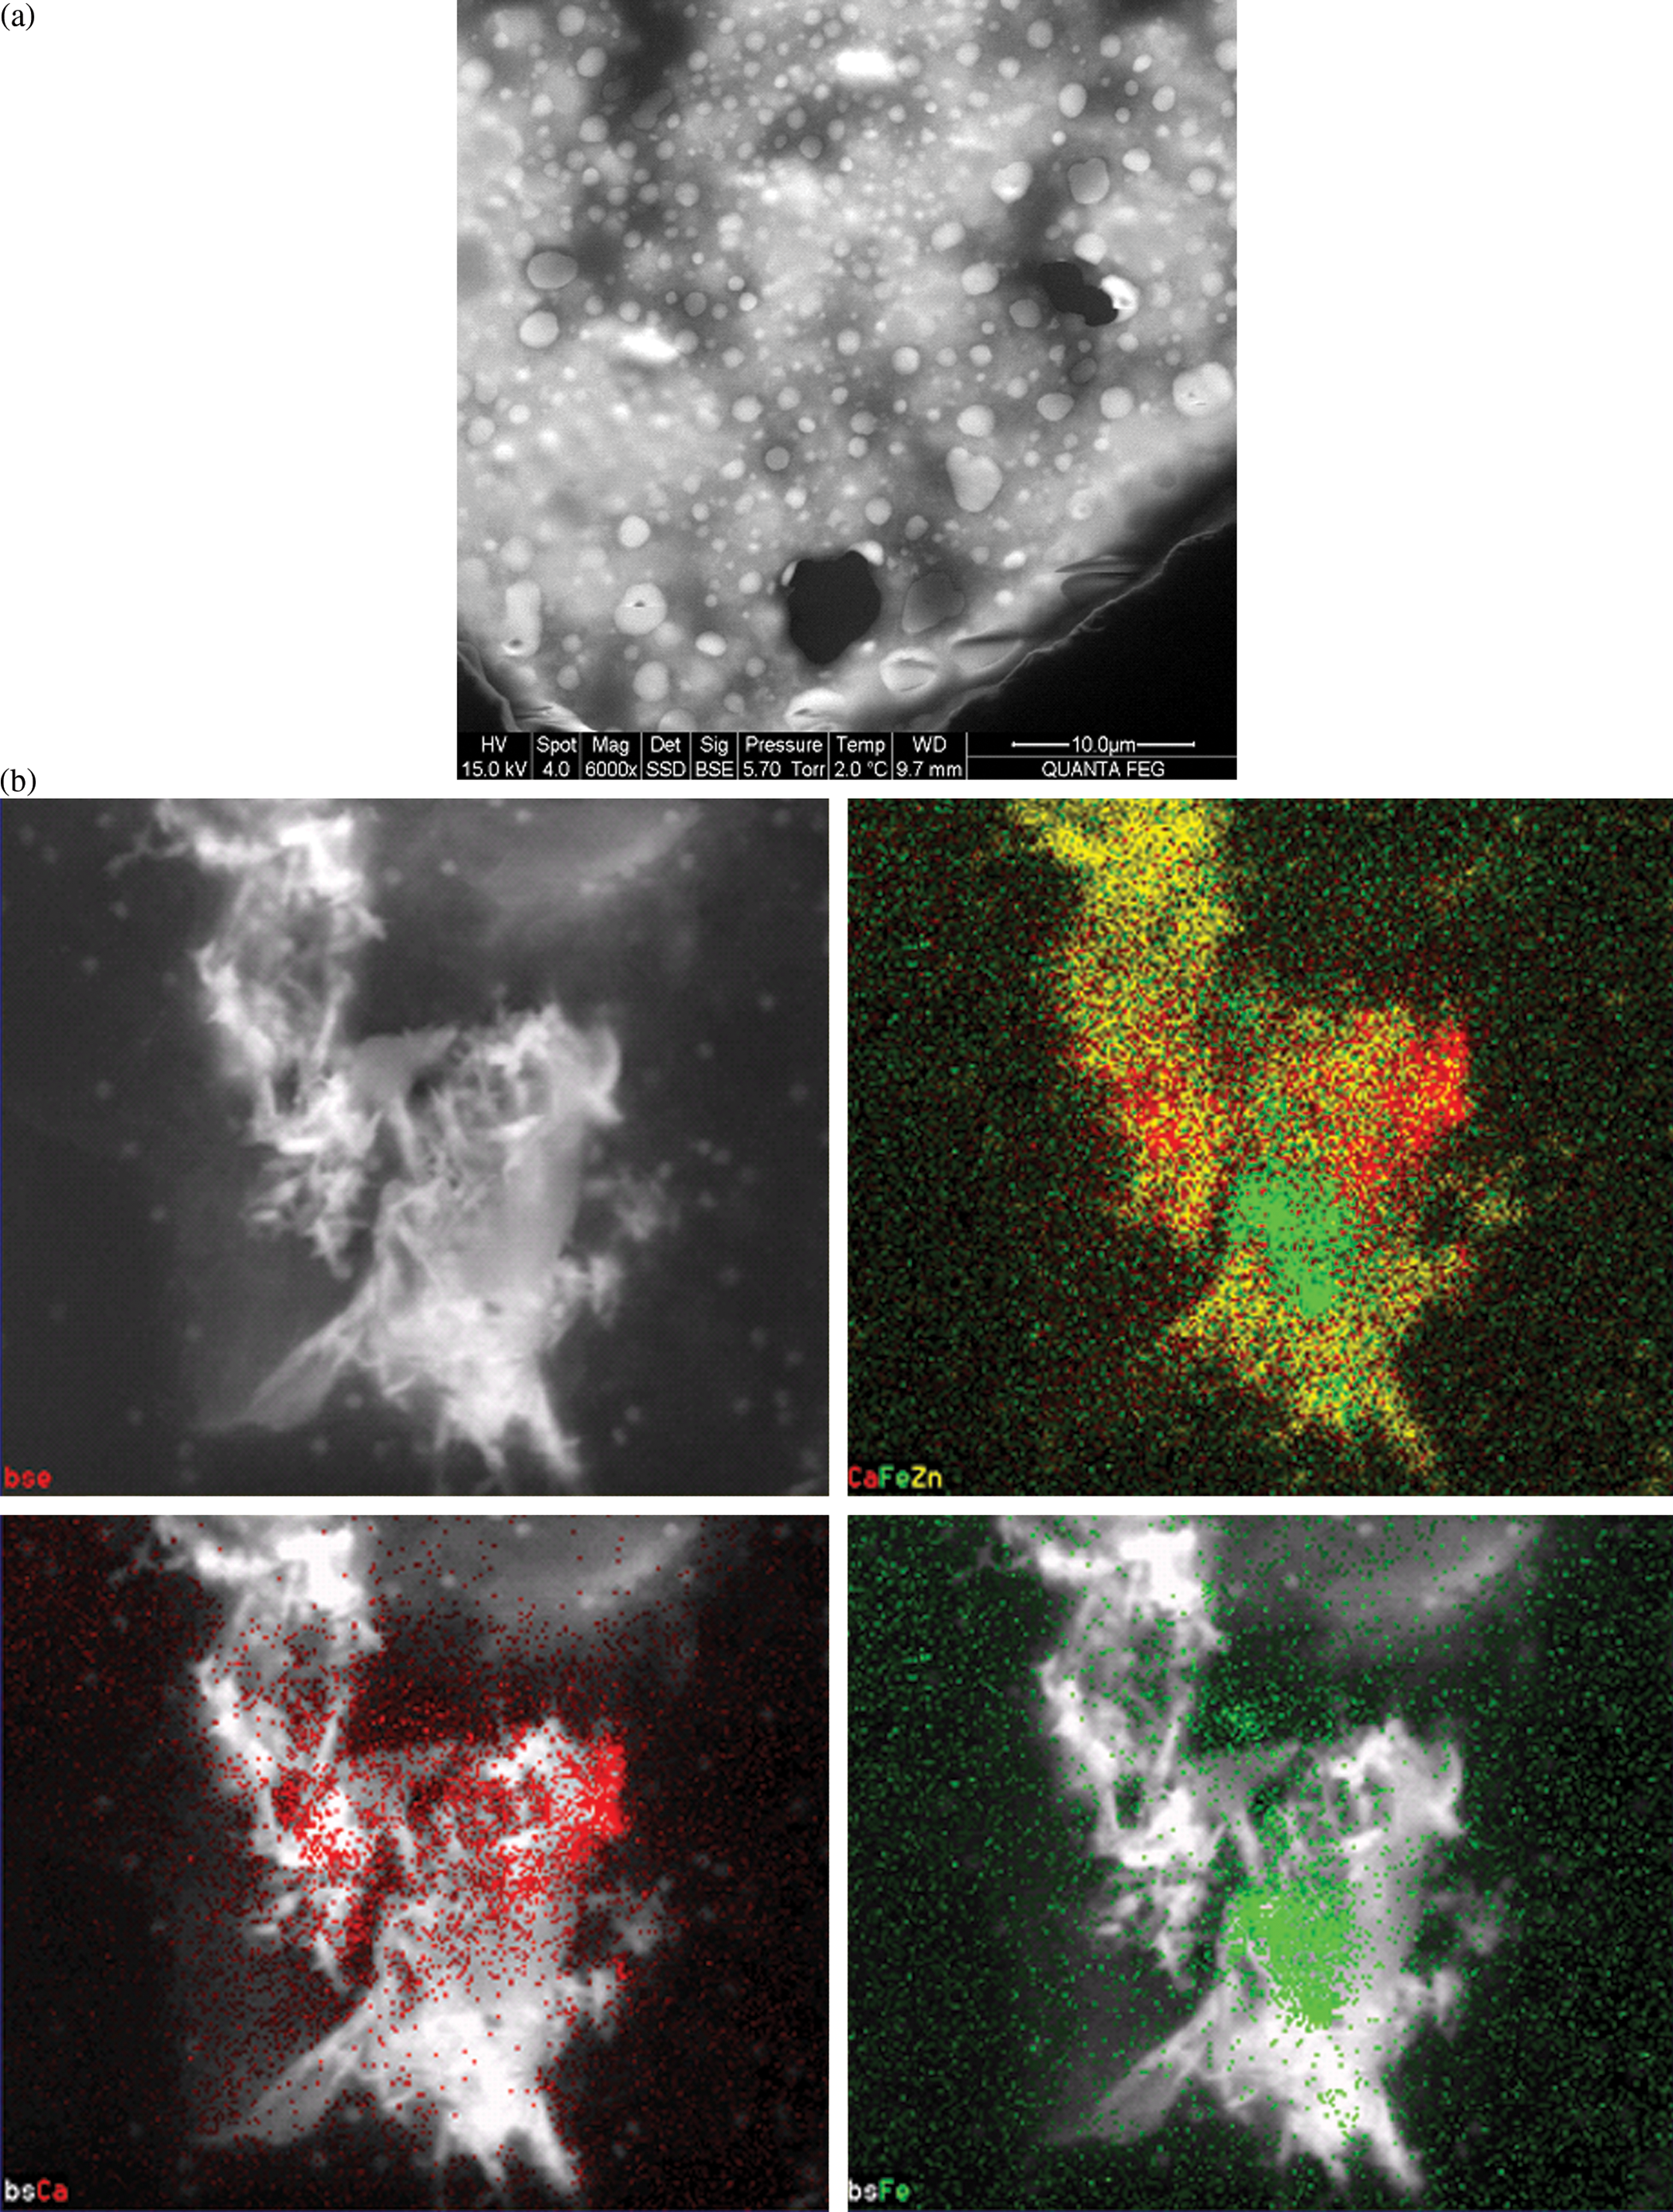
Imaging in wet scanning transmission electron microscopy. (a) Nanophases in structured liquids. (b) EDX elemental map of dispersion (wet) of metal nanoparticles. Unpublished Results from Marc Castagna, FEI.
Another extremely useful advance in SEM instrumentation is the development of extreme high-resolution imaging at very low accelerating voltages. In the past, high resolution was normally coupled directly to high KV, which came with its own set of issues and limitations. High KV brought phenomena such as penetration of the surface and charging artifacts, both limiting the ability to obtain high-resolution images of small or thin and fine surface structures (Figure 6).
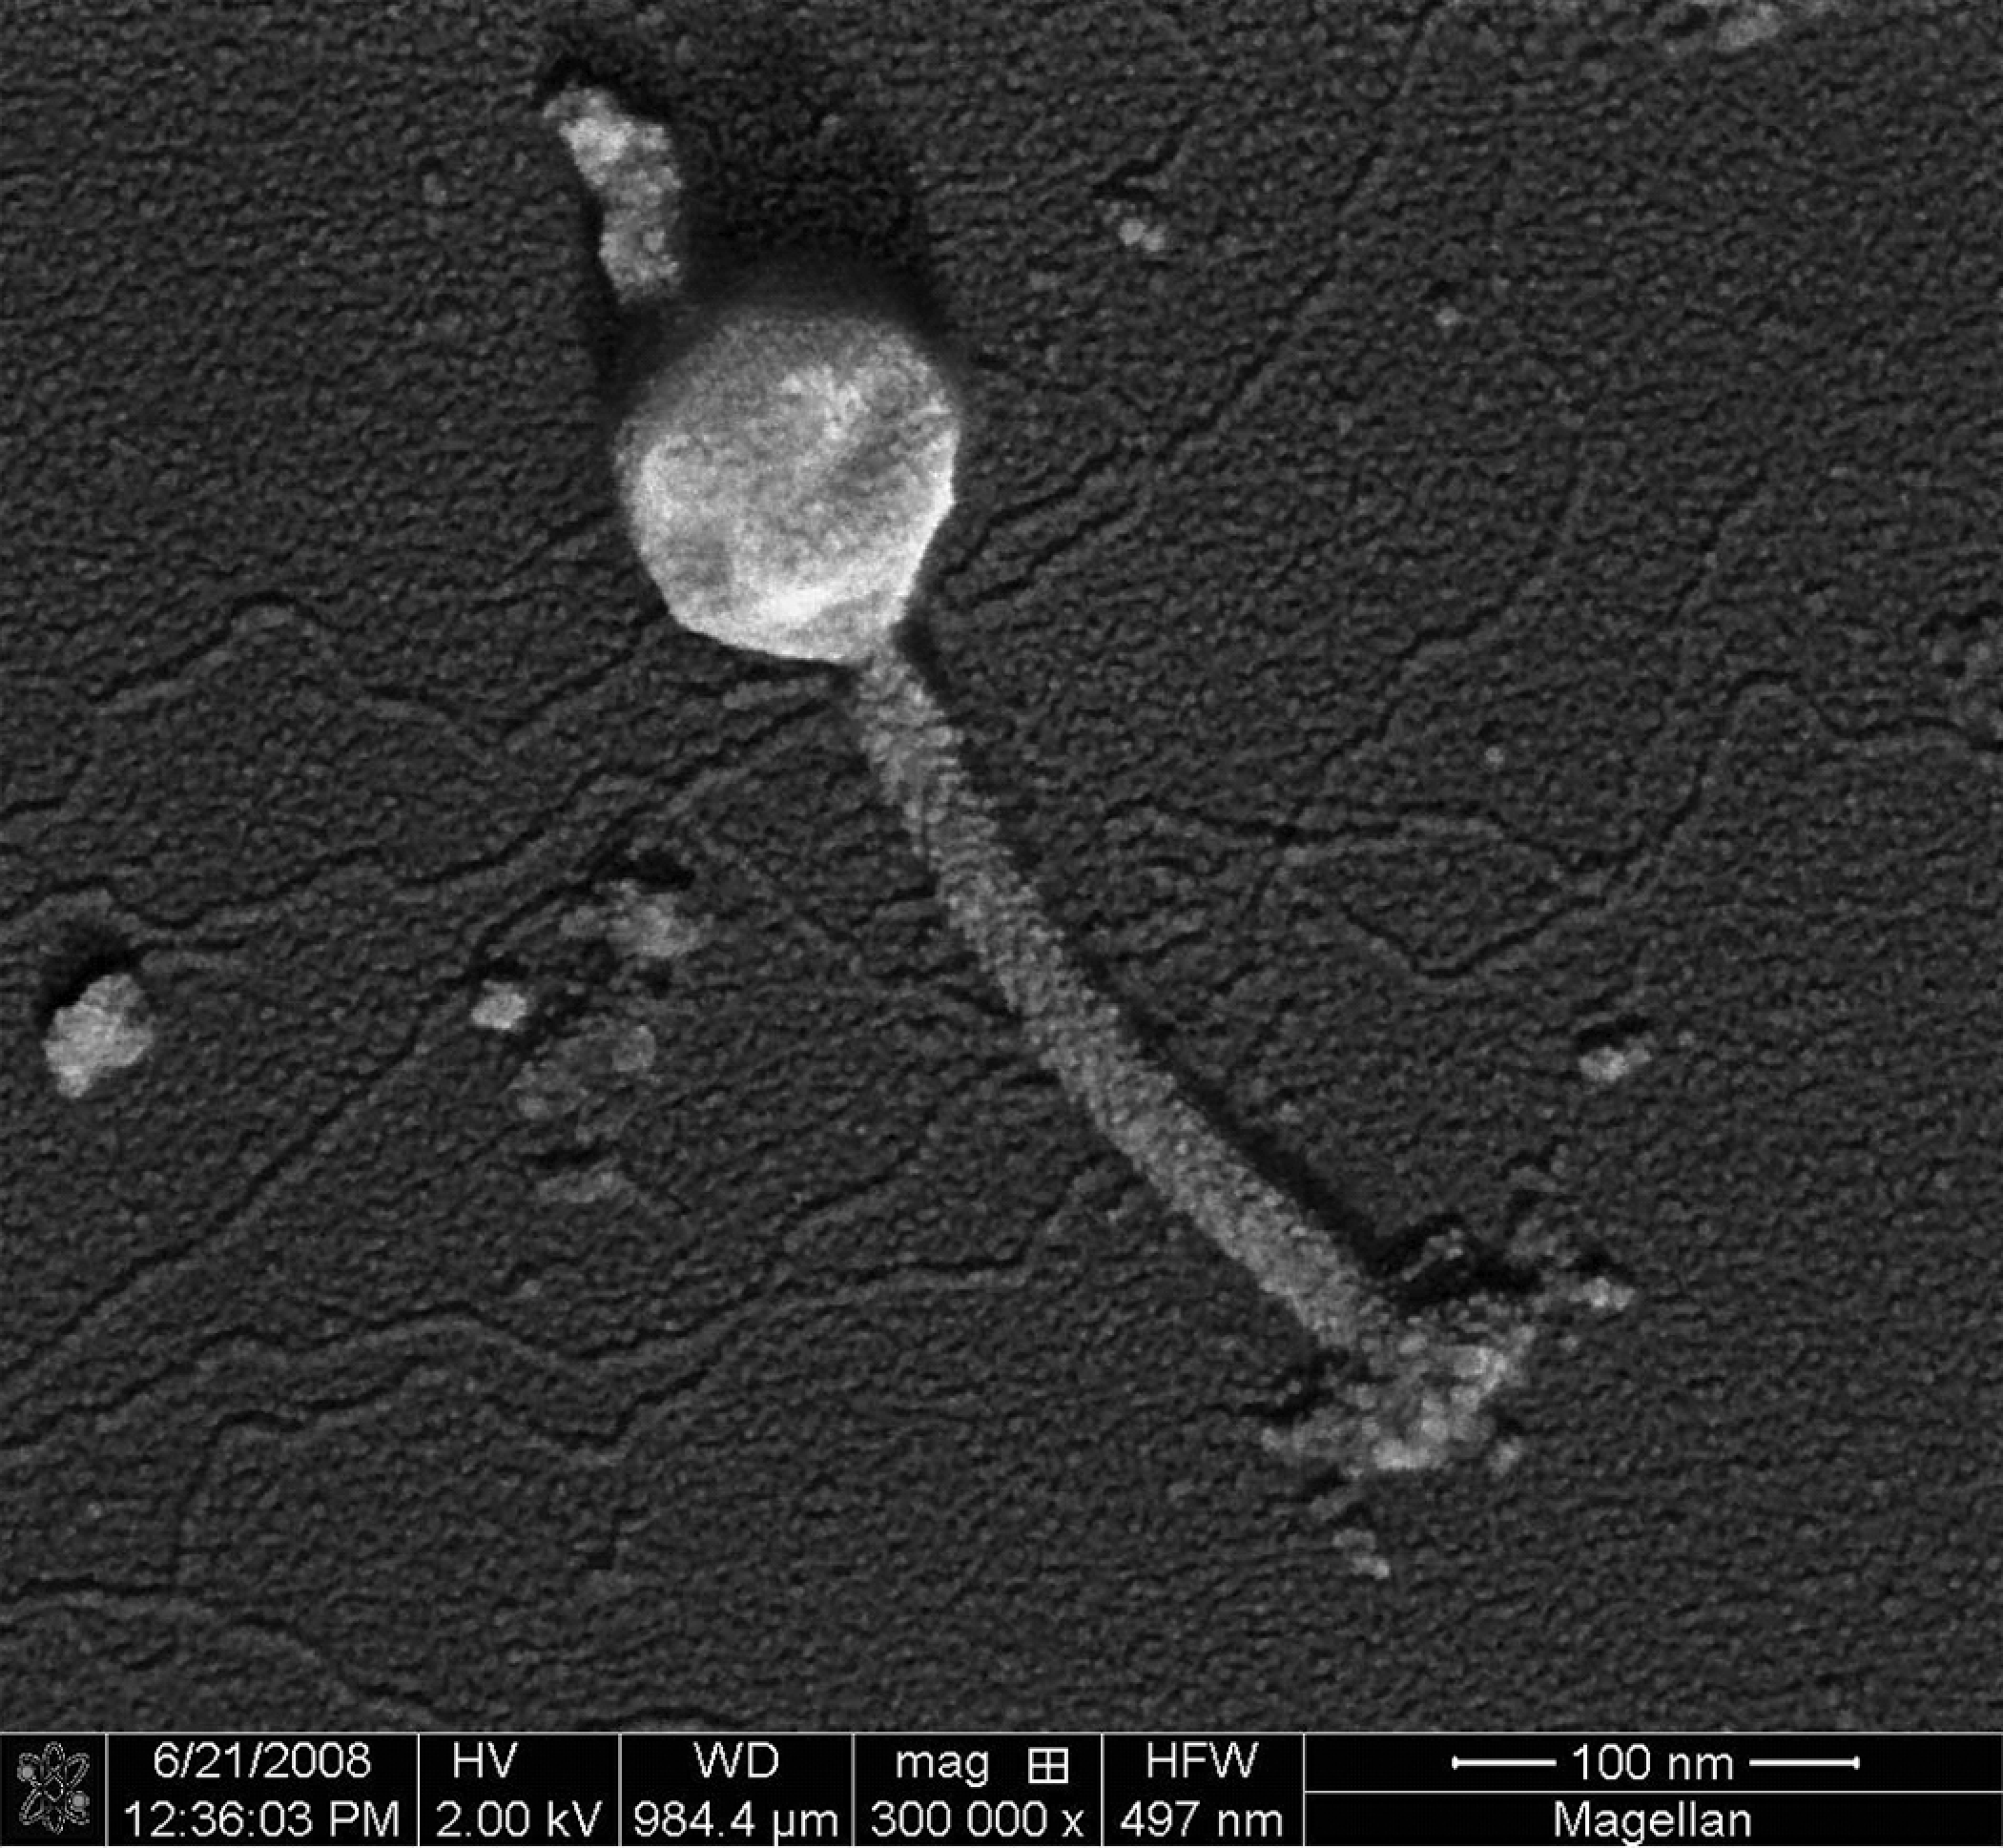
Extreme high-resolution imaging, 2 kV. Intact bacteriophage on substrate, also visible is expelled genetic material from adjacent collapsed bacteriophage. Unpublished results from Ingo Gestmann, FEI.
Taking only a slight detour, we can move now into the area of the DualBeam as it applies to the study of biological tissues. The DualBeam is a tool that materials scientists have used for several decades to slice and view internal structures of integrated curites and metal alloys. Only over the past few years has this tool been used by biologists (Knott et al. 2008). As you know, many TEM samples require microtomy. While this thin-sectioning technique works well on materials with a continuous and similar modulus, hard materials or materials containing hard and soft structures have been the bane of the microtomist for decades. Another limiting factor of microtomy is the size of the block face being cut, which in general needs to be relatively small: for TEM microscopy, less than a few hundred microns and for hard materials, sometimes smaller than that. In addition, it is not always easy or expedient to find very specific areas for the block face (Heymann et al. 2006). In the DualBeam, hard and soft materials can be cut routinely with no damage to the interface between them. Using the SEM portion of the DualBeam, you can pinpoint exactly where to cut the next block face, allowing a new level of flexibility for biological researchers studying a variety of materials from all types of implants to nanoparticles in a variety of biological systems within tissues (Figure 7). In the specific case of looking at the development of osteoporosis, we can examine the relationship between bone and osteocytes at different stages of the disease. You can reconstruct the negative space occupied by the osteocytes and, by virtue of segmentation, be able to map their connectivity. This is something that has never been done before.
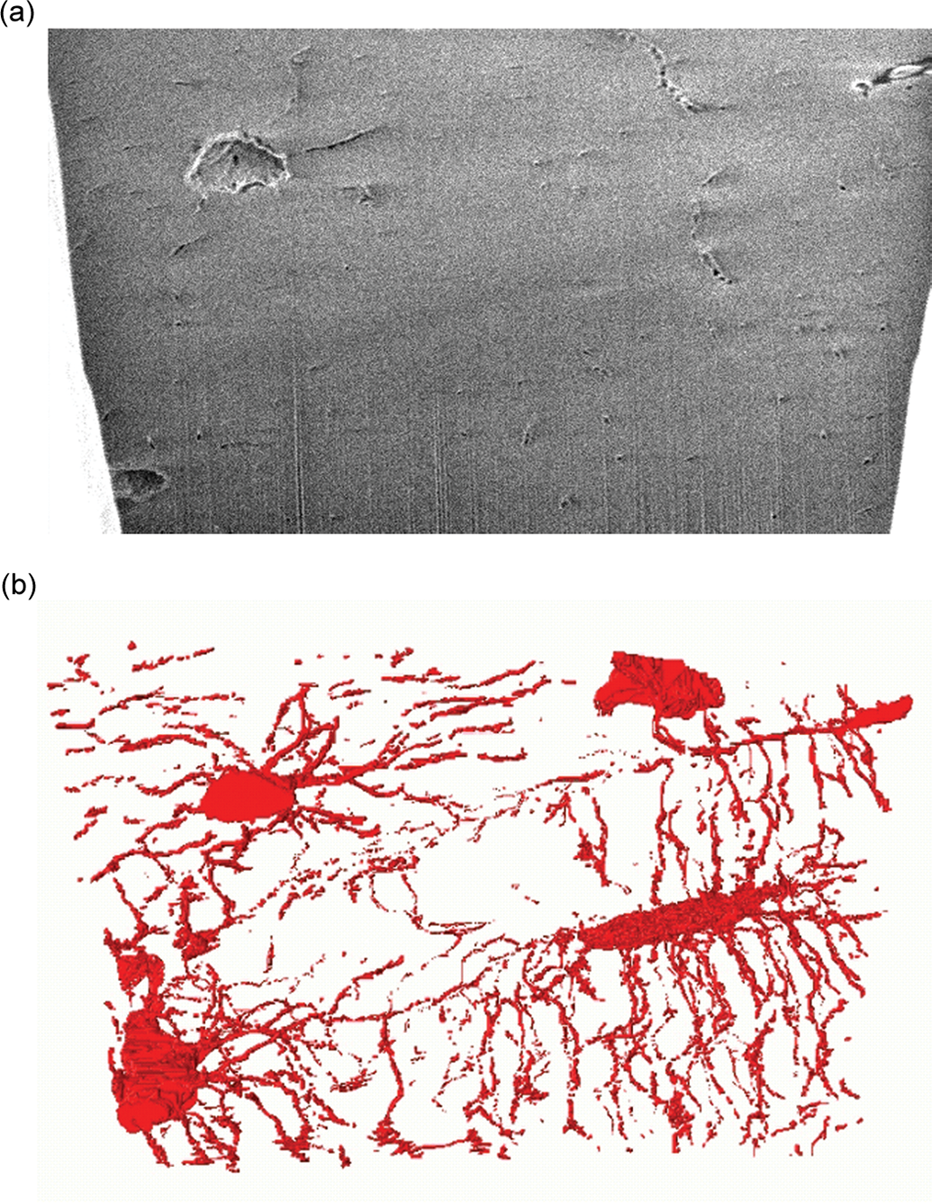
Osteoporosis studies and the potential for 3D imaging. (a) Part of a set of secondary electron images from an area sliced by the DualBeam (b) 3D reconstruction via the image data set in (a), showing osteocyte cells networked to each other via long processes called canaliculi, which are used in the exchange of nutrients and waste. Osteocytes are the most abundant cell found in bone. Stokes et al., Microscopy and Microanalysis 2005.
Another advantage of the DualBeam is the ability to reconstruct a 3D feature from an automated series of cutting and imaging; we call this Slice and View. With slice and view, you can take a 3D journey through a tissue and have a Google Earth–type experience as data can be collected at extremely high resolution over large areas and examined at the so-called 30,000-foot level and at street level (Figure 8).
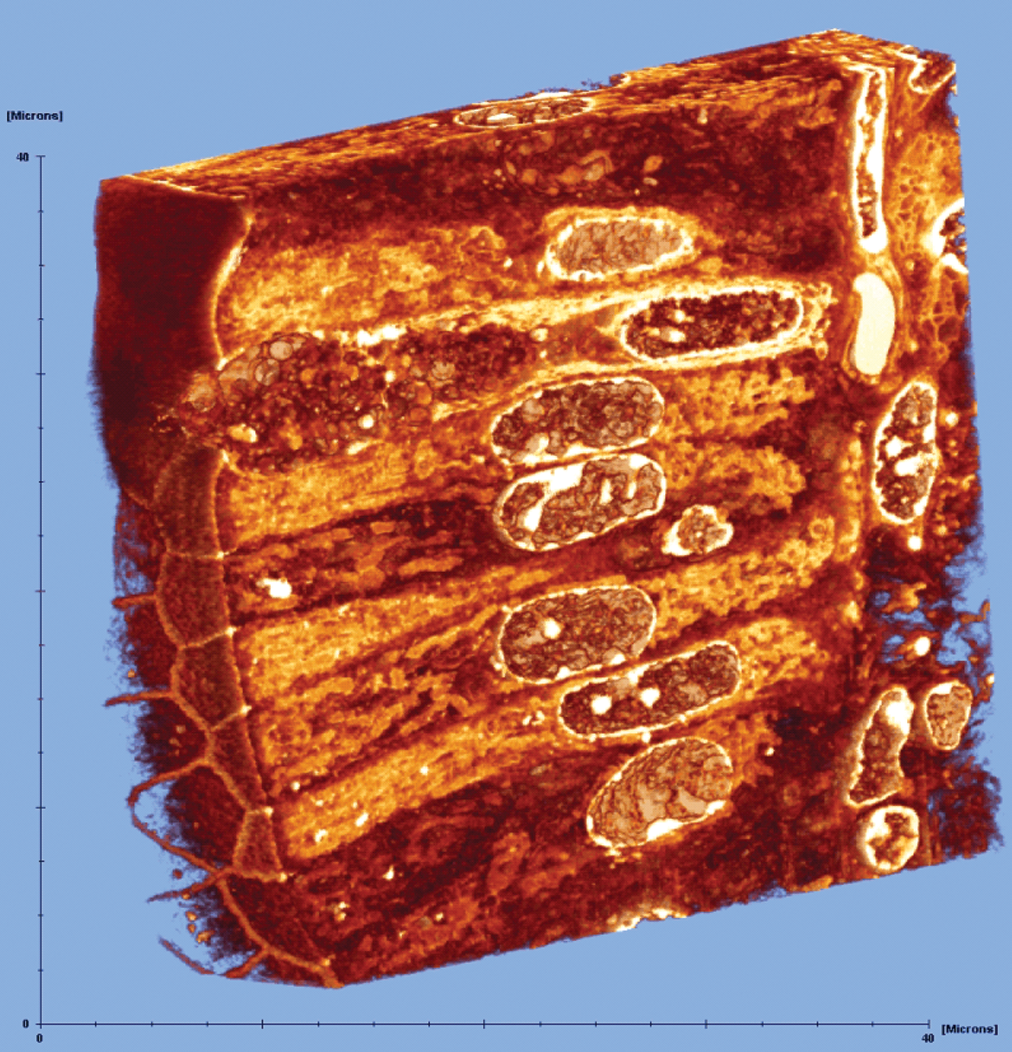
See supplementary material at http://tpx.sagepub.com/supplemental for Movie 3 depicting slice and views through intestinal epithelium tissue morphology (enhanced online). See supplementary material at http://tpx.sagepub.com/supplemental for Movie 4 depicting three-dimensional reconstruction of slice and view through intestinal epithelium tissue morphology (enhanced online). Courtesy: Paul Matsudaira, National University of Singapore Intestinal epithelium tissue morphology.
One last area that I would like to examine is the ability to look at liquids, gels, or emulsions in the DualBeam. Recent developments on internal cryo stages have led to the ability to use the DualBeam to examine all types of frozen hydrated structures such as leaves and mayonnaise and things as important as hair gel. Several years ago, a proof of concept was published showing that the DualBeam could in fact be used for cryo-sectioning samples that contained amorphous ice. To maintain the amorphous nature of ice requires that at no point the sample warms above –140°C. This paper removed all doubt about the nature and disruptive qualities of the DualBeam system. Subsequent papers have also demonstrated the ability of the DualBeam to deliver cryo sections that were very close to artifact free when compared with standard cryo microtomy techniques (Figure 9).
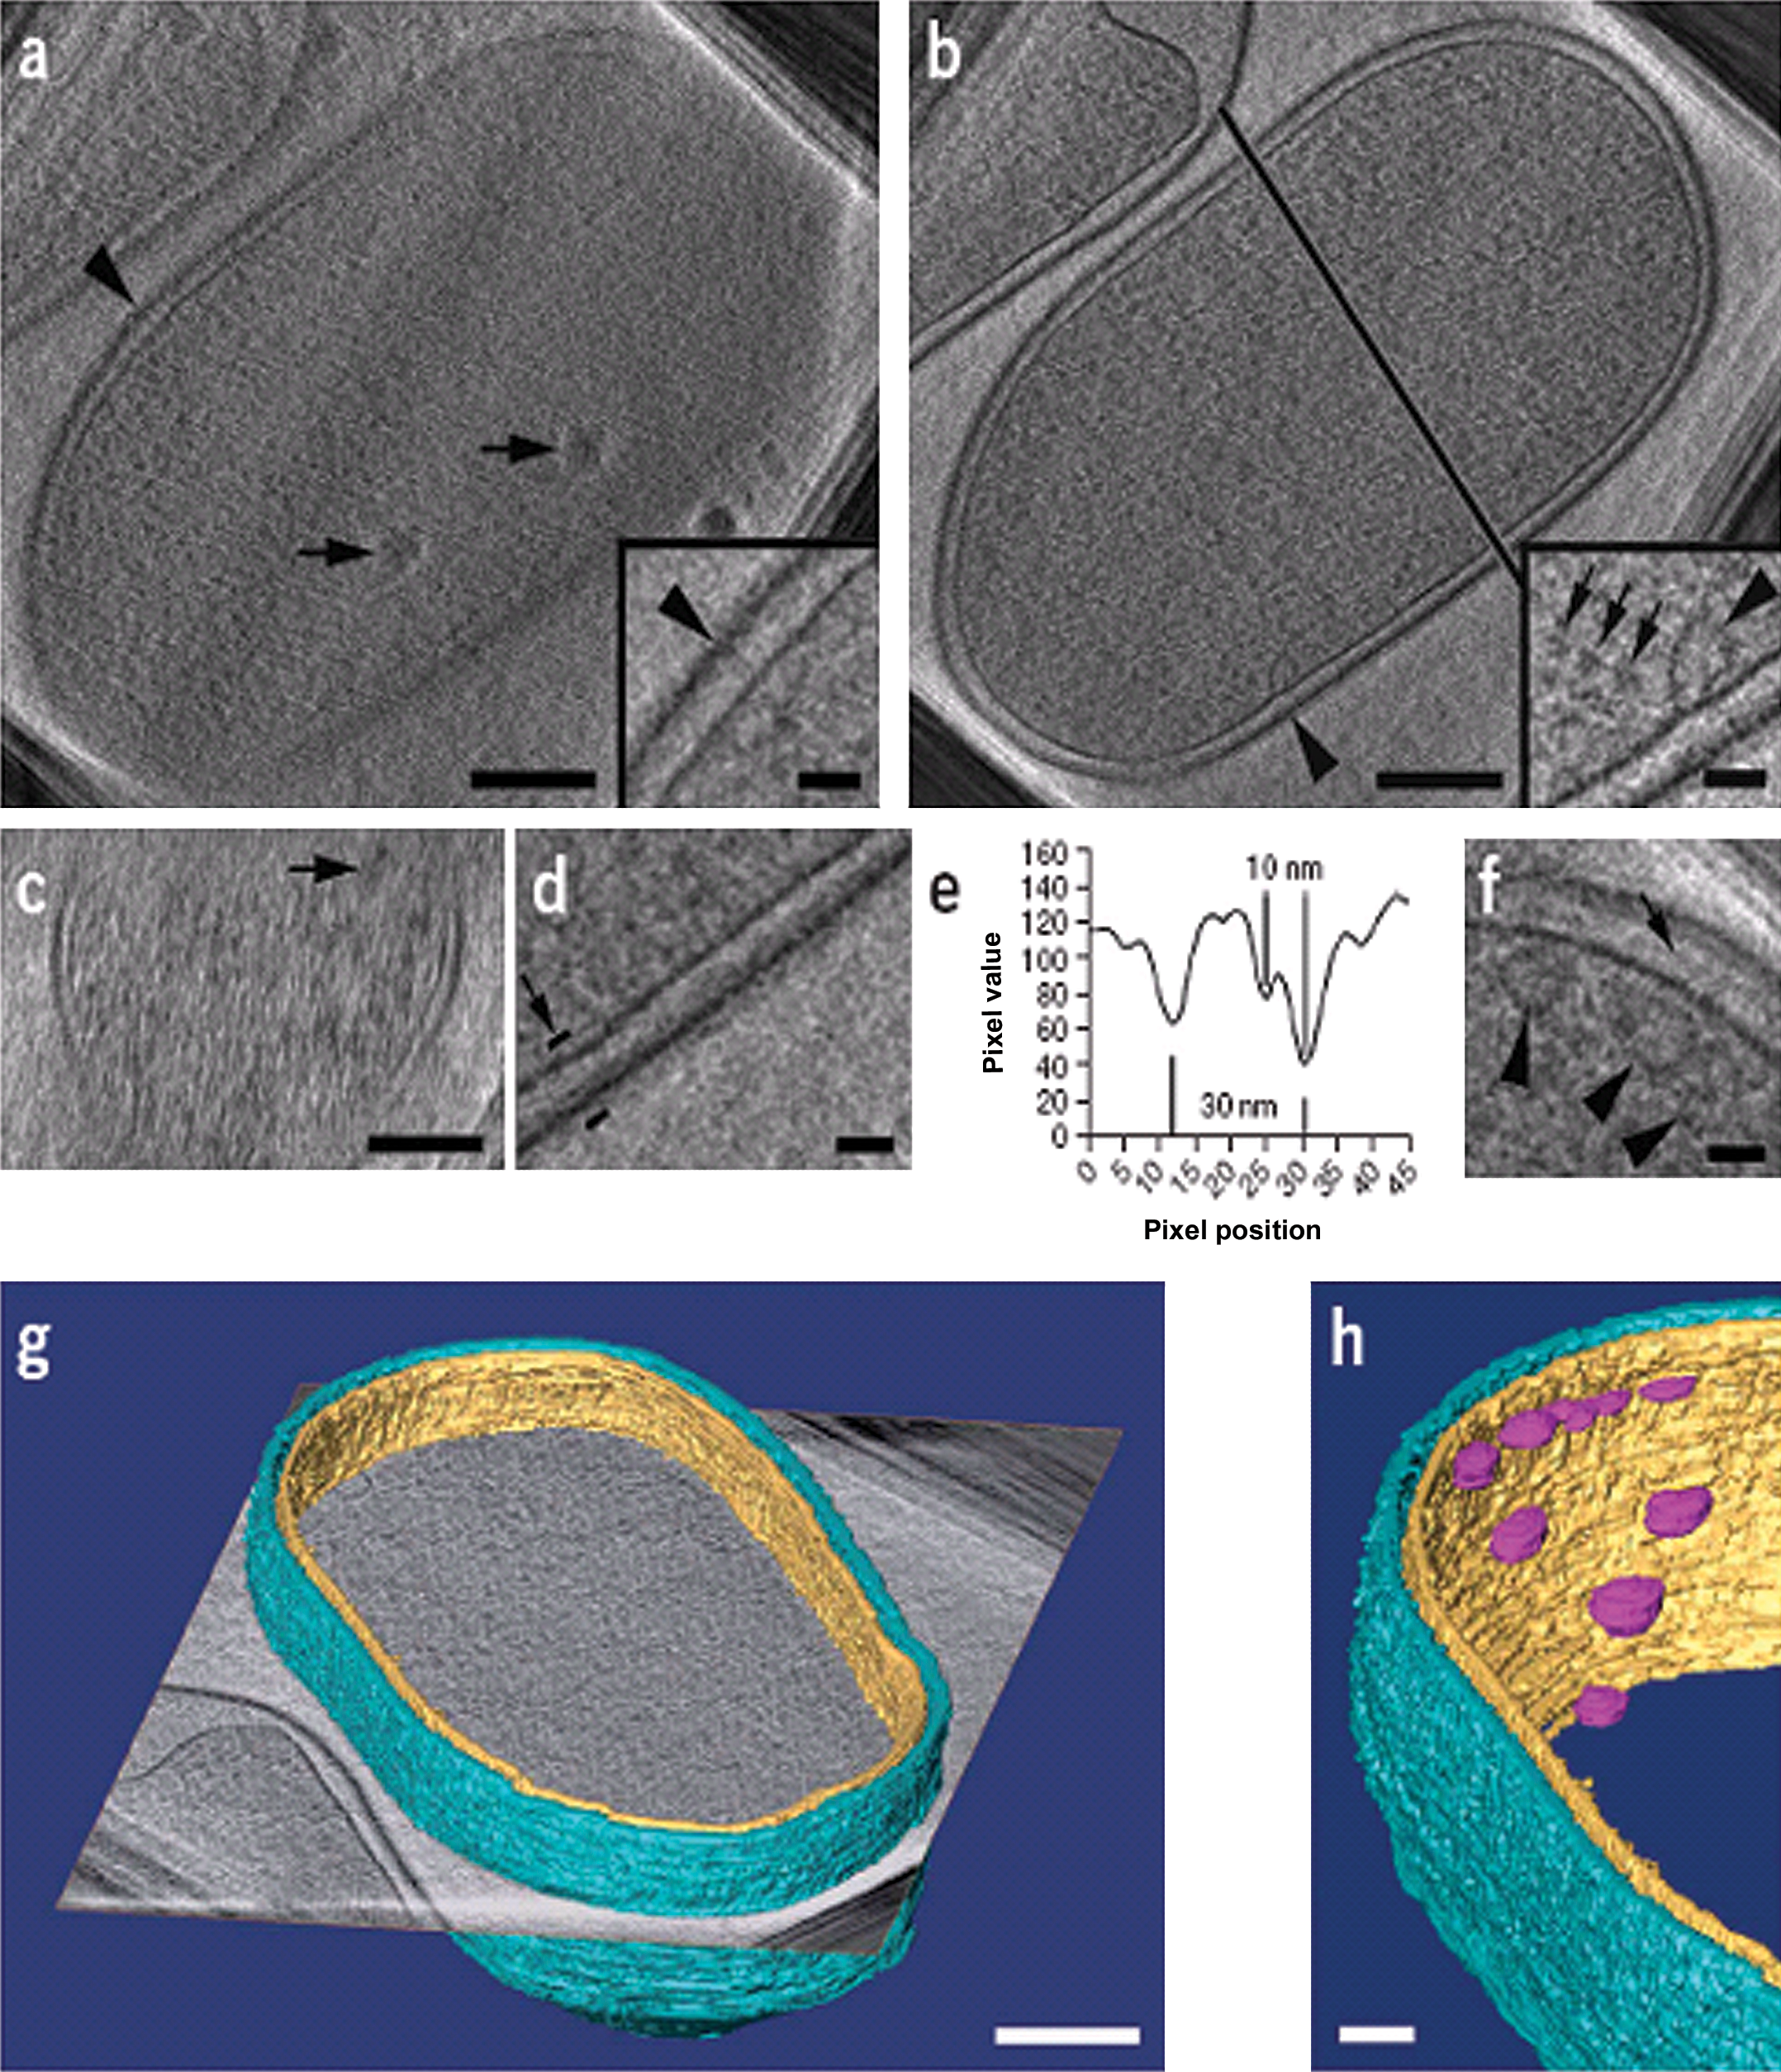
Focused Ion Beam sample for Cryo-electron Tomography of Escherichia coli cells. Marko et al., Nature Methods, 2007.
In summary, the numbers of advances that have been engineered and developed in the past few years have made it possible to see things never before observed and in much more natural states than in the past. These new tools are within reach of just about any laboratory and because of the high degree of automation, they have very short learning curves and allow rapid time to results. Whatever size or type of particle you are looking to track, there is an instrument that will allow you to do that. Whatever substrate or tissue you need to examine, there is an instrument available that will allow you to do that. Whatever type of system changes you are trying to understand, there is an instrument available that will help. Today we cannot think of electron microscopy as business as usual because business as usual is changing very rapidly. In many cases where time to results is critical, new techniques are being developed and explored that allow us to answer questions that we were not able to ask in the past. It is now possible to monitor changes in cells and systems at high resolution in large volumes. We can both ask and answer questions that have major impacts on health and wellness and get answers that repeatedly verify the value of these new technologies we use to explore them.
Footnotes
The author declared no potential conflicts of interest with respect to the research, authorship, and/or publication of this article. DualBeam is a trademark of FEI Company.
The author received no financial support for the research, authorship, and/or publication of this article.