
Abstract
Tesaglitazar was developed as a dual peroxisome proliferator–activated receptor (PPARα/γ). To support the clinical program, a hamster carcinogenicity study was performed. The only neoplastic findings possibly related to treatment with tesaglitazar were low incidences of hemangioma and hemangiosarcoma in the liver of male animals. A high-power, two-year investigative study with interim necropsies was performed to further elucidate these findings. Treatment with tesaglitazar resulted in changes typical for exaggerated PPARα pharmacology in rodents, such as hepatocellular hypertrophy and hepatocellular carcinoma, but not an increased frequency of hemangiosarcomas. At the highest dose level, there was an increased incidence of sinusoidal dilatation and hemangiomas. No increased endothelial cell (EC) proliferation was detected in vivo, which was confirmed by in vitro administration to ECs. Immunohistochemistry and gene expression analyses indicated increased cellular stress and vascular endothelial growth factor (VEGF) expression in the liver, which may have contributed to the sinusoidal dilatation. A two-fold increase in the level of circulating VEGF was detected in the hamster at all dose levels, whereas no effect on VEGF was observed in patients treated with tesaglitazar. In conclusion, investigations have demonstrated that tesaglitazar does not produce hemangiosarcomas in hamster despite a slight effect on vascular morphology in the liver.
Introduction
Peroxisome proliferator–activated receptors (PPARs) are a group of three homologous transcription factors that play a central role in glucose and lipoprotein metabolism (Feige et al. 2006). Peroxisome proliferator–activated receptor-α is highly expressed in liver, skeletal muscle, heart, and brown adipose tissue and coordinates expression of many genes important for fatty acid catabolism (Peters et al. 1997). Peroxisome proliferator–activated receptor-γ is present primarily in adipocytes, but also in macrophages and at low levels in other cell types and regulates genes important for adipocyte differentiation, lipid storage, and glucose homeostasis (Lehrke and Lazar 2005). Peroxisome proliferator–activated receptor-δ is ubiquitously expressed and has been implicated in diverse functions, such as embryo implantation, lipid metabolism, and keratinocyte differentiation (Barak et al. 2002; Kim et al. 2006). Agonists to PPARα, the fibrates, have well-documented therapeutic effects in dyslipidemia, and agonists to PPARγ are effective in the treatment of insulin resistance, diabetes, and concurring dyslipidemia (Lee et al. 2003).
Tesaglitazar is a dual PPARα/γ agonist that is more potent on PPARγ than on PPARα and has no activity on PPARδ (Cronet et al. 2001). Clinical evaluation has shown that tesaglitazar reduces abnormalities of glucose and lipid metabolism associated with insulin resistance and improves the atherogenic lipoprotein profile in patients with dyslipidemia of insulin resistance (Fagerberg et al. 2005; Goke et al. 2007; Ratner et al. 2007; Schuster et al. 2008; Wilding et al. 2007). Tesaglitazar was discontinued from further development in May 2006, as data from phase III clinical studies showed that the benefit-risk profile was unlikely to give an advantage over currently available therapies.
The toxicological effects of PPARα agonists (peroxisome proliferators) have been extensively investigated. Peroxisome proliferator–activated receptor-α agonists induce liver tumors in rats and mice, but they also frequently induce thyroid, pancreatic acinar cell, and testicular Leydig cell tumors. The modes of action for these tumors have been identified and are generally considered not to be relevant to humans (Cattley et al. 1998; Klaassen and Hood 2001; Klaunig et al. 2003; McClain 1989; Morimura et al. 2006).
Several PPARγ and dual PPARα/γ agonists induce other types of tumors in rodents, including fibrosarcomas, liposarcomas, and urinary bladder tumors in rats, and hemangiosarcomas in mice (Cohen 2005). Fibrosarcomas or liposarcomas were induced in rats, and/or hemangiosarcomas were detected in mice in a majority of tested PPARγ and dual PPARα/γ agonists (El Hage 2005). The commonality in tumor findings across this class of compounds caused concerns regarding human risk, and investigative studies to elucidate the mode of action were initiated. A large number of pharmaceutical companies have been involved in the International Life Science Institute (ILSI) PPAR Initiative with the aim to produce mode of action frameworks for fibro-, lipo-, and hemangiosarcomas and urinary bladder tumors (Cohen et al. 2006, 2009; Hardisty et al. 2007; Meek et al. 2003). Previous to the ILSI discussions, a hypothesis on the involvement of increased circulating levels of VEGF and other growth factors produced in adipose tissue had been suggested in the literature (Herman et al. 2002). Increased plasma levels of VEGF have been observed in patients with diabetes treated with troglitazone and pioglitazone (Baba et al. 2001; Emoto et al. 2001).
The carcinogenic potential of tesaglitazar has been assessed in the rat and the hamster. Results in the rat showed the typical PPARα-induced spectrum of tumors including liver and thyroid tumors, but in addition, subcutaneous fibrosarcomas were found in both sexes (Hellmold et al. 2007). To avoid the PPARα-induced tumors, hamsters were chosen as the second species since they are known to be less sensitive to this effect (Lake et al. 1993; Price et al. 1992). However, an equivocal finding of hepatic hemangiosarcomas, with low incidence and no dose response, was detected in male hamster liver, which regulatory authorities interpreted as a finding that needed further investigation. To establish whether or not tesaglitazar produces hemangiosarcomas in hamsters and to investigate the potential mechanism, a two-year investigative study with increased group sizes was performed in male hamsters. This study included interim necropsies and a large number of investigative end points, such as assessment of cell proliferation, circulating levels of growth factors, and gene/protein expression in liver and adipose tissue. In parallel, investigative studies were undertaken to assess effects on plasma growth factor levels in clinical studies with tesaglitazar as well as in vitro studies on endothelial proliferation. The results from the carcinogenicity study and the investigative program are presented here. Taken together, the data clearly show that tesaglitazar did not produce hemangiosarcomas in hamsters. An increase in hepatocellular carcinoma was observed, in line with published data from other PPAR activators. At the highest dose level, there was also an increase in sinusoidal dilatation and angioma formation, although no increased proliferation of endothelial cells could be detected in the liver. Immunohistochemistry and gene expression analysis pointed toward increased cellular stress and increased VEGF expression, which may have contributed to the dilatation of sinusoidal vessels. There was an increased level of circulating VEGF in the hamster; in contrast, no such effect was observed in patients treated with tesaglitazar. Neither was there any proliferative effect on human umbilical endothelial cells (HUVECs) treated in vitro with tesaglitazar.
Material and Methods
Test Substance
Tesaglitazar ([S]-2-ethoxy-3-[4-({4-[methylsulphonyloxy] phenethyl}oxy)phenyl] propanoic acid) was synthesized by AstraZeneca. The test substance was dissolved in vehicle, which consisted of 5 mM sodium hydrogen carbonate buffer solution, pH 8.5.
Animals
Male and female Syrian golden hamsters (Lak:LVG(SYR)BR Outbred VAF/Plus) were obtained from Charles River UK Limited, England. The animals were allowed to acclimatize for two weeks before the start of the study and were six to eight weeks of age at the start of dosing.
Carcinogenicity Study
The carcinogenicity study was performed at RCC Ltd Toxicology, Itingen, Switzerland (Charles River). Vehicle groups contained one hundred animals and treated groups contained fifty animals per sex. The daily dose by oral gavage was 0.005, 0.03, 0.2, and 1 µmol/kg tesaglitazar in males and 0.02, 0.1, 0.6, and 3 µmol/kg tesaglitazar in females for 104 weeks. The daily dose volume was 10 mL/kg. The expected safety margins to therapeutic exposure for the highest dose level were more than 10. Animals were observed daily for clinical signs of toxicity and for palpable masses every four weeks. Blood samples for determination of plasma levels of tesaglitazar were obtained from four male and four female satellite animals at weeks 13 and 52, at one, three, five, eight, and twenty-four hours post-dose. All animals in the main study (including preterminally killed animals and animals found dead) were subjected to a necropsy. A full range of tissues from all animals was evaluated microscopically on hematoxylin and eosin (HE)–stained slides. The following statistical methods were used. The Dunnett test was applied if the variables could be assumed to follow a normal distribution for the comparisons of the treated groups and the control groups. The Steel test was applied instead when the data could not be assumed to follow a normal distribution. The Fisher exact test was applied to the macroscopic findings. The Armitage/Cochran Trend Test was used for non-neoplastic lesions, if appropriate.
Investigative Study
The aim was to perform a high-power study to be able to assess low-incidence findings. A total of 366 male hamsters per treatment group were administered vehicle or tesaglitazar at 0.03 and 1 µmol/kg by daily oral gavage for up to 104 weeks. Due to high mortality in the vehicle group, an extra vehicle group with 198 male hamsters was started after sixty weeks. Interim sacrifices were performed after one, two, three, four, and twelve weeks (ten males per group), twenty-six weeks (sixteen males per group), thirty-eight weeks (five males per group), and fifty-two weeks (fourteen or fifteen males per group) were included. The daily dose volume was 10 mL/kg. The doses of tesaglitazar were based on the hamster carcinogenicity study.
Blood samples for determination of plasma levels of tesaglitazar were taken at week 12, three hours post-dose (approximately Cmax) from three to seven animals. BrdU was administered to all animals during the last week before scheduled necropsy up to fifty-two weeks by implantation of osmotic mini-pumps (20 mg/mL, 2 mL).
All animals were subjected to necropsy. Liver samples were taken from all animals at each time point, fixed in 4% formaldehyde, and processed to paraffin wax for microscopic evaluation. Hematoxylin and eosin–stained slides were prepared for histopathological examination, and immunohistochemical stainings were prepared as detailed below. Frozen liver samples were taken for gene expression analyses. To investigate the cause of the high mortality, especially in the vehicle group, intestines were sampled from all animals found dead or killed around fifty-two weeks and subjected to histopathological examination.
Immunohistochemistry
Paraffin-embedded sections from the liver were cut at 4 µm on SuperFrost + slides. Staining for BrdU and VEGF was performed on liver sections from five animals in the groups terminated at one, two, three, four, twelve, twenty-six, and fifty-two weeks. Staining for VEGFR-2 and PPARγ was performed on liver sections from five animals in the groups terminated at one, two, three, four, and twelve weeks. Immunohistochemical staining for the detection of incorporated BrdU was performed on the staining module Discovery XT from Ventana Medical Systems (Tucson, AZ, USA). All solutions for deparaffination, pretreatment, counterstaining, detection, and rinsing steps were supplied by Ventana Medical Systems. Both heat (forty minutes at 96°C in pH 8) and enzyme digestion (protease 0.02 U/mL, four to eight minutes) were used as pretreatment. The primary antibody (mouse anti-BrdU, # M0744, Dako, Stockholm, Sweden) was added at a dilution of 1:50, in phosphate-buffered saline (PBS). The secondary antibody (biotinylated goat anti-mouse IgG, # E0433, Dako) was diluted 1:250 plus 5% normal goat serum (Dako), in Discovery Ab diluent (Ventana Medical Systems). The immunoreaction was visualized with diaminobenzidine (DABMap kit 760-124, Ventana Medical Systems), and counterstaining was performed with hematoxylin. After the staining, the slides were dehydrated in rising concentrations of ethanol and mounted in Cytoseal XYL (Richard-Allan Scientific, Kalamazoo, MI, USA). Immunohistochemical staining for VEGF was performed on the Techmate 500+ (Dako A/S, Glostrup, Denmark). All solutions for blocking, antibody dilution, detection, counterstaining, and rinsing steps were provided by Dako A/S. The slides were blocked for endogenous peroxidase with HP block for seven and one half minutes at room temperature. The slides were also blocked with 5% normal rabbit serum (NRS) for ten minutes prior to addition of primary antibody. The primary antibody (goat anti-rat VEGF, R&D Systems/AF564, Minneapolis, MN, USA) was diluted at a concentration of 10 µg/mL in Antibody Diluent with 5% NRS. The secondary antibody was a rabbit anti-goat biotinylated antibody (Dako A/S, product no. E0466), diluted 1/250 in Antibody Diluent with 5% NRS. Avidin-biotin complex (ABC) was used as the detection system, with DAB as the chromogen. After immunostaining, the slides were counterstained in hematoxylin, dehydrated in increasing concentrations of ethanol, and mounted as described above.
Immunohistochemical staining for VEGFR-2 was performed on the staining module Discovery XT (Ventana Medical Systems). All solutions for deparaffination, pretreatment, counterstaining, detection, and rinsing steps were supplied by Ventana Medical Systems. Antigen retrieval was performed at 98°C for forty minutes in CC1, which is a tris/borate/EDTA buffer, pH 8. The primary antibody (rabbit anti-mouse VEGFR-2, Santa Cruz/sc-504) was diluted 1:40 in PBS with 5% normal goat serum (NGS; Dako A/S). The secondary antibody (biotinylated goat anti-rabbit IgG; (Dako A/S, product no. E0432) was diluted 1:200 in Antibody Diluent (Ventana Medical System Inc.) with 5% NGS. The immunoreactions were visualized with DAB-MAP kit, counterstained, and sealed as described above. Immunohistochemical staining for PPARγ was performed on the staining module Discovery XT (Ventana Medical Systems). The formalin-fixed paraffin sections were pretreated with heat at 95°C–98°C for forty minutes in a Tris/Borate/EDTA buffer, pH 8, followed by protease treatment (0.02 U/mL) for eight minutes. The primary antibody (a monoclonal antibody against PPARγ [E-8 from Santa Cruz Biotechnology, Santa Cruz, CA, USA]) was diluted 1:50 in PBS and incubated on sections for sixty minutes at 37°C. The secondary antibody, biotinylated goat anti-mouse, Dako E433 (Dako, Glostrup, Denmark), was diluted 1:250 with 5% NGS, incubated on sections for thirty-five minutes at room temperature, and visualized with a DABMap kit (see above). The sections were then counterstained with 0.4% Light Green for one minute, differentiated, dehydrated, and coverslipped with Pertex 00811(Histolab, Västra Frölunda, Sweden).
Evaluation of BrdU-Labeling and VEGF, VEGFR-2, and PPARγ Immunohistochemistry
Incorporation of BrdU and expression of VEGF and VEGFR-2 was assessed using the following grading system: 0 = no labeling; 1 = occasional + cells; 2 = scattered + cells; 3 = moderate number of + cells; and 4 = numerous + cells. Separate scores for endothelial cells and hepatocytes were determined.
The intensity of PPARγ staining was evaluated under light microscope according to the following scale: 0 = negative in hepatocytes; 1 = very weak nuclei staining in subcapsular hepatocytes; 2 = weak and nuclei staining in hepatocytes (diffuse location); 3 = moderate intensity and nuclei staining in hepatocytes (diffuse location); and 4 = strong intensity in the nuclei as well as cytoplasm staining in hepatocytes (diffuse location). Statistical analysis of BrdU, VEGF, VEGFR-2, and PPARγ scores was performed with the nonparametric Kruskal-Wallis test, followed by the Mann-Whitney U test, two-tailed distribution, for groupwise comparison. In the case of all animals within one group receiving identical scores, the Mann-Whitney U test could not be used as applied in the GraphPad Prism 4 software (Version 4, released December 22, 2003, GraphPad Software Inc., La Jolla, CA, USA). Accordingly, only the Kruskal-Wallis analysis was performed in such cases. Correlation between BrdU labeling scores for hepatocytes and endothelial cells was performed with the nonparametric Spearman test. A p value of <.05 was considered to be statistically significant. All statistical analyses were performed using GraphPad Prism 4 software.
Gene Expression Analyses
In Situ Hybridization
In situ hybridization, using VEGF-A–specific hamster probes, was performed on formalin-fixed and paraffin-embedded liver sections from the 4 w interim time point. Tissues from the following animals were analyzed: #1118, #1121, and #1124 from the 1-µM dose group; and #358, #359, and #362 from the control group. The three high-dose animals were selected for this investigation based on the presence of representative treatment-related findings in the liver, as evaluated on HE-stained slides (centrilobular hypertrophy, midzonal fat vacuolation, bile duct hyperplasia). Hamster liver total RNA was prepared and synthesised to cDNA using a High Capacity cDNA Archive kit (Applied Biosystems, Stockholm, Sweden) before the first polymerase chain reaction (PCR). The following primers were used for the primary PCR reaction: 5′-GAGACCCTGGTGGACATCTT-3′ VEGF forward primer1 and 5′-ACAAATGCTTTCTCCGCTCT-3′ VEGF reverse primer1. The PCR cycle was 95°C for two minutes, followed by 95°C for one minute, 55°C for thirty seconds, 72°C for one minute repeated thirty times, ending with 72°C for fifteen minutes. The resulting product was 295bp, which was analyzed on an Agilent Bioanalyzer (Santa Clara, CA, USA). The product was diluted 1:50, of which 2 µL was used for the nested PCR. The following primers were used for the nested PCR: 5′-ATCTTCAAGCCGTCCTGTGT-3′ nested VEGF forward primer2 and 5′-TATGTGCTGGCTTTGGTGAG-3′ nested VEGF reverse primer2. The reaction was subjected to the identical PCR cycle described above. The product was purified with a Qiaquick PCR purification Kit (Qiagen, Sollentuna, Sweden) and cloned into pCRII-TOPO vector using a TOPO TA Cloning Kit dual promotor (Invitrogen, Stockholm, Sweden). The plasmid was sent to Cybergene to verify hamster VEGF identity. The VEGF-A probe was synthesized using the protocol from the manufacturer (Roche DIG RNA Labeling Kit, SP6/T7) and a linearized plasmid containing the cloned VEGF-A sequence. After the probe labeling, quantification was performed using spectrophotometer and 2% agarose gel. The liver tissue sections used for in situ hybridizations were deparaffinized in xylene and rehydrated in decreasing EtOH concentrations. The water used in preparing the solutions described below was DEPC treated and ingredients used were RNase free. The sections were treated with Prot K (10 mg/mL) at 37°C for ten minutes, washed in PBS/DEPC, and postfixed in 4% PFA at 4°C for ten minutes. After washing in PBS and thereafter in 1× TBS (10× TBS = 876.6 g NaCl, 121.1 g Tris, and 40 mL HCl adjusted to pH 8.0), the sections were prehybridized in 1× hybridization solution (prepared using 50 mL formamide, 6 mL5M NaCl, 1 mL 1M Tris pH = 8, 0.2 mL 0.5 M EDTA, 5 mL 20× Denhart’s solution, and 20 mL 50% dextran sulfate) and herring sperm tRNA (0.5 mg/mL) at 52°C for one hour followed by addition of VEGF-A probe (3770 ng/mL) and incubation at 52° C overnight. The sections were washed at 52°C in 2× SSC at for one minute, 2× SSC and 30% formamide for thirty minutes, and 0.1× SSC for thirty minutes. The sections were thereafter blocked and labeled with DIG-antibody (1:100) using the protocol from the manufacturer and detected using NTB/BCIP and Fast Red according to protocol. The color was developed for fifteen minutes in the dark, and sections were washed and counterstained in hematoxylin for ten seconds, washed, and mounted in mounting medium (glycerin gelatin).
Reverse Transcriptase and TaqMan Real-Time PCR
Relative hepatic expression of lactate dehydrogenase (LD) and phoshphoglycerol kinase (PGK) transcripts in tesaglitazar-treated animals compared to vehicle were performed at 1, 2, 4, and 12 weeks and 1, 2, 4, 12, 26, 38, 52, and 104 weeks for c-myc, PPARα, and PPARγ. For each time point, three animals from each dose group were analyzed. Total RNA was extracted using an RNeasy Mini Kit (Qiagen). The quality of the extracted RNA was analyzed using an Agilent 2100 Bioanalyzer (Agilent). The amount of total RNA was also quantified with a NanoDrop ND-1000 Spectrophotometer (NanoDrop Technologies, Wilmington, DE, USA), and the rest was stored at −80°C for subsequent RT-PCR analysis. Total RNA (1–2 µg) was reverse transcribed using a high-capacity cDNA archive kit (Applied Biosystems) according to the manufacturer’s instructions. Primer and probe sequences were designed using the Primer3 Web site (Rozen and Skeletsky 2000), and they were used to amplify and detect target sequences using the 5′-nuclease PCR assay (TaqMan). The DNA was synthesized, purified, and quality controlled at MWG Biotech AG (Ebersberg, Germany). Real-time RT-PCRs were performed using the MessageSensor RT kit (Ambion, Austin, TX, USA), according to the protocol from the manufacturer. Each RNA sample (liver) was assayed in duplicate for all the genes listed below (oligonucleotides ordered from MWG, Ebersberg, Germany) and for two reference genes (18S rRNA and GAPDH). Semiquantitative expression levels were obtained from the real-time PCR data using a relative standard curve, as described in Bustin et al. (2000). All data were subsequently normalized to the level of GAPDH expression. Both 18S rRNA and GAPDH were tested to make sure that there was no treatment-related effect of the reference genes. Expression levels were presented as fold changes compared to the vehicle group. Phosphoglycerate kinase (PGK): Forward 5′-GAAGAACAATCAGATAACAAATAACCA-3′, Reverse 5′-GTCAGGCATGGGAACACC-3′ and probe 5′FAM-TATGAGCCACTTGGGCCGGC-3′TAM. Lactate dehydrogenase (LD): Forward 5′-ATGAAGGACTTAGCAGATGAGCTT-3′, Reverse 5′-GCCAGAGACAATTTTTGGTGTT-3′ and probe 5′FAM-TGGATCTCCAGCATGGCAGCC-3′TAM. PPARα: Forward 5′-ATTTCCCTTTTTGTGGCTGCTATA-3′, Reverse 5′-CTGCAACTTCTCAATGTATCCTATGTTTA-3′ and probe 5′FAM -AGGCCAGGCCGATCTCCACAGC-3′TAM. PPARγ: Forward 5′-CTCGCTGTGGGGATGTCT–3′, Reverse 5′-CTTCTCCTTCTCGGCCTGT-3′ and probe 5′FAM -TGCCATCAGGTTTGGGCGG-3′TAM. c-Myc: Forward 5′- AGTGCTGCATGAGGAGACAC –3′, Reverse 5′- CTGCCTCTTTTCCACAGACA -3′ and probe 5′FAM - CACCAGCAGCGACTCTGAGGAAGA -3′TAM. TaqMan real-time PCR data (dosed groups vs. vehicle) were analyzed using a two-tailed t test and equal variance and set for a p value < .05 for significance.
Growth Factor Analysis in Hamster Serum
Duplicate serum samples from ten animals in groups terminated after 1, 2, 3, 4, 12, and 26 weeks were analyzed for VEGF, platelet-derived growth factor (PDGF-BB), and fibroblast growth factor (FGF-2-2) using ELISA. Samples from weeks 38, 52, and 104 were analyzed for VEGF only. A kit control was used to reflect variations between test occasions. A multiplex bead assay was also used to analyze VEGF in 12-week samples to verify that results from the ELISA were reproducible. Kits for mouse VEGF immunoassay (cat no. DVE00), human PDGF-BB-BB immunoassay (cat no. DBB00), and human FGF-2 basic immunoassay (cat no. HSFB75 and high-sensitivity DFB50) were obtained from R&D Systems (Minneapolis, MN, USA), and were used according to description from the manufacturer with minor modifications. Different dilutions were tested and the results have compensated for the dilution factor. The samples tested for VEGF were analyzed undiluted, and PDGF-BB samples were diluted four times. Samples under the lowest standard concentration were calculated as zero. The concentration ranges of the tests were 7.8–500 pg/mL for mouse VEGF, 31.2–2,000 pg/mL for human PDGF-BB-BB, 10–640 pg/mL for human FGF-2, and 1–64 pg/mL for human FGF-2 high-sensitivity. The optical density of each sample was determined using a microplate reader, SpectraMax 250 (Molecular Devices, Sunnyvale, CA, USA). For calculation of the standard curve and sample value, the software SOFTmax PRO (version 3.0) was used. Statistical analysis was performed on VEGF data only using a linear mixed effects model, with dose group, week, and the interaction between dose groups and week as fixed effects. In this model, relevant group comparisons were tested with a t test. Prior to the analysis, a log transformation was applied to the measurements of concentration. The analysis was executed in the SAS System 8.02 (Cary, NC, USA), using the MIXED procedure.
For the multiplex bead assay, Mouse FGF-2-basic (cat no. LMG0021), VEGF (cat no. LMG0111), and PDGF-BB-BB (cat no. LMG0041) antibody bead kits from Biosource (Stockholm, Sweden) were used according to instructions from the manufacturer. The analysis was performed using the Luminex 100 system (Austin, TX, USA).
Proliferation HUVEC
Human umbilical vein endothelial cells were seeded in ninety-six–well plates at 103 cells per well, in assay medium (NCDB131 medium [Invitrogen] containing 10mM L-glutamine, 2% fetal calf serum, 50 U/mL penicillin, 50 µg/mL streptomycin, 3 µg/mL heparin, and 1 µg/mL hydrocortisone). The assay medium also contained the test compounds rosiglitazone or tesaglitazar (0, 0.08, 0.82, 2.5, 7.4, 22.2, 67, or 200 µM final concentration) and VEGF-A (Invitrogen; 0 or 4 ng/mL final concentration).
Cells were cultured for three days, and then BrdU labeling reagent (Roche) was added to each well. After a further twenty-four hours in culture, cells were washed and stained for BrdU and for the Hoechst dye, according to the manufacturer’s instructions (Invitrogen). Images were taken from each well using a Cellomics Arrayscan II HCS reader (Thermo Fisher Scientific, Waltham, USA), and numbers of viable cells (positive Hoechst staining) and proliferating viable cells (positive Hoechst and BrdU staining) were determined for each well using Cellomics' Target Activation BioApplication software module v2.0. Statistical analysis, to determine significant compound-related effects, was performed using a two-sample, two-sided t test.
Growth Factor Analyses in Clinical Studies
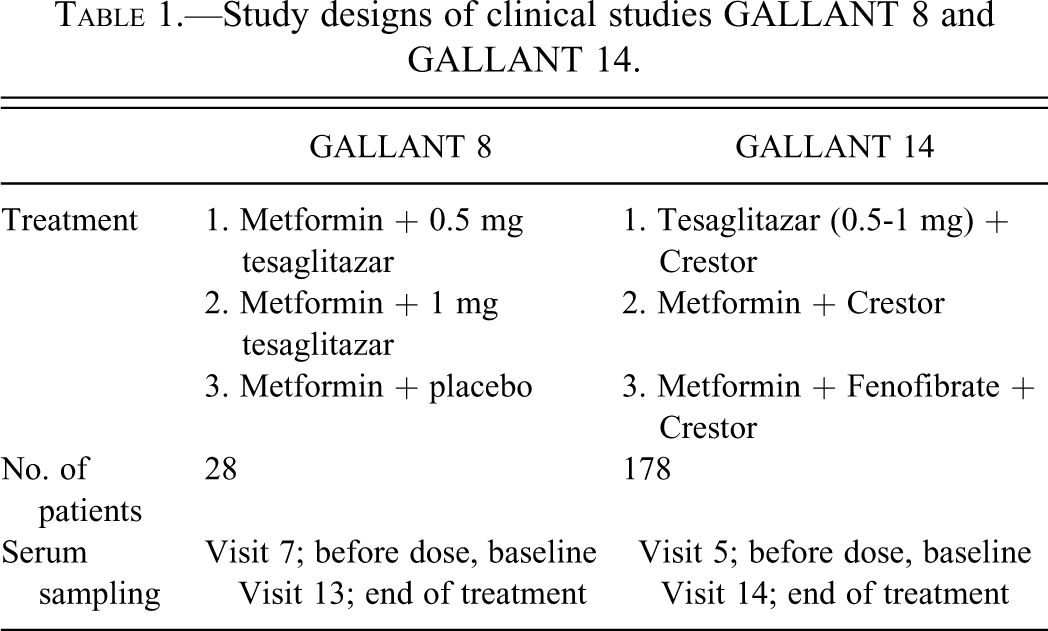
Analyses of growth factors were performed in a subset of patients participating in two clinical trials, GALLANT 8 and GALLANT 14. Both studies were twenty-four–week randomized, double-blind, parallel-group, multicenter studies (Table 1 ) and were performed in accordance with the ethical principles of the Declaration of Helsinki. An appropriate Institutional Review Board or ethical committee at each participating institution approved the study protocol. Before trial participation, all patients provided written informed consent. Additional study information (GALLANT 8 and GALLANT 14) is available from the clinical trials Web site: http://www.clinicaltrials.gov. The enzyme-linked immunosorbent assay (ELISA) from R&D Systems, UK, for human VEGF (range 31.2–2,000 pg/mL), human PDGF-BB (range 31.2–2,000 pg/mL), human HGF (range 125–8,000 pg/mL), and human FGF basic HS (range 1–64 pg/mL) were used. The assays were performed according to descriptions from the manufacturer. Plates were measured in a SpectraMax 250 (Molecular Devices, Sunnyvale, CA, USA) with software SOFTmax PRO, version 3.0 (Molecular Devices). Serum concentrations detected as “under detection limit” were set to the lowest detectable value according to the specification of the specific assay.
Study designs of clinical studies GALLANT 8 and GALLANT 14.
To make the linear model more reasonable and to obtain results on a scale more suitable for interpretation, all data were exposed to a logarithmic transformation before analysis to reduce skewness and heterogeneity of variances. After taking the antilog, comparisons were presented as relative differences. The statistical analysis was based on a linear mixed-effects model including treatment group, visit, and the interaction between treatment group and visit as fixed effects, and subject and the interaction between subject and visit as random effect (i.e., a repeated-measures model with extra covariance for observations at the same visit). In this model, relevant group comparisons were tested with a t test. Results are estimates of differences, a 95% confidence interval for the estimate, and a p value for the corresponding test. P values correspond to two-sided tests and are not corrected for multiplicity.
Results
Carcinogenicity Study
General Investigations
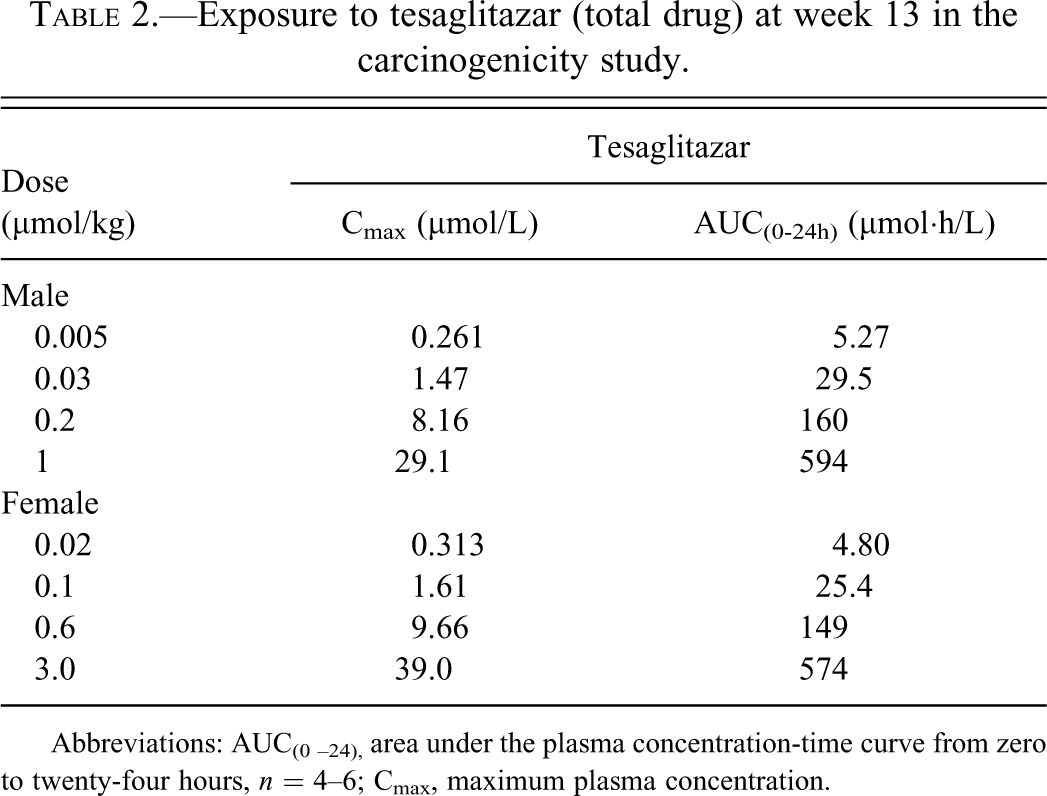
The mean concentrations of tesaglitazar, Cmax, and the area under the plasma concentration-time curves, AUC(0-24h), at week 13 are summarized in Table 2 . There was an indication that the exposure expressed as AUC(0-24h) and Cmax increased less than in proportion to the increase in dose. The AUC(0-24h) as well as the Cmax were similar at weeks 13 and 53 (data not shown), and there was no difference in exposure between male and female hamsters. Cmax of tesaglitazar appeared generally within three hours after administration.
Exposure to tesaglitazar (total drug) at week 13 in the carcinogenicity study.
Abbreviations: AUC(0 –24), area under the plasma concentration-time curve from zero to twenty-four hours, n = 4–6; Cmax, maximum plasma concentration.
There was no mortality and there were no clinical signs that could be attributed to treatment with tesaglitazar. In total, the mortality was 44% of males and 75% of females in the vehicle group, and between 26% and 48% of males and between 66% and 76% of females in the treated groups.
Treatment-related microscopic changes observed in males included centrilobular hepatocellular hypertrophy, decreased incidence of biliary cysts at 1 µmol/kg, increased pigment deposits in the liver, and porphyrin in the Harderian glands at 0.2 and 1 µmol/kg. The only pathological effect observed in females was an increased incidence of pigment deposits in the liver at the highest dose level, 3.0 µmol/kg.
Neoplastic Findings
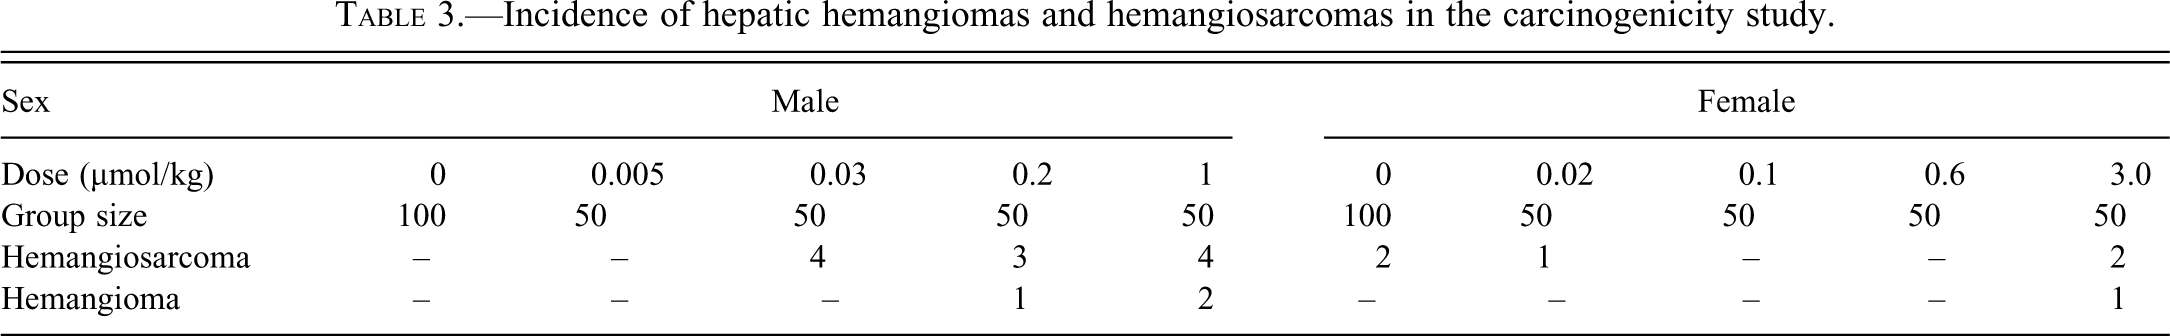
The only neoplastic findings of equivocal relation to treatment were hemangiomas and hemangiosarcomas in the liver of males administered 0.03, 0.2, or 1 µmol/kg (Table 3 ). The incidences were similar in all treated groups, 2%–6% for hemangiomas and 6%–8% for hemangiosarcomas, respectively, and 0% in the vehicle group. The earliest tumor was detected after 60 weeks, but most tumors were found between weeks 80 and 104. In contrast to male hamsters, in females the incidence of hemangiosarcomas was 2% in the vehicle group (2/100) and 4% (2/50) in the highest dose group (Table 3).
Incidence of hepatic hemangiomas and hemangiosarcomas in the carcinogenicity study.
Investigative Study
General Investigations
The exposure of tesaglitazar was similar to the carcinogenicity study at the selected doses
An increased mortality, which was most pronounced in the vehicle group, was observed after 40 weeks. After 60 weeks, there was 62%, 52%, and 35% mortality in the vehicle, 0.03 µmol/kg, and 1 µmol/kg dose groups, respectively. At this point in time, an extra vehicle group of 198 male hamsters was initiated. Remaining animals in the main groups were sacrificed at 95 weeks for the vehicle group in order to have at least fifty animals at scheduled necropsy, and at 104 weeks for the 0.03 and 1 µmol/kg dose groups. At terminal necropsy, the mortality was 79%, 75%, and 72% in the vehicle, 0.03 µmol/kg, and 1 µmol/kg dose groups, respectively, whereas the mortality in the extra vehicle group was 31% at 104 weeks. Treatment with tesaglitazar did not cause clinical signs, nodules, or masses that were considered to be related to the test item.
Microscopic Pathology
Weeks 1 to 4
Centrilobular hypertrophy was present in seven of ten animals at one week, in nine of ten animals at two weeks, in ten of ten at three weeks, and ten of ten animals at four weeks in hamsters dosed with 1 µmol/kg. This finding was associated with glycogen depletion from week 1 and reduced cytoplasmic basophilia at three and four weeks.
Bile duct hyperplasia was apparent in three, four, two, and eight hamsters dosed with 1 µmol/kg at one, two, three, and four weeks, respectively.
Midzonal fat vacuolation was noted in five of ten and seven of ten animals dosed with 1 µmol/kg at one and two weeks and either midzonal or periportal fat in five of ten animals at three weeks. Periportal fat vacuolation was present in four of ten hamsters at four weeks.
Weeks 12, 26, 38, and 52
Hepatocellular hypertrophy, midzonal fat vacuolation, reduced glycogen, and reduced cytoplasmic basophilia was noted in ten of ten animals at twelve weeks dosed with 1 µmol/kg. At this dose level, midzonal fat vacuolation was evident in fourteen of sixteen animals at twenty-six weeks, and reduced glycogen was present in sixteen of sixteen animals, although similar glycogen depletion was seen in eight of sixteen control hamsters. Furthermore, cytoplasmic basophilia was reduced in sixteen of sixteen animals, whereas hepatocellular hypertrophy was less apparent and was only recorded in seven of sixteen hamsters. Similar changes were seen at thirty-eight weeks in animals dosed 1 µmol/kg, and there was also diffuse pigmentation in hepatocytes in four of five animals. No special staining was performed to characterize the pigment; however, based on its appearance on HE-stained slides, it was consistent with lipofuscin.
Diffuse hepatocellular pigment was found in twelve of fourteen hamsters dosed with 1 µmol/kg at fifty-two weeks; midzonal fat vacuolation in thirteen of fourteen animals, and reduced glycogen in thirteen of fourteen animals. In addition, there was an increase in the incidence of pigmented macrophages three of fourteen and bile duct hyperplasia six of fourteen in the 1 µmol/kg dose group. The vehicle animals did not display any of these findings.
The intestines of sixty-one animals found dead or killed around fifty-two weeks were also examined. The aim was to investigate the cause of the increased mortality. Significant histopathological changes were confined to the colon and cecum. Atypical hyperplasia with chronic inflammation was seen in the cecum of ten of seventeen, three of twenty-two, and eight of twenty-two animals dosed with vehicle, 0.03 and 1 µmol/kg respectively. In general, the finding was classified as minimal to moderate. Atypical hyperplasia with chronic inflammation was also seen in the colon of one control animal and two animals in the highest dose group.
Week 95/104
A dose-related increase in diffuse hepatocellular pigmentation, consistent with lipofuscin, was seen in animals dosed with 0.03 and 1 µmol/kg tesaglitazar. This finding was associated with a dose-related increase in focal accumulations of pigmented macrophages and an increase in focal peribiliary inflammation and bile duct hyperplasia. Regenerative hyperplasia was seen in five of sixty-three (8%) of hamsters dosed 0.03 µmol/kg and in twenty-six of seventy-five (35%) of hamsters dosed 1 µmol/kg. This change, together with the peribiliary inflammation and bile duct hyperplasia, often caused distortion of the normal hepatic architecture, which gave the liver a nodular appearance. There was also an increased frequency of sinusoidal dilation/telangectasis (fifteen of seventy-five) and in foci of cellular alteration (eight of seventy-five) in the highest dose group.
Neoplastic Findings
A number of tumors were recorded at sites other than the liver. Although other sites were not systematically sampled, the number and distribution did not indicate a treatment-related effect (data not shown). Table 4 shows the incidence of tumors detected in the liver.
Incidence of hepatic neoplastic findings in the two-year investigative study.
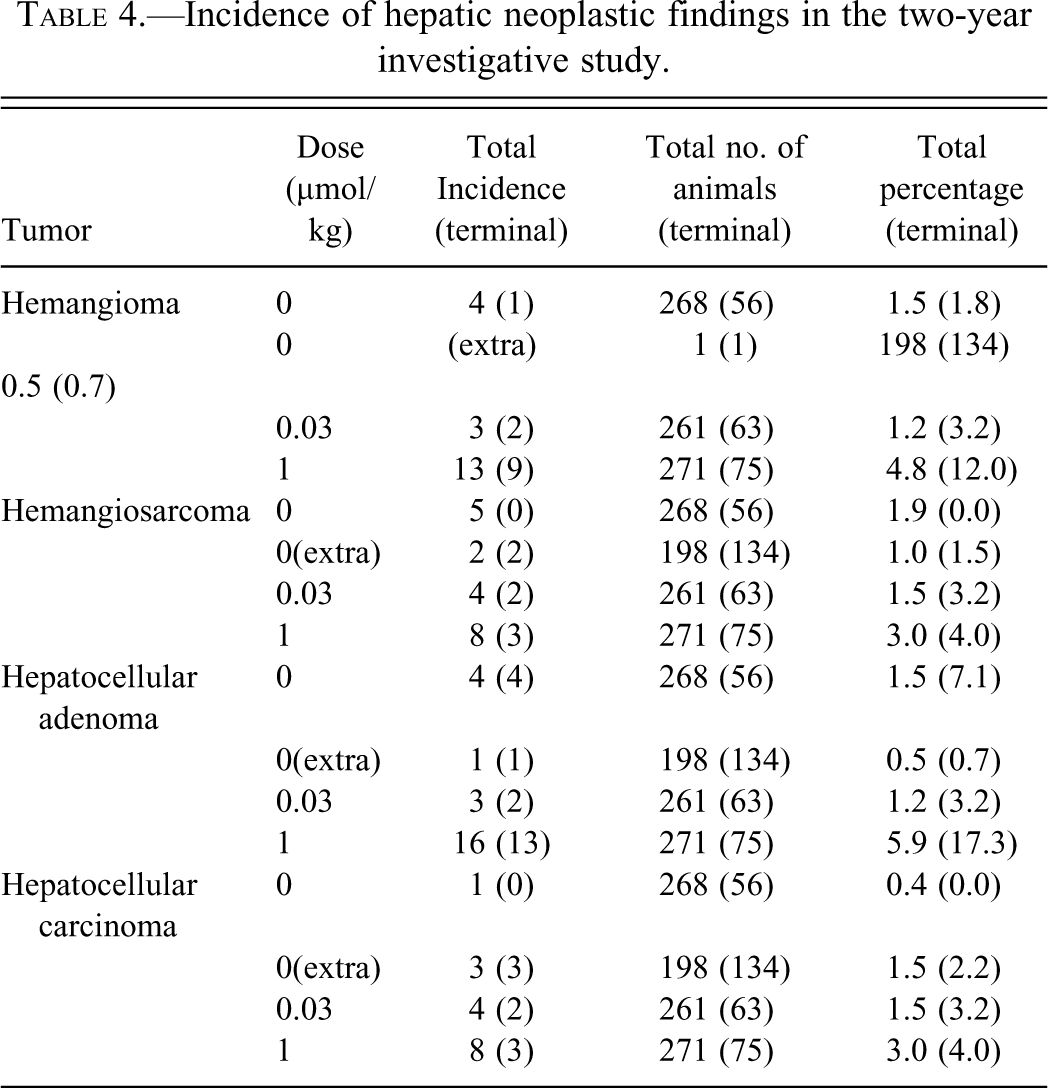
Hemangiosarcoma was recorded in 1.9%, 1.5%, and 3.0% of animals dosed with vehicle, 0.03 µmol/kg, and 1 µmol/kg, respectively. Hemangiosarcoma was recorded in 1% in the additional vehicle group. A trend test stratified for cause of death showed no significant dose-related trend (Peto: p = .40). All hemangiosarcomas in the vehicle group were found in decedent animals. Five of the eight hemangiosarcomas in highest dose group were in the decedent group and three in animals killed at term at 104 weeks. As the latter were well developed, it is assumed that these tumors would have been noted if the hamsters had been killed at 95 weeks. The two hemangiosarcomas found in the additional vehicle group were found in animals killed at 104 weeks. The number of hemangiomas found in the highest dose group was 4.8% compared to 1.5% found the vehicle group (p = 0.03: Peto trend test stratified for cause of death). However, the number in decedent animals was comparable, 1.4% in the vehicle group and 2% in the highest dose group. Nine of the thirteen hemangiomas in the highest dose group were found at term at 104 weeks (12% as compared to 1.8% in the controls and 3.2% in the intermediate dose group). Hemangioma was found in only one animal killed at 104 weeks in the additional vehicle group. Hepatocellular carcinoma was found in 0.4%, 1.5%, and 3.0% animals dosed vehicle, 0.03 µmol/kg, and 1 µmol/kg, respectively (p = .02: Peto trend test stratified by cause of death). Among decedents, the frequency was 0.5%, 1%, and 2.5%, respectively. The frequency of hepatocellular carcinoma in the highest dose group at term was 4% and 3.2% in the group given 0.03 µmol/kg. Hepatocellular carcinoma occurred in 1.5% animals in the additional vehicle group and was found only in animals killed at 104 weeks. Four hepatocellular adenomas were found in the vehicle group, three in the group dosed 0.03 µmol/kg, and sixteen in the highest dose group (p = 0.006: Peto trend test stratified for cause of death). However, the majority, in the highest dose group (thirteen), were found at the terminal kill at 104 weeks.
BrdU Labeling
In all groups including vehicle, varying degrees of BrdU labeling were present in the hepatocyte nuclei (Fig. 1a and 1b). No difference in BrdU labeling of hepatocytes was observed between the three groups at the one and two-week time points. In hamsters treated with tesaglitazar at the 1 µmol/kg dose level, there was a significant increase in BrdU-positive hepatocytes at week 3, which remained at all later time points up to 52 weeks. There was no treatment-related increase in BrdU labeling of hepatocytes at the lower dose level (0.03 µmol/kg) at any time point. The results are summarized in Figure 2 . BrdU labeling of endothelial cell nuclei occurred less frequently as compared with hepatocytes. Occasional to scattered BrdU-positive endothelial cells were present in vehicle- as well as drug-treated hamsters (Fig. 1c and 1d). No significant difference between the three groups was observed except for the four-week time point, when the high-dose group (1 µmol/kg) showed a slight increase in the number of BrdU-positive endothelial cells. BrdU-positive endothelial cells in hamsters treated at the 1 µmol/kg dose level tended to be localized along the sinusoids in areas with BrdU-positive hepatocytes (not shown), and in areas with hypertrophic, BrdU-negative hepatocytes (Figure 1d). At the fifty-two-week time point, the controls showed a significantly increased number of BrdU-positive endothelial cells as compared to the groups treated with tesaglitazar. There was no treatment-related increase in BrdU labeling of endothelial cells at the lower dose level (0.03 µmol/kg) at any time point. The results are summarized in Fig. 3 . Correlation analysis including all hamsters regardless of treatment group showed a significant correlation between the BrdU score in hepatocytes and the BrdU score in endothelial cells, when all time points up to fifty-two weeks were combined (p = .03, r = 0.1475).
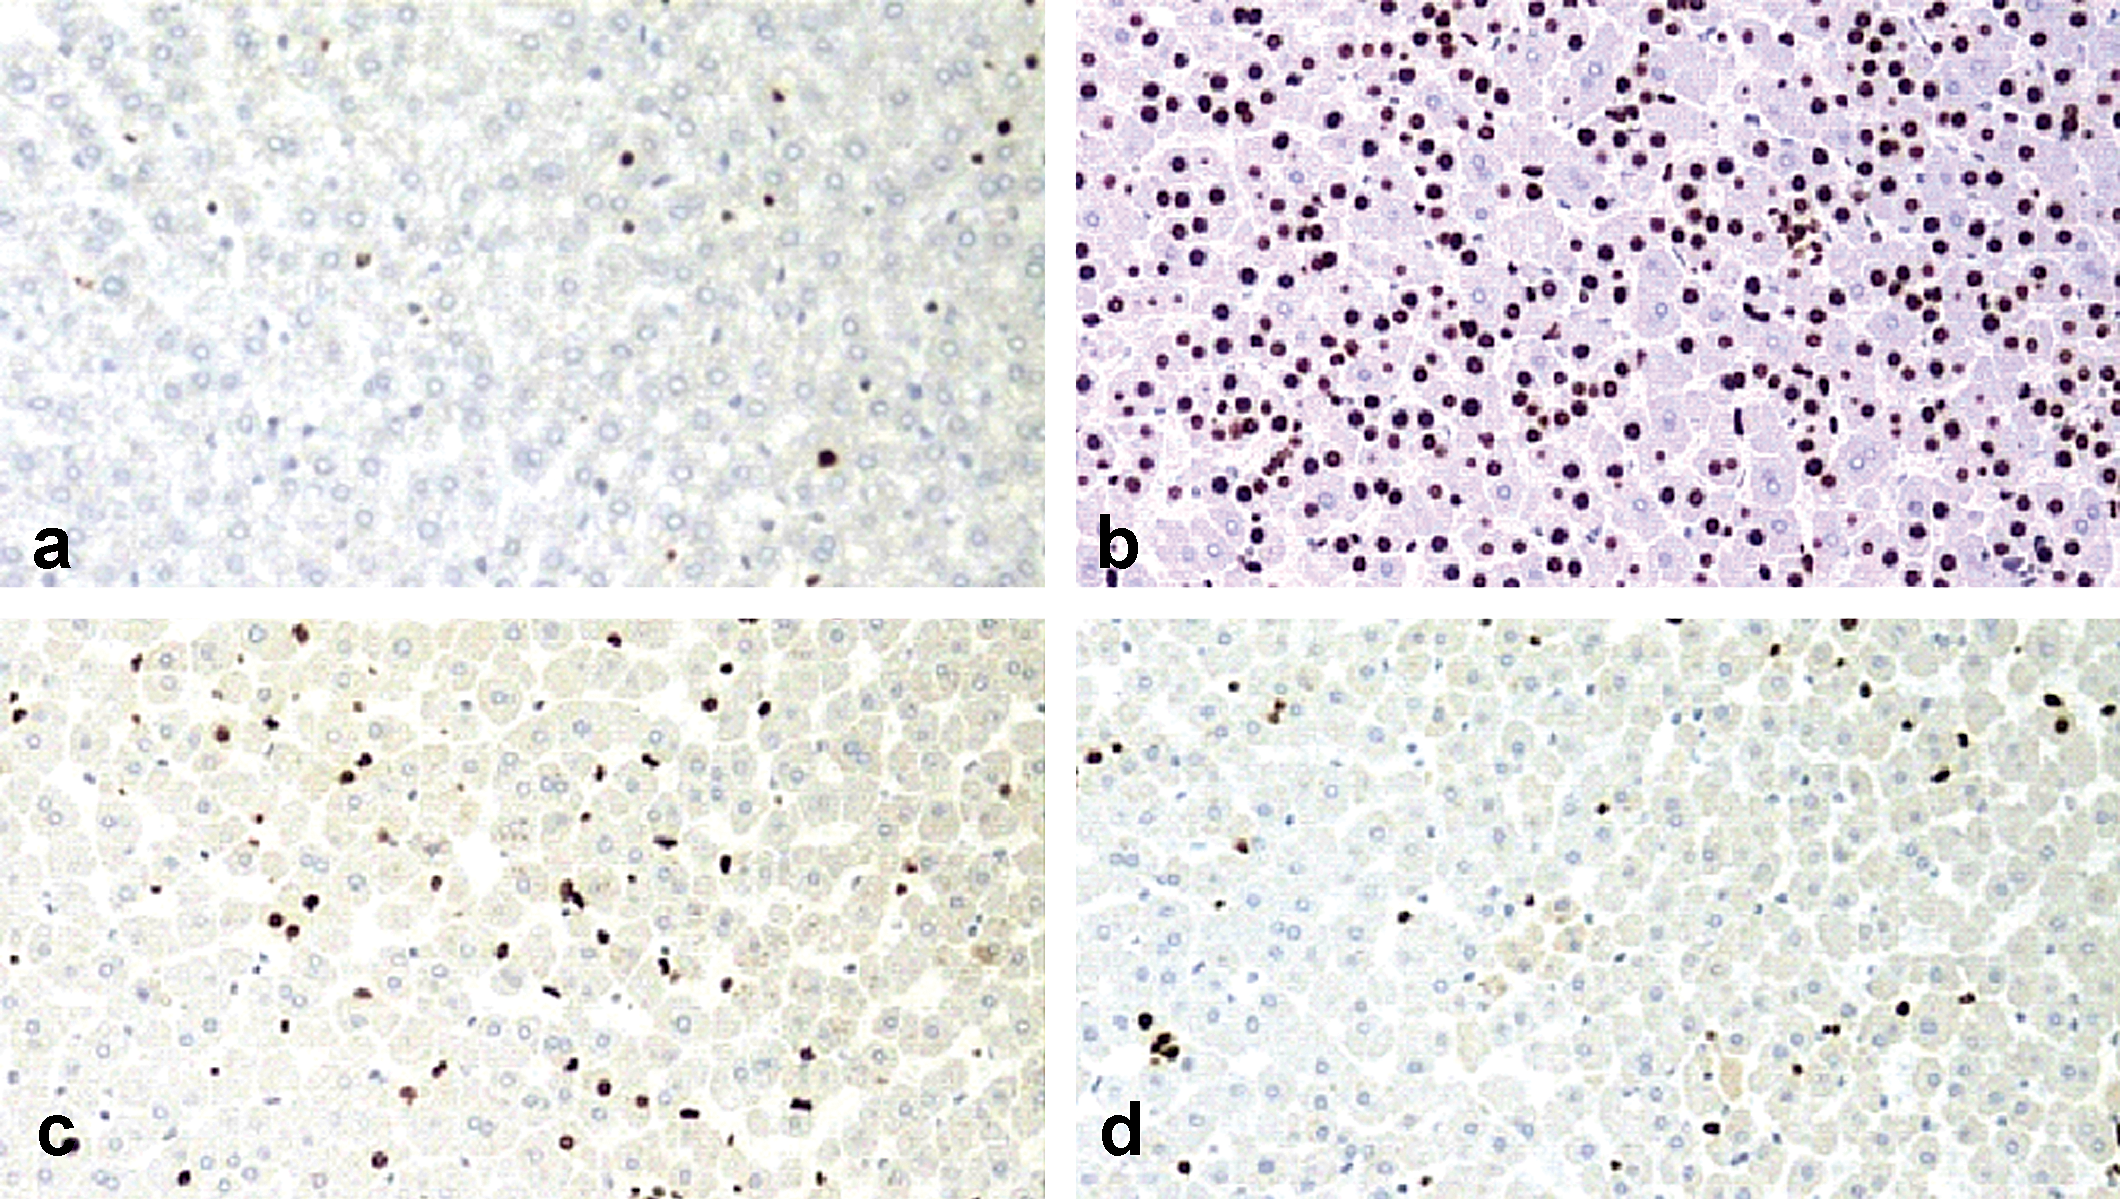
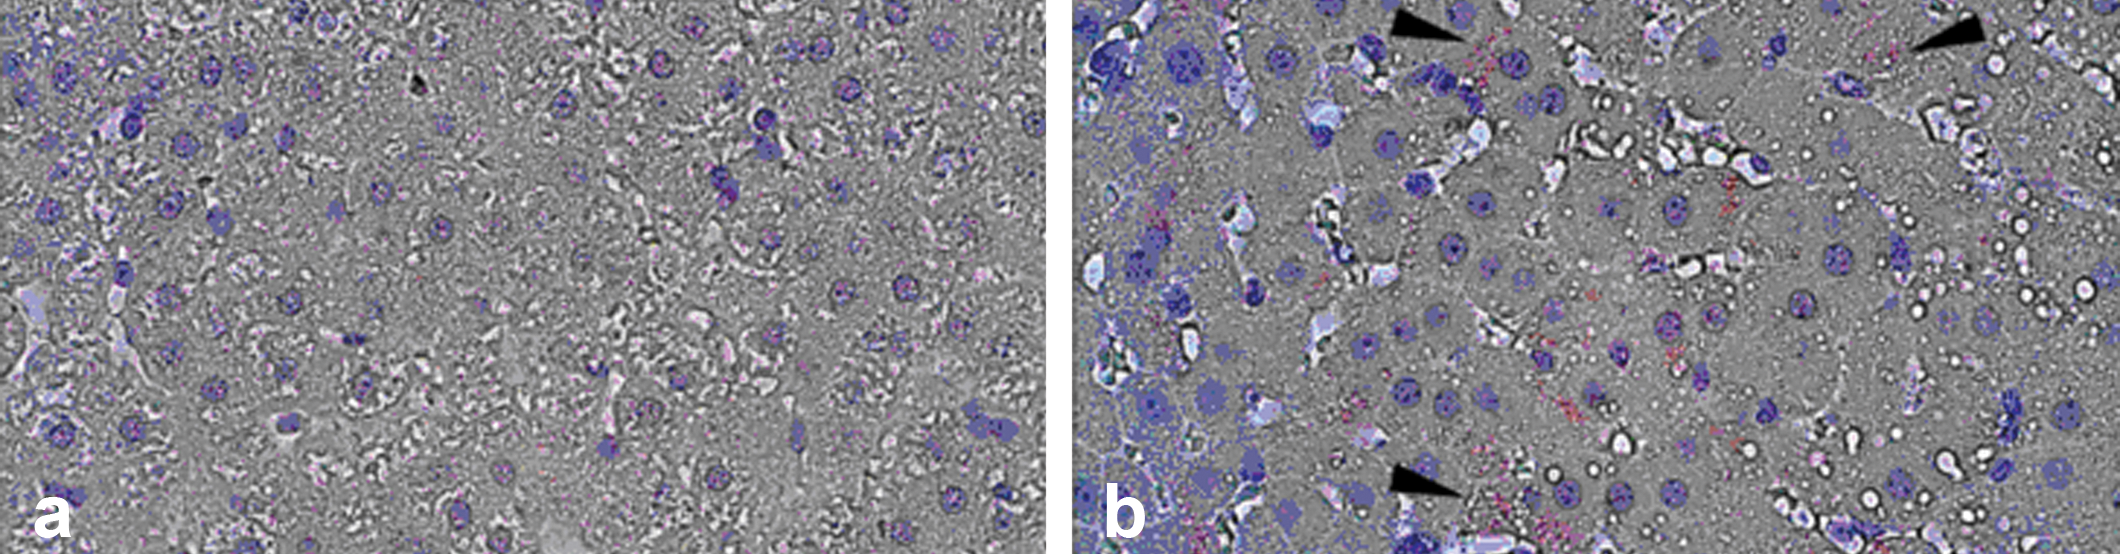
BrdU staining patterns of hepatocytes and endothelial cells in hamster liver. Occasional hepatocytes show positive nuclear BrdU labeling in a control hamster at three weeks (a). In a hamster treated with tesaglitazar for three weeks at the 1 µmol/kg dose level, there is a marked increase in BrdU-positive hepatocytes (b). Scattered endothelial cells in the centrilobular area show positive BrdU labeling, grade 2, in a control animal at four weeks (c). The number of BrdU-positive endothelial cells is slightly increased (grade 3) in a hamster treated with tesaglitazar at 1 µmol/kg for four weeks (d). Magnification: ×100.
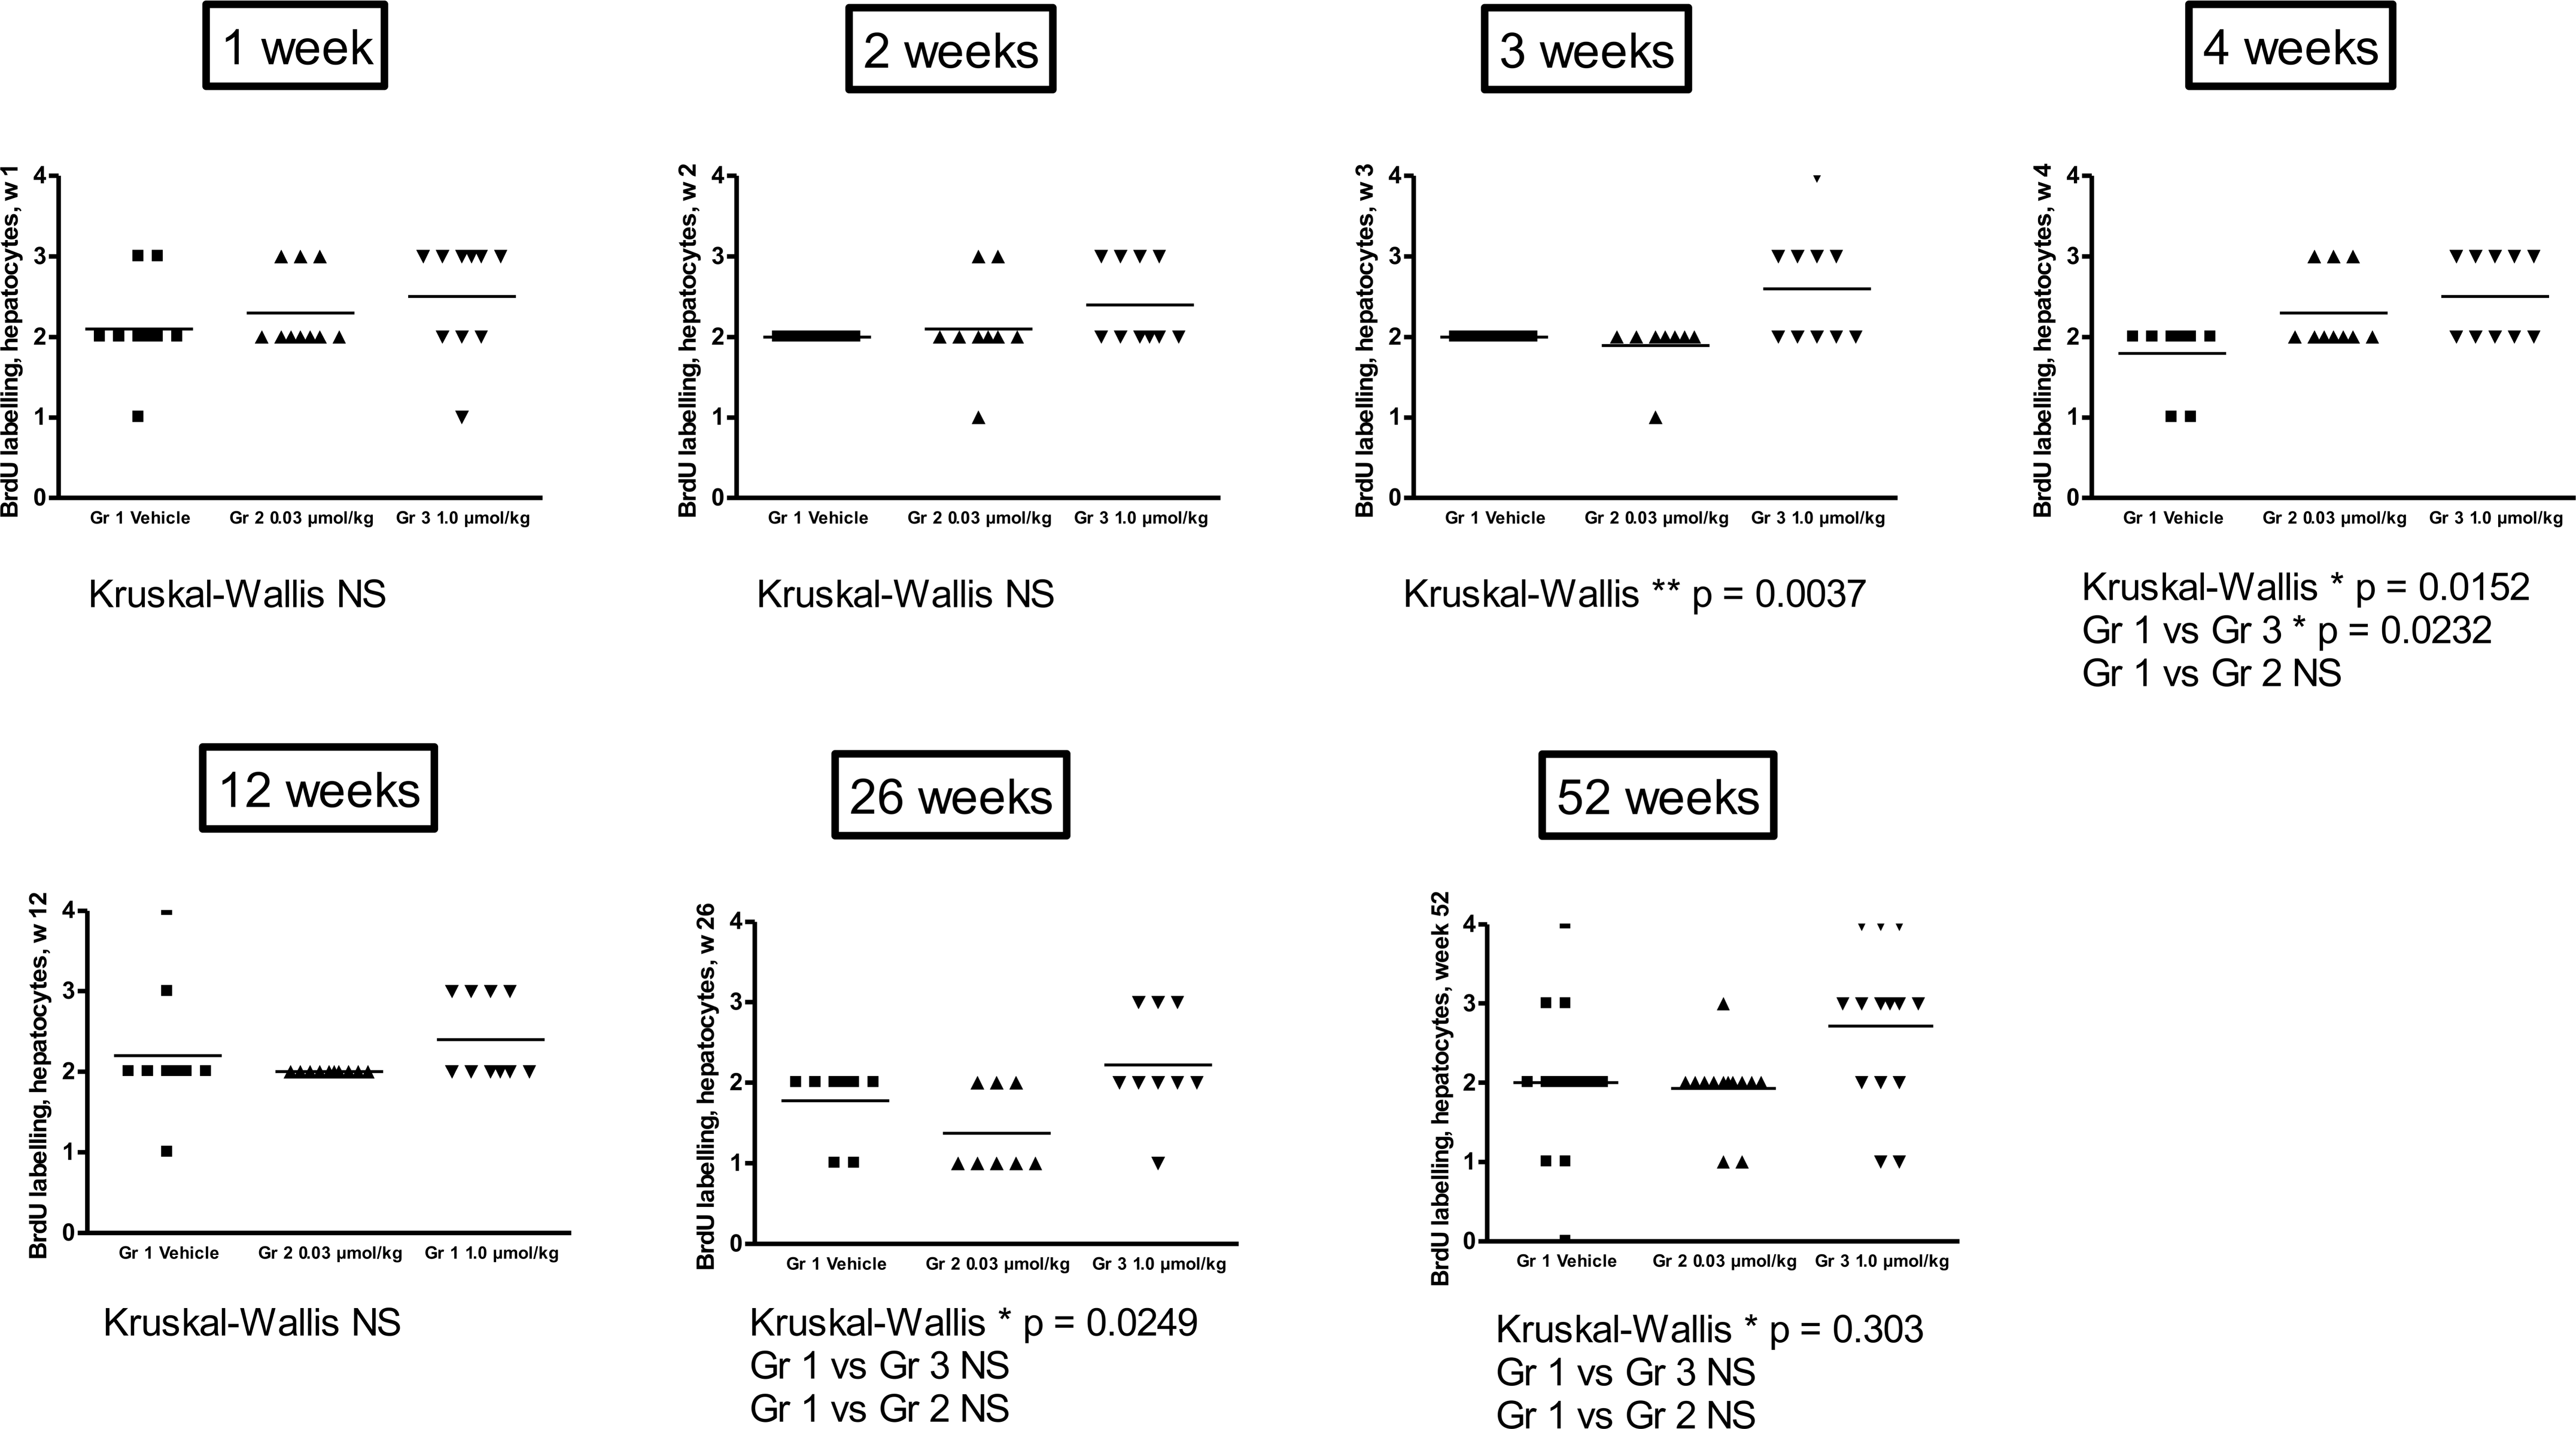
BrdU scoring in hepatocytes. A significant increase in BrdU-positive hepatocytes was observed at week 3, which remained up to fifty-two weeks. There was no treatment-related increase in BrdU labeling of hepatocytes at the lower dose level at any time point.
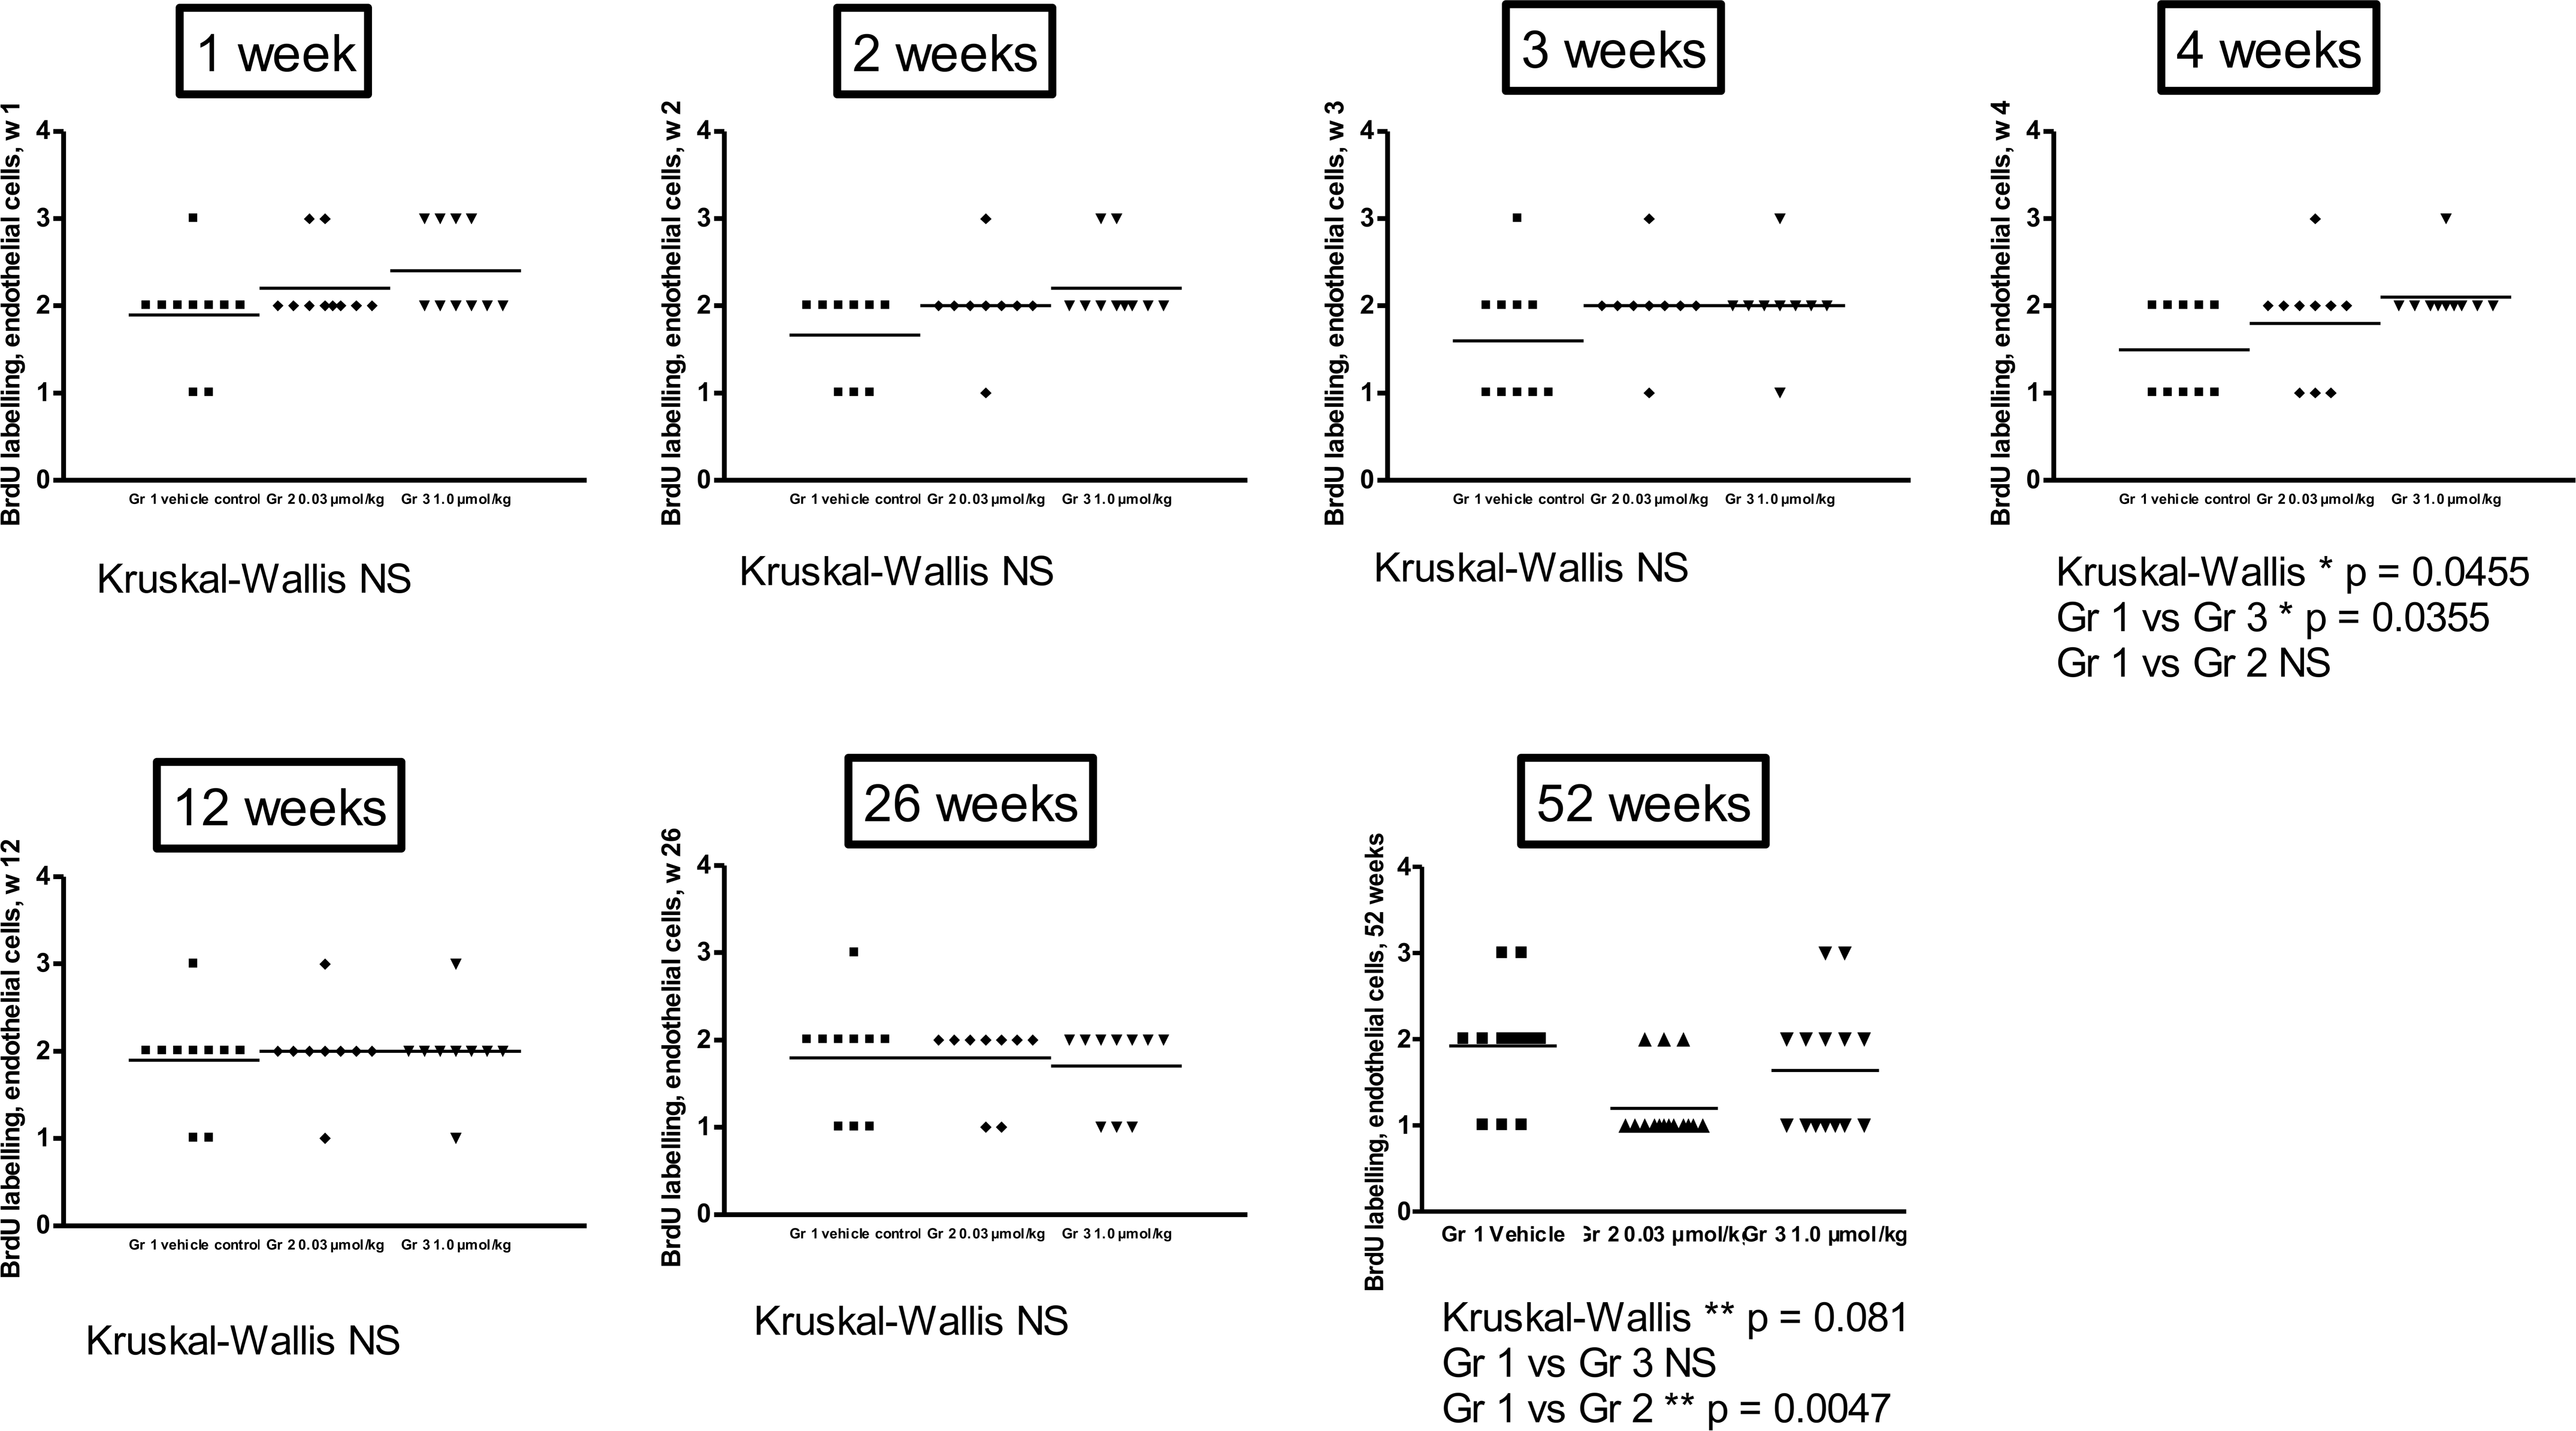
BrdU scoring in endothelial cells. No significant increase between the treated groups compared to controls was observed except for the four-week time point, when the high-dose group (1 µmol/kg) showed a slight increase in the number of BrdU-positive endothelial cells.
VEGF, VEGFR-2, and PPARγ Protein Expression in the Liver
The anti-VEGF antibody stained the cytoplasm of hepatocytes in all dose groups. There was a rather large variation in the number of positively labeled cells within each group, ranging from occasional to numerous, even in the vehicle animals. The majority of VEGF-positive cells were located in the periportal areas (Fig. 4a and 4b). VEGF expression in the liver was significantly increased in the high-dose group (1 µmol/kg) at the three-, four-, twelve-, twenty-six-, thirty-eight-, and fifty-two-week time points, coinciding with increased BrdU labeling of hepatocytes. In the lower dose group (0.03 µmol/kg), VEGF expression was significantly increased only at the twelve-week time point. The anti-VEGFR-2 antibody stained the cytoplasm of hematogenous cells within the sinusoids, as well as sinusoidal endothelial cells (Fig. 4c and 4d). There was also positive staining of cells within inflammatory infiltrates. VEGFR-2 expression was significantly increased in the high-dose group (1 µmol/kg) at the three- and four-week time points. There was no increase in VEGFR-2 expression in the lower dose group (0.03 µmol/kg) at any time point.
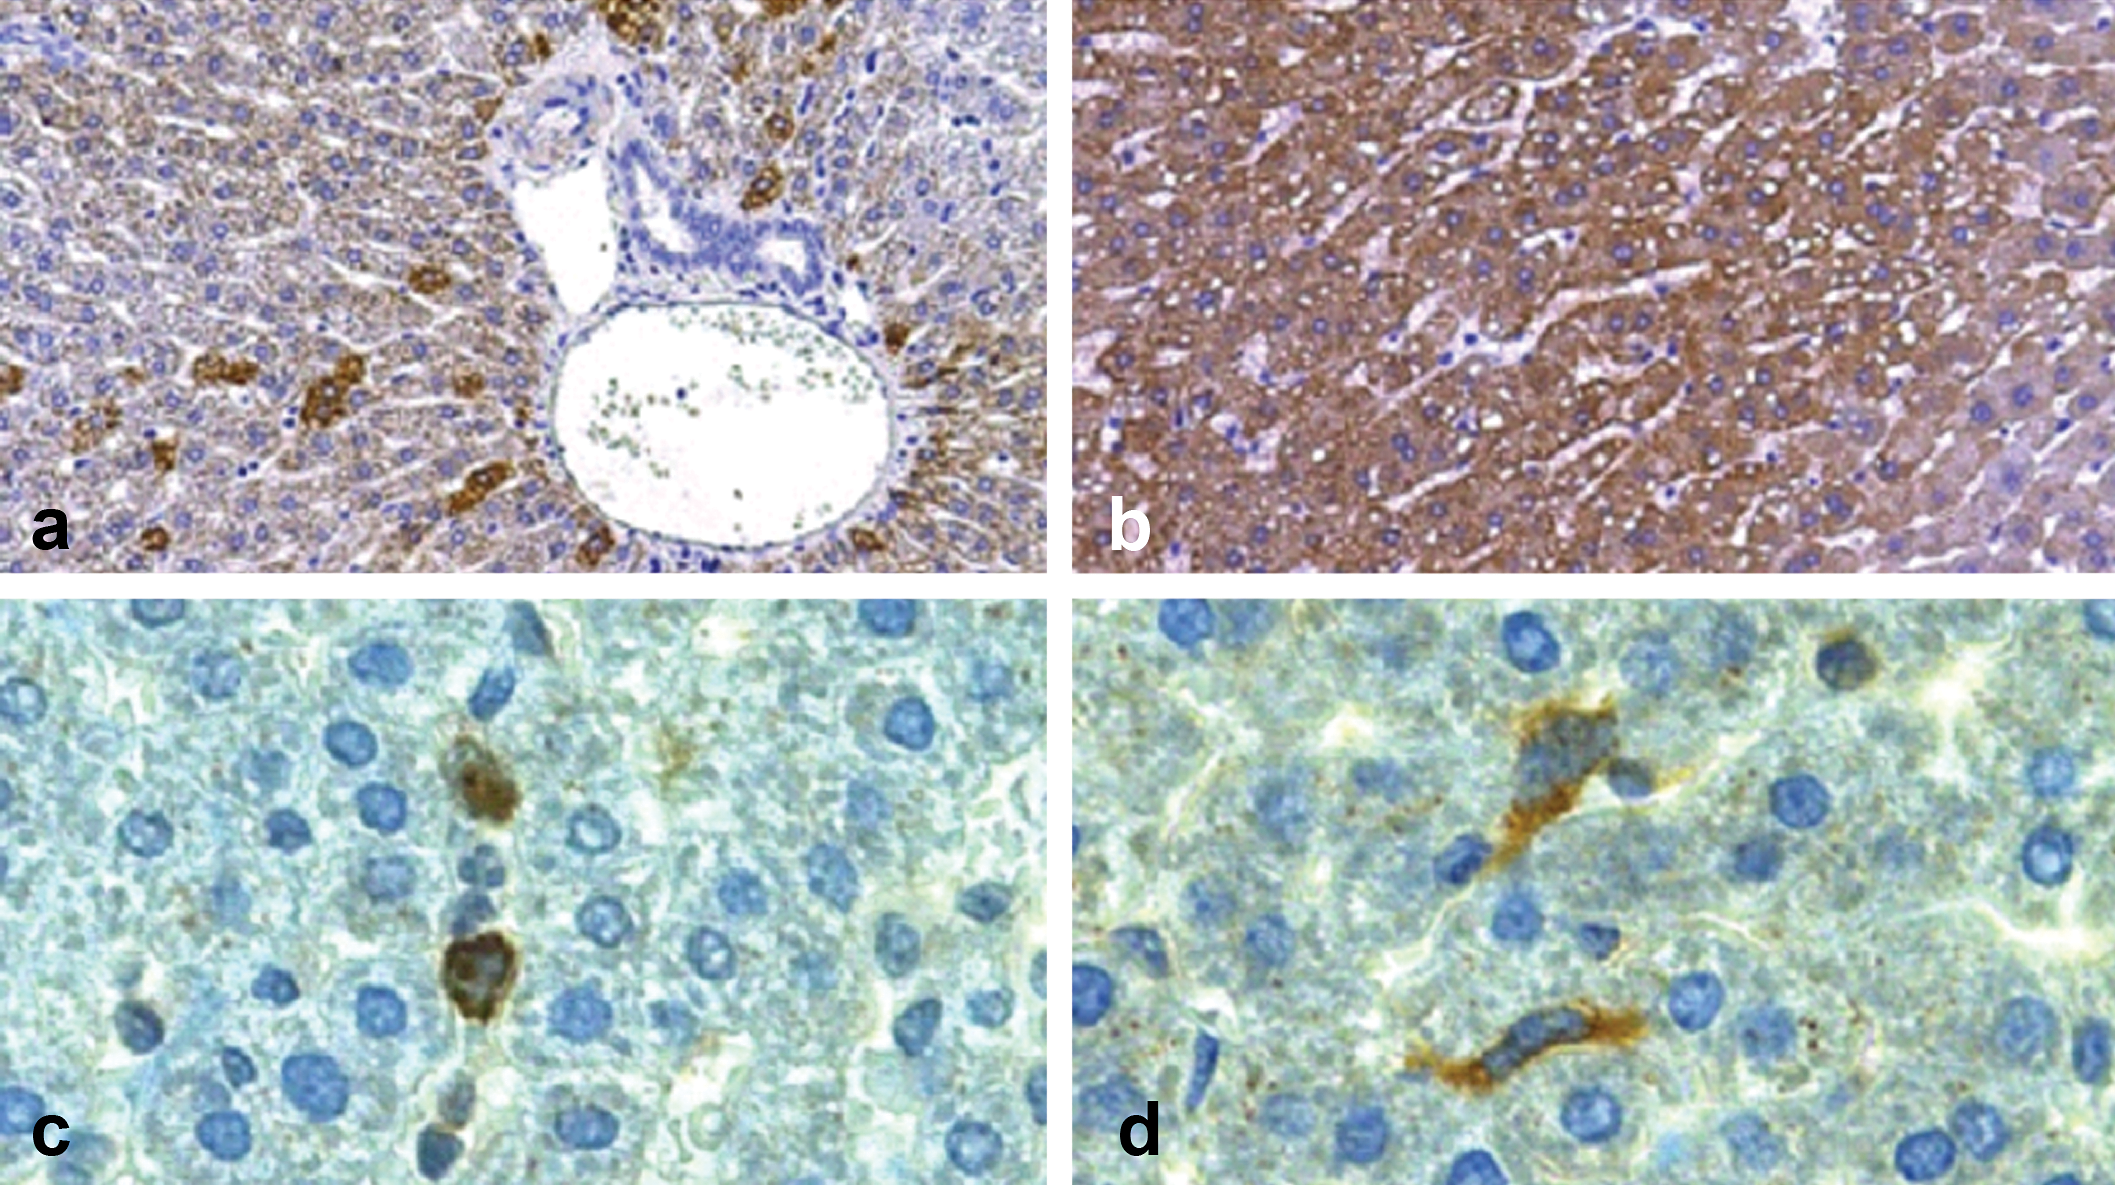
Patterns of VEGF and VEGFR-2 expression in the hamster liver. Moderate numbers (grade 3) of hepatocytes in the periportal area show positive VEGF staining in a control hamster at four weeks (a). Numerous hepatocytes (grade 4) show positive VEGF staining in a hamster treated with tesaglitazar at 1 µmol/kg for four weeks (b). VEGFR-2 expression in a control hamster is present in the cytoplasm of hematogenous sinusoidal cells (c) and in sinusoidal endothelial cells (d). Magnifications: ×100 (a and b), ×400 (c and d).
Immunohistochemistry showed no positive staining for PPARγ protein in hepatocytes or other cell types in the liver of vehicle-treated animals. The highest dose of tesaglitazar (1 µmol/kg) caused a time- and dose-dependent increase of PPARγ staining in the nuclei of hepatocytes (data not shown). The increase in PPARγ was detected after one week, became more pronounced after four weeks of dosing, and the peak level was observed up to week 26.
Hepatic Gene Expression
In situ hybridization was performed to assess VEGF gene expression in the liver to confirm the results from antibody staining. The signal was restricted to the hepatocytes. No or a very weak signal was detected in the vehicle-treated animals, and no signal was observed in the negative controls (Fig. 5b). The increase in VEGF expression could be the result of a state of hypoxia in the hypertrophic liver, but no sign of hypoxia was observed using hypoxia probes (data not shown). VEGF expression is influenced by hypoxia, but also by hypoglycemia and metabolic stress; therefore, gene expression analyses using PCR were performed on genes of importance in such states, i.e., c-myc, lactate dehydrogenase (LD), and phosphoglycerate kinase (PGK). In the high-dose group (1 µmol/kg), the expression of c-myc was significantly increased several folds at the early time points (two and four weeks, with a mean increase of approximately twelve-fold), followed by a normalization at 12 weeks. At 26, 38, and 104 weeks, the expression was again significantly increased. Lactate dehydrogenase was significantly increased at the early time points of 1, 2, and 4 weeks and normalized at 12 weeks. Phosphoglycerate kinase was significantly increased at 2 and 12 weeks in the high-dose group (Fig. 6a, 6e, and 6f).
In situ hybridization of VEGF-A expression in hepatocytes at four weeks. No VEGF-A mRNA staining was observed in representative control hepatic sections (a). Increased hepatocytic (arrowheads) show VEGF-A mRNA staining in treated hamsters (1 µmol/kg; b).
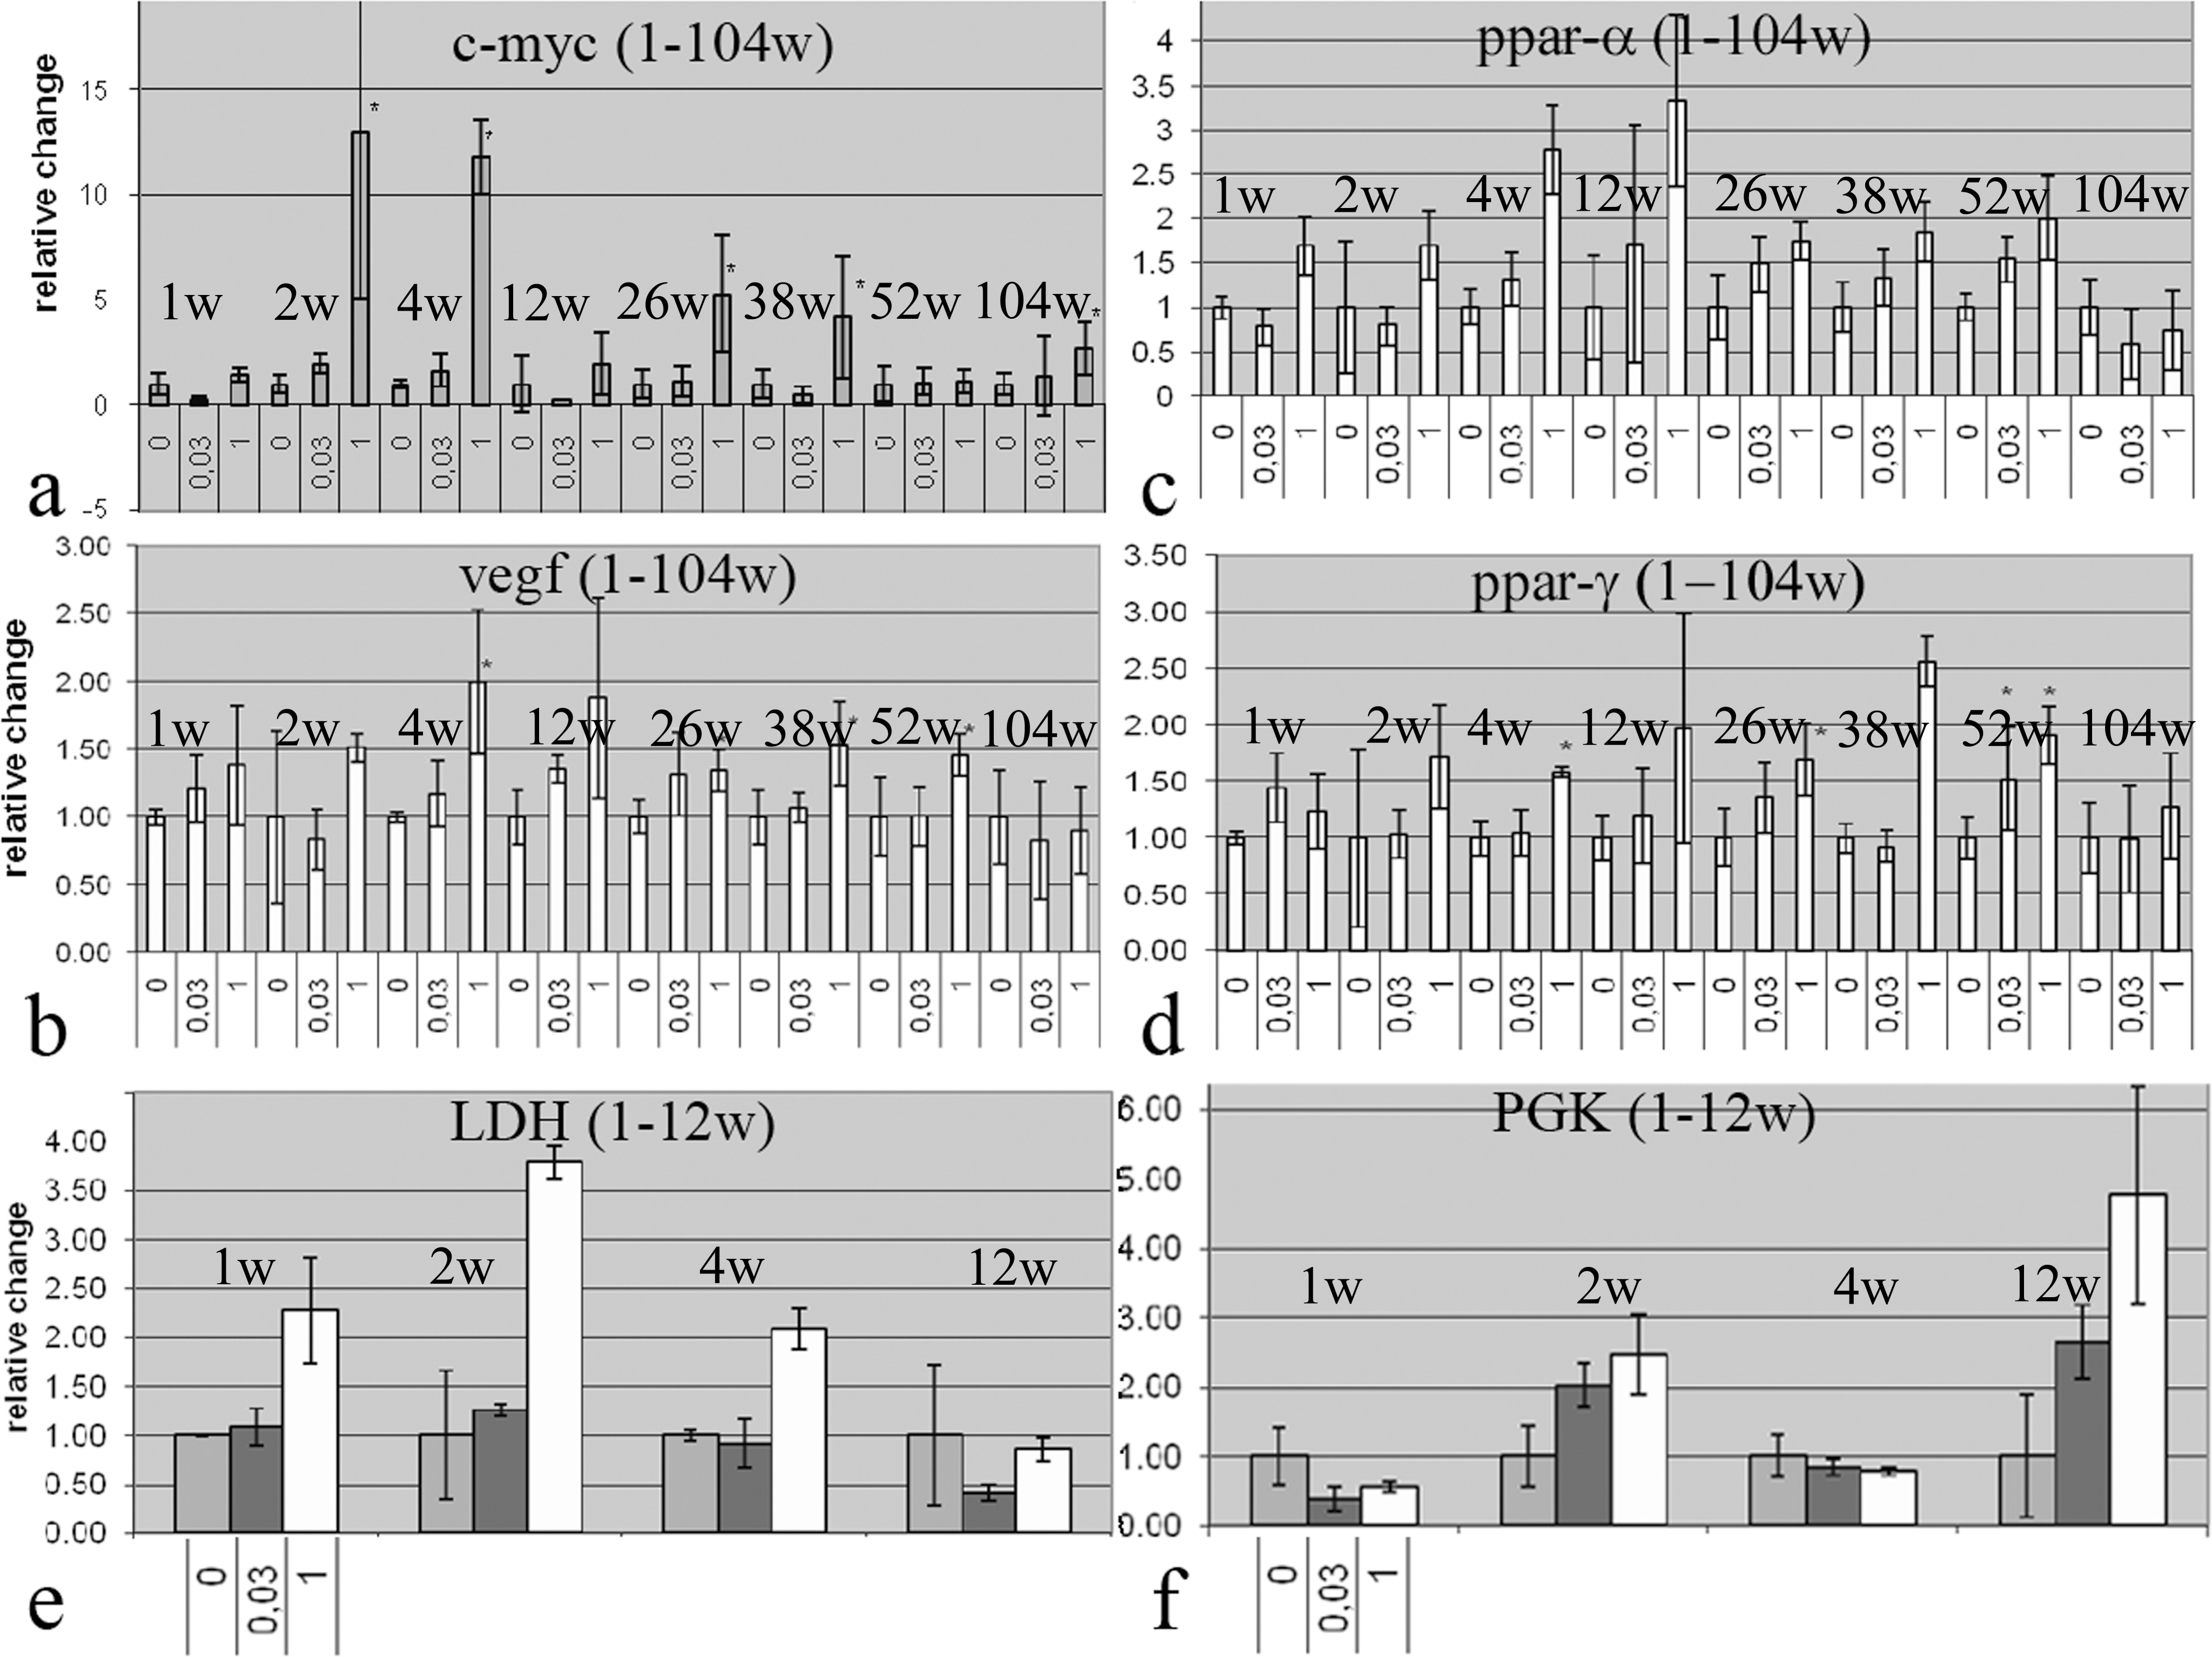
Gene expression analyses of VEGF, cell stress markers, and PPAR. An increase in the cell stress- and hypoxia-induced markers c-myc, LDH, and PGK was observed at early time points in treated animals (1 µmol/kg; a, e, f). Increased VEGF expression was observed at four, twenty-six, thirty-nine, and fifty-two weeks (b). PPARα was significantly increased at one and twelve weeks in the high-dose group, but a trend toward an increase was also observed at the remaining time points. PPARγ was significantly increased only at the four- and fifty-two-week time points, but overall, the variability for this gene was very high and no clear trend could be distinguished (c, d)
Analyses were also performed on PPARα and PPARγ as control genes, since the PPARs upregulate their own expression upon activation. PPARα was significantly increased at one and twelve weeks in the high-dose group, but a trend toward an increase was also observed at the remaining time points. PPARγ was significantly increased only at the four and fifty-two-week time points, but overall, the variability for this gene was very high and no clear trend could be distinguished (Fig. 6c and 6d).
Growth Factor Analyses in Hamster Serum
The analyses of hamster growth factors were based on a presumed cross-reactivity of mouse and human antibodies, and therefore, the measured concentrations may not represent true values. Nevertheless, the analyses allow interpretation of treatment-related changes. A statistically significant increase of VEGF was observed in serum from animals dosed with 1 µmol/kg at weeks 1, 2, 3, 4, 12, 26, and 38 compared to vehicle animals (Fig. 7 ). An increase was also detected at 52 weeks at the 1 µmol/kg dose, but it was not statistically significant compared with the corresponding control. After 104 weeks, there were no significant differences in serum VEGF levels between the groups. The treatment-related effects on serum VEGF observed using ELISA were verified using Luminex multiplex bead assay technology. A set of serum samples from animals terminated at 12 weeks was analyzed by both methods. The levels and treatment effects on VEGF obtained by Luminex were similar to the results obtained using ELISA analysis (data not shown). Individual variability in the levels of FGF-2 and PDGF was high, and no clear treatment-related effects were observed (data not shown).
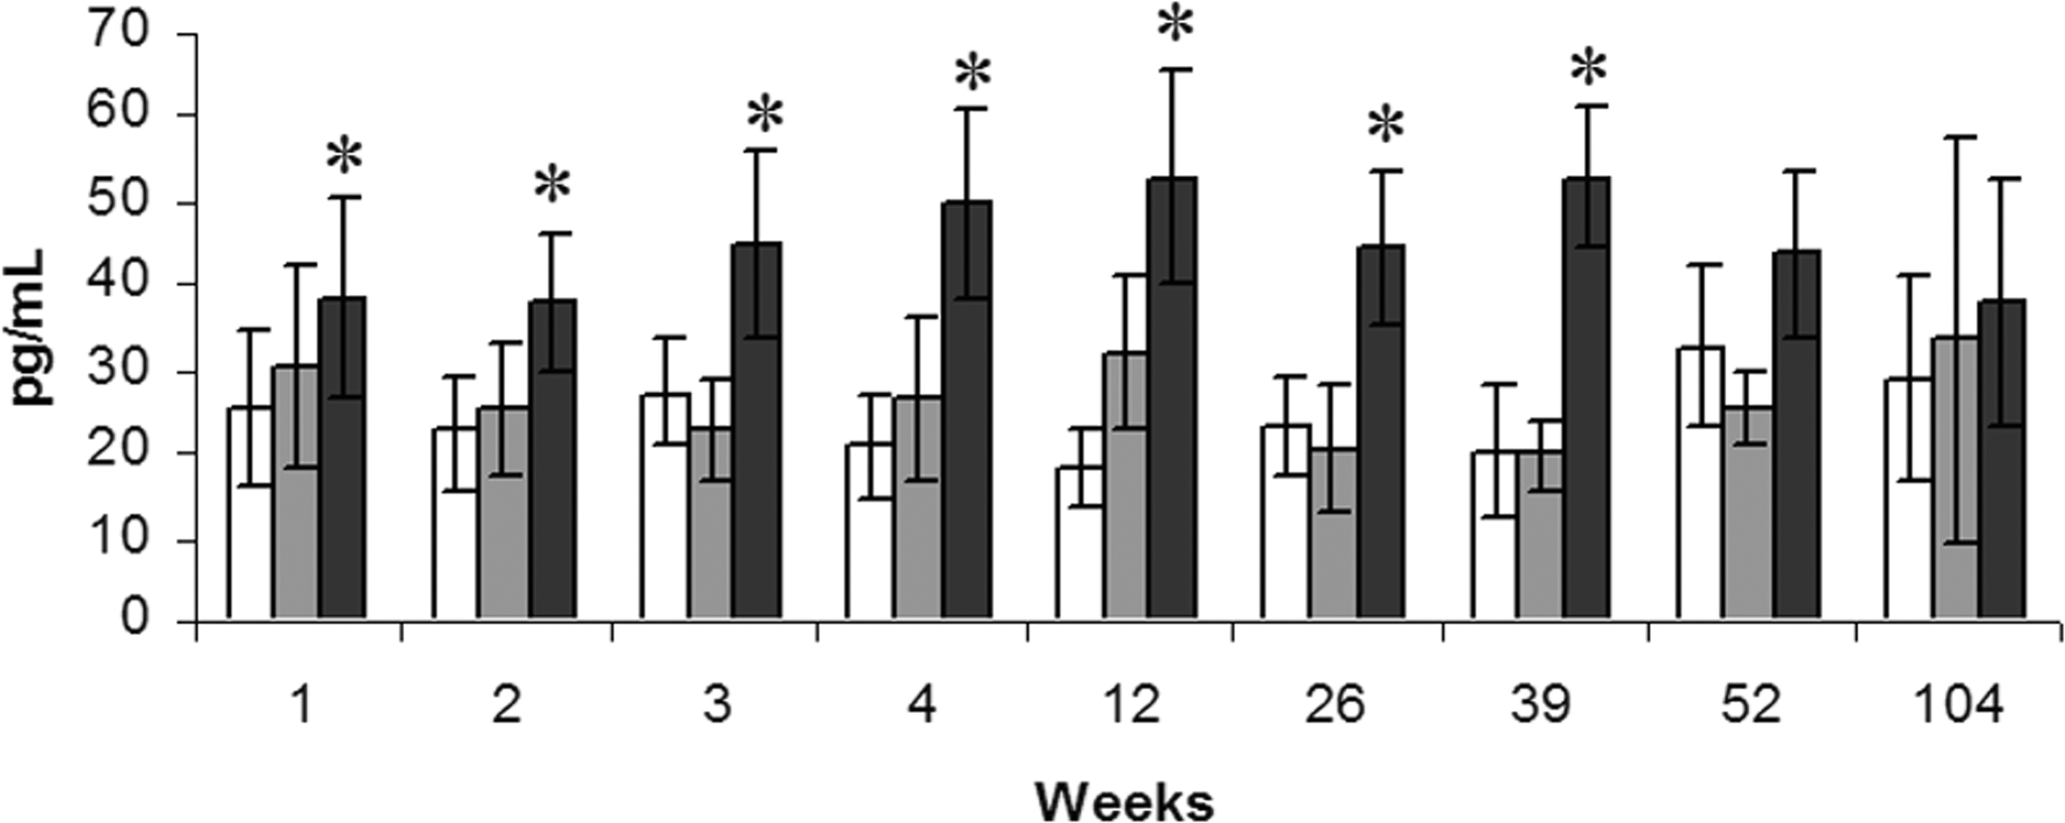
Serum VEGF levels in the hamster. A significant increase in serum VEGF was observed up to and including thirty-nine weeks. Bars from the left; control (no fill), 0.03 µmol/kg (grey), and 1 µmol/kg (black).
Proliferation of HUVEC
To address the hypothesis that tesaglitazar has a direct proliferative effect on endothelial cells, we used HUVECs in an in vitro proliferation assay. As a comparator, rosiglitazone was used, since published data indicate that rosiglitazone has an antiproliferative effect on HUVECs in culture (Artwohl et al. 2005; Hong et al. 2003).
The effect of the compounds on cell proliferation and viability across a concentration range of 0–200 µM was assessed, in both the presence and absence of VEGF, to mimic the effect of local growth factor production in vivo. Typically, VEGF increased the proliferative index by 150%-200% in these experiments. Although detectably cytotoxic at 200 µM, neither compound caused >20% cytotoxicity at 67 µM concentration, as assessed by Hoechst dye staining (data not shown). At concentrations up to and including 67 µM (i.e. subtoxic concentrations), neither rosiglitazone nor tesaglitazar increased the proliferative rate of the HUVECs in culture (data not shown). Indeed, at 0.82, 22.2, and 67 µM concentrations, rosiglitazone showed a modest but statistically significant antiproliferative effect. Tesaglitazar did not cause proliferative changes at any subtoxic concentration.
Growth Factor Analyses in Clinical Studies
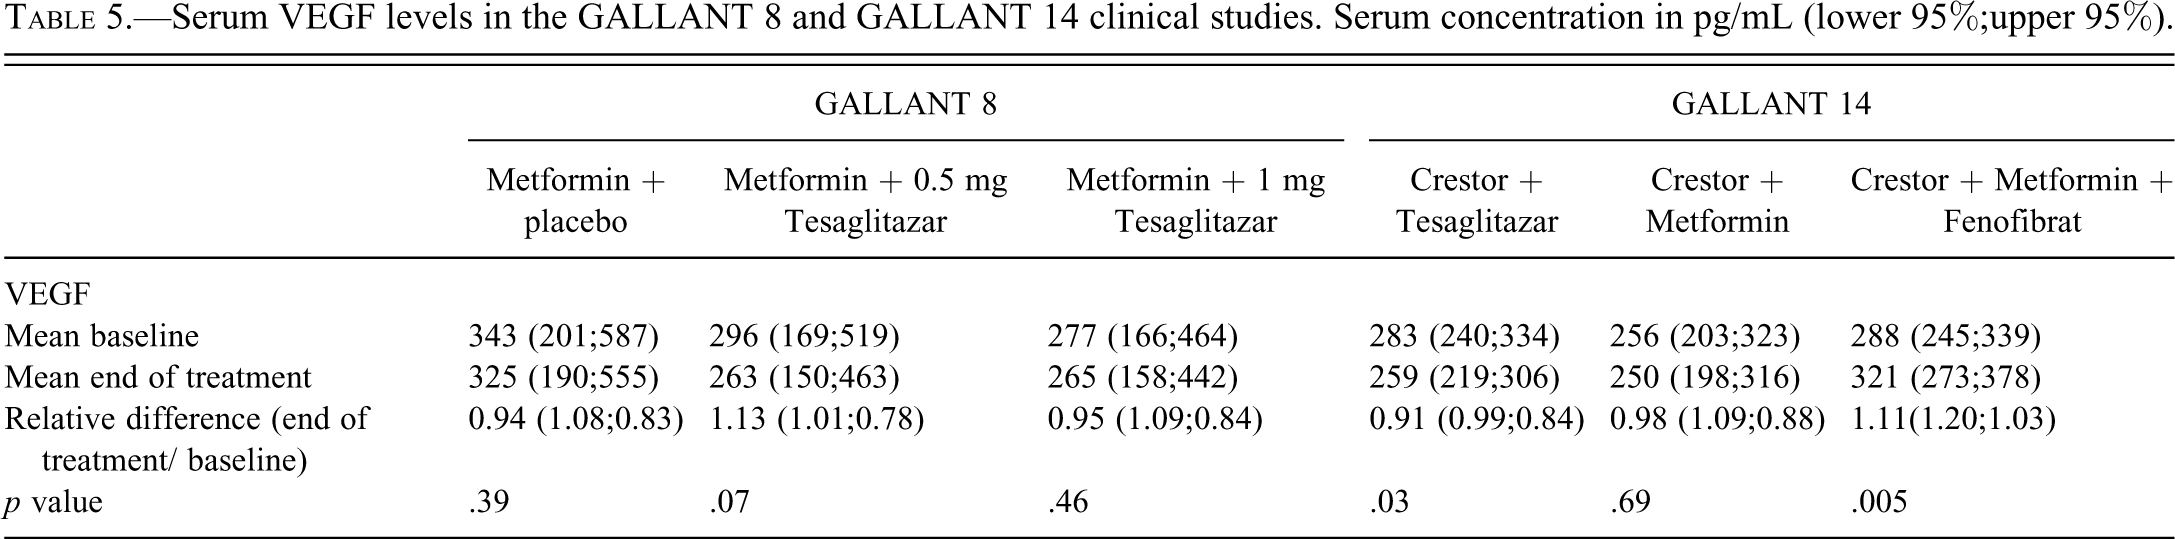
The baseline values of VEGF in both studies were between 150 and 587 pg/mL (lower and upper 95%), which is in the range of normal individuals according to Nobile-Orazio et al. and according to the ELISA kit supplier (normal value range from 47 to 990 pg/mL). Table 5 shows results on VEGF levels in GALLANT 8 and GALLANT 14 (study design in Table 1). No statistically significant change in VEGF levels correlated to treatment could be seen in the GALLANT 8 study, indicating no effect of tesaglitazar as add-on to metformin treatment. In GALLANT 14, a statistically significant, approximately 10% decrease in VEGF was observed in the tesaglitazar-treated group. In this group, 62% of the patients had reduced serum levels of VEGF at the end of treatment, but only 5% had a VEGF level reduction of more than half the baseline level at the end of treatment. In contrast, the metformin plus fenofibrate treatment in GALLANT 14 showed a slight (10%) increase in VEGF levels. However, only 15% of the patients showed VEGF levels that increased more than 50%. Similar changes were observed for PDGF, FGF, and HGF serum levels (data not shown), however, the largest changes of up to 40% were found in the placebo treatment. Given the small magnitude of changes and the large degree of normal individual variation in growth factor levels, the observed changes are not considered to be of biological significance.
Serum VEGF levels in the GALLANT 8 and GALLANT 14 clinical studies. Serum concentration in pg/mL (lower 95%;upper 95%).
Discussion
In the two-year hamster carcinogenicity study with tesaglitazar, hemangiosarcomas were detected in livers of males with similar incidence at the three highest dose levels, 6%–8% compared to 0% in controls. Thus, there was no increase in hemangiosarcoma incidence relative to exposure, even though there was a twenty-fold increase in exposure between the 0.03 and 1 µmol/kg dose groups. Female hamsters showed exposure levels that were similar to males in all four dose groups, but no increase in hemangiosarcomas, with an incidence of 4% in the controls as well as in the highest dose group.
At this point in time, the United States Food and Drug Administration had presented data from several independent studies highlighting the risk that PPARs could possibly mediate the formation of hemangiosarcomas (especially in mice), but there were still examples of PPAR agonists that did not produce these tumors. Therefore, AstraZeneca initiated a program with the aim to establish whether tesaglitazar produces hemangiosarcoma in hamsters and to investigate the potential mechanism. In the high-power, two-year investigative study in male hamsters, it is concluded that there was no increase of hemangiosarcoma following daily administration of tesaglitazar at exposure levels similar to those in the carcinogenicity study. This finding is in contrast to the statement in the report from the ILSI Pathology working Group (Hardisty et al 2007), in which samples from our initial cancer study were assessed.
The carcinogenicity phase of the investigative study was complicated by an early onset high mortality frequency in both controls and treated animals, for a reason not definitively established. However, samples of gut from forty-four decedents around 52 weeks showed atypical hyperplasia and inflammation in the large bowel of approximately 60% of the hamsters examined. A similar lesion has been reported in aged Syrian hamsters naturally infected with helicobacter spp., characterized by chronic proliferative colitis, cystadenomatous hyperplasia, and more recently, as proliferative dysplastic typhlocolitis (Nambiar et al. 2006). High mortality is often an issue in carcinogenicity studies in hamsters (use of the hamster in carcinogenicity studies is summarized in Van Hoosier and McPherson [1987]), and it was also observed for females in the first carcinogenicity study, in which only around 30% of the animals survived to 104 weeks in controls and treated groups, a mortality rate similar to that in the investigative study. Peribiliary inflammation was frequent in all groups from 38 weeks on. This change was not treatment related and indicates an inflammatory process in the liver that most likely is correlated to the findings in the gut and the mortality rate in the study. Although the investigative study was confounded by the mortality rate, conclusions can be reached with regard to treatment-related pathology and tumorigenicity.
Treatment-related changes observed in the period one to twelve weeks in the investigative study are considered typical of those induced by PPARα agonists, characterized by hepatocellular hypertrophy, reduced cytoplasmic basophilia, and reduced glycogen. Structurally, these changes are caused by hypertrophy of the endoplasmic reticulum and peroxisome proliferation (Cohen and Grasso 1981). Between twelve and fifty-two weeks, there was exacerbation of these changes superimposed on the pathology associated with the aging hamster liver. The diffuse pigmentation apparent at thirty-nine weeks and widespread by fifty-two weeks has also been described following the administration of PPARα agonists to rodents and probably represents lipofuscin pigment resulting from increased oxidative stress (Lake 1995).
The overall incidence of hemangiosarcoma was similar in all groups in the investigative study, whereas the incidence of angioma, hepatocellular carcinoma, and hepatocellular adenoma was slightly increased in the highest dose group. However, the interpretation of these findings is confounded by the high mortality rate of the vehicle group that led to termination at 95 weeks. For decedent animals, there was no increase in the incidence of hemangiosarcoma or angioma across the treatment groups and only a small increase in the number of hepatocellular carcinoma and hepatocellular adenoma in the highest dose group. As the number of tumors in the 0.03 µmol/kg group was similar to that in the vehicle group, the tumor incidence in this group was not affected by the administration of tesaglitazar and may represent control incidence under the conditions of the experiment. At 104 weeks, the only tumors that were increased in number (compared to the 0.03 µmol/kg group) were hepatocellular adenoma and hemangioma, with no difference in the incidence of hepatocellular carcinoma or hemangiosarcoma. The increase in the incidence of angioma and adenoma in the highest dose group is a late event and is apparent only at 104 weeks. The increase in adenoma is consistent with the known effect of PPARα agonists in rodents and reflects the relative insensitivity of hamsters to this effect (Lake et al. 1993).
The incidences of hemangioma and hemangiosarcoma in the vehicle groups in the investigative study were greater than that in the carcinogenicity study and more in line with background incidences of up to 1% in hamster that have been reported previously (Dontenwill et al. 1973; Pour et al. 1976).
Stimulation of cell proliferation may be an important driver in the promotion of carcinogenesis and has also been described as such in a review on the mode of action for PPAR-mediated hemangiosarcomas in rodents (Cohen et al. 2009). In the investigative study, the lack of a treatment-related increase in BrdU-labeled endothelial cells supports that tesaglitazar does not induce hemangiosarcomas in hamsters. Instead, strong BrdU incorporation was observed in hepatocytes at the highest dose, which may contribute to the increase in hepatocellular adenomas and carcinomas that were observed at this dose level. In addition, no pro-proliferative effect could be observed after in vitro treatment of endothelial cell cultures with either rosiglitazone or tesaglitazar.
The possible involvement of growth factors (such as VEGF) in the mode of action for hemangiosarcomas has also been discussed in the literature (Cohen et al. 2009; Herman et al.), and analyses of growth factors in preclinical as well as clinical studies with tesaglitazar was specifically requested by regulatory authorities. Circulating VEGF levels were slightly increased throughout the study. VEGF mRNA expression was up-regulated in the hamster liver starting around week 4 and was maintained at higher levels at most time points up to the last analyses at week 52. The cause of VEGF up-regulation in the liver is unclear, but it may be explained by the PPARα-mediated liver growth and was associated with increased levels of cell-stress transcripts and of genes important for the cell cycle, but also important for VEGF induction. It is possible that increased cell stress also influenced other factors that subsequently contributed to the altered liver morphology, such as the increase in the incidence of hemangioma and hepatocellular adenoma/carcinoma in the highest dose group. Although no increase in hemangiosarcoma was observed, the increase in hemangioma and sinusoidal dilatation is similar to previously published transgenic overexpression of VEGF in mice and rabbits, which led to vessel dilatation and hemorrhages in the liver (Kitajima et al. 2005; Leppänen et al. 2006). No increase in plasma VEGF level was observed in human subjects treated with tesaglitazar. This finding is in contrast to studies presenting increased plasma levels of VEGF in patients with diabetes treated with troglitazone and pioglitazone, that is, one compound that causes hemangiosarcoma in mice and one that does not (Baba et al. 2001; Emoto et al. 2001). The role of VEGF in the formation of hemangiosarcoma remains unclear, and caution is warranted before extrapolating levels of circulating VEGF to organ-specific effect.
In summary, the clinical development program of tesaglitazar has been closed because of an unfavorable risk/benefit analyses compared to existing therapies. Given the number of healthy volunteers and patients included in the clinical trial, it is important to report that the carcinogenicity study and the comprehensive investigative program provides evidence that tesaglitazar does not produce hemangiosarcomas in the hamster. The investigative program has also demonstrated some of the difficulties in investigating low-incidence tumor findings and the importance not to overinterpret single investigative end points.
Footnotes
The authors declared no potential conflicts of interests with respect to the authorship and/or publication of this article. The authors received no financial support for the research and/or authorship of this article.
Acknowledgments
We thank James Goodman, Birgitta Dillner, Elisa Basmaci, Anna-Karin Lindström, and Kenneth Stockling at AstraZeneca Safety Assessment for excellent technical contribution to the studies. In addition, Helmut Schmid (RCC) is acknowledged as study director for the hamster carcinogenicity and investigative studies.