
Abstract
The intent of this article is to assist pathologists inexperienced in examining central nervous system (CNS) sections to recognize normal and abnormal cell types as well as some common artifacts. Dark neurons are the most common histologic artifact but, with experience, can readily be distinguished from degenerating (eosinophilic) neurons. Neuron degeneration stains can be useful in lowering the threshold for detecting neuron degeneration as well as for revealing degeneration within populations of neurons that are too small to show the associated eosinophilic cytoplasmic alteration within H&E-stained sections. Neuron degeneration may also be identified by the presence of associated macroglial and microglial reactions. Knowledge of the distribution of astrocyte cytoplasmic processes is helpful in determining that certain patterns of treatment-related neuropil vacuolation (as well as some artifacts) represent swelling of these processes. On the other hand, vacuoles with different distribution patterns may represent alterations of the myelin sheath. Because brains are typically undersampled for microscopic evaluation, many pathologists are unfamiliar with the circumventricuar organs (CVOs) that represent normal brain structures but are often mistaken for lesions. Therefore, the six CVOs found in the brain are also illustrated in this article.
Keywords
Introduction
This article represents a mini-atlas that displays the normal and altered morphologic features of neurons, macroglia, and microglia within the CNS, as well as classic patterns of cell degeneration and artifact. Images of the circumventricular organs are also included, because this author has found some of these normal structures to be misinterpreted as lesions.
The CNS is composed of hundreds of diverse neuroanatomic regions (many referred to as “nuclei”) and is frequently undersampled microscopically. It is important for pathologists to appreciate this diversity, to become familiar with rudimentary neuroanatomic landmarks, and to have an appreciation of the differential sensitivities of these varying brain regions to excitotoxicity as well as to physical and/or chemical insult. Some knowledge of neurochemistry, as well as of the afferent and efferent connections of individual brain nuclei, is helpful. At the very least, lesions that are detected should be identified as to specific neuroanatomic location, and regions receiving afferents from the affected region (or projecting to it) should also be examined microscopically. To interpret cytologic alterations, it is important for the pathologist to recognize both normal and pathologic variations in the appearances of the cells residing within the CNS. The pathologist must also have knowledge of histologic artifacts that are common within sections of the CNS, because these artifacts may be misinterpreted as lesions or may potentially mask underlying neuropathologic processes. With experience, recognition of artifacts should not present a problem for the pathologist even if the tissues are not optimally handled.
Because the information presented in this article is relatively basic, only selected references are included. There are many excellent neuropathology texts that present greater detail (and many more images), and these titles can be found in the extensive bibliography presented by Bolon et al. (2011).
Cells of the central nervous system are typically divided into the following two major categories: Cells of neuroectodermal origin Neurons Astrocytes Oligodendrocytes Ependymocytes Cells of mesenchymal origin Meninges Blood vessels Adipose tissue Microglia
The images and discussion in this article are limited to neurons, astrocytes, oligodendrocytes and microglia. Images of the circumventricular organs are also included.
Neurons
As one measure of brain complexity, it is generally stated that there are approximately 100 billion neurons in the human brain and even greater numbers of glial cells. Neurons are characterized by wide variations in size as well as shape (especially when special stains are used to reveal their cytoplasmic processes). Neurons may be broadly classified as “small neurons” or “large neurons,” but anatomic subtypes of each of these categories exist. Neurons may also be classified according to the neurotransmitters that they release (e.g., cholinergic, glutamatergic, GABAergic). Most neurons have multiple dendrites arising from their cell bodies. However, with rare exceptions, each neuron has only a single axon (even though this axon may branch at points distal to its cell body). Axons are specialized for transport, for the conduction of waves of depolarization, and for synaptic transmission. The Nissl substance, which stains quite prominently in large-sized neurons but is usually not apparent in small-sized neurons at the light microscopic level, represents the rough endoplasmic reticulum (RER) (best seen in Figure 1a ). The RER is primarily confined to the neuronal soma but may penetrate slightly into the axonal hillock. The axon contains large numbers of neurofilaments and microtubules. These structural elements are important for maintaining cell integrity as well as for axonal transport. Chemicals that affect axonal transport may result in axonal swelling and degeneration that is visible at the light microscopic level.
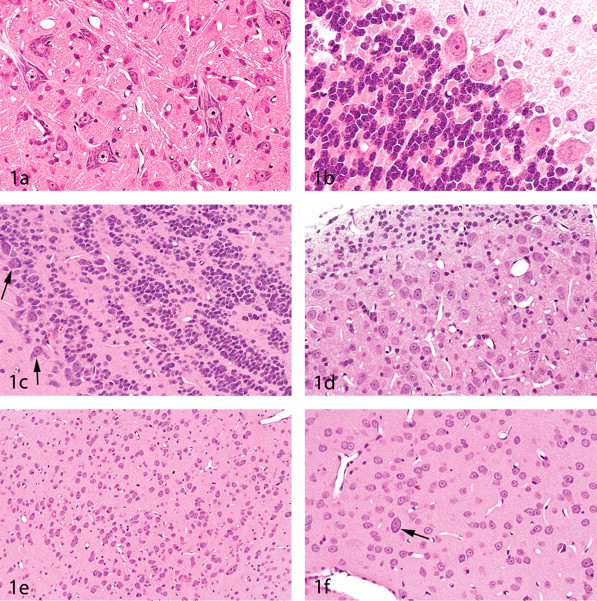
The panels in this figure were selected to show that neuronal populations within the brain are heterogeneous. In
When viewed by light microscopy, large neurons are characterized by relatively large cell bodies, by nuclei with single prominent nucleoli, and by Nissl substance (Figures 1a-f). However, in small-sized interneurons and neurons such as the granule cells that are abundant in the cerebellar cortex as well as in some other brain regions such as the olfactory bulbs and cochlear nuclei, these features may not be apparent (Figures 1b-c). Interneurons (i.e., neurons having axons that remain within a particular neuroanatomic locus) are usually smaller than the projection neurons that connect with other brain regions. The striatum (caudate and putamen) is an exception to this rule, with the cholinergic interneurons being larger than the medium spiny projection neurons (Figure 1f). While the wide variation in size and appearance of neurons may be problematic for the inexperienced pathologist, it is this broad spectrum of neuron morphology that also assists in the microscopic recognition of numerous neuroanatomic regions. Recognizing these regional patterns will assist the pathologist in identifying specific brain nuclei (i.e., aggregates of neurons that perform a specific function or represent components of a particular neural pathway). Recognizing specific neuroanatomic regions and, in turn, learning the afferent and efferent connections of these regions will enhance the pathologist’s understanding of pathophysiologic mechanisms within the CNS and will also make the study of neuropathology more enjoyable. For example, if neuronal degeneration is encountered within the hippocampus, the pathologist should check to see if degeneration is also present within the entorhinal cortex (which provides the primary input to the hippocampus) and should additionally check those neuroanatomic regions receiving input from the hippocampus (e.g., the subiculum, entorhinal cortex, prefrontal cortex, lateral septal area, mammillary body, and amygdala).
A variety of immunohistochemical markers exist for neurons. Some of these markers include synaptophysin, NeuN, neurofilament protein, neuron-specific enolase (NSE) (which is not entirely specific for neurons), and microtubule-associated protein 2 (MAP2). Stains for calcium-binding proteins (e.g., calbindin, parvalbumin, and calretinin) are useful in identifying some neuronal subtypes. Sections of the CNS are particularly prone to histologic artifacts that may be misinterpreted as lesions or may mask underlying neuropathologic processes. Investigators inexperienced in neuropathology have frequently published papers in which photomicrographs show artifactual dark neurons that are claimed to represent dead or even “apoptotic” neurons. (Note that apoptosis is not a term that should be assigned to the mechanism of cell death in the nervous system based on examination at the light microscopic level with routine stains. Use of the term “apoptosis” suggests that the pathologist understands the biochemical pathways leading to the cell’s demise, and the morphologic features of apoptotic and nonapoptotic cell death may be similar.) Dark neurons represent the most common artifact encountered within CNS tissues and are most frequently found in brains that have been handled prior to fixation (including shortly after perfusion fixation). Although well described by Cammermyer in the 1960s (e.g., Cammermyer 1961), the significance of the dark neuron artifact seems to have been forgotten, prompting a recent review by Jortner (2006). Sometimes referred to as “basophilic neurons,” these dark neurons are actually amphophilic in staining character. Large-sized neurons most frequently show the dark neuron alteration, but any neuron population may be affected (Figures 2a and 2b). Nevertheless, there is a predilection for certain neuron populations to more frequently show this artifact. Examples include the pyramidal layer of the hippocampus (Figures 2a and 2c) as well as some of the major brain stem nuclei (Figure 2b). Dark neurons appear to be in a shrunken or contracted state, and it is possible that this may be the result of contraction of cytoskeletal proteins such as actin. It has recently been shown that dark neuron formation could be prevented (in cerebral cortex biopsies) by blocking glutamate receptors (Kherani and Auer 2008). Dark neurons will also be encountered in cresyl violet-stained sections (Figure 2c). However, since cresyl violet is a stain for Nissl bodies (essentially the RER), it should be recalled that disassociation of ribosomes from the RER occurs in the early stages of cell degeneration. As a result, degenerating neurons actually stain very poorly (rather than darker) with cresyl violet.
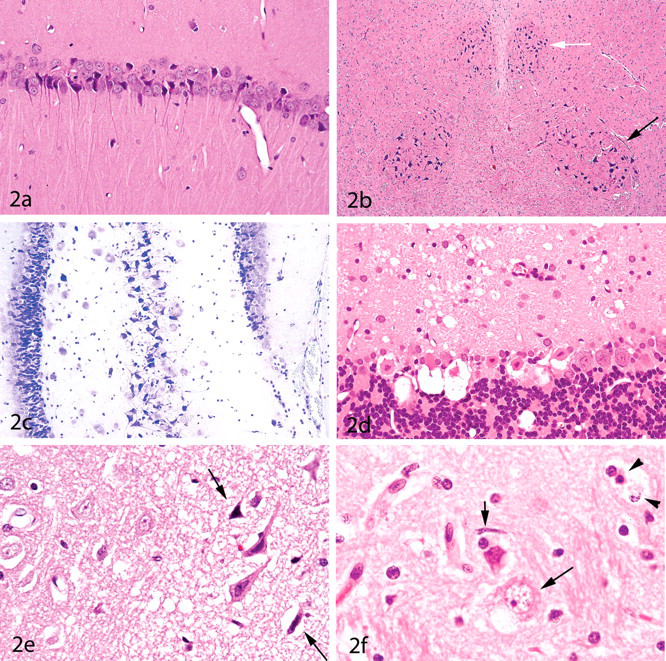
These panels contrast neuron artifact with neuron degeneration.
The classic appearance of neuron degeneration is that seen in the process known as “acute eosinophilic neuron degeneration.” The degenerating neurons (sometimes referred to as “red dead neurons”) are characterized at the light microscopic level by cell body shrinkage, loss of Nissl substance, intensely stained eosinophilic cytoplasm, and a small/shrunken darkly stained (pyknotic) nucleus that may eventually fragment (undergo karyorrhexis) (Figures 2d-2f). The most important feature of neuron degeneration (unless peracute in nature) is that it is heterogeneous in appearance, whereas the dark neuron artifact is always monomorphic. For example, the neuropil adjacent to the degenerating neurons may be finely vacuolated as a result of swelling of neuronal processes (Figures 2d and 2e), or vacuolar alteration may be seen within the cytoplasm of neurons (Figure 2f). Furthermore, degenerating neurons will typically be found in different stages of degeneration (e.g., some having normal-appearing nuclei but eosinophilic cytoplasm, whereas others have pyknotic or fragmented nuclei) (Figures 2d-2f). Unless peracute in nature, a secondary microglial response is usually also present (Figure 2f).
Special stains for degenerating neurons fall into two basic categories: silver degeneration stains such as the amino cupric silver technique (de Olmos, Beltramino, and de Olmos de Lorenzo 1994) and the Fluoro-Jade stains (B and C) (Schmued and Hopkins 2000; Schmued et al. 2005). These stains are extremely helpful for both detecting and enumerating degenerating neurons and are highly recommended for acute degenerative processes, particularly if the sections are from perfusion-fixed brains (Figures 3a-3f ). (Use of these stains on sections from nonperfused brains may be problematic since red blood cells will be highlighted with both techniques.) The degeneration stains not only assist the pathologist in readily detecting medium- to large-sized degenerating neurons at lower power magnifications but also reveal degeneration within small-sized interneurons that have insufficient amounts of cytoplasm to demonstrate the eosinophilic cytoplasmic alteration typically present within H&E-stained sections. These stains are also helpful for distinguishing dark neurons from degenerating neurons within peracute degenerative processes in which the eosinophilic cytoplasmic alteration has not had time to develop (Figures 3e and 3f).
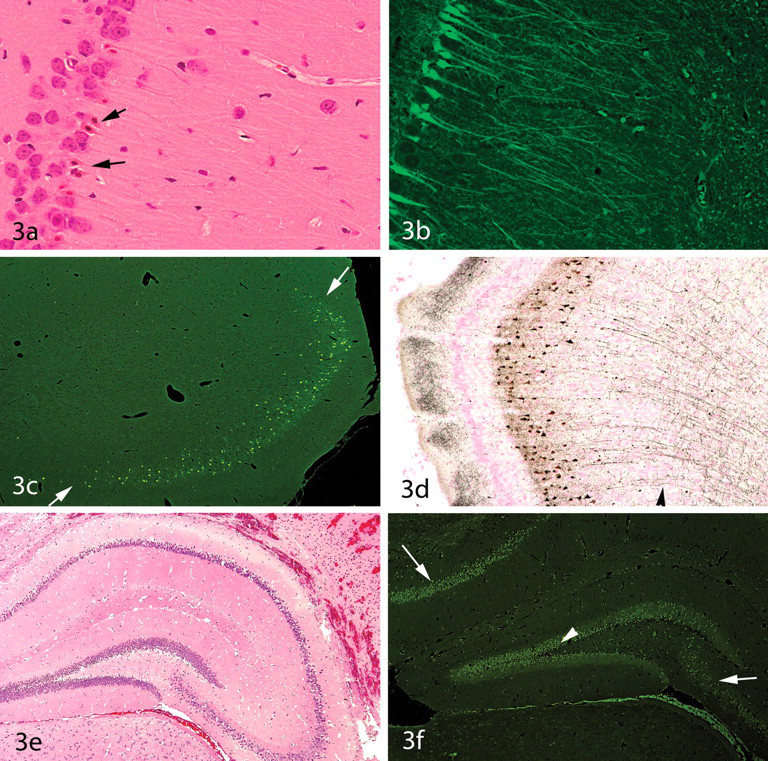
Use of special stains to enhance detection of degenerating neurons.
The principal advantages of the Fluoro-Jade stains include their ease of performance and that they may be used to stain sections from paraffin-embedded tissues. The silver degeneration stains, on the other hand, are more difficult to perform and are limited to sections from tissues not processed to paraffin (typically cryosectioned material). (In some safety evaluation studies, this might mean that two sets of brains would be required—one for paraffin embedding and the other for cryosectioning.) On the other hand, it is likely that silver degeneration stains would be employed only for the acute phase of a study and that paraffin-embedded tissues would be used for evaluations at later time points. Several advantages of the silver degeneration stains are that the sections can be viewed with bright field microscopy, the sections are more readily archival, and degenerative cell processes are more easily recognized. As a visual comparison of differences in staining of degenerative neuronal processes with these two techniques, Figures 3c and 3d represent two sides of the same rat brain—the left side processed to paraffin (and stained with Fluoro-Jade B) and the right side cryosectioned (and stained with amino cupric silver). It is important to note that some degrees of dendritic and axon terminal degeneration will also be revealed with the Fluoro-Jade stains even though not well illustrated in the relatively low-power images that constitute Figure 3. The bottom line is that there is no single “best stain” for detecting degenerating cells, and the stain selected (as well as the best time point for detecting a neurodegenerative process) will depend upon the dynamics of the test article and/or the experimental protocol. In some models of excitatory cell injury, the optimal sampling time point for detecting cell body degeneration will often be relatively acute (within a few days of dosing in the case of excitatory neurotoxicants), although larger sized neurons such as the pyramidal cell neurons of the hippocampus may show degenerative changes for at least two weeks (unpublished data). In this author’s experience, axonal injury may also be detected (with both the Fluoro-Jade and silver degeneration stains) over a longer period of time postinjury. For example, damaged axons will be highlighted with the amino cupric silver stain for at least two weeks following traumatic brain inury (Garman, unpublished data). Furthermore, this author has found that both the silver degeneration stains and the Fluoro-Jade stains highlight the optic tracts of rats that have “unilateral optic nerve atrophy” (a degenerative condition of the optic nerves and optic tracts that is generally considered to be chronic in nature; Shibuya, Tajima, and Yamate 1993).
In addition to the degeneration stains just discussed, a number of immunohistochemical stains for proteins are important in detecting and differentiating a variety of neurodegenerative diseases (e.g., beta amyloid in Alzheimer’s disease, alpha-synuclein in Parkinson’s disease, tau protein in a number of neurodegenerative diseases, and prion proteins in the spongiform encephalopathies). The accumulation of intraneuronal proteins in a variety of chronic neurodegenerative diseases may be the result of increased phosphorylation or proteolysis due to the influx of calcium into stressed cells. Proteins that are designated by the cell for destruction are conjugated with a stress protein named ubiquitin, for which an immunohistochemical stain is also available. Greater detail on the use of these special stains is beyond the scope of this discussion.
Astrocytes
Astrocytes have multiple roles within the CNS, including maintenance of the integrity of the blood-brain barrier, uptake and recycling of glutamate and GABA, maintenance of the extracellular ionic milieu (via uptake of K+ ions released during neuronal activity), and neuronal metabolic support. Radial astrocytes are specialized astrocytes that provide pathways for neuron migration during brain development. Within the cerebellum, some radial glia transform into the “Bergmann astrocytes” (or “Bergmann glia”), the cell bodies of which reside within the Purkinje neuron layer. Proliferation of Bergmann astrocytes—referred to as “Bergmann gliosis”—may be seen as a result of chemical toxicities that produce a loss of Purkinje neurons. Corpora amylacea, common within the brains of aging mammals (especially humans but rare in the CNS of rodents), represent glucose polymers (“polyglucosan bodies”) that reside within the cytoplasm of astrocytes. Corpora amylacea are most frequently present within perivascular and subpial locations, thus corresponding to the location of astrocytic cytoplasmic processes.
Astrocytes—like neurons—have a variety of neurotransmitter receptors within their cell membranes, and astrocytes are also involved in information processing. Stimulation of astrocytes by neurotransmitters induces cell signaling (via gap junctions and involving elevations in intracellular calcium) to other astrocytes over relatively long distances (Agulhon et al. 2008). The important roles of astrocytes in supporting neuron function is underscored by the large numbers of these cells present in the brain. Astrocytes are the predominant glial cell type and comprise approximately half of the volume of the adult mammalian brain (Agulhon et al. 2008). In most brain areas (and depending on the species), there is an approximately 1 to 1 ratio between the numbers of astrocytes and the number of neurons, although the ratio is higher in some brain regions and is also higher in brains from those species possessing greater cognitive abilities. For a more complete overview of astrocytic cell biology, the reader is referred to an article in this issue (Sidoryk-Wegrzynowicz et al. 2011), as well as to a recent review by Sofroniew and Vinters (2010).
To fulfill their various vital roles, astrocytes have cytoplasmic extensions that touch on the surfaces of all major regions of the neuron’s anatomy (i.e., cell bodies, axons, dendrites, and synapses) and also extend to the pial surface of the brain to form the glia limitans (glial limiting membrane). The glia limitans seals the surface of the brain and also dips into the brain tissue along the perivascular (Virchow-Robin) spaces. Astrocyte foot processes also surround brain capillaries and, during development, induce endothelial cells to form tight junctions.
The term “astrocyte” means “star cell,” referring to the multiple radially arranged cytoplasmic processes that can be appreciated only with special stains. However, while astrocytes have long cytoplasmic extensions that reach from neurons to the pial surface and/or to capillaries, these processes are not seen within H&E-stained sections. In fact, nonreactive astrocytes are characterized within H&E-stained sections by “naked nuclei” and little observable cytoplasm (Figure 4a ). Astrocytes are often broadly classified into fibrous and protoplasmic types, with the former being found within white matter regions and the latter residing within the gray matter. This is an oversimplification, however, with newer evidence indicating that astrocyte populations are heterogeneous from one brain region to another (Yeh et al. 2009; Hewett 2009).
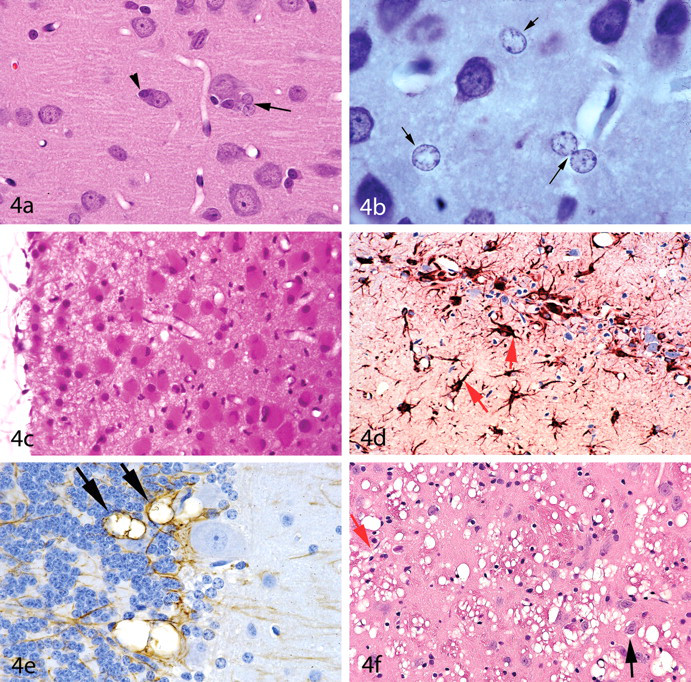
Variations in astrocyte morphology.
In gray matter regions of the CNS, astrocytic cell nuclei are often found to be in close proximity to neurons (Figure 4a) but may be found anywhere within the neuropil. Astrocyte nuclei typically have pale, finely granular chromatin patterns and relatively small or indistinct nucleoli. One of the many roles of the astrocyte is to remove and detoxify ammonia; and in states of hyperammonemia, “Alzheimer type II astrocytes” with swollen, “water clear” nuclei may be seen in sections from immersion-fixed (but not perfusion-fixed) brains (Norenberg et al. 2007) (Figure 4b).
In reactive astrocytosis, the cytoplasm of astrocytes becomes more distinct. Reactive astrocytes also have larger (i.e., more active-appearing) nuclei that are typically eccentric in position, and these cells are occasionally binucleated. Such reactive astrocytes are often referred to as “gemistocytic astrocytes” or “gemistocytes” (literally meaning “stuffed cells”) (Figure 4c). The immunostain most frequently performed to demonstrate astrocytes detects the cytoskeletal protein glial fibrillary acidic protein (GFAP). Degrees of GFAP staining will vary depending upon the species, the neuroanatomic region, the method of fixation, and the antibody and staining procedure utilized. In GFAP-stained sections of normal brain tissue, the fibrous astrocytes of the white matter typically stain more prominently than do the protoplasmic astrocytes. A paucity of GFAP staining in some neuroanatomic regions (especially in formalin-fixed vs. frozen tissue) suggests that some astrocytes may have lesser concentrations or different epitopes of GFAP and/or that degrees of GFAP expression have been altered by the fixation process. Nevertheless, GFAP stains are quite useful for identifying reactive astrocytes. In GFAP-stained sections, reactive astrocytes are identified by their thickened cytoskeletal processes (Figure 4d). “Gliosis” refers to a proliferation of astrocytes within damaged regions of the CNS. However, a diagnosis of gliosis should be used with caution if increased numbers of astrocytes are encountered within H&E-stained sections in the absence of any underlying histopathologic process such as neuron loss, neuropil vacuolation, and so forth. If reactive astrocytes such as gemistocytes are present or there is prominent staining with GFAP, use of the term “gliosis” is appropriate. However, early glial cell neoplasms may be misdiagnosed as gliosis. The term “myelination gliosis” is used to describe the normal proliferation of glial cells (primarily oligodendrocytes) within the developing brain just prior to myelination.
Pathologists examining CNS sections from immersion-fixed specimens are well aware of the typical “shrinkage or fixation artifacts” that most frequently manifest as perivascular “retraction” spaces and cleft formation or vacuolation within the Purkinje cell zone or along the blades of the dentate gyrus of the hippocampus. These are regions that also happen to have abundant astrocytic cell processes. Furthermore, careful examination of these artifacts usually reveals that these spaces are not actually “clefts” but represent aggregates of vacuoles (Garman forthcoming). This author has seen at least several pharmaceutical treatments that enhanced this pattern of artifact, which, based both on location (perivascular and paraneuronal with a predilection for sites such as the Purkinje cell layer) and staining with GFAP suggested that the process was one of swelling of astrocyte cell processes immediately after death (Figures 4e and 4f). In the case of one of these pharmaceuticals, cryostat sections from snap-frozen brains did not have vacuoles, but vacuoles were prominent within paraffin sections from similarly treated animals. Of great interest to this pathologist was also the heterogeneous distribution of the vacuoles seen with these test articles. For example, in the case of the vacuolar alteration shown in Figure 4f, the globus pallidus was affected but not the caudate-putamen, once again indicating heterogeneity in astrocyte populations (or at least altered levels of astrocyte activity within the affected regions).
Oligodendrocytes
Oligodendrocytes are responsible for the formation and maintenance of the myelin sheaths of the CNS. Although Schwann cells serve this role in the peripheral nervous system, oligodendrocytes will be found to extend out from the brain for some distance into the proximal segments of the cranial nerves (as well as along the entire optic nerve). Within these cranial nerves, sharp demarcations will be seen between the zones of central and peripheral myelination (Figure 5a ). Oligodendrocytes—in contrast with Schwann cells—ensheath multiple axons, whereas a single Schwann cell forms the myelin sheath for only one axonal internode. Within tracts of white matter, oligodendrocytes are typically arranged in linear rows between the nerve fibers (Figure 5a). For a recent review of the biology and pathology of oligodendrocytes, the reader is referred to Bradl and Lassmann (2010).
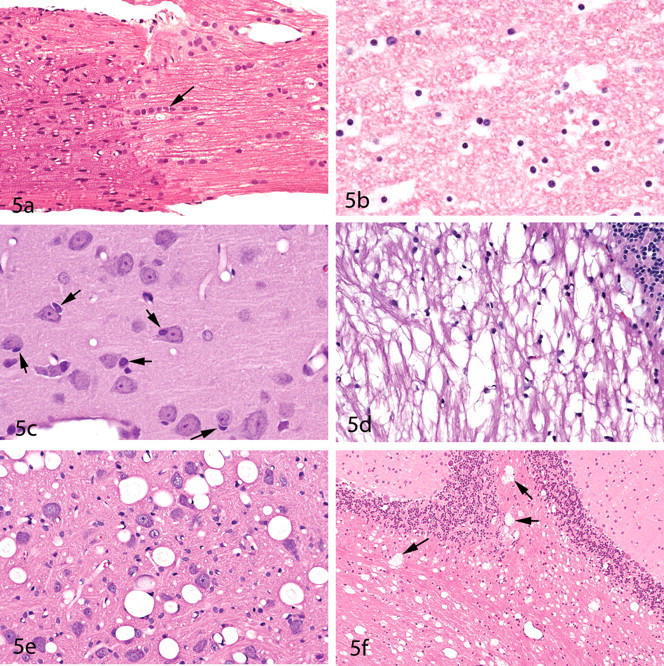
Morphology of oligodendrocytes and selected patterns of myelin vacuolaton.
The classic “fried egg” appearance of oligodendrocytes within nonperfused nervous system tissue represents cytoplasmic artifact (Figure 5b) and will not be seen in sections from perfusion-fixed brains (Figure 5c). Within the gray matter, oligodendrocytes are frequently found immediately adjacent to neuron cell bodies, where they are often referred to as “satellite cells” (Figure 5c). (Note that satellite cells within the sensory ganglia of the peripheral nervous system are present in large numbers but represent Schwann cells.) The term “satellitosis” refers to increased numbers of cells surrounding neurons. However, like “gliosis,” this term should be used with caution since the numbers of neuron-associated satellite cells will vary from one region of the brain to another. Neoplastic satellitosis (most frequently seen in association with malignant astrocytic neoplasms) is far more common than reactive satellitosis except in processes of neuron degeneration, within which the satellite cells represent microglia. Immunologic stains for myelin-associated glycoprotein (MAG) and for myelin basic protein (MBP) have been used to stain oligodendroglia with varying success, but the results are not always reliable or reproducible.
Myelin vacuolation or myelin sheath splitting may or may not be the result of compromised function of oligodendrocytes. Triethyltin tin, for example, produces the classic pattern of intramyelinic edema without altering the morphology of the oligodendrocyte nuclei (although some astrocytic cell swelling has been reported) (Krinke 2000) (Figure 5d). Intramyelinic edema may also be characterized by round vacuoles that are not restricted to white matter tracts (Gibson et al. 1990) (Figure 5e). Artifactual myelin vacuolation is common, and it is important that the pathologist be able to distinguish this artifact from vacuoles due to premortem alteration of the myelin sheaths. Figures 5e and 5f provide such a comparison. The vacuoles in Figures 5e and 5f are somewhat similar in that both types contain small amounts of poorly stained material. However, the vacuoles in Figure 5f (which represent artifact) are more irregular in shape. The vacuoles shown in Figure 5f—sometimes referred to as Buscaino bodies, mucocytes, or metachromatic bodies—develop as a result of handling of the brain or spinal cord too soon after exposure to formaldehyde fixatives and, in the author’s experience, tend to be more prominent in tissues fixed with formalin preparations that also contain alcohol. Buscaino bodies are thought to be caused by solubilization and subsequent precipitation (by fixation) of some myelin component (Ibrahim and Levine 1967). These structures are typically pale but may be slightly basophilic or gray in color, as well as metachromatic or periodic acid-Schiff (PAS)-positive (Vinters and Kleinschmidt-DeMasters 2008). In the author’s experience, Buscaino bodies are also often (but not always) refractile when viewed with polarized light.
Microglia
Microglia comprise the reticuloendothelial system of the CNS and constitute 5-20% of the brain’s glial cell population. As with neurons and the macroglia, microglia are functionally heterogeneous. For a concise overview of current concepts in microglial cell biology, the reader is directed to the review article in this issue (Kofler and Wiley 2011), as well as to a recent review by Graeber and Streit (2010).
In H&E-stained sections of normal brain regions, only small numbers of microglia are typically recognized. The nuclei of resting microglia are elongated or “cigar-shaped” and are composed primarily of heterochromatin (i.e., are darkly stained and, therefore, not active in appearance) (Figure 6a ). In fact, these nuclei are sometimes mistaken for endothelial cell nuclei—or endothelial cell nuclei may be mistaken for microglia when tangential slices of capillary walls are viewed in sections from perfusion-fixed brains. (As an example of this, compare the morphology of the microglial cell indicated by the arrow in Figure 6a with the endothelial cells found adjacent to the empty vascular spaces within this same field.) The cytoplasm of nonreactive microglia is poorly visualized with routine stains. However, with special staining procedures, such as ionized calcium-binding adapter molecule 1 (Iba1), the extensive dendritic processes of microglia can be visualized (Figure 6b). Immunohistochemical markers most frequently used for microglial cells include Iba1 and lectin (Griffonia simplicifolia; GS-IB4), with the CD68 (ED1) stain being helpful for revealing macrophages. A number of other immunostains have been used successfully for demonstrating microglia but will not be discussed here.
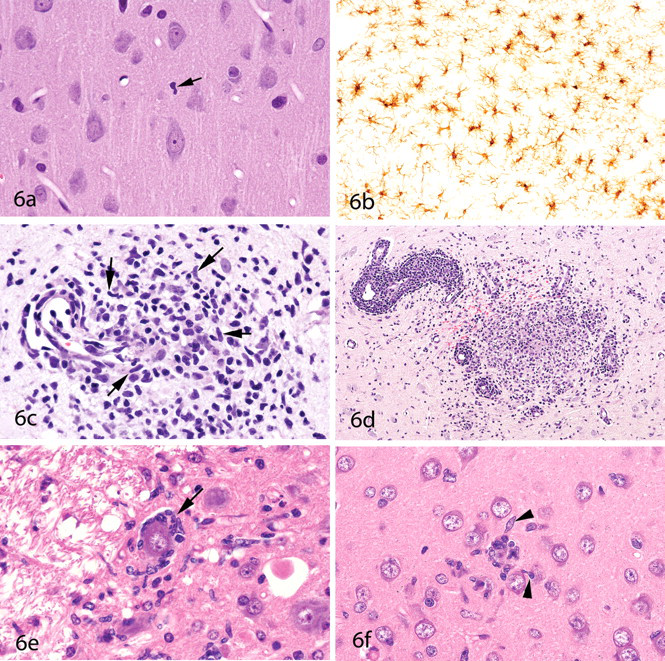
Microglial cell morphology. Within the normal neuropil (
In lesions characterized by neuronal degeneration, individual microglia will typically be seen in close proximity to the degenerating neurons (Figure 2f). Greater insults to the CNS may result in denser infiltrates of microglia, some of which will assume a histiocytic cell morphology (6c) or even form granuloma-like inflammatory patterns (Figure 6d). Under appropriate conditions, microglia may transform into macrophages and, in this state, are sometimes referred to as “gitter cells.” In most “neurotoxic” lesions, neuronal degeneration will be apparent by the time microglia aggregate at the scene. However, this is not always the case. Figure 6e shows microglia surrounding a relatively normal-appearing neuron. Although this image is from an experimental lentivirus infection, this author has seen a similar pattern (i.e., of microglia surrounding normal-appearing neurons) in some toxic lesions (such as in certain stages of methylmercury intoxication). (It appears that microglia know much more about the state of health of neurons than we pathologists do with our microscopes.) After damaged neurons have been removed by activated microglia, residual microglial nodules may remain (Figure 6f).
In addition to microglial cells, other cells of mesenchymal origin (which will not be discussed here) include those within the meninges (dura mater, pia mater, and arachnoid). Adipose tissue is occasionally seen within the choroid plexus and filum terminale regions, and fat cells within the CNS uncommonly form lipomas.
Circumventricular Organs
A number of specialized structures are present along the midline of the ventricular system of the brain. These are collectively referred to as the “circumventricular organs” (CVOs). Generally, six CVOs are recognized in mammals, although one of these (the subcommissural organ) is vestigial in the adult human brain. It is important for pathologists to know the locations and appearances of these CVOs since they are frequently not present within standard coronal sections and, therefore, have often been mistaken for neoplasms or other lesions. The names of the CVOs and their locations, along with the corresponding panel number in Figure 7 , are listed in Table 1 . These CVOs are all located on the midline. However, some neuroscientists consider the choroid plexus (with multiple locations) to represent a seventh CVO. Another region that is sometimes included in the list of CVOs is the neurohypophysis, which functions to secrete oxytocin and vasopressin into the blood.
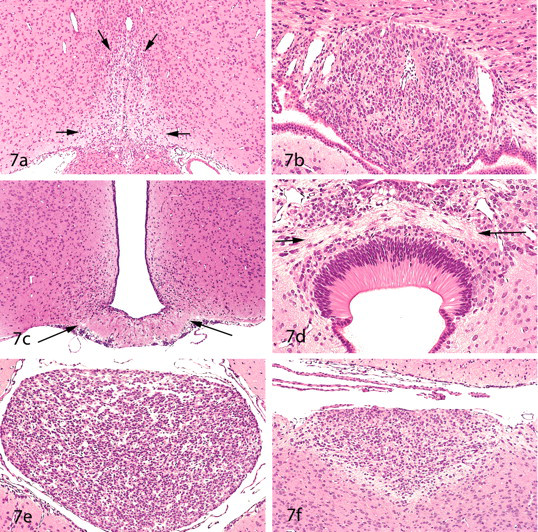
Circumventricular organs (CVOs). These six brain regions are characterized by incomplete blood-brain barriers and have a heterogeneous appearance in rat brains. They include the organum vasculosum of the lamina terminalis (
Names and locations of the circumventricular organs (CVOs).
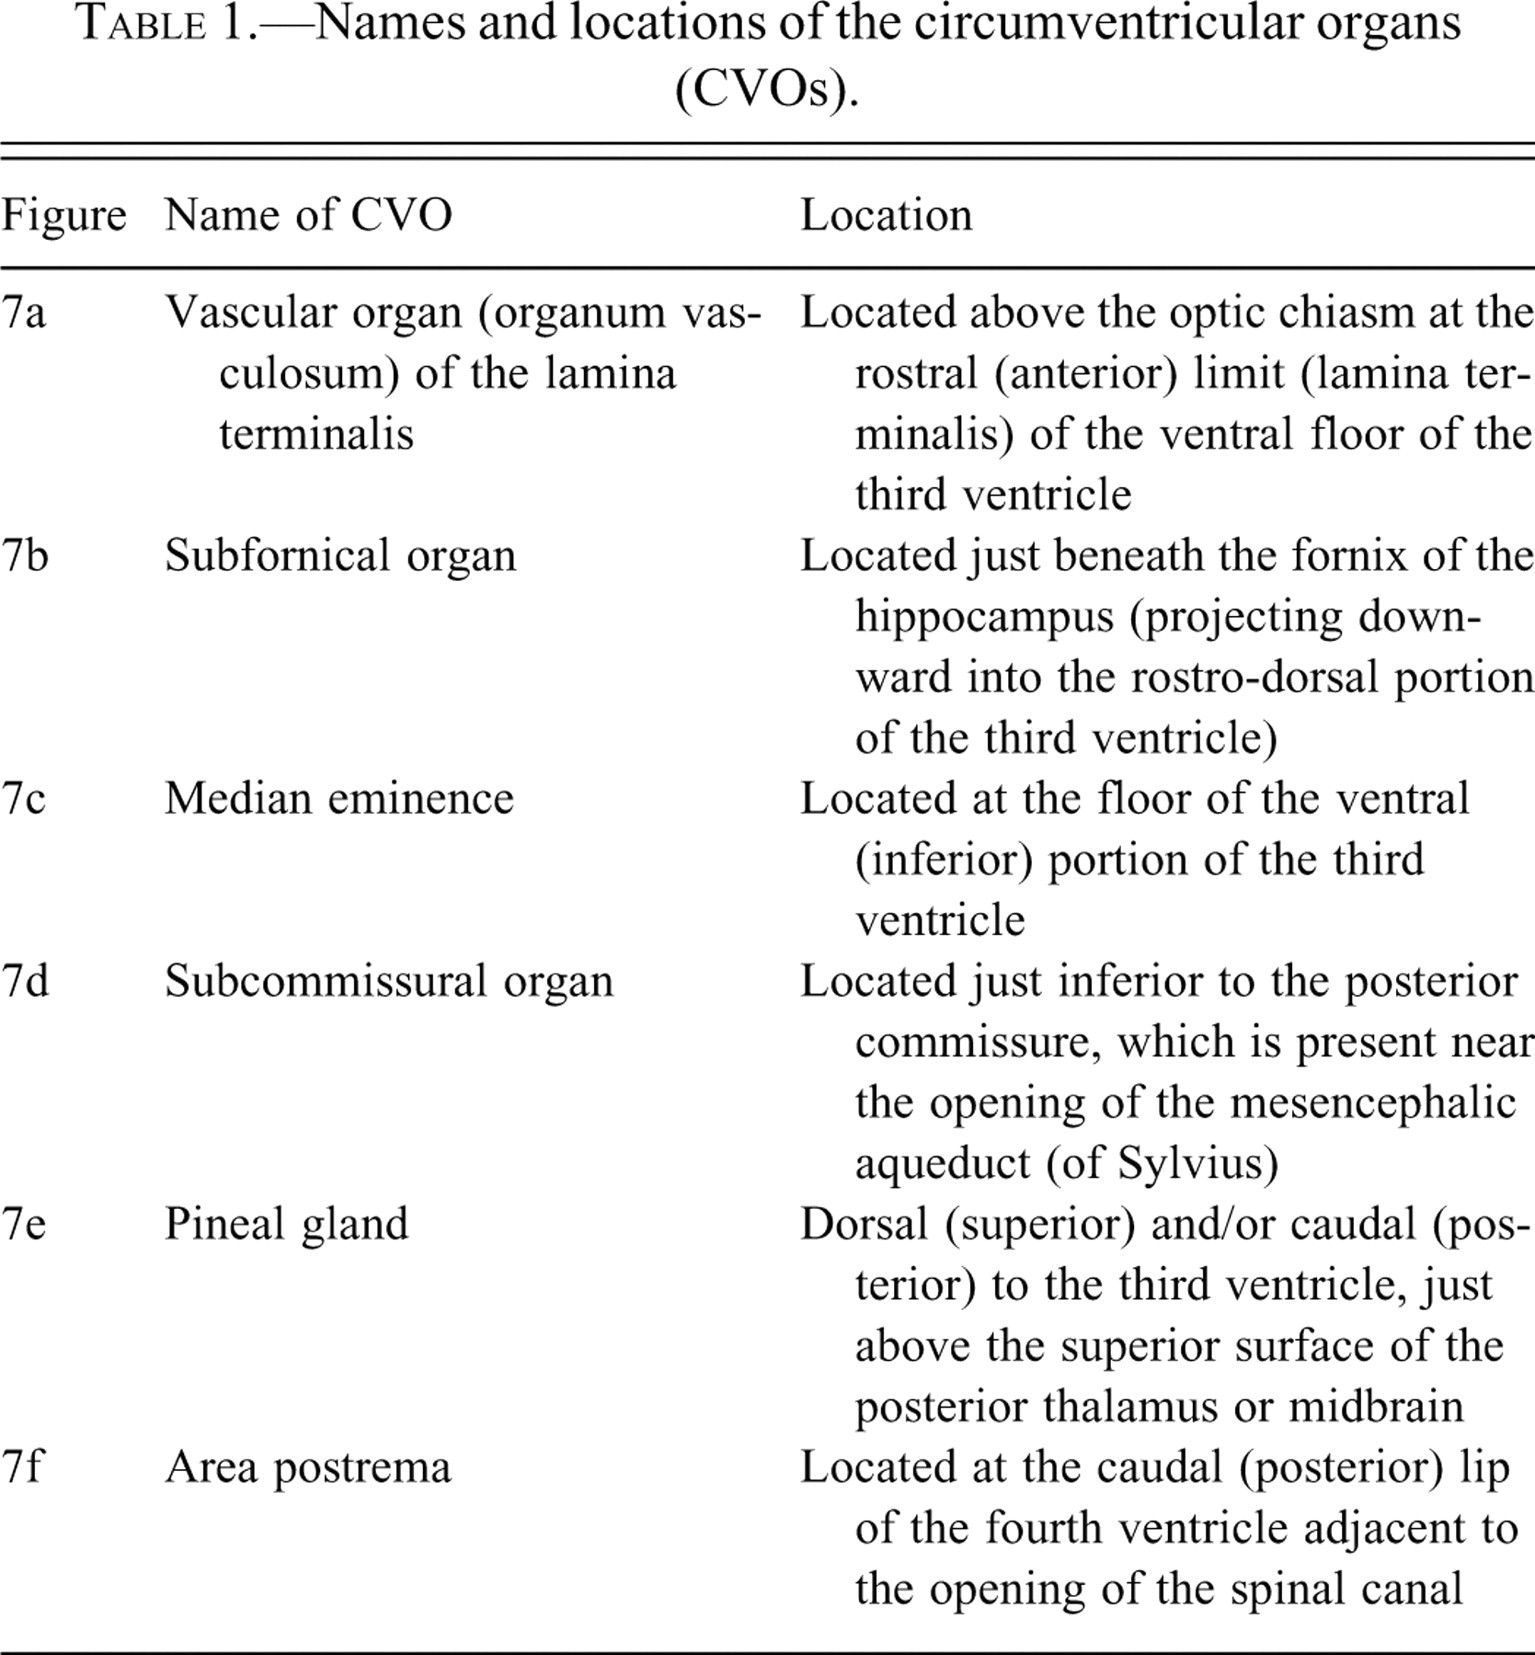
Although the locations of the CVOs are listed in Table 1, it is recommended that the reader also check standard atlases of neuroanatomy for visual confirmation of their specific neuroanatomic locations. A good reference on the comparative anatomy and vascularization of the CVOs is that of Duvernoy and Risold (2007).
Only three of the CVOs—the organum vasculosum, the subfornical organ, and the area postrema—contain neurons. The pineal gland is composed of glia and pinealocytes but contains no true neurons. (Pinealocytes synthesize melatonin from serotonin and also contain norepinephrine and thyrotropin-releasing hormone.) The subcommissural organ consists entirely of specialized ependymal cells. The median eminence is of low cellularity, representing the site where neurohormones from various hypothalamic nuclei are released into the hypothalamo-hypophysial vasculature. CVOs function to regulate biologic rhythms (pineal gland), blood pressure and water balance (organum vasculosum, subfornical organ, and area postrema), food aversions (area postrema), and homeostasis (median eminence and pineal gland). The functions of the subcommissural organ are poorly understood, but it is known that this CVO secretes a variety of glycoproteins into the cerebrospinal fluid, some of which aggregate to form the Reissner’s fiber that extends caudally through the aqueduct and spinal canal (Vio et al. 2008). The ability of the CVOs to perform their functions relates, in part, to the fact that their capillaries have fenestrated endothelial linings (i.e., lack the “tight junctions” of most of the capillaries within the CNS), and they, therefore, lack a blood-brain barrier. The lack of a blood-brain barrier within these CVOs indicates that they potentially represent important points of entry of chemicals into the brain. Therefore, when histology-based tracing studies are performed (e.g., to show the distribution of chemicals into the brain), it is essential that the CVOs be sampled. It is important to note here that certain other brain regions also lack blood-brain barriers. One example is the arcuate nucleus (which is just rostral to the median eminence and closely associated with it); another is the nucleus of the solitary tract (which is in close proximity to the area postrema). It has been suggested that these latter regions are important in regulation of food intake (Orlando et al. 2005). It follows that these regions should also sampled when looking for points of entry of chemicals into the brain.
Concluding Remarks
It is hoped that the images in this article will assist pathologists in becoming more familiar with the cytologic appearances of cells in the CNS and of the histologic patterns that characterize selected neuroanatomic regions. The reader is encouraged to embark on a journey of gradually acquiring increased knowledge of neuroanatomy and of current concepts in the neurosciences. When beginning this journey, it is helpful to have a good brain atlas at hand (for the species being examined) and to try to find a new anatomic location within each brain examined. The pathologist will find that knowledge of neuroanatomy—and subsequently of neurophysiology and neurochemistry—will make neuropathologic evaluations more exciting and more rewarding. As knowledge of neuroanatomy and of brain complexity are acquired, pathologists will also come to understand why more rigorous sampling of the CNS is being recommended for microscopic assessment in safety evaluation studies (Hale et al. 2011 [this issue]).