
Abstract
Human cardiomyopathies often lead to heart failure, a major cause of morbidity and mortality in industrialized nations. Described here is a phenotypic characterization of cardiac function and genome-wide expression from C3H/HeJ, C57BL/6J, and B6C3F1/J male mice. Histopathologic analysis identified a low-grade background cardiomyopathy (murine progressive cardiomyopathy) in eight of nine male C3H/HeJ mice (age nine to ten weeks), but not in male C57BL/6J and in only of ten male B6C3F1/J mice. The C3H/HeJ mouse had an increased heart rate and a shorter RR interval compared to the B6C3F1/J and C57BL/6J mice. Cardiac genomic studies indicated the B6C3F1/J mice exhibited an intermediate gene expression phenotype relative to the 2 parental strains. Disease-centric enrichment analysis indicated a number of cardiomyopathy-associated genes were induced in B6C3F1/J and C3H/HeJ mice, including Myh7, My14, and Lmna and also indicated differential expression of genes associated with metabolic (e.g., Pdk2) and hypoxic stress (e.g. Hif1a). A novel coexpression and integrated pathway network analysis indicated Prkaa2, Pdk2, Rhoj, and Sgcb are likely to play a central role in the pathophysiology of murine progressive cardiomyopathy in C3H/HeJ mice. Our studies indicate that genetically determined baseline differences in cardiac phenotype have the potential to influence the results of cardiotoxicity studies.
Introduction
Heart failure is the leading cause of mortality (National Center for Health Statistics 2005a) and health care expenditures in the United States (National Center for Health Statistics 2005b). Human cardiomyopathy (hCM) may lead to heart failure, characterized by the inability of the heart to adequately pump blood, resulting in inadequate perfusion and oxygenation of tissues. The most common cause of hCM is myocardial infarction or coronary artery disease, both of which have environmental (http://www.mayoclinic.com/health/heart-disease/DS01120/DSECTION=causes) and genetic determinants (Kathiresan et al. 2009; Samani et al. 2007). In addition, thyroid disease and uncontrolled diabetes can promote hCM (Boudina and Abel 2007; Dahl et al. 2008). Specific exogenous causes of hCM include alcohol; cocaine or amphetamine abuse; chemotherapeutics, such as doxorubicin and anthracycline; as well as viral and bacterial infections (Jessup and Brozena 2003). A number of genetic risk factors for intrinsic hCM have been identified (Fowler et al. 2009). Most of the identified risk alleles compromise the structure or function of the sarcomere or interfere with ion homeostasis. Despite the mechanistically informative nature of these genetic determinants with respect to the pathogenesis of hCM, most are monogenic in origin and account for a small fraction of genetic risk factors for hCM-related disease in the general population (Morita et al. 2005). It is likely that a significant proportion of the hCM observed in the human population derives from a combination of independent and interacting environmental and genetic risk factors. Independent of the cause, CM and eventual heart failure is manifest because of the inability of myocardial cells to produce enough ATP to sustain high-energy processes such as maintenance of the ion gradient and calcium homeostasis, which are essential for excitation-coupled contraction and cardiomyocyte survival (Neubauer 2007; Rajabi et al. 2007; Taha and Lopaschuk 2007).
Because of the documented cardiotoxic effects of certain pharmacological and environmental agents, National Toxicology Program (NTP) scientists are working to develop more sensitive models to identify potential cardiac-toxic environmental chemicals (Dunnick et al. 2006; Dunnick, Johnson et al. 2004; Dunnick, Kissling et al. 2007; Dunnick, Lieuallen et al. 2004; Dunnick, Thayer et al. 2007; Jokinen et al. 2005; Nyska et al. 2005a, 2005b). The B6C3F1/J mouse (an F1 hybrid of the C57BL/6J and C3H/HeJ mice) is the mouse model most commonly used for environmental hazard identification and for regulatory decisions in the United States (Rao and Crockett 2003) in regard to human exposure and risk. The rates of spontaneous mCM (commonly referred to as murine progressive cardiomyopathy) vary considerably in two-year-old B6C3F1 mice (2% to 80%) (Maronpot et al. 1999), but this cardiomyopathy is not of clear functional consequence (i.e., early death). Cardiac physiology studies are not usually carried out on two-year-old mice to assess cardiac function such as cardiac output; hence, the possibility remains that more subtle cardiac deficits may exist in older mice with mCM. The NTP has shown treatment-related increases in mCM in B6C3F1 mice at the end of two years with several environmental agents (diethanolamine, urethane, methyl bromide, and bis[2-chloroethoxy]methane [CEM]) (Dunnick, Johnson et al. 2004; Jokinen et al. 2005). In these studies, the mCM was composed of cytoplasmic vacuolization, cellular infiltrate, necrosis, and/or fibrosis, but the mechanism for the cardiotoxicity was not always identified and may vary with the chemical (Dunnick, Johnson et al. 2004; Jokinen et al. 2005).
In contrast to mice from two-year studies, mCM is rarely observed in B6C3F1 mice from subchronic toxicity studies. The potential reasons for the relatively low rates of mCM include: (1) rodents in general may be less susceptible to cardiotoxicity; (2) the chemicals evaluated by the NTP may not include many acute cardiotoxins; (3) adaptation and resolution of injury in young rodents that occur following initial cardiac toxic events (Dunnick, Johnson et al. 2004); and (4) the B6C3F1 mice may not be sensitive to acute chemical-induced mCM owing to the presence of protective alleles. The genetic susceptibility hypothesis for low subchronic mCM rates is not unreasonable, considering the noteworthy differences in cardiac response between mouse strains following isoproterenol challenge (Berthonneche et al. 2009). Genetic susceptibility to cardiotoxicity can be conferred through different mechanisms. In some cases, it may be a result of toxicokinetic differences between strains, and other cases it may be derive from genetically determined subclinical disease in the test animal prior to chemical challenge (e.g., low-grade cardiomyopathy or elevated heart rate). Mouse strains that exhibit genetically determined subclinical cardiac disease may provide more sensitive models for detecting chemical-induced cardiotoxicity. It is important to point out the nuances of such a concept, specifically that strain susceptibility is likely a function of the type of cardiotoxic challenge and it may be necessary to test in multiple strains with different types of subclinical cardiac disease to identify the susceptible strain for a given test article. Bearing this latter issue in mind, the idea of testing in genetically susceptible populations has been employed as the justification for the use of transgenic and knockout mice in carcinogenicity hazard characterization (Pritchard et al. 2003), as well as when comparing the particulate matter-induced cardiopulmonary effects between normotensive Wistar Kyoto rats, spontaneously hypertensive rats, and stroke-prone spontaneously hypertensive rats (Wallenborn et al. 2007). In addition, the biological plausibility and relevance of this approach in relation to cardiotoxicity risk in humans is illustrated by the increased risk of drug-induced long-QT syndrome in individuals with subclinical long-QT that is a byproduct of mutations in SCN5A (Makita et al. 2002).
A convenient starting point for identifying more sensitive models for cardiotoxicity testing (i.e., those that exhibit subclinical/occult cardiac disease) is the parental strains of the B6C3F1 mouse (C3H/HeJ and C57BL/6J), as the cardiac phenotype of these strains has been studied in some detail. C3H/HeJ mice are susceptible to dystrophic cardiac calcinosis (DCC) and focal myocardial cell necrosis (Eaton et al. 1978). Quantitative trait loci that control the susceptibility to DCC in C3H/HeJ mice have been mapped to chromosomes 4, 6, 8, and 12 (Ivandic et al. 1996). Bacterial artificial chromosome transfer studies have since identified Abcc6 on chromosome 6 as a major determinant of DCC susceptibility in C3H/HeJ mice (Meng et al. 2007). The biochemical basis for DCC is related to altered calcium homeostasis, which also plays a critical role in hCM (Yano et al. 2005). C57BL/6 (ApoE−/−) mice are susceptible to the development of atherosclerosis when fed a high-fat diet, whereas C3H/HeJ (ApoE−/−) mice are particularly resistant (Shi et al. 2000). A number of QTL have been identified that confer risk of atherosclerosis in C57BL/6 (Wang, Schadt et al. 2007; Wang, Shi et al. 2007), however the underlying causal cardiac disease genes have not been explicitly identified. Despite these findings, it is uncertain whether a similar cardiac phenotype (specifically the mCM in C3H/HeJ mice) would spontaneously manifest under standard NTP study conditions. Furthermore, the underlying molecular-level processes that differ between the strains remain largely unexplored. An understanding of these molecular processes may serve to explain susceptibility to particular cardiotoxins.
One goal of the studies described here was to determine whether there is a difference in background cardiac disease phenotype (mCM) in C3H/HeJ, C57BL/6J, B6C3F1/J mice under NTP testing conditions. A second goal was to gain insight into the association between the histological and functional genomic phenotypes and to glean hypothesis-generating associations between the cardiomyopathy phenotype and genetic variation in the evaluated strains.
Materials and Methods
Animals
Ten C3H/HeJ, ten B6C3F1/J, and ten C57BL/6J male mice from The Jackson Laboratories, Bar Harbor, Maine were used for these studies. Surgery to implant a Data Sciences radiotelemetry transmitter (PhysioTelDSI TA10ETA-F20, DSI, Arden Hills, MN) in the abdominal cavity was performed on mice anesthetized with tribromoethanol (Avertine) 250 mg/kg IP at seven weeks of age. The ECG lead placement was a modified lead 1 (X axis). Prior to surgery, all mice received buprenorphine 0.05 mg/kg subcutaneously. Following surgery, all mice received 2 mL warmed saline given subcutaneously. All mice were housed individually with a twelve-hour light/dark cycle (6:00 AM to 6:00 PM). NTP 2000 diet (Ziegler Bros, Inc., Gardner, PA) was available ad libitum. The experiment was conducted at an AAALAC-accredited facility, and animal handling and husbandry met all NIH guidelines (Institute of Laboratory Animal Resources 1996).
Phenotype Measurements
Measurements of phenotype were performed two to two and a half weeks after surgery. Mean body weights for C3H/HeJ mice were 26.8 g, for B6C3F1/J mice 29.5 g, and for C57BL/6J mice 25.6 g at day one of the phenotype measurement. All data were recorded on conscious, unrestrained mice continuously for three days on a DSIK data exchange matrix through a receiver. Echocardiography (ECG) recordings were made using Datquest A.R.T., data acquisition and analysis software, components of the PhysioTel Telemetry System (DSI, Arden Hills, MI) on a schedule interval of a fifteen-second collection every ninety seconds for seventy-two hours beginning at 8:00 AM on study day one. The ECGs were evaluated for morphology, RR interval (msec) Bazett’s (Bazett 1920) corrected QT interval (millseconds), Ramp (MV), core body temperature (°C), and heart rate bpm). ECG waveforms were generated using ECGAUTO software (EMKA Technologies, Paris, France).
Necropsy
After collection of phenotype measurements (two to two and a half weeks post-surgery; nine and a half weeks of age), animals were euthanized with CO2; the heart was collected for histopathologic analysis, and a piece of the heart apex was collected for RNA analysis. The average apex section of the heart taken for RNA extraction was 13.1 to 14.4 mg. No more than four minutes elapsed between euthanasia and the placement of cardiac tissue in RNA preservation solution.
Histopathology
Sections of the heart from all animals were placed in a prelabeled mega cassette, fixed in 10% neutral buffered formalin, then trimmed, dehydrated, cleared, and infiltrated with paraffin in a tissue processor. Tissues were embedded using the Tissue-Tek system, sectioned as a longitudinal section containing both atria and ventricles on a microtome at approximately 5 µm, and mounted on glass slides. After staining with hematoxylin and eosin, cover slips and labels were attached to the slides. Heart tissues were then evaluated microscopically at different magnifications by a board-certified veterinary pathologist, and they were then peer reviewed by another board-certified veterinary pathologist, an expert in cardiovascular pathology.
Statistical Analysis of Electrophysiology and Histopathology Data
Statistical analyses were performed independently for each factor. Means and standard errors of the average data were calculated for each strain. An analysis of variance (ANOVA) model was fit to the average data using the MIXED procedure in SAS, version 9.1 (SAS Institute Inc., Cary, NC, 2004). Next, t tests were used to compare each pair of strains. Each comparison was done at a .05/3 = .0167 significance level, to control the overall error rate across all three pairwise comparisons to no more than 0.05.
RNA Preparation and Microarray Hybridization
A section of the heart apex (~ 10–18 mg) was placed into RNAlater (Ambion, Inc., Austin, TX) at necropsy. RNA was extracted from the hearts of five control C3H/HeJ, C57BL/6J, and B6C3F1/J mice. Total cardiac RNA was isolated from hearts using the QIAGEN RNeasy kit (QIAGEN, Valencia, CA). The RNA was analyzed for quantity and purity by ultraviolet analysis using the NanoDrop ND-1000 spetrophotometer (NanoDropTechnologies, Wilmington, DE). Samples were concentrated using Microcon filters (Millipore, Billerica, MA). All samples were evaluated for RNA integrity by gel electrophoresis using the Flash Gel RNA cassette system (Lonza, Rockland, ME). The average heart weights used for RNA extraction from the C3H/HeJ, B6C3F1/J, and C57BL/6J was 13.1, 14.4, and 13.9 mg, respectively. The total amount of RNA extracted for the B6C3F1/J and C57BL/6J mice was greater (average of ~ 1875 ng/14.4 mg and 1140 ng/13.9 mg) than for the C3H/HeJ mouse (375 ng/13.1 mg). Total RNA (50 ng) was used to synthesize double-stranded cDNA for each sample using Affymetrix GeneChipExpression 3′amplication two-cycle target labeling and control reagents (Affymetrix Inc. Santa Clara, CA). The cDNA served as a template to synthesize biotin-labeled antisense cRNA using an in vitro transcription labeling kit. Labeled cRNA was fragmented and hybridized to the Affymetrix Mouse Genome 430 2.0 Array. Array hybridization, washing, and staining were performed according to the Affymetrix recommended protocol EuKGE_Ws2v5. The chips were scanned using an Affymetrix GeneChipScanner 3000. Normalization was performed using the MAS5 algorithm and baseline transformed. Quality control measurements were evaluated to determine whether the data derived from the Affymetrix GeneChips were of sufficient quality prior to comparisons for differential expression. Affymetrix-recommended guidelines for evaluating quality were used to evaluate the output files for each GeneChip using the R/Bioconductor package, Simpleaffy (Wilson and Miller 2005). The quality control parameters evaluated for each chip were: average background; scale factor; number of genes scored as present; 3′ to 5′ ratios for the internal control genes, β-actin and glyceraldehydes-3-phosphate dehydrogenase; values for spike-in control transcripts; and value for poly (A) controls.
Microarray Data Analysis
All statistical analysis was performed on “present” probe sets (100% of the samples from at least one strain contained a “present” probe set) from the normalized data set. A complete compendium of probe sets exhibiting significant differential expression can be found in supplement 1, and the .cel files have been submitted to the GEO database. Using GeneSpring GX11 (Agilent Technologies, Santa Clara, CA), one-way ANOVA and Tukey honestly significant difference test were applied to distinguish differentially expressed sets of genes across the three experimental groups (C3H/HeJ vs. B6C3F1/J, C3H/HeJ vs. C57BL/6J, B6C3F1/J vs.C57BL/6J). A supplemental appendix to this article is published electronically only at http://tpx.sagepub.com/supplemental. P values listed in Supplementary Table 1 (Column Q) were adjusted using the Benjamini-Hochberg FDR multiple-testing correction. Self-organizing maps were created using the default setting in GeneSpring GX11. Literature-based, disease-centric enrichment analysis of the differentially expressed probe sets was done using CoPub (http://services.nbic.nl/cgi-bin/copub/CoPub.pl) (Frijters et al. 2008). All probe sets that exhibited significant change by ANOVA (all genes listed in Supplementary Table 1) were considered in the analysis. CoPub settings for the “disease” category analysis were an R score of >35 and a cross-species gene orthology selection. Four hundred forty-eight “disease” keyword categories were evaluated for enrichment in the analysis. The version of the CoPub database used for the analysis was based on Medline abstracts dated February 2008 and earlier. The “cardiomyopathy gene list” (used for selection of genes for cluster analysis) was created by searching the “disease” category of the CoPub “Bioconcept Search” with the keyword “cardiomyopathy” in (settings = all forms of cardiomyopathy selected, R score >20, copublications ≥ 3, mouse genes only) and by searching the keyword “cardiomyopathy” in the GeneCards database (http://www.genecards.org/). A nonredundant list was created from these searches, and overlap with the ANOVA gene list was determined using GeneSpring GX11. An identical approach was used to identify the “heart rate gene list.” Pathway enrichment analysis was carried out using Ingenuity Pathways Analysis (http://www.ingenuity.com/).
Mean c cardiac telemetry metrics.
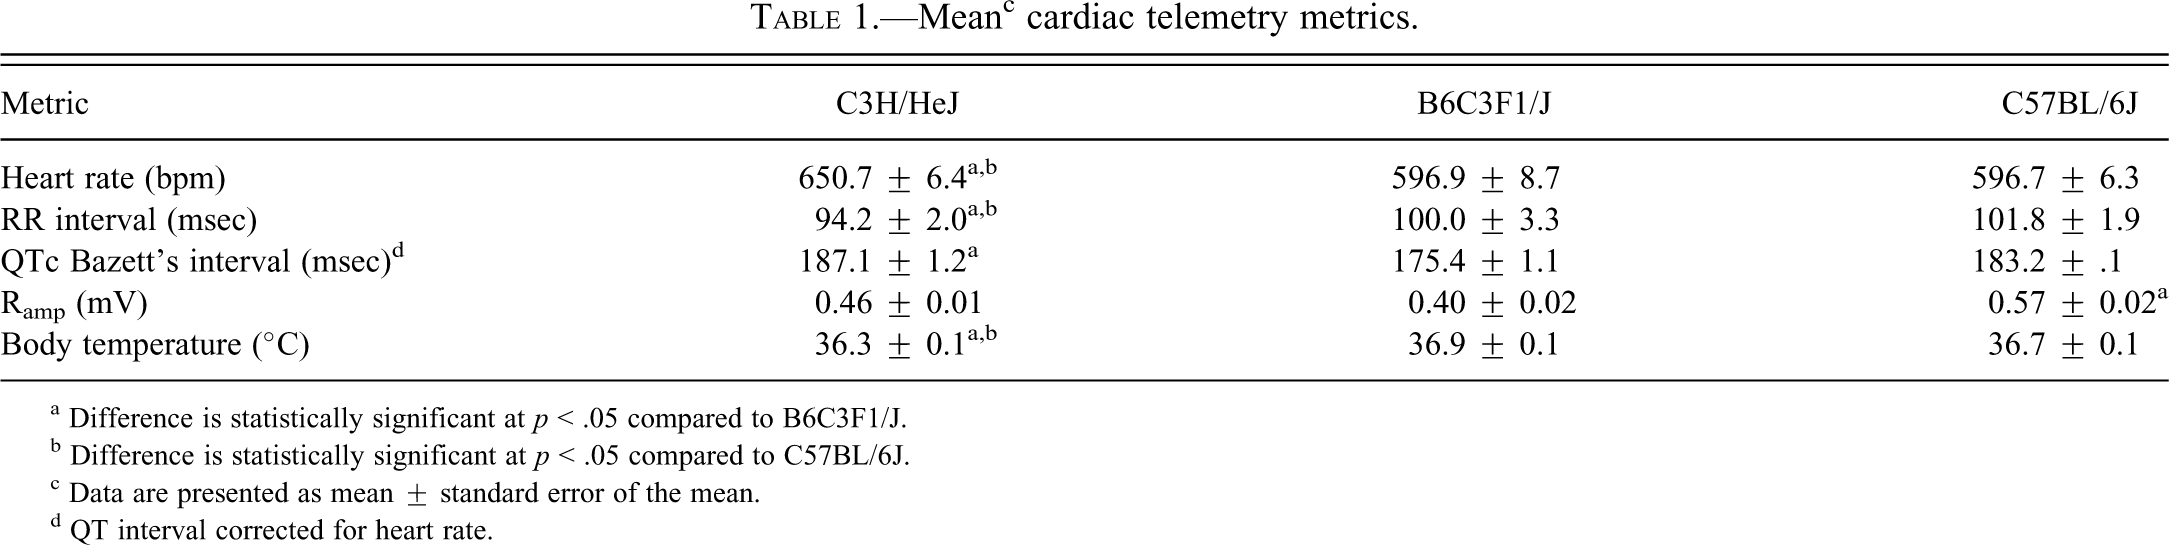
a Difference is statistically significant at p < .05 compared to B6C3F1/J.
b Difference is statistically significant at p < .05 compared to C57BL/6J.
c Data are presented as mean ± standard error of the mean.
d QT interval corrected for heart rate.
Generation and Analysis of hCM Signatures
Human cardiac gene expression (Affymetrix GeneChip HG-U133A) from normal organ donors and patients suffering from familial, hypertrophic, idiopathic dilated, ischemic, and viral hCM were downloaded in the form of .cel files from the Harvard Cardiogenomics Web site (http://cardiogenomics.med.harvard.edu/project-detail?project_id=229). Individual experiments (five total for each form of hCM) containing normal samples and samples from a specific form of hCM were created in GeneSpring 11. The Harvard Cardiogenomics data were normalized using MAS5, baseline-transformed, and filtered to retain only probes that were flagged as “present” in at least one sample. For each hCM experiment, the “present” probe sets that overlap the “present” mouse probe sets from the current experiment were selected for further analysis. The selected probe sets were then tested for association with the specific form of hCM represented in that experiment using a t test in which the p values were adjusted using the Benjamini-Hochberg FDR multiple-testing correction. The top 50 probe sets, based on corrected p value, were selected as signature genes. Log2 expression ratios (hCM/normal) were then obtained for each signature gene. Log2 expression ratios (C3H/HeJ/C57BL/6J) for probe sets corresponding to those found in each hCM signature were then obtained and compared using a correlation metric in Microsoft Excel, 2007 (Microsoft Corp., Bellevue, WA).
Coexpression Network Analysis
The gene expression correlation data for genes involved in mouse heart development were downloaded from the StarNet2 Web site (Jupiter and VanBuren 2008) (http://vanburenlab.medicine.tamhsc.edu/CorrelationsDev.txt.gz) on January 4, 2010. The mouse heart developmental cohort was selected because disease processes such as CM often lead to the activation of developmental pathways in an attempt to repair the damaged tissue (Chien and Olson 2002). There were around 133 million pairs of gene expression correlations reported. A cutoff value of 0.90 for correlation with a corresponding significance cutoff 1e-10 was used to filter this list down to around 100 thousand pairs of genes and to create an associated network of correlated genes. This stringent cutoff was used because of lack of RAM to handle networks greater than this size. There were 3308 genes in the network. We denote this network by Nc. Let Vc denote the set of genes in this network.
The list of genes with significant differences in gene expressions across at least one of the three strains had 2074 genes. We denote this list by Ls. This list was mapped onto the 3308-gene network. There were 376 genes in common. We denote this number by Ncommon.
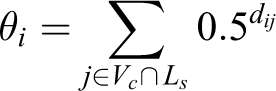
The node influence score of gene i in the network Nc is denoted by θi. Let dij denote the distance between genes i and j in the network Nc. The node influence score is defined as
The significance of the node influence scores are computed using a gene permutation test. The null hypothesis of the test states that it is equally likely for every gene in the network Nc to belong to the list Ls.
The test is based on a 1000 simulations. During each simulation s, a random set of Ncommon
genes are chosen from the set Vc. The node influence scores are denoted as Θi
s. The p value for the influence score of node i is then computed as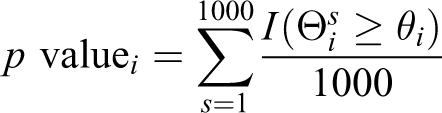
ConcensusPathDB Analysis
All probe sets that exhibited significant differential expression by one-way ANOVA (all genes listed in Supplementary Table 1) were subject to a neighborhood analysis using the ConcensusPathDB (http://cpdb.molgen.mpg.de/) (Kamburov et al. 2009). To carry out this analysis, human orthologues (identified using the Ensembl Biomart tool at http://uswest.ensembl.org/index.html) were used. The settings for the 1-next neighborhood analysis were as follows: minimal set size = 25, minimal connectivity, minimal number of contained candidates = 10, p value cutoff = .001, index = 0. The settings for the 2-next neighborhood analysis were as follows: minimal set size = 25, minimal connectivity, minimal number of contained candidates = 25, p value cutoff =.001, index = 0.
Identification of Genetic Variation
All nonsynonymous single-nucleotide polymorphisms that differ between the C57BL/6J and C3H/HeJ mice were identified using the Ensemble Biomart tool. All expression quantitative trait loci (eQTL) from the “BHF2 (ApoE-null) UCLA (June05)” brain, adipose, and liver database were downloaded from the GeneNetwork database (http://www.genenetwork.org/) (Wu et al. 2004). The BHF2 (ApoE-null) datasets are derived from multi-tissue, genome-wide mRNA expression studies that employed 334 BxH (C57BL/6J X C3H/HeJ) F2 mice that were homozygous null for ApoE (Yang et al. 2006). Genes with cis-eQTLs (peak QTL [quantified as an LRS value] found within ten megabases of that gene) in all three data sets were identified. For a detailed explanation of LRS values, the reader is referred to the GeneNetwork Glossary of Terms (http://www.genenetwork.org/glossary.html). Overlap between the genes with multi-tissue cis-eQTLs and significantly enriched gene nodes was then determined. We employed only cis-eQTLs in our analysis because they tend to be conserved across tissues (Meng et al. 2007; Yang et al. 2006), and therefore there is an increased likelihood that the cis-eQTLs that are identified in the brain, adipose, and liver datasets from GeneNetwork would also be found in cardiac muscle.
Results
Electrophysiology
Electrocardiogram evaluations showed quantitative differences among C3H/HeJ, B6C3F1/J, and C57BL/6J mice. As expected, heart rates covaried in the three strains, and heart rates were higher at night than during the day (data not shown). The C3H/HeJ mice had a 9% higher heart rate, and a 6%-8% shorter RR interval compared to the B6C3F1/J and C57BL/6J mice (Table 1). The heart rate corrected QT interval was longer in the C3H/HeJ mice compared to the B6C3F1 mice. Ramp was shorter in the C57BL/6J mice when compared to the B6C3F1/J mice. Core body temperature of the C3H/HeJ mice was lower than that of the B6C3F1/J and C57BL/6J mice.
Histopathology
Histopathologic analysis of the hearts showed that only the C3H/HeJ mouse had a background minimal focal mCM (Table 2 and Figure 1) involving 1%–10% of the heart section. Murine progressive cardiomyopathy is considered a spontaneous, progressive, age-related, degenerative spectrum of lesions consisting of focal to multifocal myocyte degeneration and/or necrosis, increased interstitial fibrous connective tissue, and minimal infiltrate of mononuclear inflammatory cells (Ruben et al. 2000). C3H/HeJ mice had one or two foci of degeneration between two longitudinal heart organ cross-sections of minimal severity. Foci were distributed throughout the apex, ventricle, and intraventricular septum, hence it is likely that differential gene expression found in apex samples reflects patterns observed in other regions of the heart. Each focus generally involved a single myocardial fiber with vacuolization, fragmentation, aggregation, and hyalinization of the cytoplasm. A few mononuclear cells often penetrated affected fibers. This was considered a very minimal mCM, without signs of clinical toxicity, or adverse effects and would not be anticipated to effect the survival of the animals in a two-year study.
Cardiac histopathology.
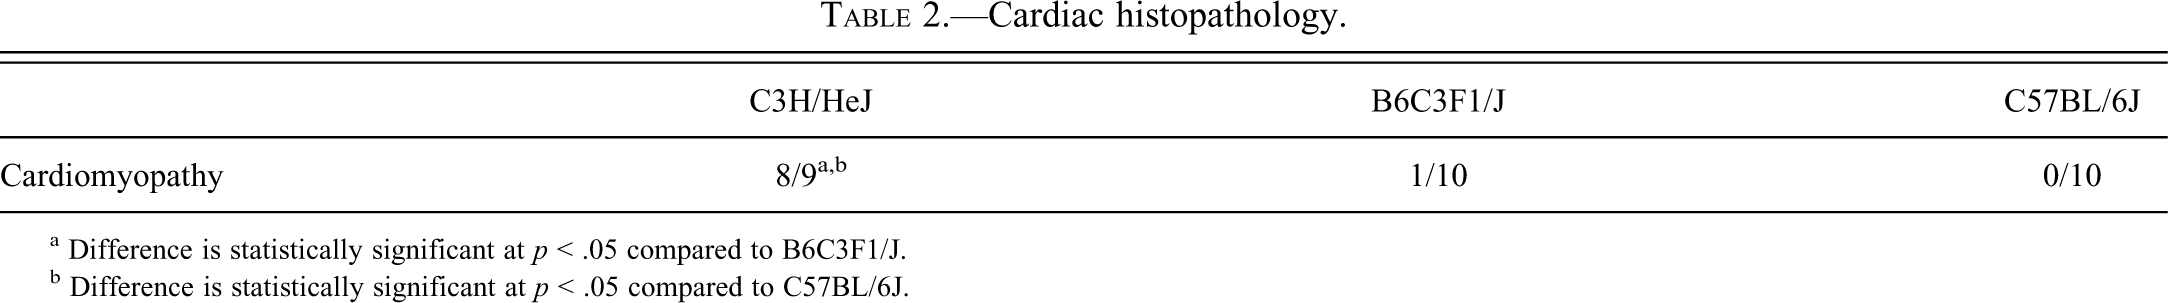
a Difference is statistically significant at p < .05 compared to B6C3F1/J.
b Difference is statistically significant at p < .05 compared to C57BL/6J.
Example histopathological focus identified in a C3H/HeJ mouse heart that is indicative of minimal CM. Note low magnification view (4X) of the heart. Arrow indicates the location of a single focus of cardiomyopathy. On the lower right side of the photo, there is a high magnification inset (40X), showing the minimal focal mononuclear inflammatory cells, composing the cardiomyopathy.
Differential Gene Expression
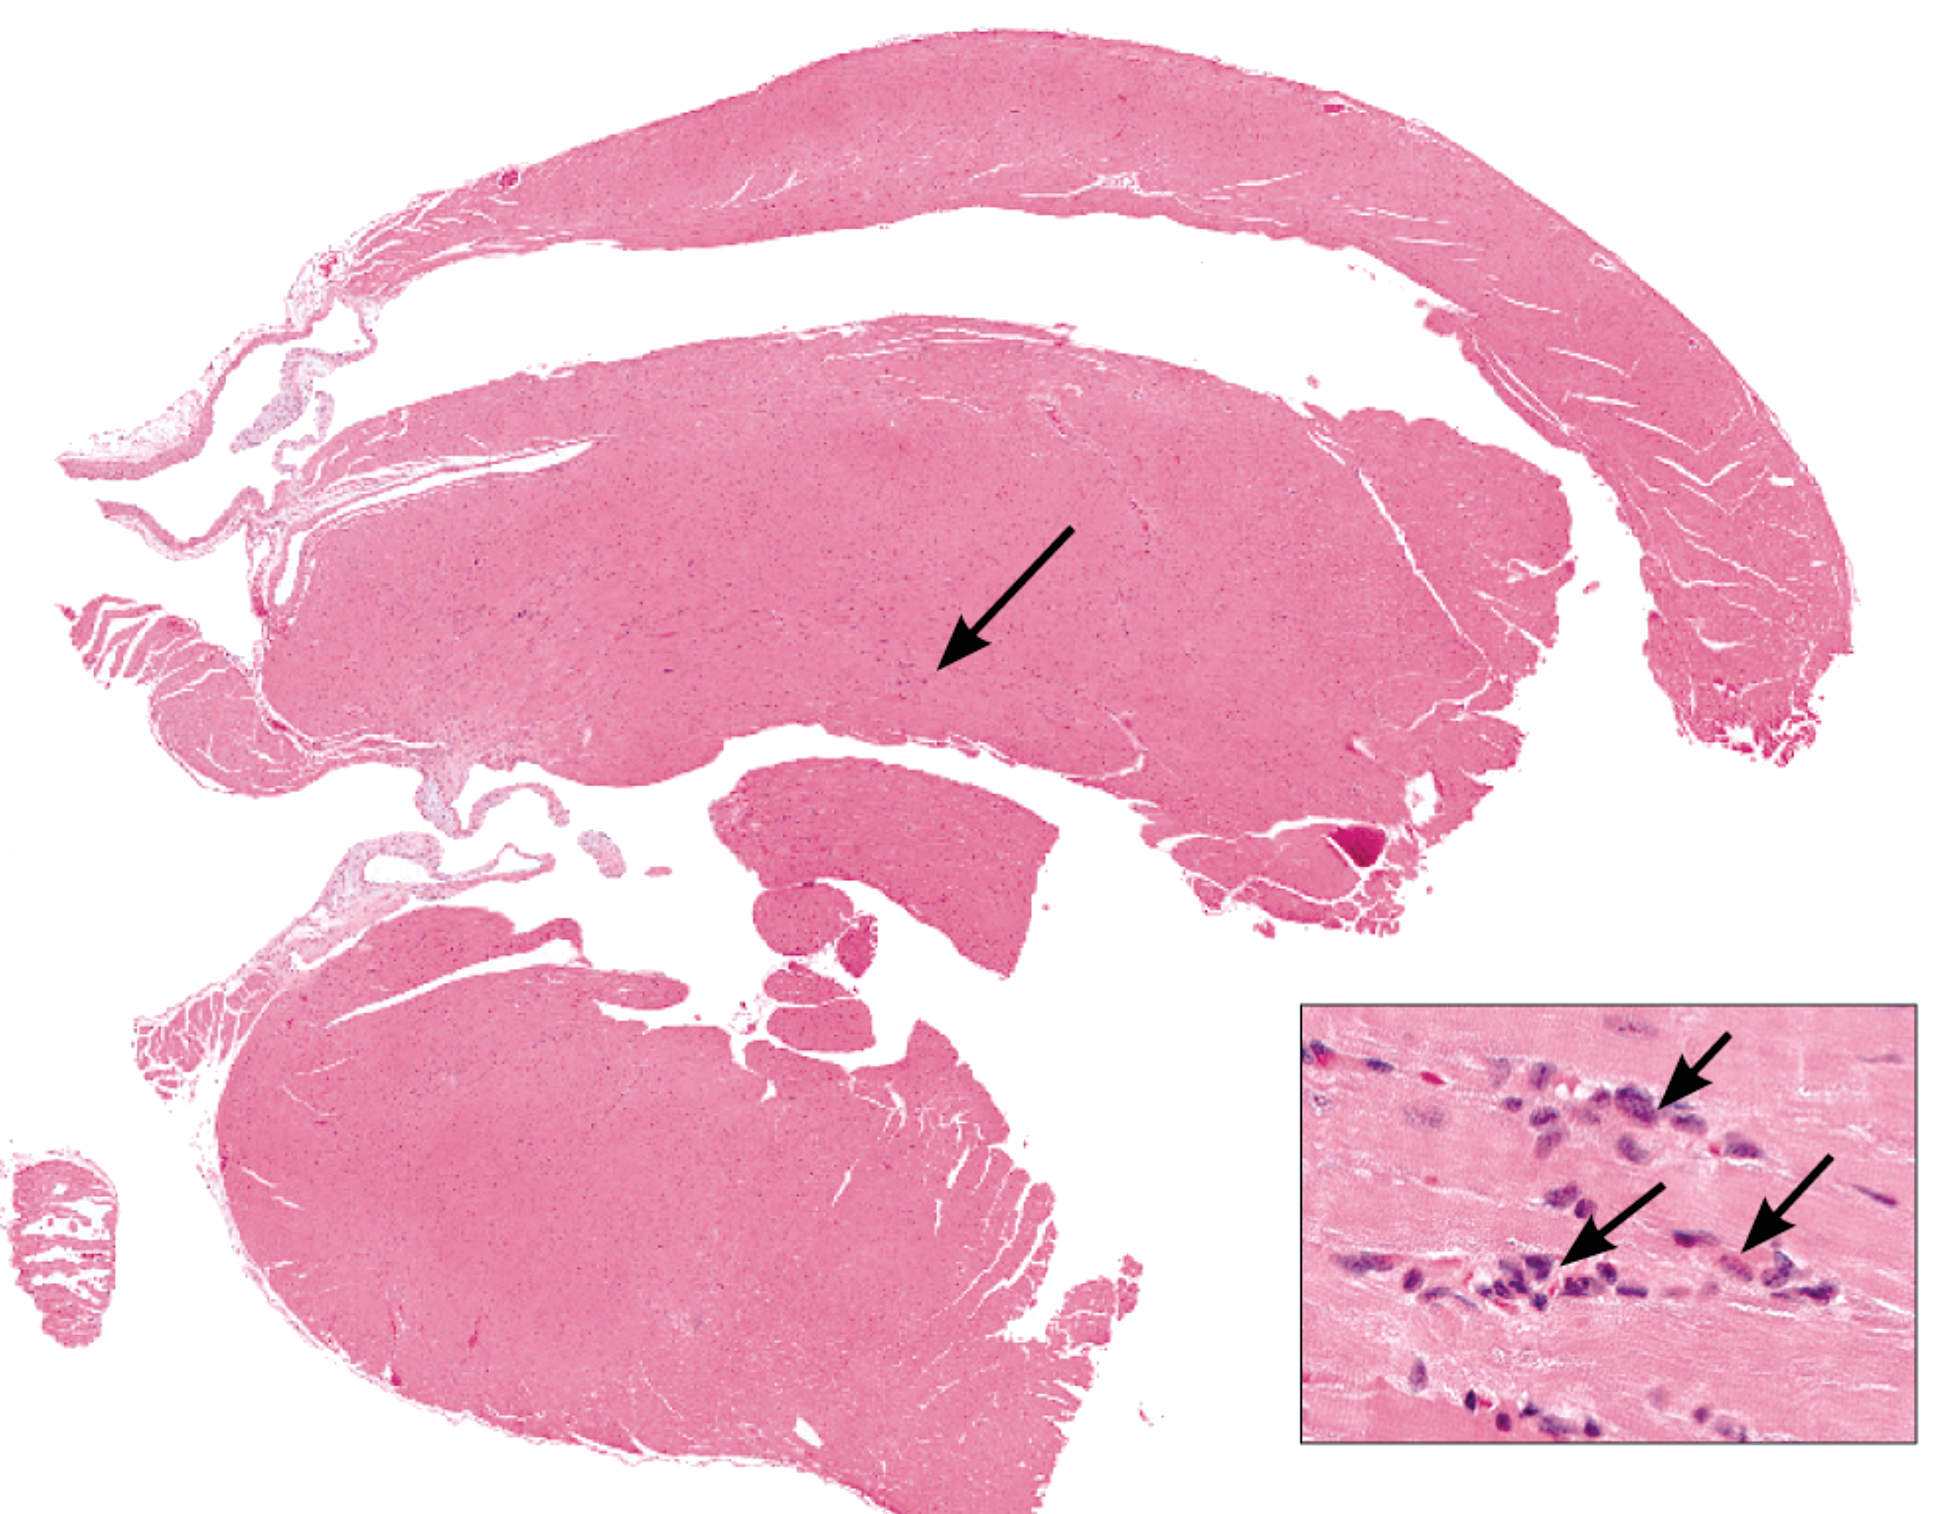
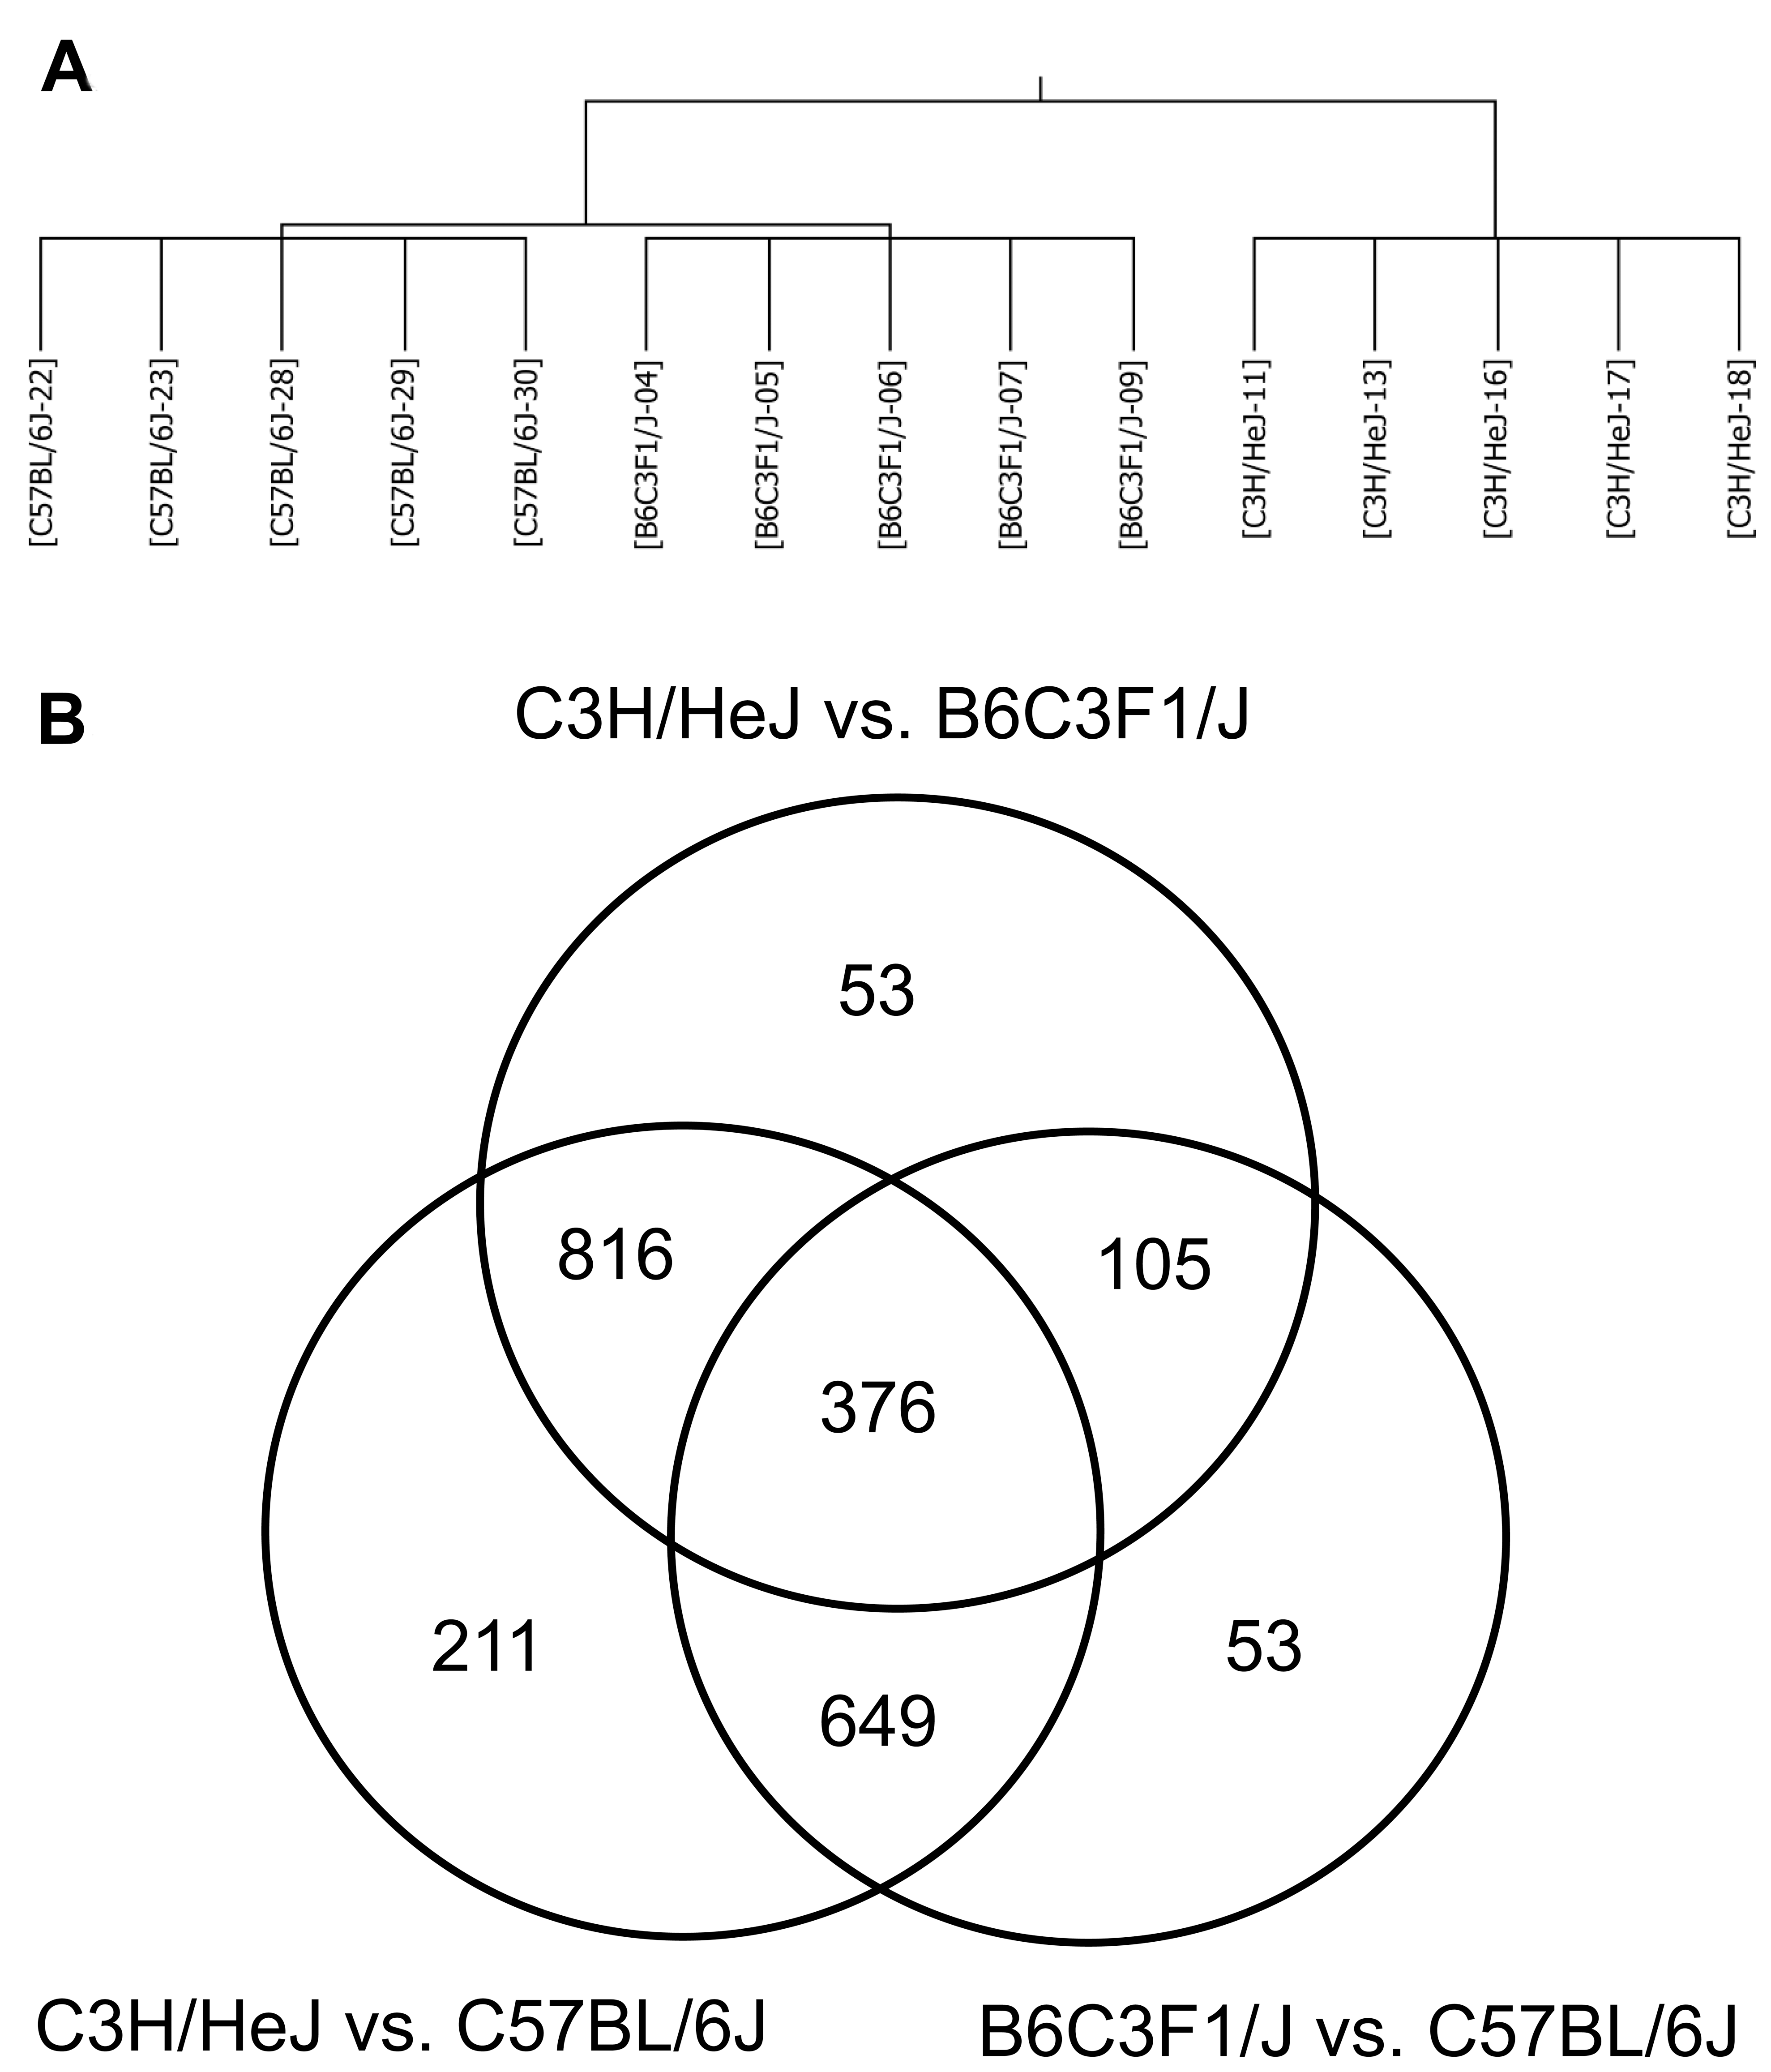
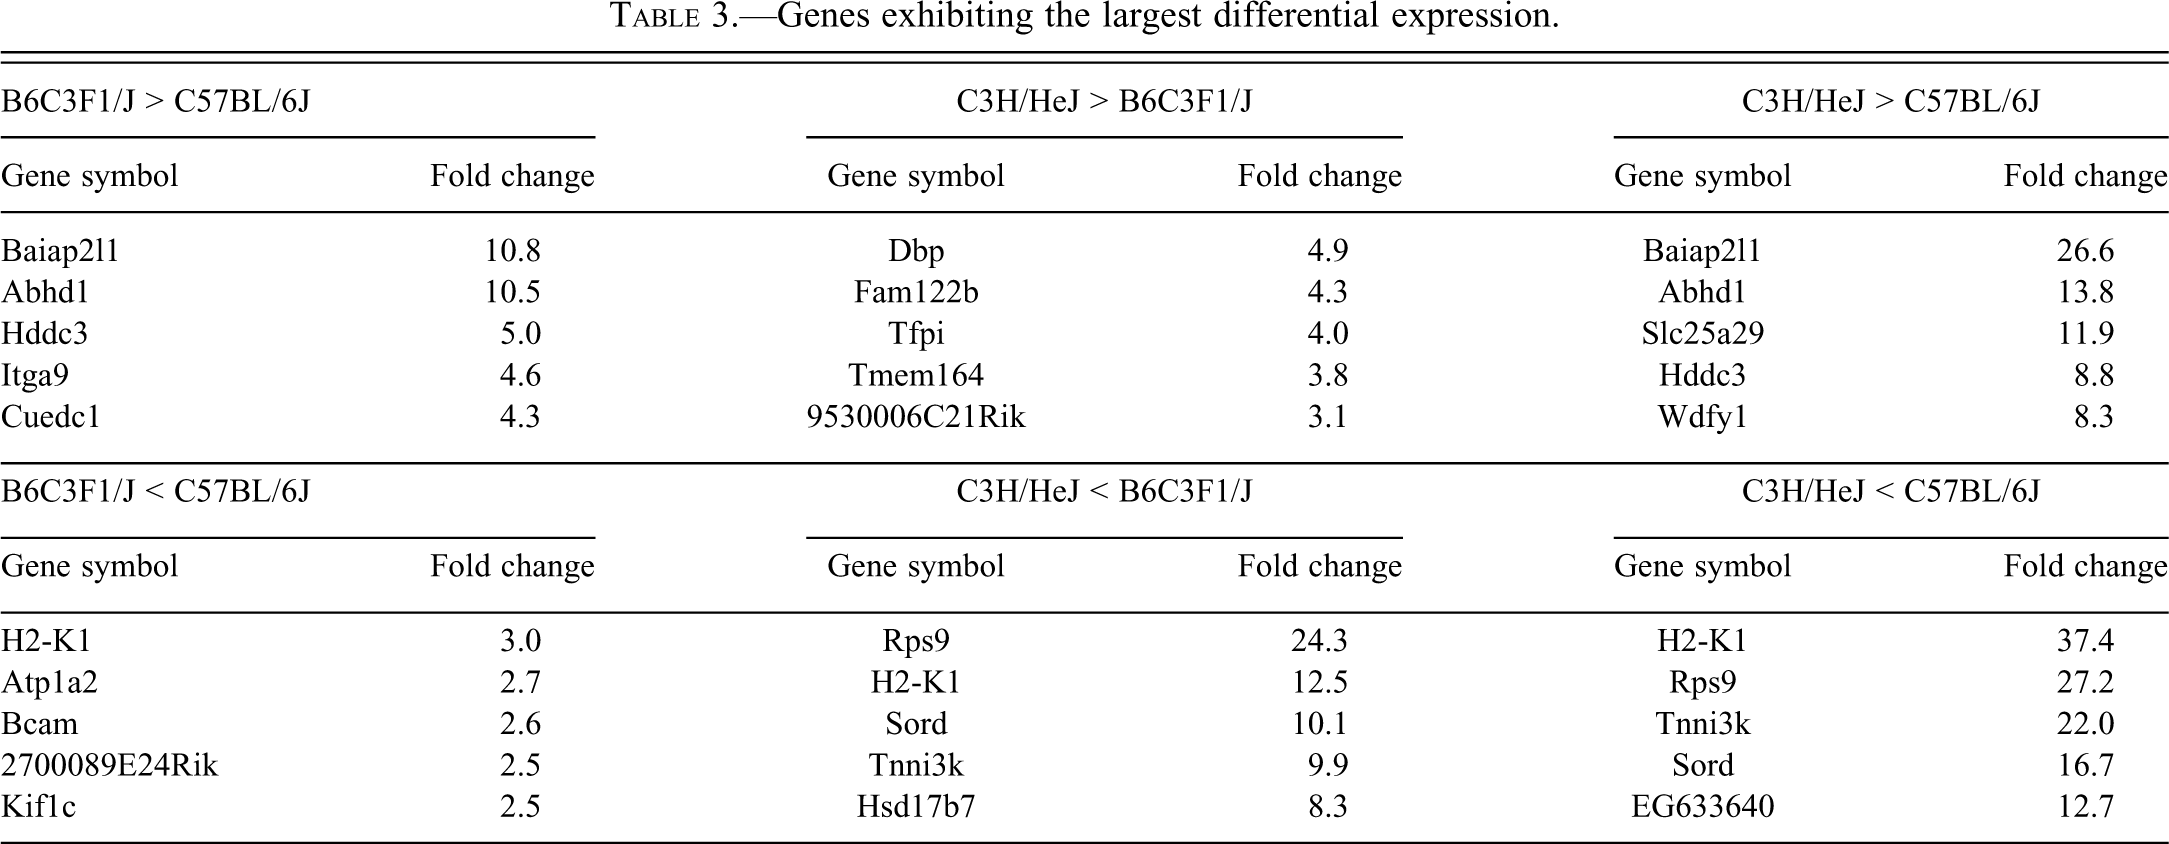
Analysis of variance (p < .05) analysis identified 2263 probe sets that exhibited significant differential expression between the three strains. A self-organizing map of the 2263 probe sets revealed the B6C3F1/J mice exhibited an expression pattern that was largely intermediate to the two parental strains with slight bias toward the C57BL/6J mice (Figure 2a). A complete list of probe sets exhibiting significant differential expression can be found in Supplementary Table 1. A Tukey HSB posttest identified 1183, 1350, and 2052 probe sets that exhibited significant differential expression between B6C3F1/J and C57BL/6J, C3H/HeJ and B6C3F1/J, and C3H/HeJ and C57BL/6J, respectively (Figure 2b and annotated in Supplementary Table 1, columns R, S and T). Genes exhibiting the largest differential expression between the strains are shown in Table 3. Of particular note is Tnni3k (higher expression in C57BL/6J), which is structurally polymorphic (missense mutations) between the strains and is a genetic modifier in the calsequestrin transgenic model of cardiomyopathy (Wheeler et al. 2009). Importantly, a comparison of global gene expression changes between C3H/HeJ mice with and without telemetry implants indicated there was no effect of the implant on cardiac gene expression (data not shown).
Overview of microarray results. (A) Self organizing map based on probe sets that were differentially expressed between the 2 strains and the F1 hybrid. (B) Venn diagram illustrating the overlap of differentially expressed probe sets as determined by a Tukey honestly significant difference post-test.
Genes exhibiting the largest differential expression.
Disease-centric Enrichment Analysis
Considering that low-grade mCM was consistently observed in the C3H/HeJ mice, but not in the other groups of mice, we wanted to determine whether the differentially expressed genes are disproportionately associated with cardiac or muscle pathology. Using the CoPub microarray analysis tool, we identified diseases whose associated genes were overrepresented in genes identified in the ANOVA analysis, including heart hypertrophy and mCM (Table 4; Supplementary Table 2). Many of these disease gene sets identified, although not specifically associated with heart disease, are plausibly related to processes that are altered in cardiac disease, for example, hypoxia and starvation (related to metabolic adaptations following cardiac challenge). Differentially expressed genes that are specifically associated with CM (pan-species) in the CoPub and GeneCards databases were used to create a self-organizing map (Figure 3; Supplementary Table 1, column U). Using this gene set, the mice cluster into three groups; the B6C3F1/J mice cluster more closely to the C57BL/6J mice. The CM-associated genes that are expressed at relatively higher levels in C3H/HeJ mice are involved in PAK (Raf1, Pdgfa, Mapk8, Mapk10, My14), PDGF (Raf1, Pdgfa, Mapk8, Stat3), and ILK (Myh6, Mapk8, Mapk10, My14, Myh7) signaling, whereas genes that are expressed at relatively higher levels in C57BL/6J mice populate pathways associated with metabolic disease (Prkaa2, Cd36, Prkce, Tnfrsf1b) and mitochondrial dysfunction (Sdha, Xdh, Htra2, Ndufs4). Also notable is the differential expression of genes associated with the sarcoglycan complex (Higher in C3H/HeJ: Sgcb and Sgca; Higher in C57BL/6J: Sgcg).
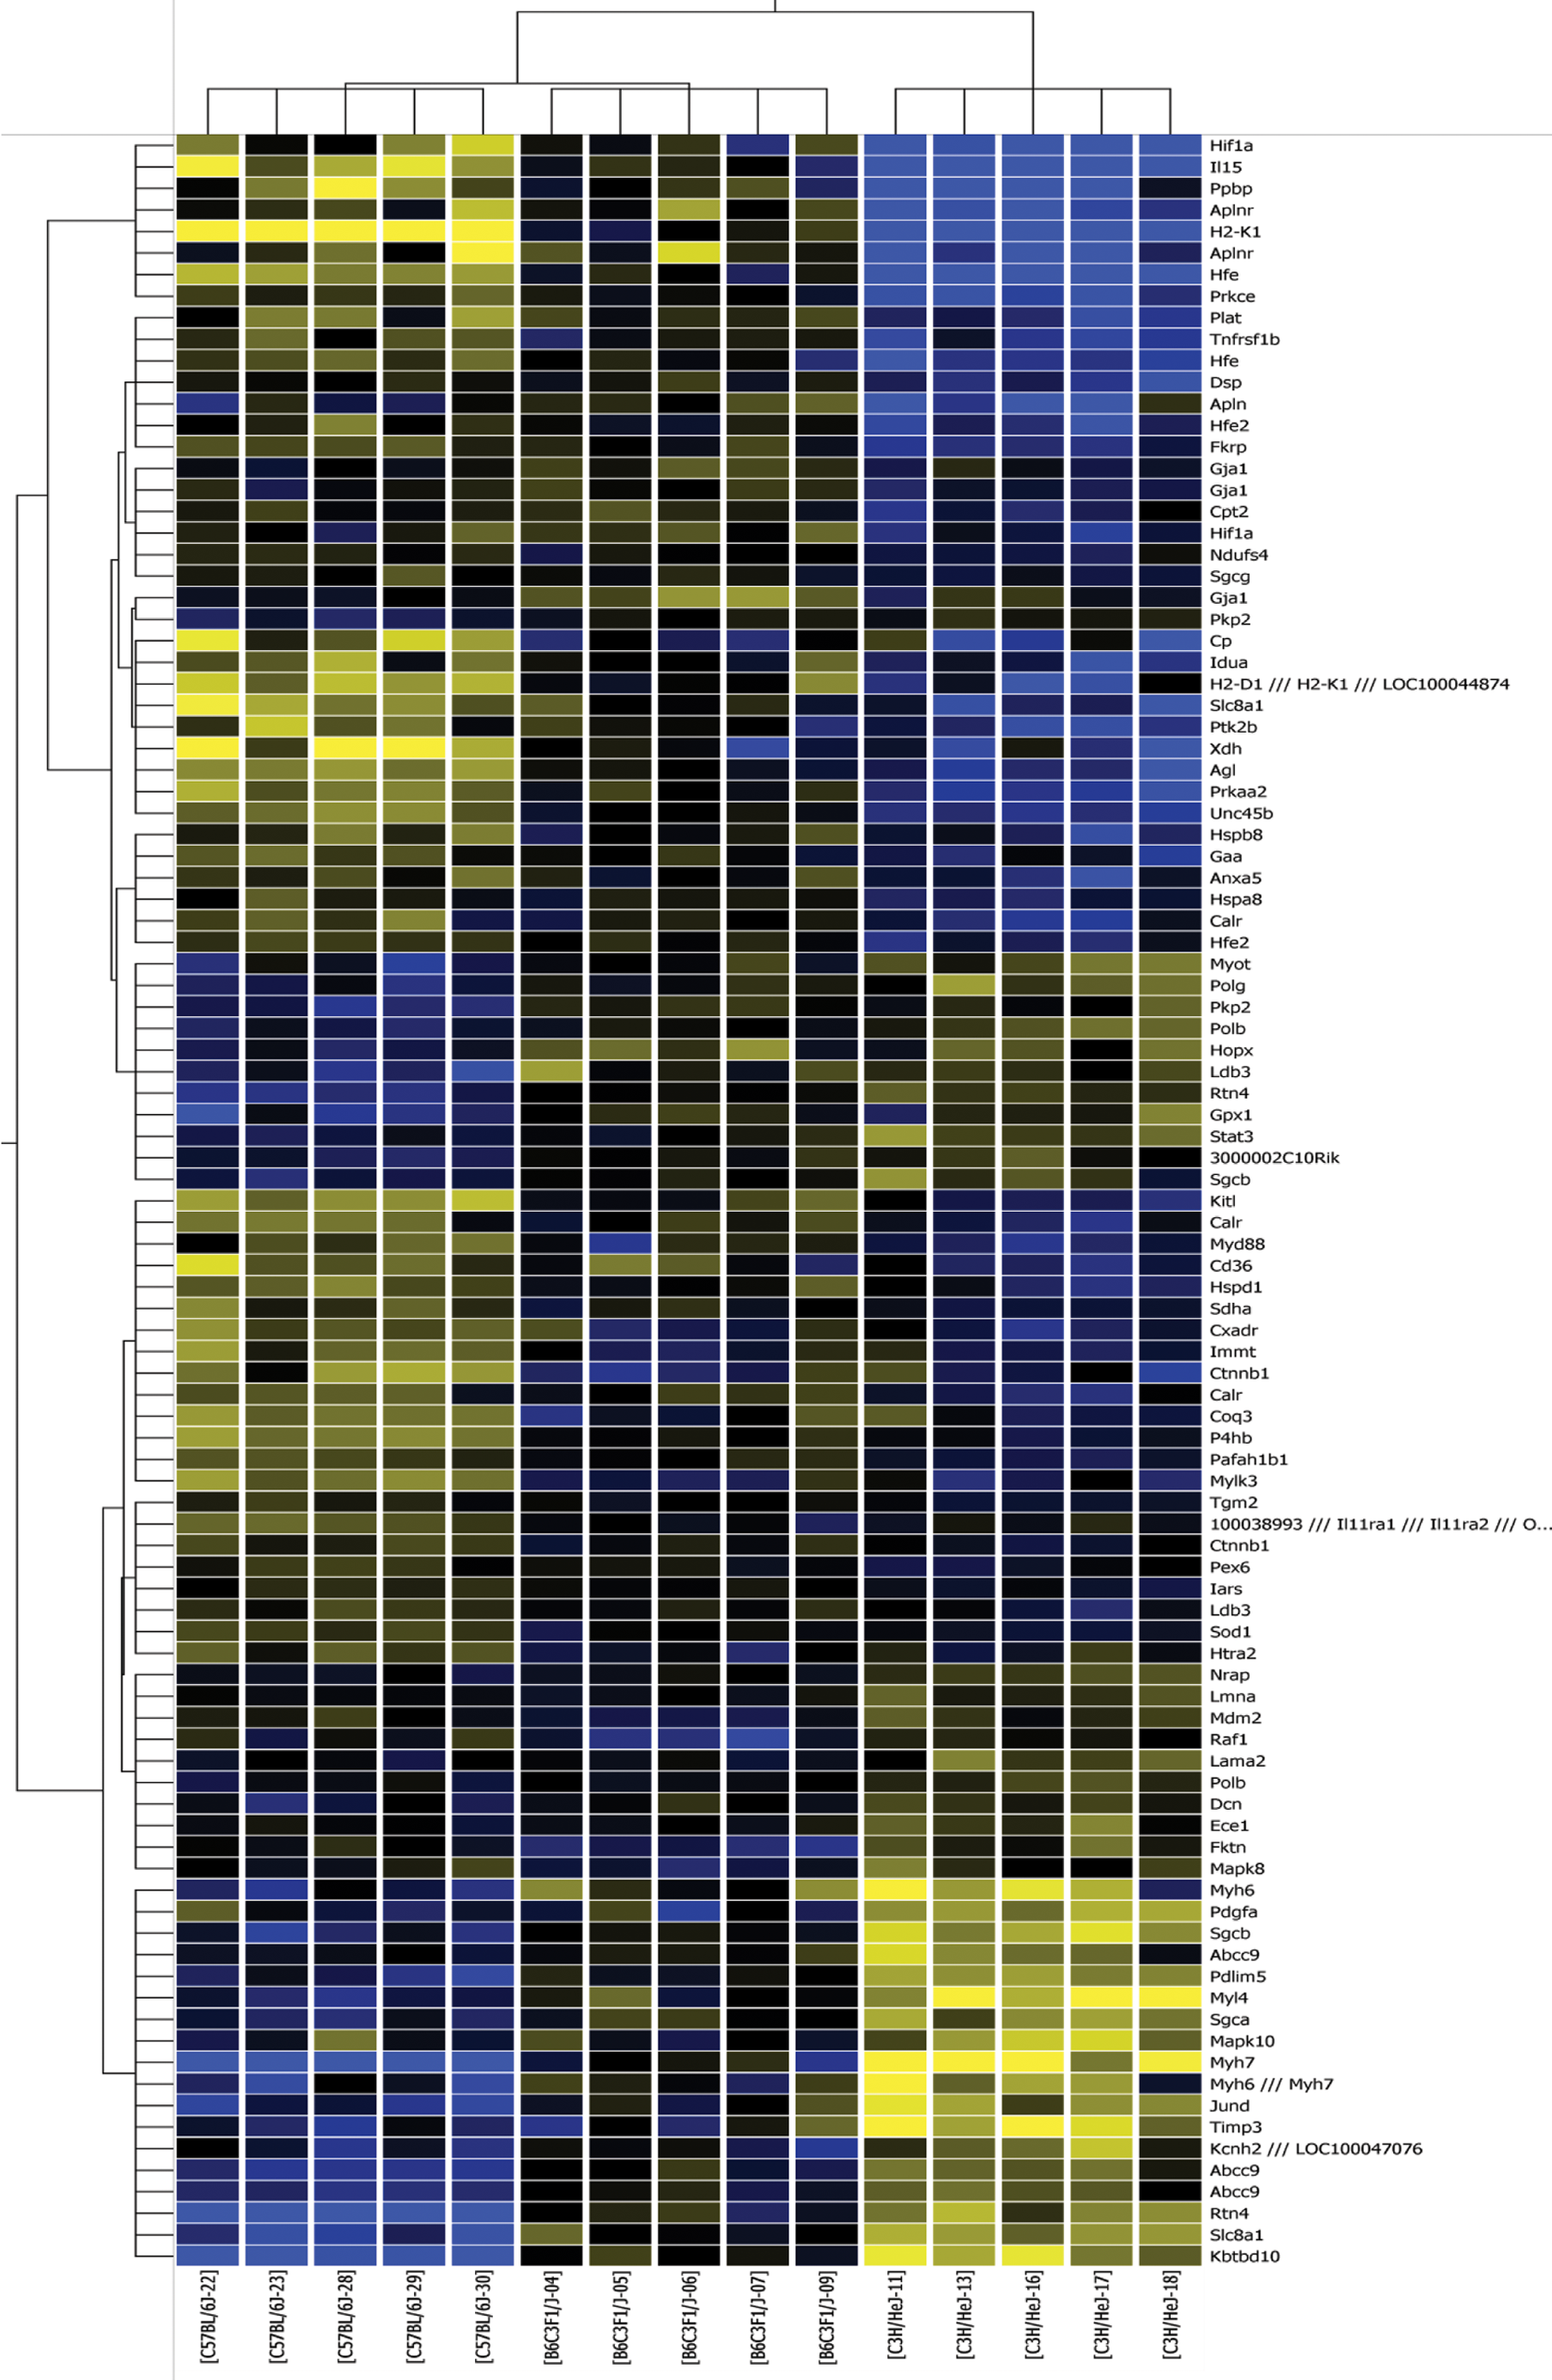
Cluster diagram of CM associated genes. Blue indicates lower and yellow indicates higher expression relative to the mean expression of a gene across the dataset. Duplicate genes indicate multiple probes for the same gene were differentially expressed.
Copub disease-centric enrichment analysis of all differentially expressed genes.
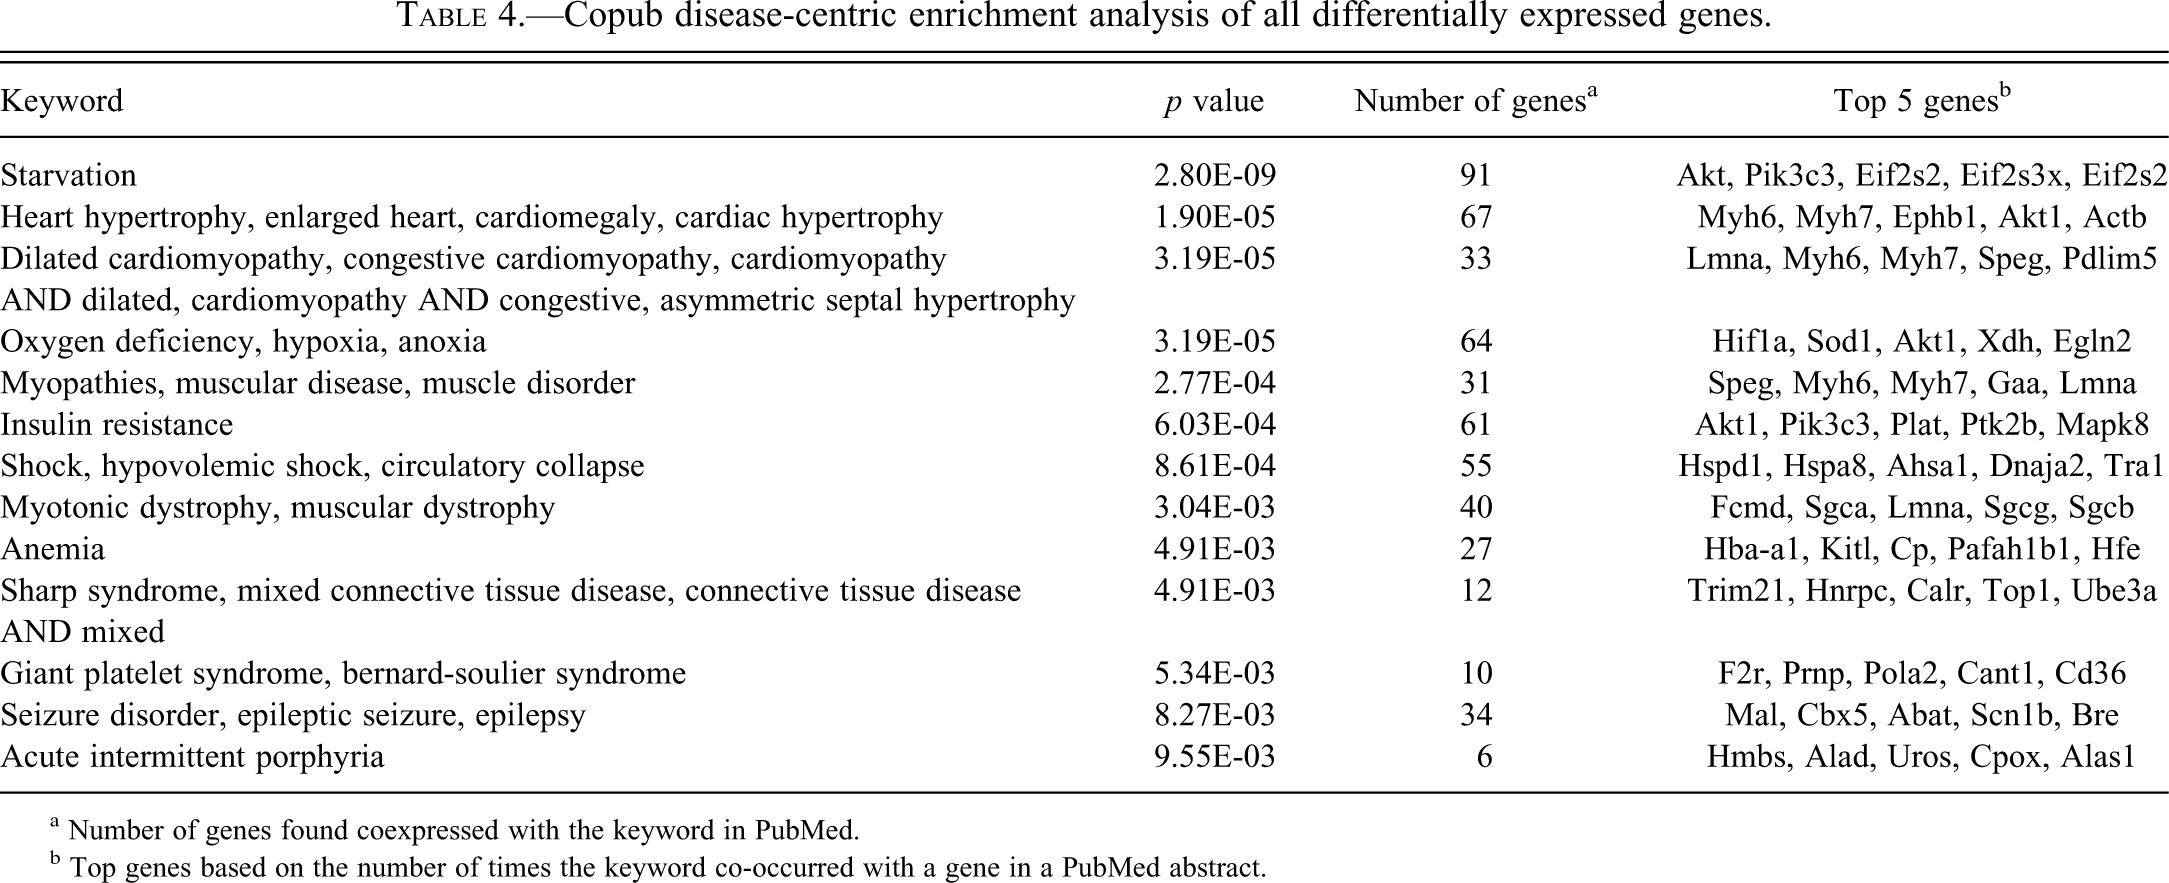
a Number of genes found coexpressed with the keyword in PubMed.
b Top genes based on the number of times the keyword co-occurred with a gene in a PubMed abstract.
A correlation analysis using the C3H/HeJ/C57BL/6J expression ratio and signatures derived from different forms of hCM indicated the mCM observed in the C3H/HeJ mice most closely resembles hCM that is a byproduct of an ischemia (Figure 4).
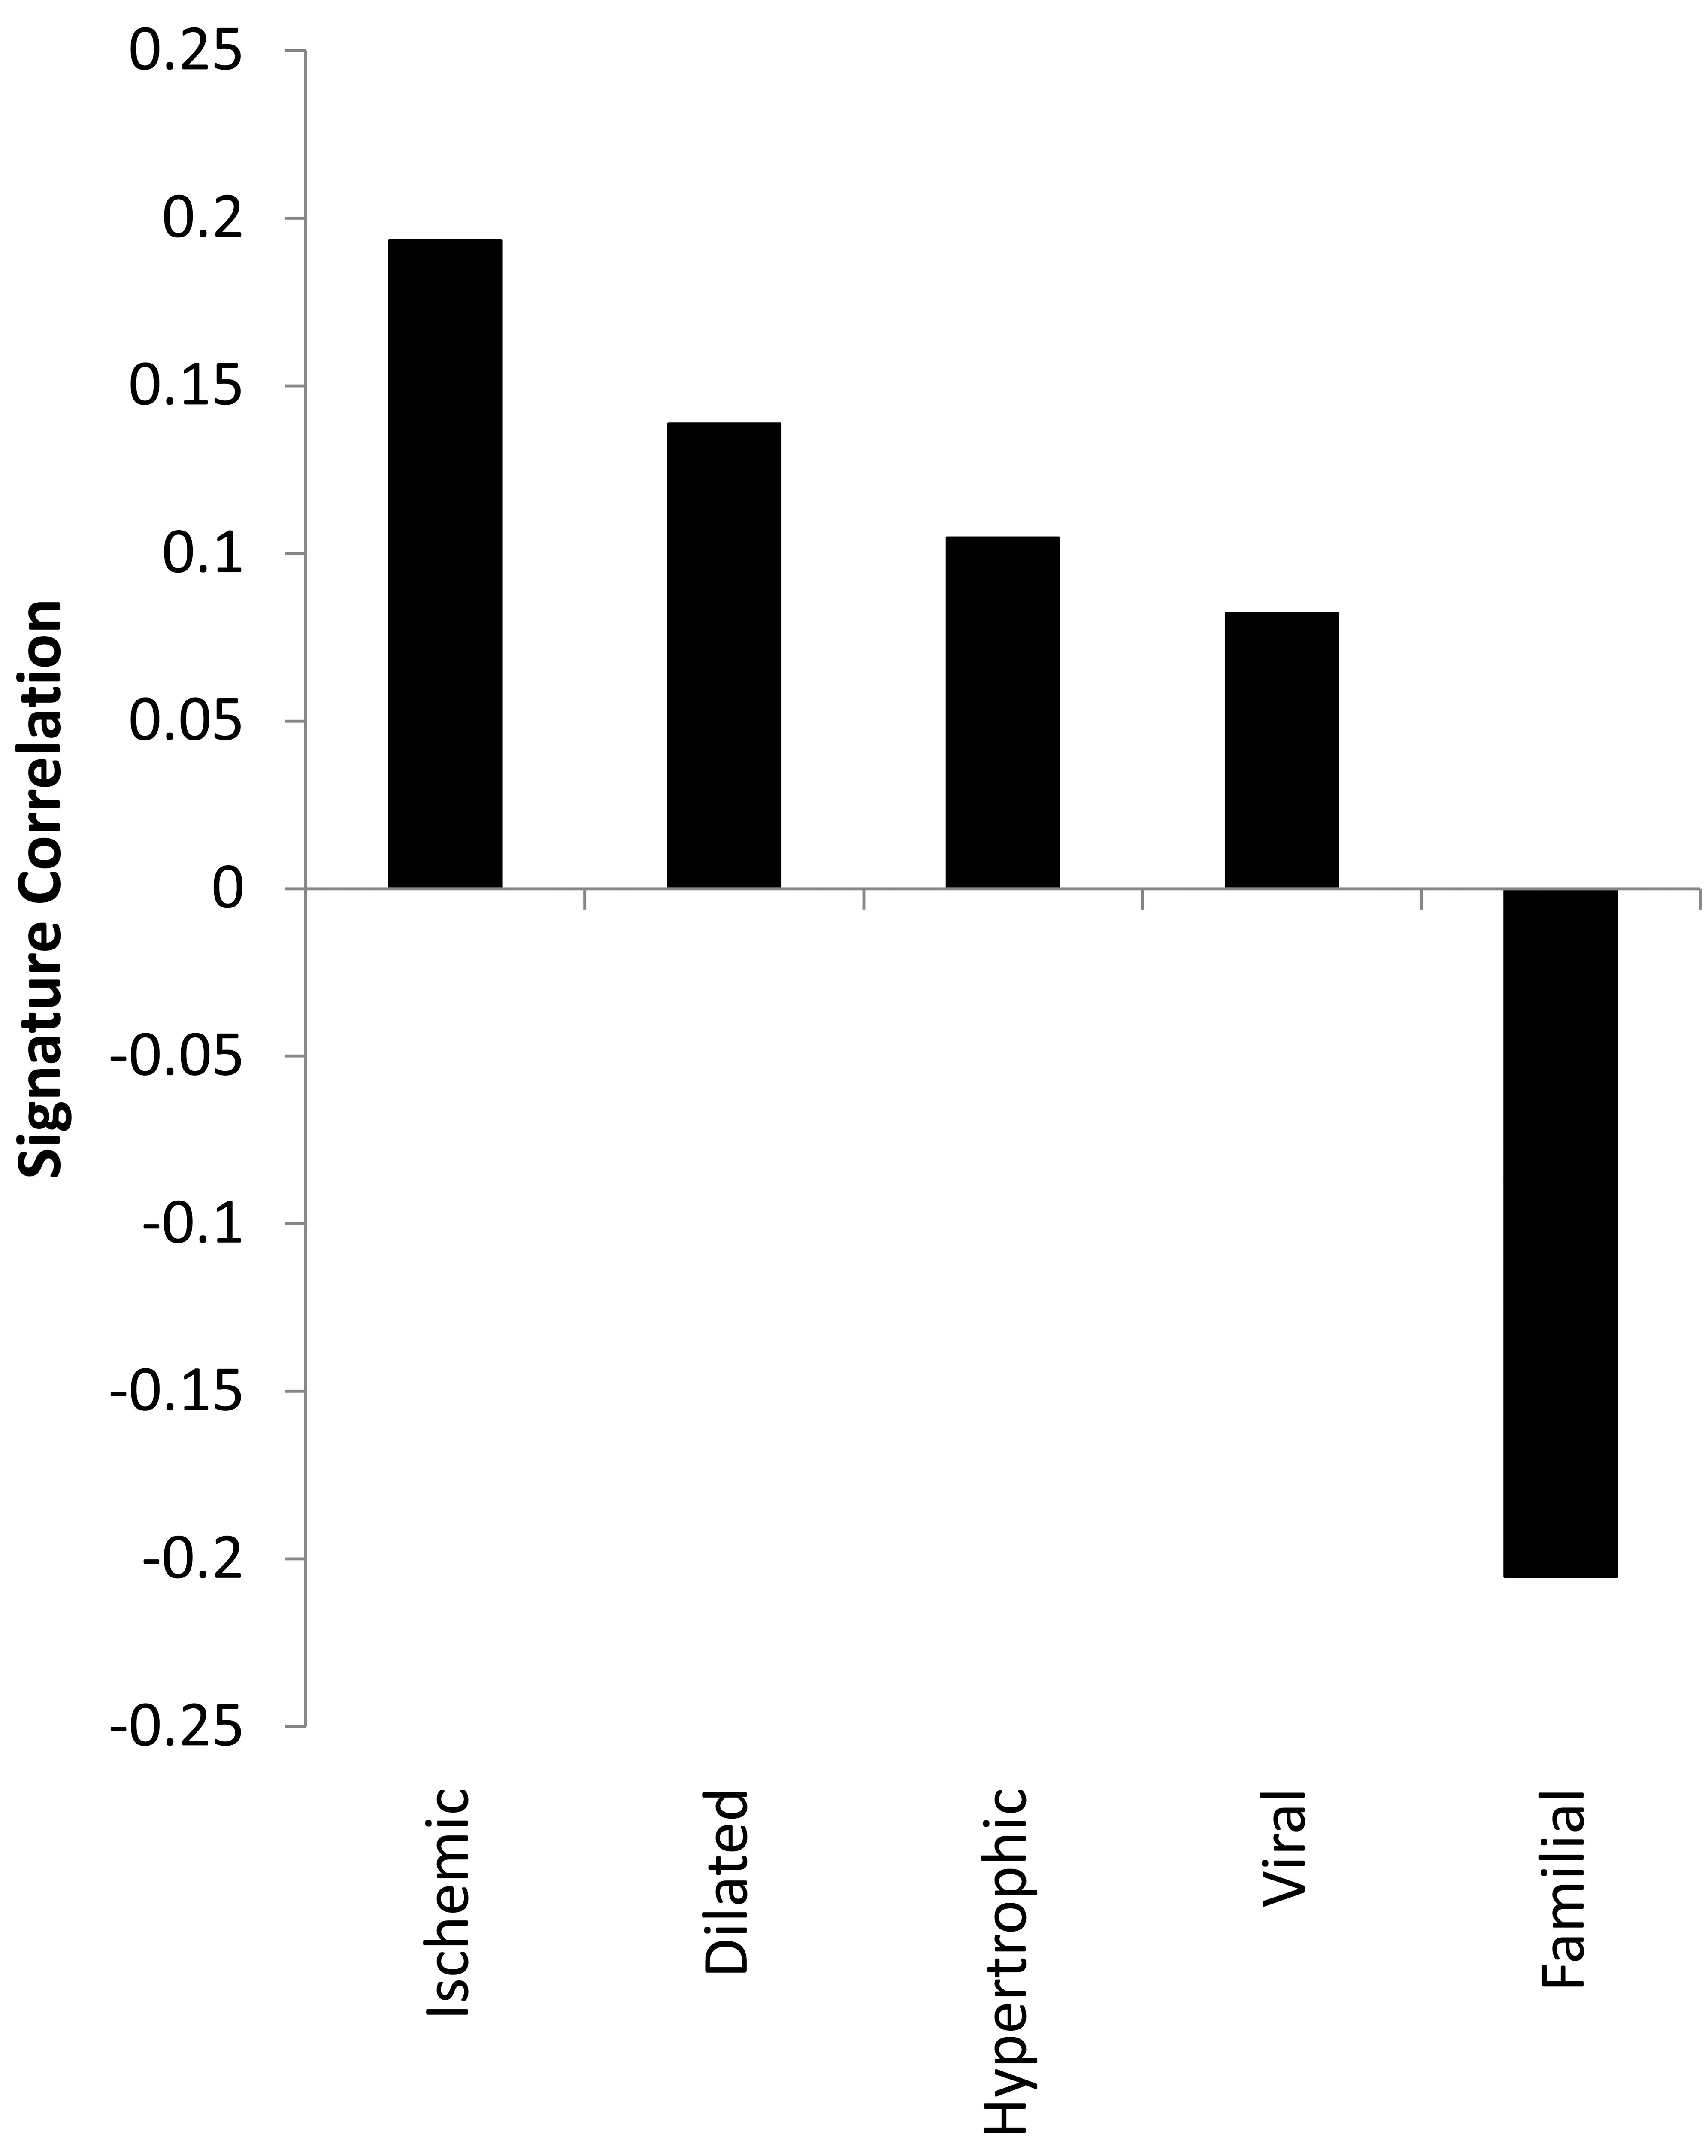
Correlation with genomic signatures of human CM. The Log2 (C3H/HeJ/C57BL/6J) expression ratios were compared using a correlation metric to 50 gene signatures derived from data reflecting 5 forms of human CM. Human CM signatures are the 50 probe sets exhibiting the lowest corrected p-value from a t-test that compared genome-wide expression from diseased and non-disease cardiac tissue. The signatures are Log2 (Disease/Non-diseased) expression ratios for the top 50 probe sets (as define by p-value) for each comparison. The complete human CM signatures are in Supplementary 3.
The C3H/HeJ mice had higher heart rates than the B6C3F1/J and C57BL/6J mice. A search for differentially expressed genes that have been associated with heart rate identified genes that are involved in calcium homeostasis (Casq2, Calr, and Asph) and sodium/potassium transport (Abcc9, Atp1a2, Kcnh2, and Gja1) (Supplementary Table 1, column V).
Ingenuity Pathways Enrichment Analysis
The most enriched pathways from each comparison are shown in Tables 5, 6, and 7, and the complete list can be found in Supplementary Table 4. Genes differentially expressed between C57BL/6J (no mCM) and B6C3F1/J (low incidence mCM) mice (Table 5) populated pathways associated with translation (generally higher expression in C57BL/6J), amino acid/fatty acid metabolism (generally higher expression in C57BL/6J), intermediate metabolism (generally higher expression in C57BL/6J), actin cytoskeleton signaling (generally higher expression in B6C3F1/J), Akt signaling (generally higher expression in B6C3F1/J), and PKA signaling (generally higher expression in B6C3F1/J). Genes differentially expressed between B6C3F1/J (low-incidence mCM) and C3H/HeJ (high-incidence mCM) (Table 6) mice populated pathways associated with mTor signaling (generally higher expression in B6C3F1/J), amino acid/fatty acid metabolism (generally higher expression in B6C3F1/J), actin cytoskeleton signaling (generally higher expression in C57BL/6J), and PKA/Adrenergic signaling (generally higher expression in C3H/HeJ). Pathways enriched by genes differentially expressed between C57BL/6J (no mCM) and C3H/HeJ (high-incidence mCM) (Table 7) are largely a composite of the other two comparisons. Genes that were expressed at higher levels in C57BL/6J mice populated pathways that control adaptation to energy deficiencies (mTor and AMPK), whereas genes that were expressed at higher levels in C3H/HeJ mice populated pathways associated with cAMP/PKA/Adrenergic signaling.
Ingenuity Canonical Pathway enrichment analysis: C57BL/6J vs. B6C3F1/J. c
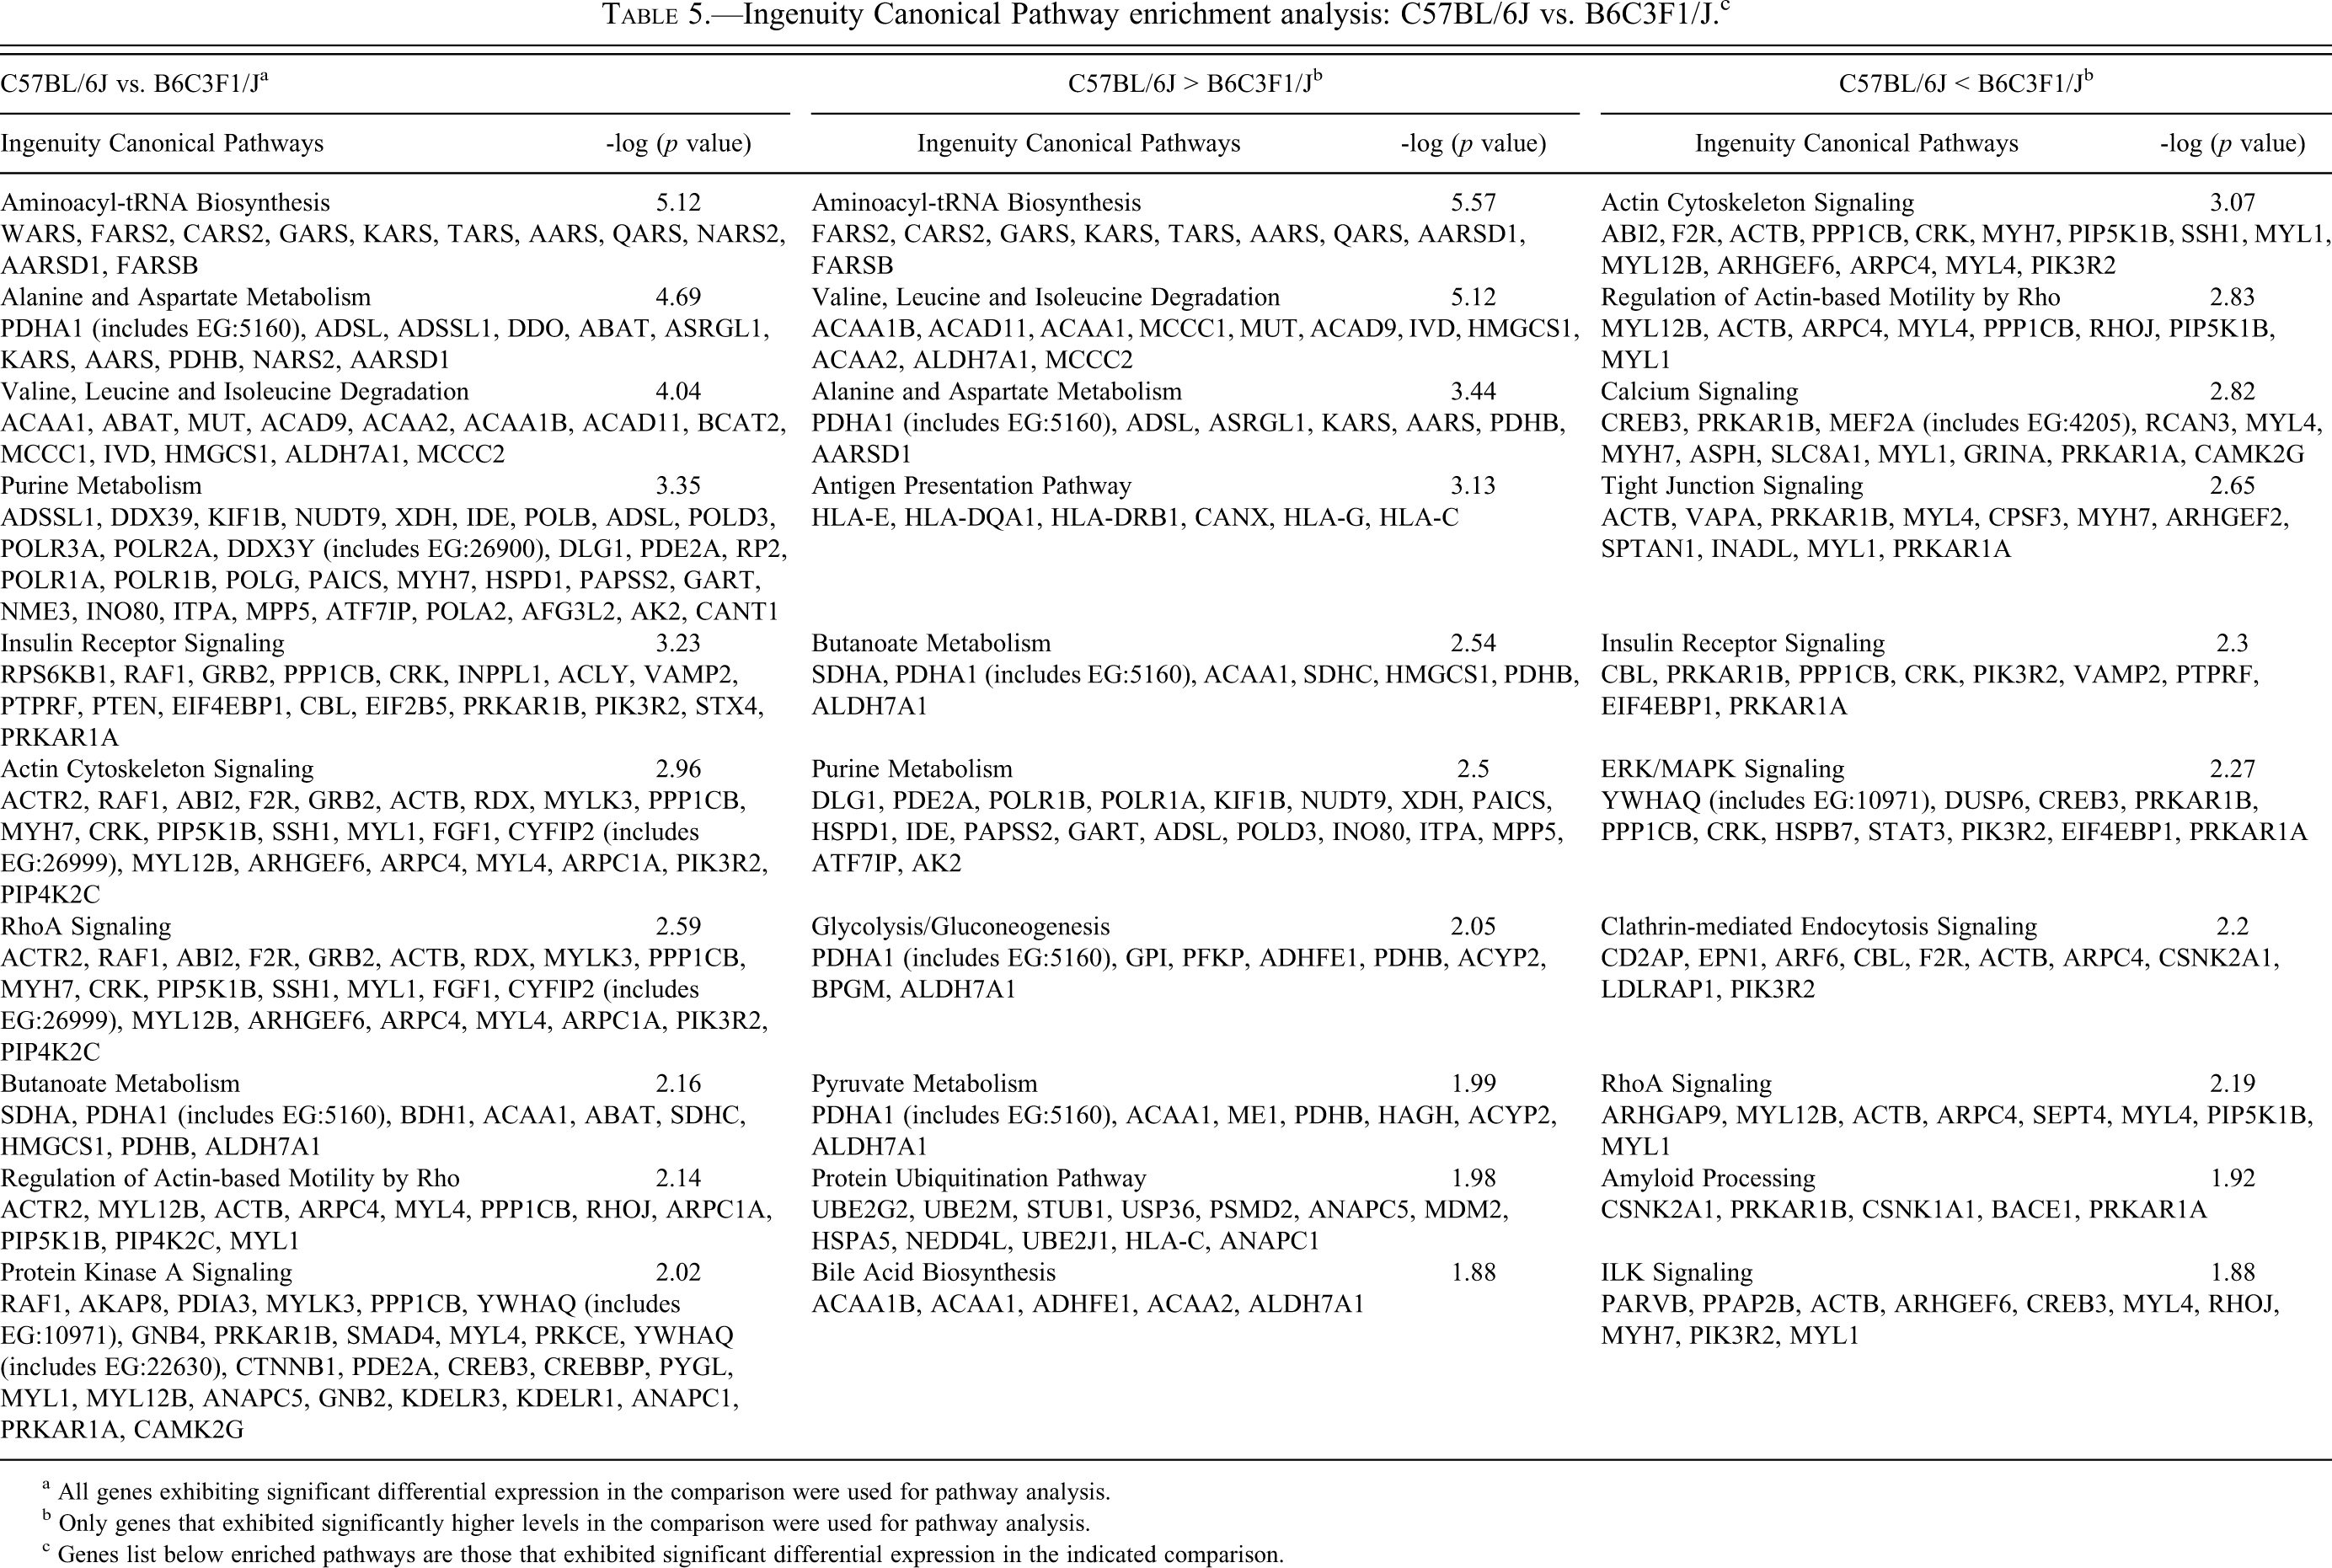
a All genes exhibiting significant differential expression in the comparison were used for pathway analysis.
b Only genes that exhibited significantly higher levels in the comparison were used for pathway analysis.
c Genes list below enriched pathways are those that exhibited significant differential expression in the indicated comparison.
Ingenuity canonical pathway enrichment analysis: B6C3F1/J vs. C3H/HeJ.
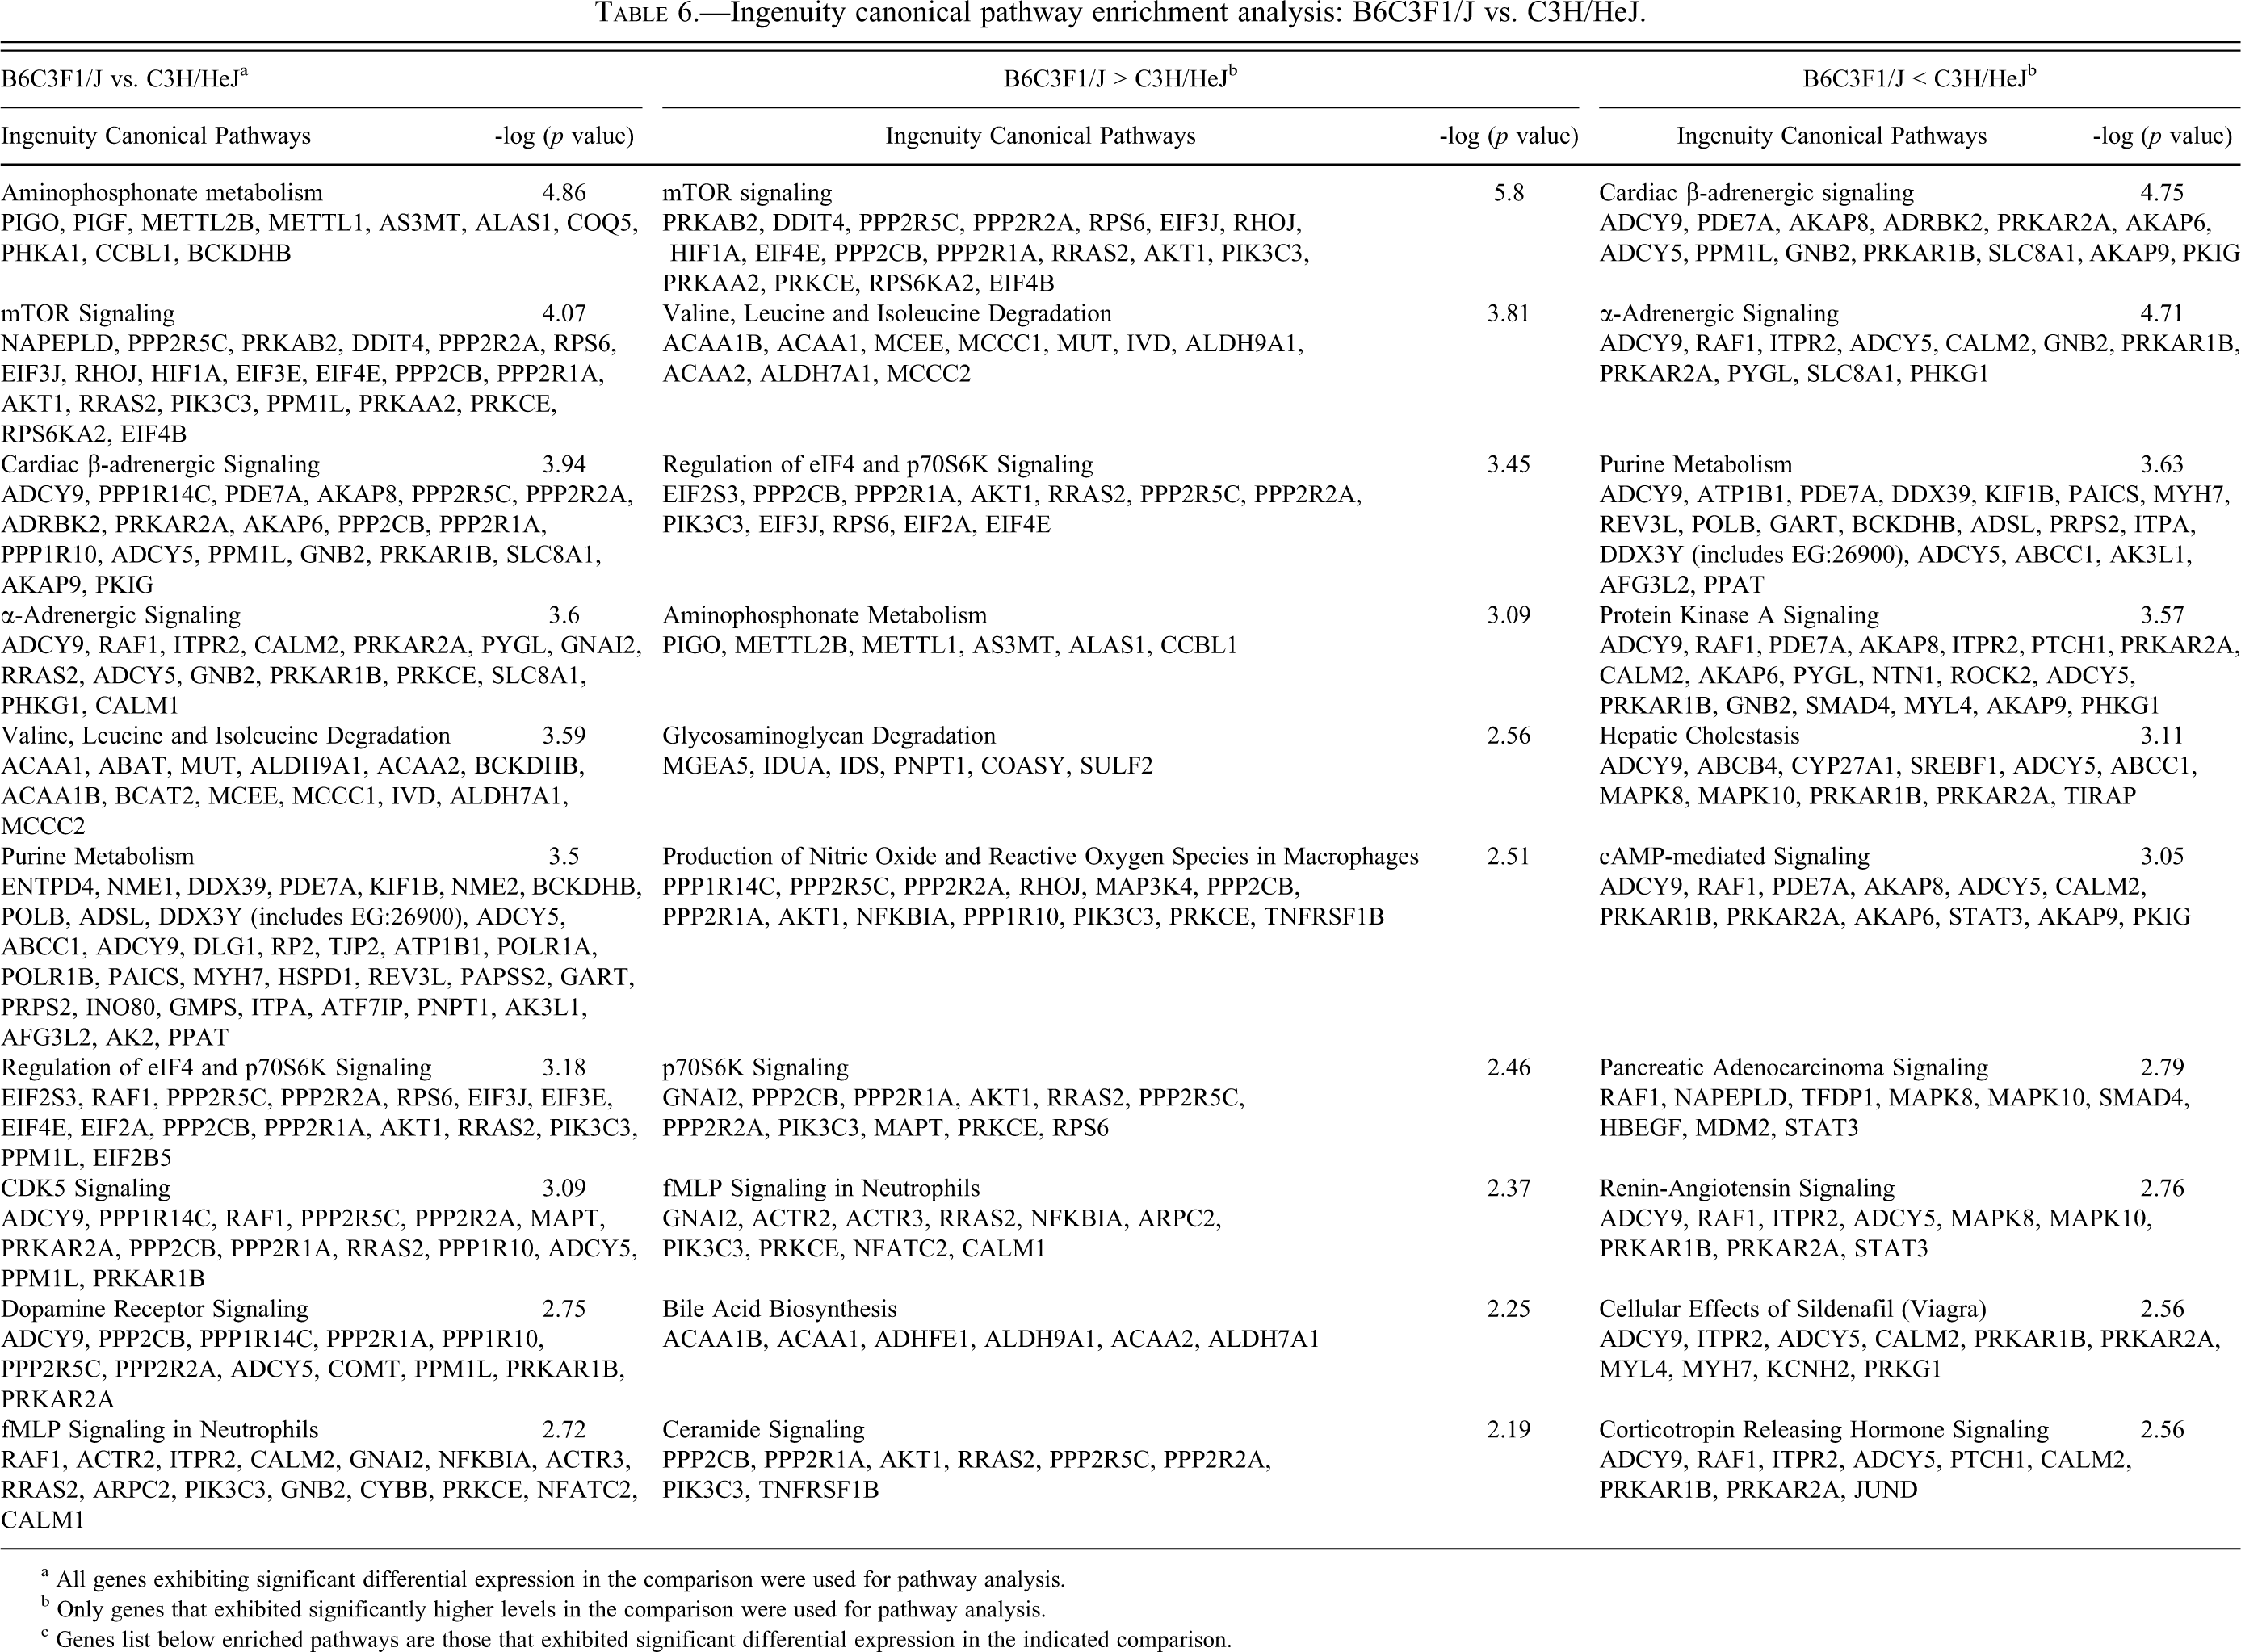
a All genes exhibiting significant differential expression in the comparison were used for pathway analysis.
b Only genes that exhibited significantly higher levels in the comparison were used for pathway analysis.
c Genes list below enriched pathways are those that exhibited significant differential expression in the indicated comparison.
Ingenuity Canonical Pathway enrichment analysis: C67BL/6J vs. C3H/HeJ.
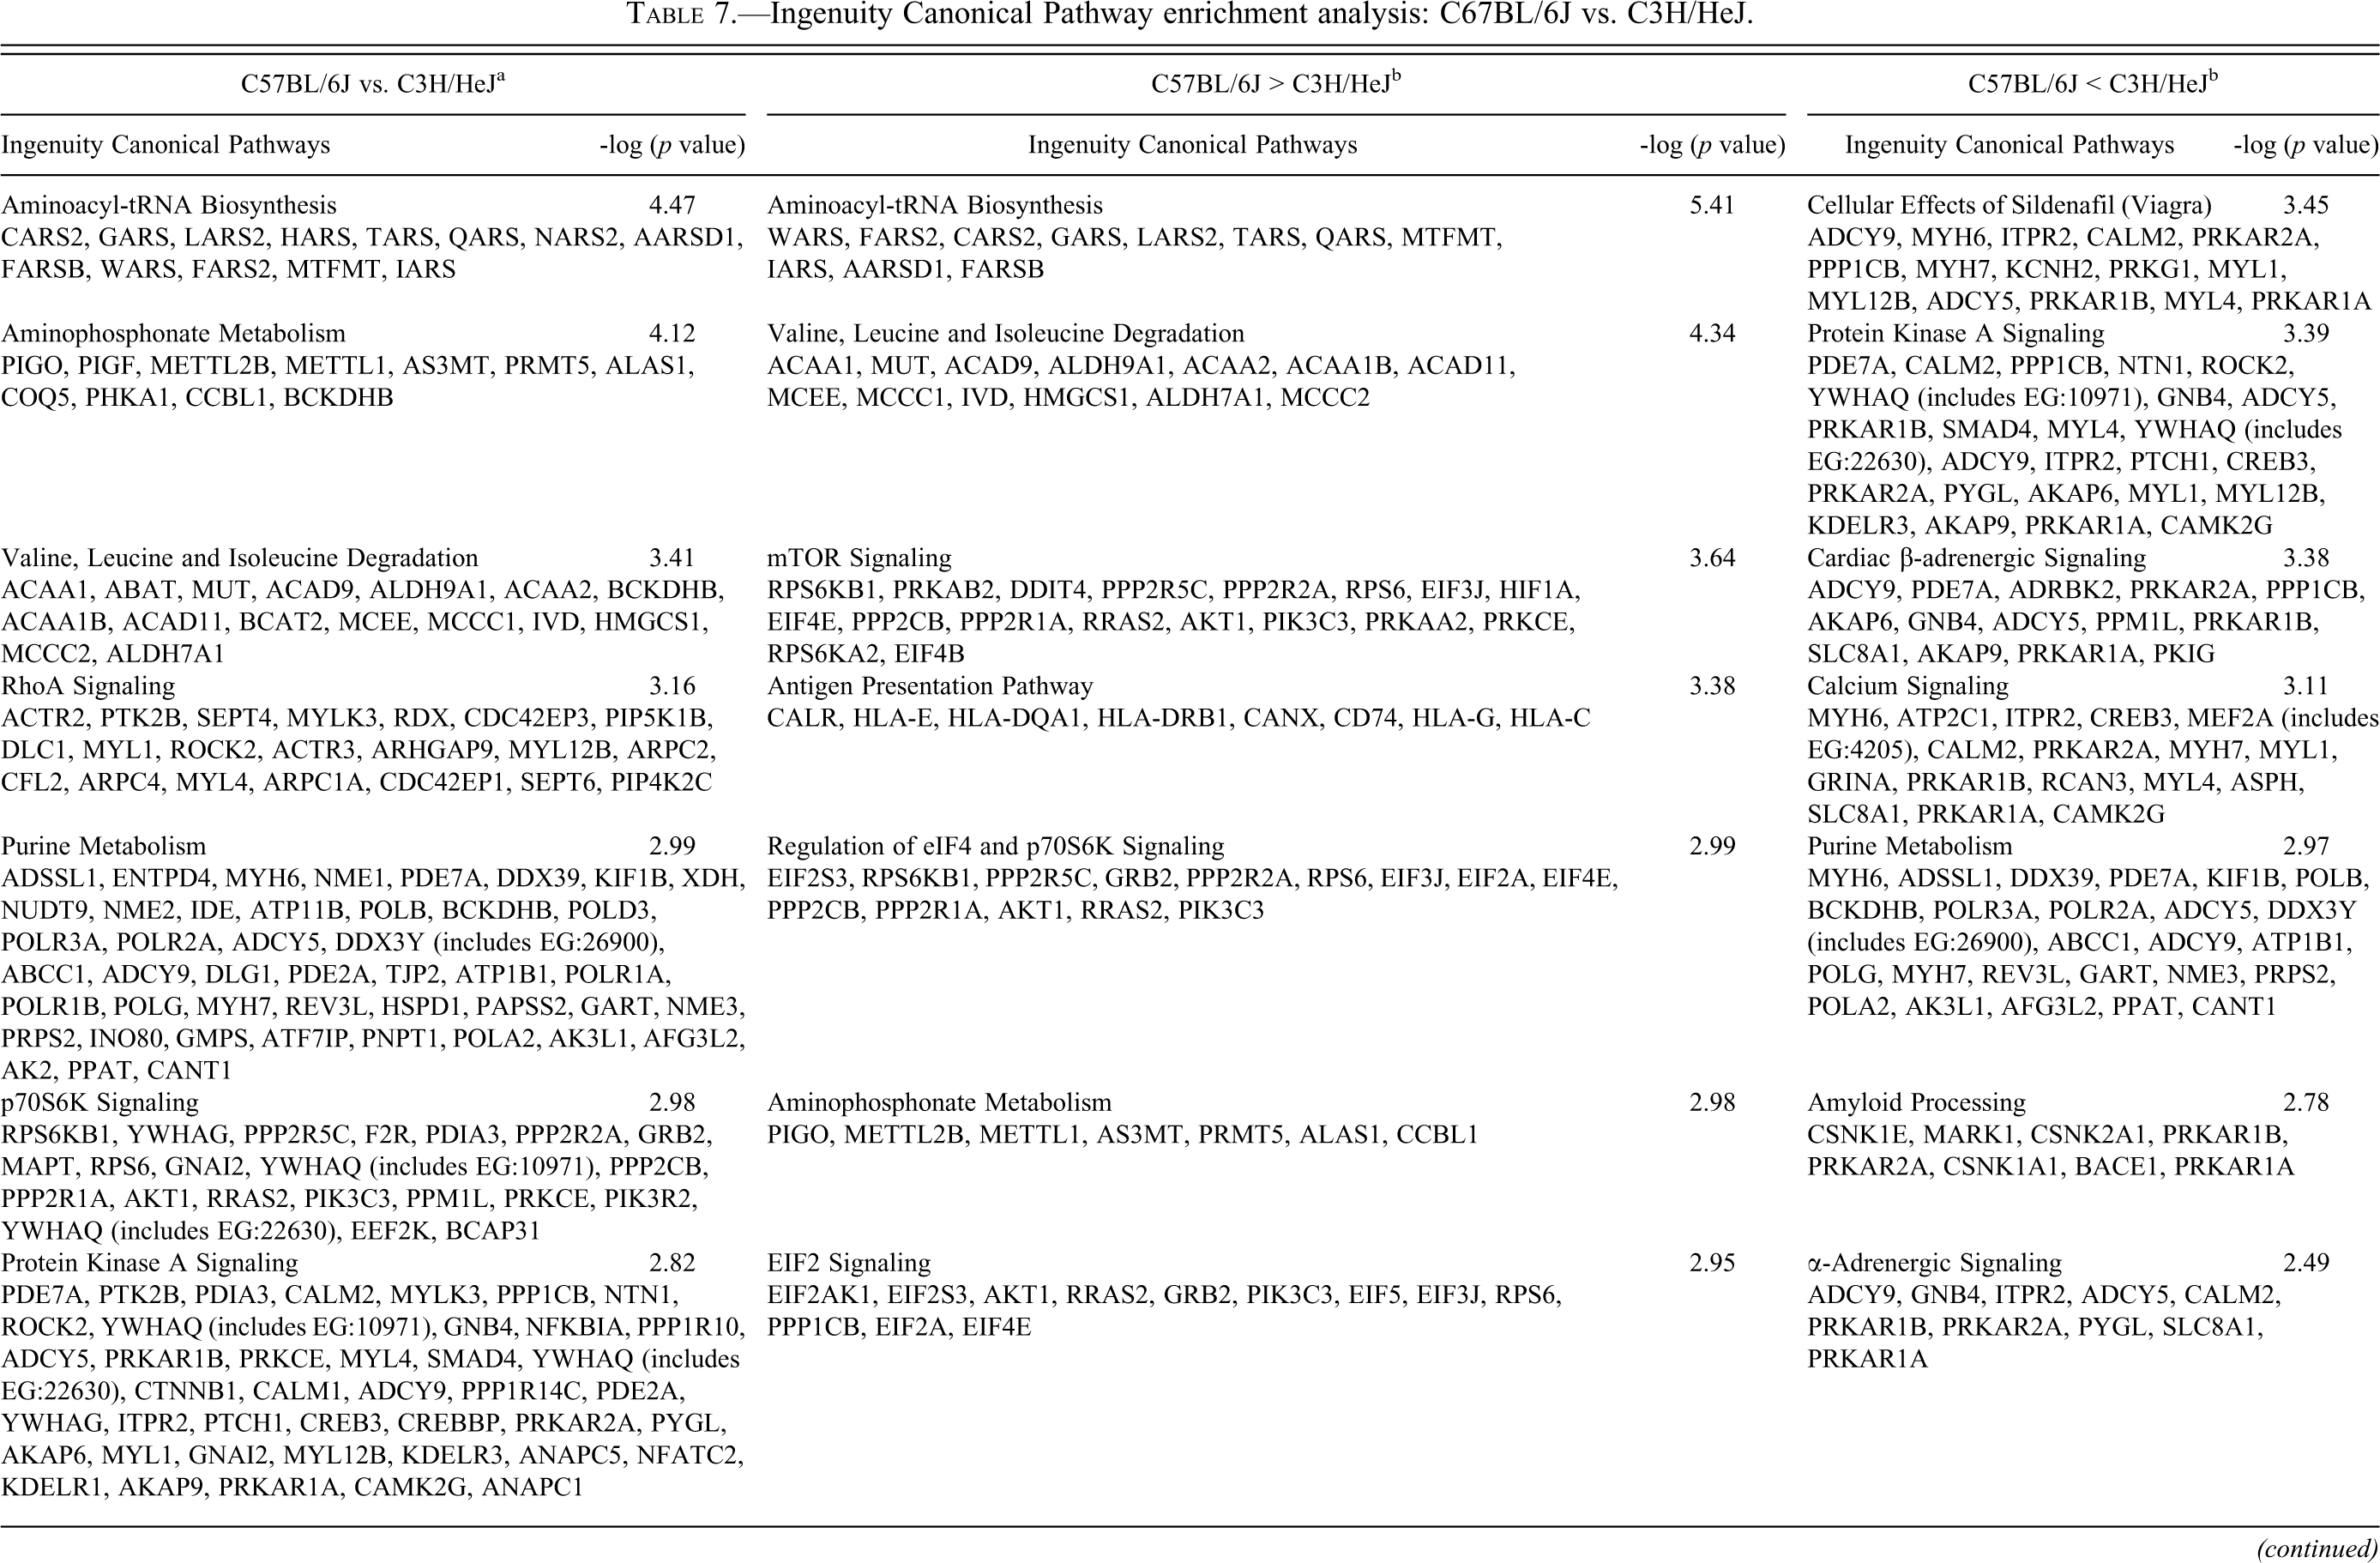
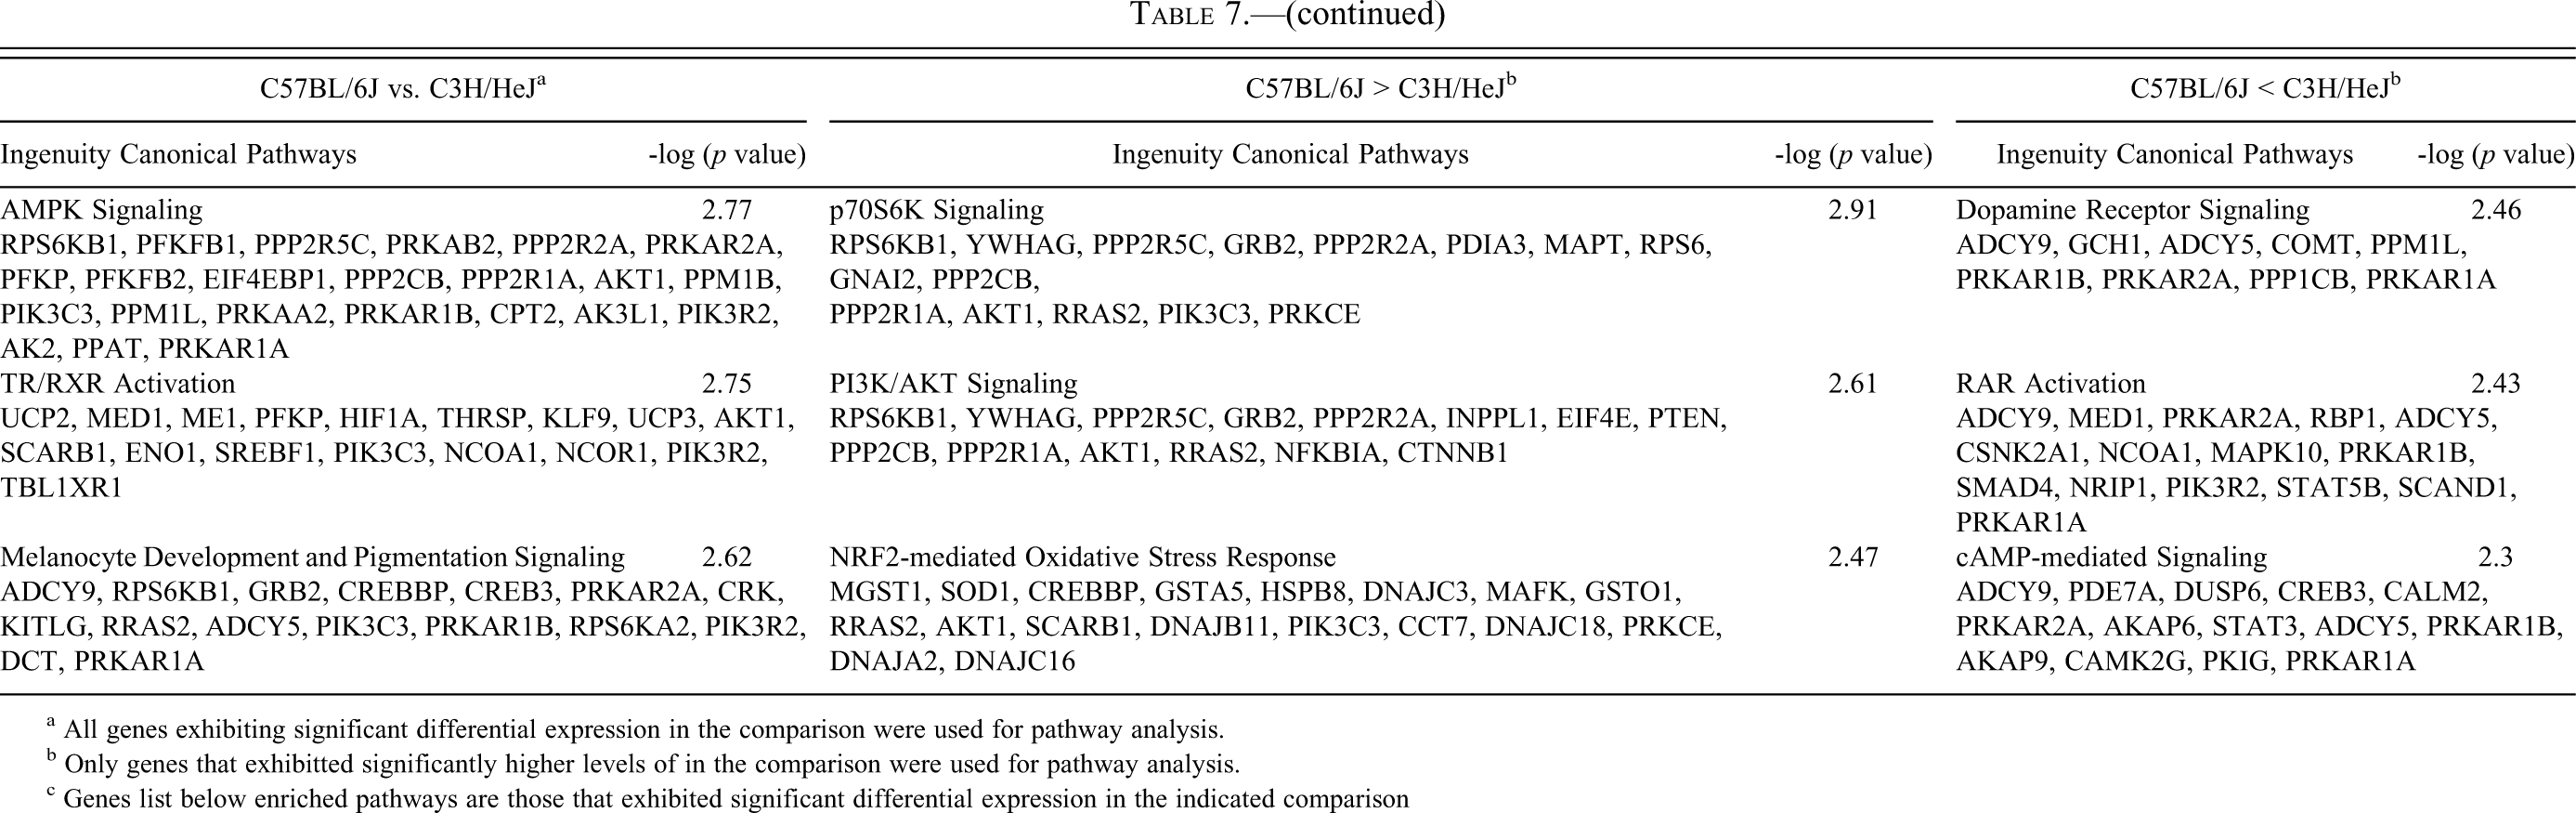
a All genes exhibiting significant differential expression in the comparison were used for pathway analysis.
b Only genes that exhibitted significantly higher levels of in the comparison were used for pathway analysis.
c Genes list below enriched pathways are those that exhibited significant differential expression in the indicated comparison
Identification of Highly Integrated Signaling Nodes Using Network Analysis
Critical signaling hubs are potential targets for toxicity and in some cases may be causally related to the phenotype of concern. To identify these critical regulators, we performed two network neighborhood enrichment analyses, one that is a novel analysis that is based on co-expression data from the mouse heart developmental cohort found in the Starnet2 database, and another that is based on a composite of protein interactions and canonical pathways (ConcensusPathDB). The complete results of the individual analyses can be found in Supplementary Tables 5 and 6. Seven hundred forty-eight significantly enriched gene nodes were identified in the coexpression network analysis, and 1007 were identified in the ConcensusPathDB analysis. A pathway analysis of the significantly enriched gene nodes from the coexpression network indicated a strong association with energy generation and mitochondrial dysfunction pathways (Supplementary Table 7). A similar analysis of the enriched gene nodes (centers) from the ConcensusPathDB analysis indicated a significant enrichment of signaling pathways associated with the control of energy homeostasis such as mTor, AMPK, and PI3K/AKT (Supplementary Table 8). To identify the gene nodes that are likely to have the strongest influence, we determined which of the significantly enriched gene nodes occurred in both analyses (Table 8). The genes listed in Table 8 are found in a number of pathways including actin cytoskeleton signaling (Rhoq, Rhot2, Rhoj, Gsn, Actc1), pyruvate metabolism (Pdha1, Dlat, Bckdha, Dld, Mdh1, Hadha), mitochondrial dysfunction (Ndufa4, Atp5a1, Ndufb8, Ndufb10), AMPK signaling (Prkaa2, Lipe, Pfkm), and sarcoglycan complex formation (Sgcb and Sgca). The Prkaa2 second neighborhood coexpression network diagram containing only differentially expressed genes is shown in Figure 5 . Notably, a number of the genes in the Prkaa2 network, including Abcc9, Sgcb, Nrap, Dsp, Sdha, Hspb8, Hopx, and Ldb3, are associated in the literature with cardiomyopathy (i.e., they are on the “cardiomyopathy gene list”). One potential reason for nodal enrichment is the gene that occupies the node varies at a functional level owing to genetic variation between C3H/HeJ and C57BL/6J. Hypothetically, the perturbation of the network created by the functional variation leads to local network adaptations that are manifest as differential gene expression. Three of the genes in Table 8, Prmt5, Anxa5, and Dst, encode proteins that differ in amino acid sequence between the two mice strains. Four genes in Table 8, Prmt5, Prkaa2, Mccc2, and Agl, exhibit genetically determined expression (cis-eQTL) as determined by genetic genomic mapping of F2 mice from a C3H/HeJ X C57BL/6 cross (Yang et al. 2006). All significantly enriched gene nodes that exhibit genetic variation are noted in Supplementary Table 5 (columns R–V).
Enriched signaling nodes from network analysis.
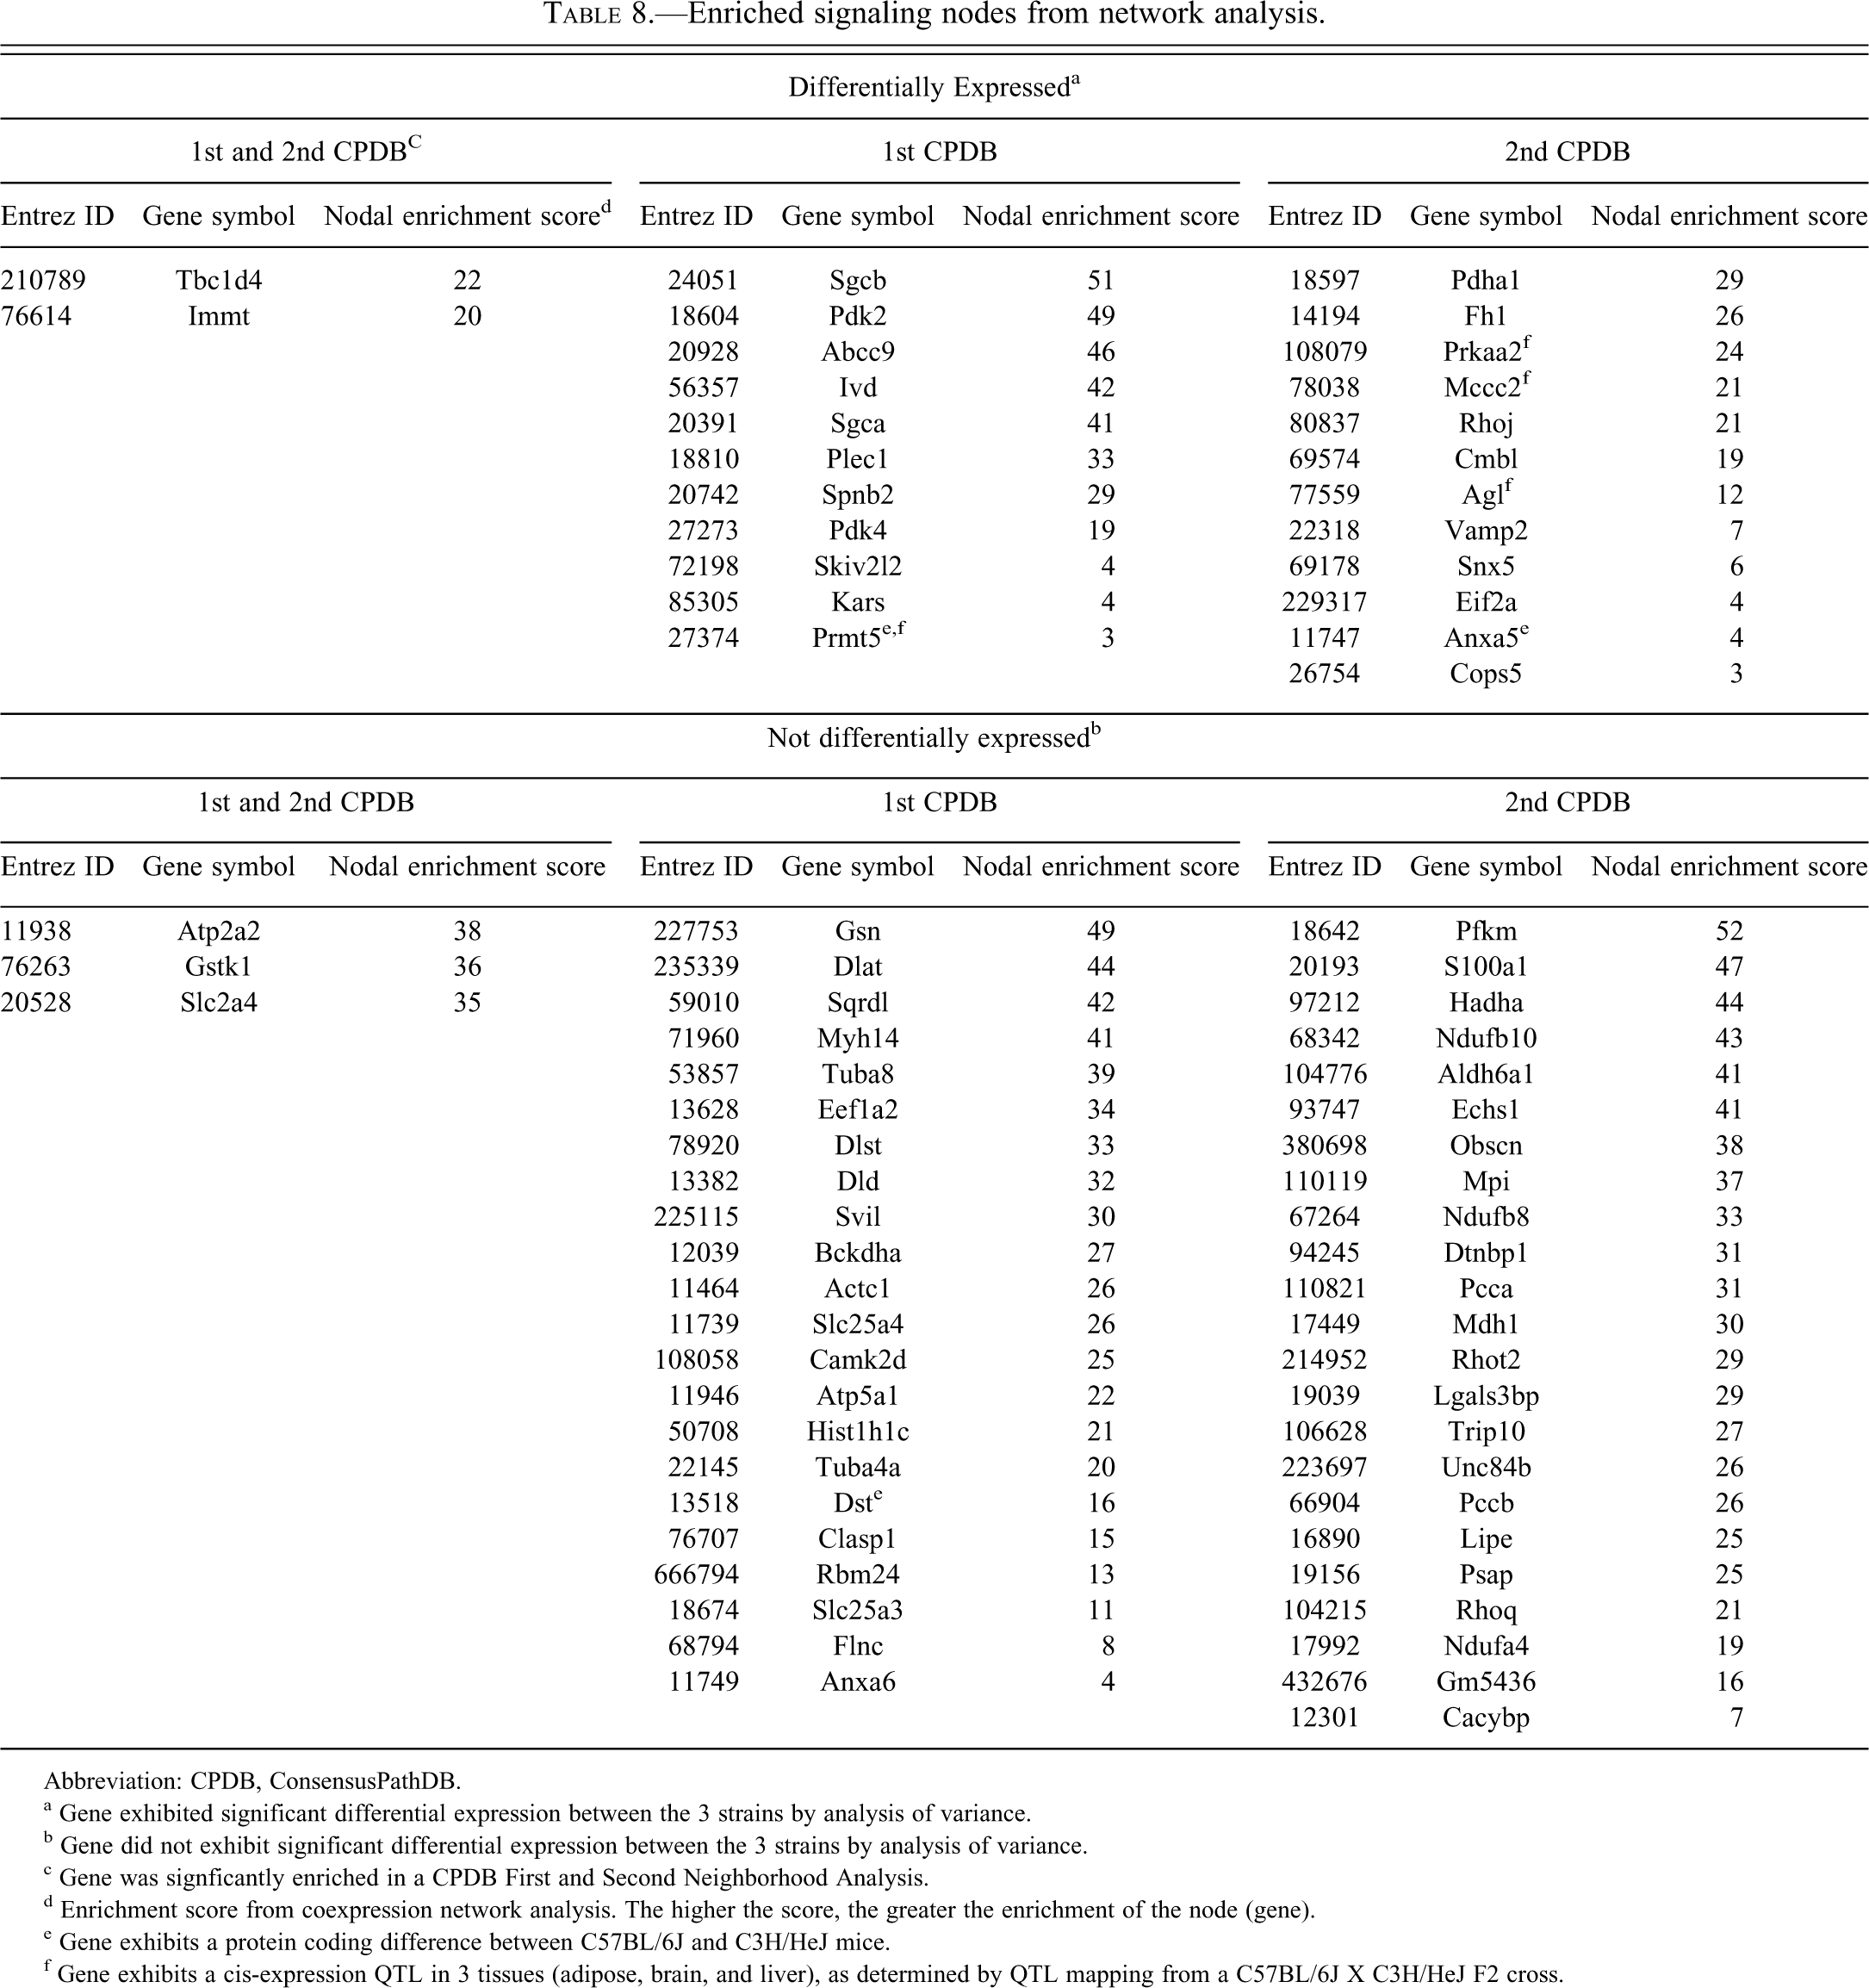
Abbreviation: CPDB, ConsensusPathDB.
a Gene exhibited significant differential expression between the 3 strains by analysis of variance.
b Gene did not exhibit significant differential expression between the 3 strains by analysis of variance.
c Gene was signficantly enriched in a CPDB First and Second Neighborhood Analysis.
d Enrichment score from coexpression network analysis. The higher the score, the greater the enrichment of the node (gene).
e Gene exhibits a protein coding difference between C57BL/6J and C3H/HeJ mice.
f Gene exhibits a cis-expression QTL in 3 tissues (adipose, brain, and liver), as determined by QTL mapping from a C57BL/6J X C3H/HeJ F2 cross.
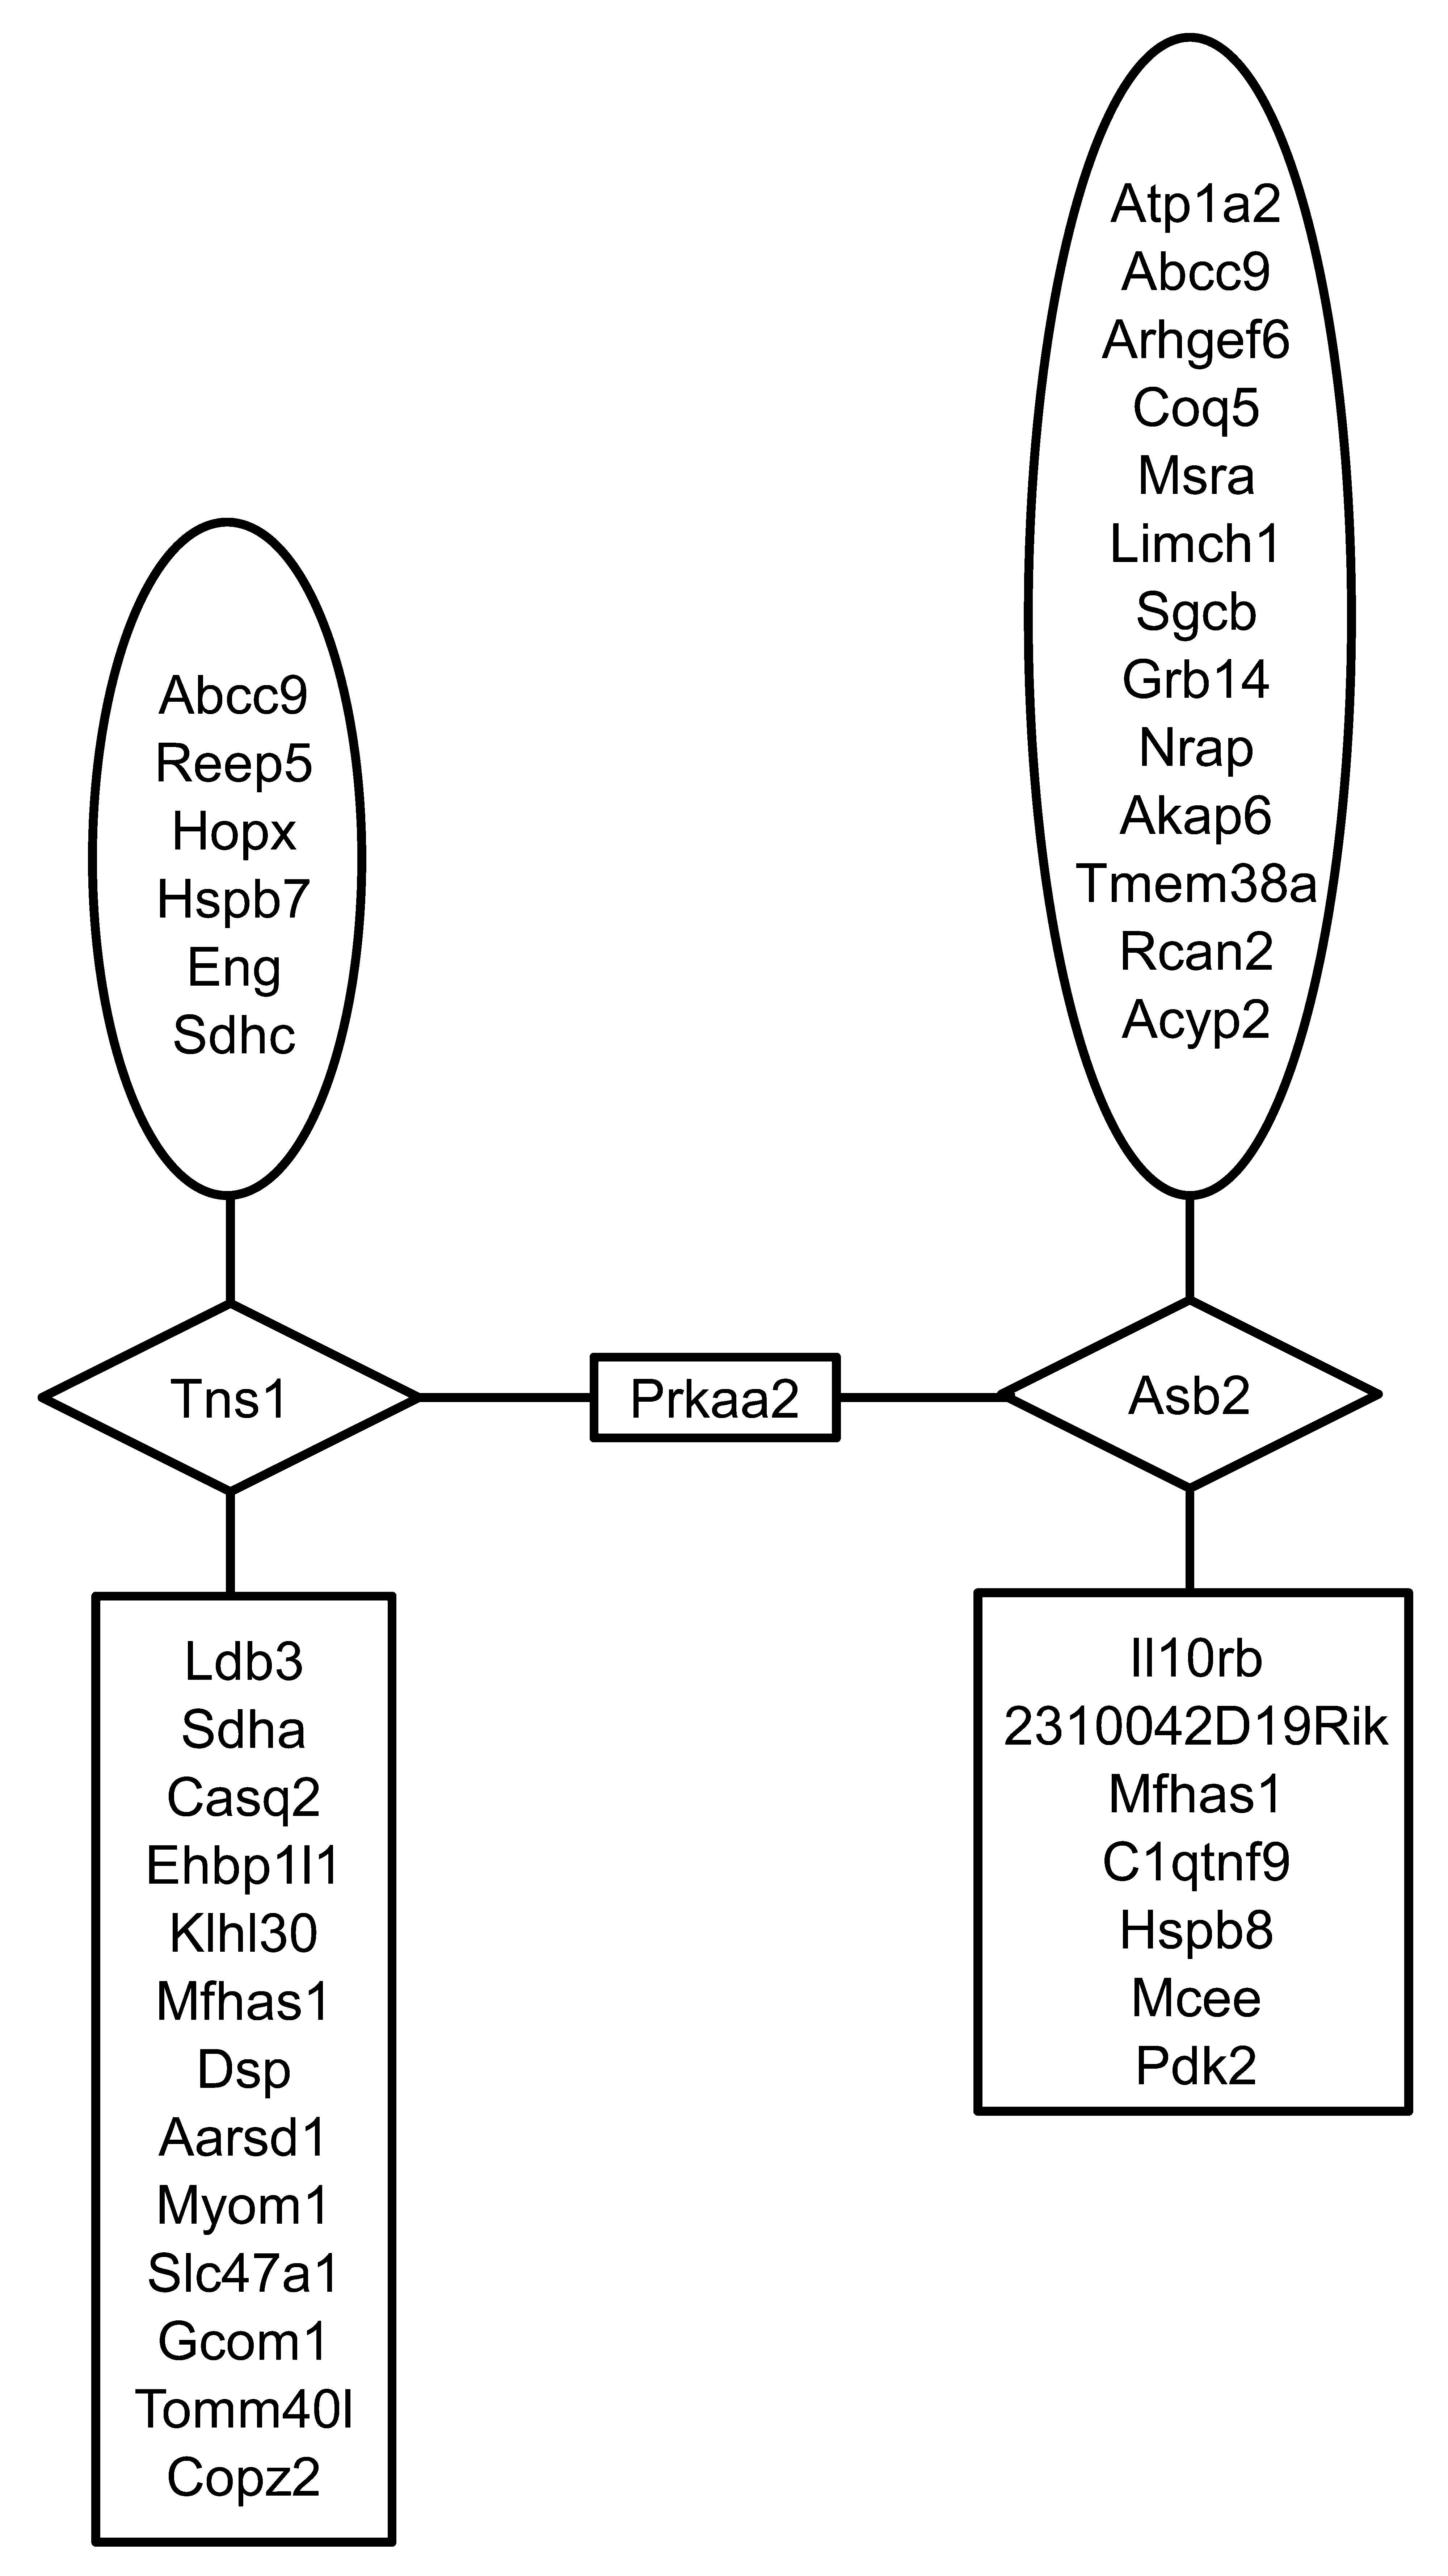
Prkaa2 2nd neighborhood network of differentially expressed genes. In the co-expression network Prkaa2 is linked to 138 genes in the second neighborhood through the genes, Asb2 and Tns1 (1st neighborhood genes). Of the 138 in the second neighborhood, 39 were differentially expressed. Prkaa2 2nd neighborhood genes that exhibited significantly higher expression in C3H/HeJ mice are shown in the ovals, where as those that exhibited significantly lower expression in C3H/HeJ are shown in boxes (including Prkaa2). Genes in the diamonds were not differentially expressed.
Discussion
Distinct cardiac phenotypes were observed in the two mouse strains and the F1 hybrid. Electrophysiological measurements indicated the C3H/HeJ mice exhibited differences in heart rate and ECG parameters. A histopathology diagnosis consistent with a minimal mCM was significantly increased in the C3H/HeJ mouse. Although the C3H/HeJ mice had a minimal mCM, there were no clinical signs indicating any reduced cardiac function. However, analysis of the heart gene expression patterns suggested there are noteworthy differences at the functional genomic level between the two mouse strains and the F1 hybrid.
C3H/HeJ mice exhibited significantly different ECG metrics and heart rate when compared to B6C3F1/J and C57BL/6J. The increased heart rates in the C3H/HeJ mice may be attributable to higher levels of T4 in this strain (http://phenome.jax.org/pub-cgi/phenome/mpdgrcgi?rtn=views/measplot&brieflook=22820) (Dahl et al. 2008). Changes in ECG metrics that are indicative of cardiac disease are often manifested at the genomic level as complex changes in expression of ion channels (Le Bouter et al. 2003). In this study, we observed differential expression of a number of sodium, potassium, and calcium channels than confer depolarizing and repolarizing effects in the heart (Aiba and Tomaselli 2010). Scn4b (up-regulated in C3H/HeJ) and Scn1b (up-regulated in C3H/HeJ) encode subunits of the voltage-gated sodium channels. Both are auxiliary proteins of the pore forming the α subunits (e.g., Scn5a) that regulate channel gating and expression. Both subunits facilitate sodium current (Medeiros-Domingo et al. 2007; Watanabe et al. 2008), hence the up-regulation of these genes in C3H/HeJ mice is potentially an adaptation that sustains action potential propagation during chronotropic stress. Slc8a1 (NCX1; up-regulated in C3H/HeJ mice) is a sodium/calcium antiporter that under normal conditions removes calcium from the cytosol, leading to relaxation of the cardiac muscle. Slc8a1 is typically up-regulated in heart failure (Aiba and Tomaselli 2010). The higher level of Slc8a1 gene in C3H/HeJ mice likely reflects an adaptation to the shorter R-R interval (chronotropic stress), which requires a more rapid removal of calcium form the cytosol. Atp1a2 (down-regulated in C3H/HeJ) encodes an ATPase that is preferentially located in the T-tubules of cardiomyocytes, where its activity is coupled NCX (encoded by Slc8a1) (James et al. 1999). The down-regulation in C3H/HeJ mice likely represents an attempt by the cardiomyocyte to curtail energy expenditure during metabolic stress. The decreased expression of Atp1a2 has two consequences: (1) increased action potential duration, and (2) reversal of the NCX transporter leading to higher levels of intracellular calcium (Akar and Tomaselli 2005).The Kcnh2 (up-regulated in C3H/HeJ mice) encodes a delayed-rectifying potassium channel that underlies the I Kr current of the cardiomyocyte (Aiba and Tomaselli 2010). The I Kr current is critical in the late phase of membrane repolarization, and hence it is likely that the increased expression of Kcnh2 in C3H/HeJ mice is an adaptive response that allows for more rapid repolarization during chronotropic stress. Kcnj3 (Girk1; decreased in C3H/HeJ) is a G-protein–controlled potassium channel that contributes to heart rate decreases elicited by the parasympathetic nervous system (Bettahi et al. 2002). Knockout of Kcnj3 in mice leads to a mild resting tachycardia (Bettahi et al. 2002). The decreased expression of Kcnj3 in C3H/HeJ may reflect an adaptive mechanism that allows for maintenance of cardiac output (through increased heart rate) in the presence of low-grade mCM. Kcnt2 (up-regulated in C3H/HeJ) is an outward rectifying, ATP-sensitive potassium channel that is rapidly activated following sodium channel activation. Activity of this channel is increased under metabolic stress. This increase is predicted to have a protective effect by limiting excitability and by extension calcium-associated excitotoxicity (Bhattacharjee et al. 2003). Kcnj11 (down-regulated in C3H/HeJ) and Abcc9 (up-regulated in C3H/HeJ) encode subunits of the cardiac sarcolemmal ATP-sensitive potassium (KATP) channels. The KATP channels mediate shortening of the action potential and therefore decrease calcium influx and the related excitotoxicity (Kane et al. 2005). Differential expression of Kcnt, Kcnj11, and Abcc9 likely reflects a protective mechanism that attenuates further cardiac damage. Overall, the differential expression of ion channel genes paints a complicated picture of the electrophysiological remodeling that takes place at the genome level during subclinical mCM. One intriguing hypothesis is that the adrenergic signaling cascade, which is differentially active in the two mouse strains and the F1 hybrid, serves as a driving force behind the electrophysiological remodeling (Galindo et al. 2009).
Cardiac stress/toxicity causes activation of a fetal gene expression program in cardiac muscle that is considered by some to be an adaptive change. The two most noted changes are in the contractile and metabolic features of the myocardium (Rajabi et al. 2007). Specific hallmarks of the fetal gene expression program are an increase in expression of fetal isoforms of myosin and actin along with a metabolic switch from β-oxidation of fatty acids to anerobic glycolysis as a means of energy production (Rajabi et al. 2007).
The C3H/HeJ, and to a lesser extent B6C3F1/J, mice in our study exhibit many of the characteristic gene expression changes observed in fetal heart, both at the pathway and at the specific gene level. Increased expression of the fetal isoform of the myosin heavy chain Myh7 (Rajabi et al. 2007) and other genes associated with actin cytoskeletal/tight junction signaling are induced in B6C3F1/J mice (low incidence of cardiomyothy), indicating that changes in this pathway may be one of the earliest indicators of cardiac stress. The cytoskeleton of the cardiomyocyte functions as a bridge to transmit the contractile force between the sarcomere and the extracellular matrix. This connection is essential for transforming sarcomere contraction to cardiac output, hence the induction of this system when the myocardium is stressed likely reflects an adaptive response to maintain cardiac output. The mediators of this adaptive response include a number of transcription factors such as calcium-regulated NFATc, JNK-regulated ATF2, Rho/ROCK-regulated GATA4, and p38-regulated Mef2 (Rohini et al. 2009). Notably, all three of these signaling modules are differentially regulated between the two mouse strains and the F1 hybrid, either at the transcription factor or kinase level.
Pathway analysis also indicted that genes associated with fatty acid metabolism (branched-chain amino acid degradation) were expressed at lower levels in C3H/HeJ mice, indicating a shift toward a fetal heart metabolic profile. The fetal heart relies more heavily on anaerobic metabolism of glucose for energy production (Rajabi et al. 2007). Gene expression changes observed in C3H/HeJ mice that are particularly indicative of this metabolic shift include the up-regulation of Pfkfb1 (glycolysis regulation), Gapdh (glycolysis), and Eno2 (glycolysis) and the down-regulation of Pfkfb1 (glycolysis regulation, cardiac specific), Pdk2 (negative regulation of pyruvate metabolism), Pdk4 (negative regulation of pyruvate metabolism), Bpgm (counterproductive to glycolysis), Pdhb (pyruvate metabolism), Slc25a20 (β-oxidation), Acad9 (β-oxidation), Acot1 (β-oxidation), Acot2 (β-oxidation), Cpt2 (β-oxidation), Acaa1a (β-oxidation), Acaa1b (β-oxidation), Acaa2 (β-oxidation), Sdha (TCA cycle), Ndufaf1 (oxidative phosphorylation/electron transport), Ndufa12 (oxidative phosphorylation/electron transport), Coq7 (oxidative phosphorylation/electron transport), Coq3 (oxidative phosphorylation/electron transport), Atpaf2 (oxidative phosphorylation/electron transport), and Atpaf1 (oxidative phosphorylation/electron transport). A striking exception to these observations is the notably higher expression of Slc25a29 (β-oxidation) in C3H/HeJ mice. Anaerobic metabolism gives rise to acidosis because of the production of lactic acid. C3H/HeJ mice express relatively higher levels of Slc16a7, which is involved in the export of H+ ions and monocarboxylic acids such as lactate. Overall, these findings indicate the C3H/HeJ mice are experiencing mild cardiac stress and the cardiac muscle is attempting to adapt to the adverse environment by altering its contractile and metabolic characteristics in a fashion that is in line with previously documented genomic changes associated with mCM (Rajabi et al. 2007).
Using a gene network–based approach, we identified genes that occupy regulatory gene nodes that are likely to have a critical role in driving the molecular level changes observed in mCM. Of the genes that were identified using this approach, Prkaa2 is one of the most likely to play the role of central regulator of the observed genome level responses. Prkaa2 encodes a catalytic subunit of the AMP-activated protein kinase (AMPK) (Arad et al. 2007) that is expressed at relatively high levels in both cardiac and skeletal muscle (http://biogps.gnf.org/#goto=genereport&id=5563). AMPK is a heterotrimer composed of an α catalytic subunit, and noncatalytic β and γ subunits. AMPK monitors cellular energy status (Viollet et al. 2009). In response to metabolic stress that leads to an increase in the AMP/ATP ratio, AMPK is activated and in turn activates expression of genes that promote glycolysis and mitochondrial energy production and shuts down energy-consuming processes such as protein synthesis (Viollet et al. 2009). The evidence supporting a role for Prkaa2/AMPK, both in C3H/HeJ mouse mCM and cardiac function in general, are manifold. The heart has a very high demand for energy, consuming more energy (ATP) per day than any other organ (Neubauer 2007). Hence, slight alterations in the AMPK signaling pathway that is central to maintaining a proper AMP/ATP balance has a high likelihood of compromising cardiac function. Along these lines, knockout and transgenic studies indicate Prkaa2 is necessary for maintaining myocardial energy homeostasis during ischemia (Zarrinpashneh et al. 2006), attenuating pressure-overload–induced cardiac hypertrophy (Zhang et al. 2008), maintaining mitochondrial function (Athea et al. 2007), and controlling circulating levels of catecholamines (Viollet et al. 2003). The increase in circulating catechols in the Prkaa2 knockout mice may be of particular significance because the focal pathology and ECG results observed in the C3H/HeJ mice are consistent with excessive adrenergic tone (Jokinen et al. 2005).
A mutation in human PRKAG2 that produces a constitutive active form of this protein alters the levels of Prkaa2 activity and leads to a rare form of hypertrophic hCM (Blair et al. 2001; Gollob et al. 2001). In our study, compared to B6C3F1/J and C57BL/6J mice, C3H/HeJ mice express lowered levels of not only Prkaa2 mRNA, but also of Prkag2 and Prkab2. Pathway analysis demonstrated a number of processes regulated by AMPK signaling were altered, such as fatty acid and carbohydrate metabolism. In addition, ConsensusPathDB pathway neighborhood analysis revealed that there was a significant enrichment of differentially expressed genes that interact at a pathway level with four additional subunits of AMPK (Prkab1, Prkaa1, Prkag1, and Prkag3), not including Prkaa2. In combination, these data strongly suggest that there is differential activity of the AMPK pathway between the two mouse strains and the F1 hybrid. Hypothetically, the lower activity of this pathway in C3H/HeJ may render these mice less capable of maintaining energy homeostasis during metabolic stress. Compromised energy levels could potentially lead to an inability to maintain Ca+2 homeostasis (Yano et al. 2005), leading to the activation of caspases, cardiomyocyte apoptosis (Foo et al. 2005), and mCM.
The differential activity between the two mouse strains and the F1 hybrid of the AMPK pathway and the closely related PI3K/PDK1/Akt/mTor/S6K signaling network suggests the orthogonal networks in humans are likely to exhibit polymorphic activity. The differential activity is likely to be a result of a combination of underlying disease/physiological state and genetic polymorphism. A number of FDA-approved and investigational drugs target these networks directly or indirectly, raising the possibility that differential activity of these networks may confer increased risk of toxicity in certain subpopulations. An example of such a drug is the tyrosine kinase inhibitor Sunitinib, which is used to treat renal cell carcinoma and gastrointestinal stromal tumors and has been associated with cardiotoxicity (Cheng and Force 2010). The cause of the sunitinib-associated cardiotoxicity is likely to be multifactorial, however, one facet of the toxicity appears to be related to inhibition of AMPK, which compromises the ability of the cardiomyocytes to adapt to energy stress (Cheng and Force 2010). Another example of a cardiotoxic drug that indirectly interacts with the AMPK pathway is Zidovudine, a nucleoside analog reverse transcriptase inhibitor used to treat human immunodeficiency virus (Walker et al. 2004). The cardiotoxicity of this drug appears to be related to its inhibition of mitochondrial thymidine phosphorylation (McKee et al. 2004), which leads to mitochondrial toxicity and energy stress (Chan et al. 2007). Because of its critical role in adaptation to energy stress, differential activity of the AMPK pathway has the potential to confer differential susceptibility to Zidovudine-induced cardiotoxicity. The PI3K/PDK1/Akt/mTor/S6K signaling network is central to adaptive/maladaptive hypertrophy and the survival of cardiomyocytes (Cheng and Force 2010). Among the drugs that target this pathway are the mTor inhibitors, temsirolimus, everolimus, and sirolimus. On their own, these drugs attenuate cardiac hypertrophy in experimental models (Shioi et al. 2003). However, there is concern that inhibition of mTor, which blocks the ability of the cardiomyocyte to adapt to energy stress, may confer increased risk of cardiotoxicity in the presence of drugs (currently under development) that target other kinases in the PI3K/PDK1/Akt/mTor/S6K network (Cheng and Force 2010). In individuals/strains that exhibit compromised mTor activity, the risk of drug-induced cardiotoxicity may be greater.
These studies characterize the distinct cardiac phenotypes of C3H/HeJ, C57BL/6J, and B6C3F1 mice. Although others have evaluated vascular gene expression differences between these strains (Miyoshi et al. 2006; Yuan et al. 2009), the studies presented here are the first to detail the functional genomic differences in cardiac muscle between the strains. Major phenotype differences among the mouse strains studied included differential expression of cardiac gene transcripts for ion channel regulation/expression, for cardiac fetal development gene patterns, and for regulation of energy generation. Based on the conservation of genes among mammalian species, the mouse is considered to be a good model to study the relationship between gene transcript expression and function. Importantly, a large number of gene expression changes identified here have counterparts in human cardiac disease.
A supplemental appendix to this article is published electronically only at http://tpx.sagepub.com/supplemental. The original microarray data are available on the CEBS database.
Supplemental Material
Supplementary_tables - Comparative Phenotypic Assessment of Cardiac Pathology, Physiology, and Gene Expression in C3H/HeJ, C57BL/6J, and B6C3F1/J Mice
Supplementary_tables for Comparative Phenotypic Assessment of Cardiac Pathology, Physiology, and Gene Expression in C3H/HeJ, C57BL/6J, and B6C3F1/J Mice by Scott S. Auerbach, Reuben Thomas, Ruchir Shah, Hong Xu, Molly K. Vallant, Abraham Nyska and June K. Dunnick in Toxicologic Pathology
Footnotes
Acknowledgments
We thank Dr. Jef French, NIEHS, and Dr. K. Shockley, NIEHS, for their excellent review of the manuscript. We would also like to thank Dr. Vincent VanBuren and Dr. Daniel C. Jupiter for generously providing the cardiac gene expression correlation matrix used in the creation of the coexpression network analysis. This work was supported by the intramural program of the National Institute of Environmental Health Sciences Intramural Program, Research Triangle Park, NC. The in-life portion of this study was conducted under NIEHS contract N01-ES-55536. Statistical support was provided under NIEHS contract ES 55547.
References
Supplementary Material
Please find the following supplemental material available below.
For Open Access articles published under a Creative Commons License, all supplemental material carries the same license as the article it is associated with.
For non-Open Access articles published, all supplemental material carries a non-exclusive license, and permission requests for re-use of supplemental material or any part of supplemental material shall be sent directly to the copyright owner as specified in the copyright notice associated with the article.