
Abstract
Scholars of environmental politics and voting often use natural disasters as a proxy for environmental shocks. However, the simultaneously human and natural origins of these disasters muddle their connection to political outcomes. We look at an overtly human-caused disaster − earthquakes induced by gas drilling in the Netherlands − to see whether it correlates with pro-environment voting. Combining polling station-level voting data with precisely calculated measures of earthquake impact, we find that Green Party vote share is higher in affected locations, especially in provinces adjacent to but removed from the drilling due to non-linear effects of disasters on voting. These findings suggest that environmental shocks strengthen preferences for Green parties, a relationship that will become increasingly important as environmental conditions worsen.
‘There is not a day that goes by that we do not think or talk about it. We wait for the next blow, wait to see how hard it will be, what the effects will be.’ ‘Have you any idea how it feels like to walk around your house all the time, staring, always checking to see if everything is still the same as it was before the earthquake? To check whether you have really seen all the damage? It feels like you cannot miss anything, have to check everything, always have to be alert.’
Introduction
Earthquakes are historically unusual in the Netherlands. Yet, after drilling for natural gas began in Groningen province, the region began experiencing light but frequent tremors. A 2013 report commissioned by the local government confirmed escalation of earthquakes caused by this extraction, predicting (accurately) more and worse future quakes. The above quotes, from the very same report, document the distress these earthquakes impart on residents.
What is the political consequence of exposure to environmental adversity? Specifically, we are interested in whether these experiences lead to support for pro-environment parties. Recent research shows empirical evidence of such relationships for floods (Damsbo-Svendsen, 2024; Holub and Schündeln, 2023) and fires (Kronborg et al., 2024; McAllister and bin Oslan, 2021). We hope to bring to attention a set of disasters thus far largely ignored: induced earthquakes, which are seismic activity caused by fossil fuel extraction (Foulger et al., 2018). The two most well-known concentrations are due to fracking in Oklahoma, United States, and natural gas extraction in Groningen, the Netherlands. We examine the electoral consequences of the latter.
We argue that exposure to environmental shocks − specifically, induced earthquakes − makes voters more likely to prefer pro-environment parties. Induced earthquakes are an excellent test of this effect as they are: (a) unmistakably caused by human activity in the immediate area, yet also (b) distributed randomly across it. We use polling station-level data from Dutch general elections in 2010, 2012 and 2017, focusing on the province of Groningen − where the extraction took place − and neighboring provinces Friesland and Drenthe. For each polling station-level observation, we use latest methodologies (Bommer et al., 2017) to calculate peak ground velocity (PGV), a measure of earthquake impact adjusted for distance to the epicenter, as our explanatory variable. Our tests identify earthquake impact as a consistently positive predictor of votes for GroenLinks (GL), the main Dutch pro-environment party.
We add to the frontier of study in disaster politics. In an electoral context, disaster politics has largely focused on the fate of the incumbent (Achen and Bartels, 2016; Bechtel and Hainmueller, 2011; Cooperman, 2022; Eriksson, 2016; Gasper and Reeves, 2011; Healy and Malhotra, 2009). There is a need to expand this focus to look at how environmental disasters affect political competition more broadly. The literature is shifting in this direction (Baccini and Leemann, 2021; Hazlett and Mildenberger, 2020; Holub and Schündeln, 2023; Mehic, 2023), and we hope to further advance such research.
Specifically, we aim to bring induced earthquakes to the attention of political science. Disaster politics has rightly focused on climate change-related disasters − floods, hurricanes and wildfires − when looking for political consequences. Unlike disasters merely linked to anthropogenic climate change, human activity is more directly at fault for induced earthquakes. There is consequently an undeniable link between induced earthquakes and politics that should be of attention to political science. Facets of what we study will remain features of the Dutch context − an intersection of proportional representation, strong Green Party presence, central influence on the energy industry, and minimal presence of other disasters. Yet, we hope to also inform further research in other contexts facing similar environmental consequences. Present work on the environmental consequences of gas extraction centers on fracking in the United States with regard to law-making (Cooper et al., 2018), public opinion (Bayer and Ovodenko, 2019) and participation (Sances and You, 2022).
Lastly, we hope to contribute to the literature studying Green parties and Green politics (Dennison, 2016; van Haute, 2016). Grant and Tilly (2019) and Hoffmann et al. (2022) studied variation in Green Party popularity from cross-national perspectives; we instead follow Mehic (2023) and McAllister and bin Oslan (2021) in considering intra-national variations in such popularity.
Background and theory
Political consequences of disaster
We use the term environmental adversity to broadly refer to any hardship experienced due to circumstances in one’s immediate environment. A subset of such adversity occurs in discrete and momentous events; these can be further termed environmental shocks. Temperature increases due to climate change would thus only be an adversity, but a hurricane would be both an adversity and a shock. We use shocks and disasters interchangeably.
We review here the literature on electoral impacts of natural disasters. Much of what is colloquially termed natural disasters have inseparable elements of human cause. Such human elements inevitably turn disasters into political issues with political consequences. From this perspective, we argue that artificial disasters − such as induced earthquakes − will have similar political consequences to natural disasters. The difference may be a matter of clarity; as artificial disasters can be more clearly attributed to human causes, we might find political effects even for mild treatments.
A broad literature studies how environmental influences shape voters’ attitudes toward the environment. Hornsey et al. (2016) and Howe et al. (2019) give overviews. A narrower, but still large, body of work studies specifically the impact of natural disasters on environmental attitudes. Existing evidence is largely affirmative that disasters increase concern for the environment. Demski et al. (2017) demonstrate that flooding in the United Kingdom increases the salience of the climate. Voters have also been shown to vote in favor of environmentally-friendly policies at referenda both after experiencing wildfires in California (Hazlett and Mildenberger, 2020) and flooding in Switzerland (Baccini and Leemann, 2021).
Do these experiences, in turn, lead voters to prefer environmentally-conscious political parties? Hoffmann et al. (2022) demonstrate this relationship with a cross-country study of temperature extremes. For disasters specifically, this effect was best documented in Sweden with papers showing wildfires (Kronborg et al., 2024) and the Chernobyl disaster (Mehic, 2023) predicting the Green vote. Beyond this, Damsbo-Svendsen (2024) shows this connection for floods in neighboring Denmark, and McAllister and bin Oslan (2021) for bushfires in Australia.
Accordingly, we hope to provide further evidence for the relationship between environmental disasters and pro-environment politics. Following existing work (Holub and Schündeln, 2023; Kronborg et al., 2024; McAllister and bin Oslan, 2021; Mehic, 2023), we predict that experiencing environmental disasters makes Dutch voters more likely to vote for GL, the major Green party in the Netherlands. While there are further Dutch parties that oppose drilling or have pro-environment portfolios, we focus on GL because it is the largest party that is explicitly a single-issue environmental party.
According to the Chapel Hill Expert Survey (Jolly et al., 2022), GL is consistently top of expert rankings for both support for environmental protections and the importance of environmental sustainability in their platform. Their only competitor in this regard is the much smaller Partij voor de Dieren (PvdD, Party for the Animals), a single-issue party for animal rights. 1
Many intervening mechanisms may operate between exposure to environmental adversity and its consequences on political choice. Our design and data do not allow us to thoroughly interrogate these mechanisms, but we briefly acknowledge them here. The rise of Green issues in politics in recent decades is attributed to changing values in post-materialist societies (Inglehart, 1977; Kitschelt, 1990). However, for short-term adversity exposures, it is more likely that values are being re-ordered rather than transformed. Appropriately then, some scholars (Baccini and Leemann, 2021; McAllister and bin Oslan, 2021) argue that disasters reorient priorities by heightening the salience of environmental issues.
Other arguments focus on how adversity leads to retrospective punishment. For the environment, the bulk of such work focuses on the United States (Achen and Bartels, 2016; Gasper and Reeves, 2011; Healy and Malhotra, 2009; Kriner and Reeves, 2015) and has spread too far across the world to be properly cited here. Theories of punishment apply mostly to incumbents, but such punishments can benefit smaller parties who receive support out of protest. Karamichas (2007) and Vasilopoulos and Demertzis (2013) argue this to be the case following 2007 fires in Greece. We run additional analyses to see whether earthquakes are negatively associated with major Dutch parties’ vote shares. This might indicate that increases in the Green vote share are due to vote switching (rather than greater Green supporter turnout), and whether voters do so to ‘punish’ incumbents for fossil fuel extraction.
Scholars of risk perception highlight importance of place and proximity (Brody et al., 2008; Müller-Mahn, 2013). Balžekienė et al. (2024) provide a synthesis, concluding that most studies find closer proximity to hazards induces greater perceptions of risk. Reny et al. (2025), for example, demonstrate connection between living on the coast − an environmental hazard − and economic self-interest. Furthermore, those who personally experience disasters believe future climate hazards to be more likely (Lujala et al., 2014).
Building on these intuitions, we argue that the electoral impact of environmental adversity may be similarly heterogeneous by proximity. Those particularly affected by earthquakes will become more concerned by their direct consequences such as property damage and personal economic costs − and may be pressured to prioritize their economic security (Melville-Rea, 2022). Taken together, environmental shocks may especially promote pro-environment voting among voters who are slightly removed from − but still exposed to − disasters. This suggests an inverted u-shape relationship between disaster exposure and pro-environment voting. We interrogate this possibility with a quadratic regression model in further tests.
Induced earthquakes
Our focus is not climate change but a different anthropogenic environmental consequence. Induced earthquakes (see Foulger et al., 2018 for an overview) provide valuable cases for social science studies of disasters. Natural disasters such as wildfires, hurricanes and drought have elements of human cause through our impact on climate change but these are: (a) impossible to separate from natural factors that also contribute; and (b) impossible to distinguish between local contributions of human activity to the disaster versus contributions of human activity across the planet. By contrast, typical earthquakes are a type of disaster that is almost ‘purely’ natural and exogenous to human activity. Induced earthquakes satisfy a niche where the disaster is overtly caused by human activity − especially for Groningen, where there were no earthquakes before drilling began − and the resulting disaster is reasonably local to where the human activity took place.
Importantly, there is still some randomness in induced earthquakes. Consider phenomena such as pollution or oil spills that are also negative externalities resulting from human activity. There can be backlash against corporations responsible, and voters may hold governments accountable at the polls. However, the manifestation of such externalities is not exogenous as humans ultimately determine their distribution. By contrast, induced earthquakes are not controlled. They do not manifest exactly where the relevant human activity took place, but instead strike in nearby areas depending on geological factors such as soil quality. Collectively, this makes induced earthquakes sufficiently endogenous to human activity to be political, but sufficiently stochastic and exogenous to justify a natural experiment design of inquiry.
A final strength of using earthquakes as treatment is precision. For disasters such as fires, floods, or hurricanes, it can be difficult to objectively quantify the impact of the disaster on a particular locale. A standout solution exists for earthquakes, as a combination of earthquake magnitude and distance from the epicenter allows for an objective measurement of the impact of a particular earthquake on any nearby location. We expand on this as we discuss data and methodology.
While there are indeed studies on the electoral impact of natural earthquakes (Acuña-Duarte and Salazar, 2021; Akarca and Tansel, 2016; Demirdogen and Olhan, 2025; Masiero and Santarossa, 2021; Visconti, 2022), there is a surprising lack of research on the political consequences of induced earthquakes. This is particularly unusual given the significant human element of these disasters. One reason may be the distribution of induced earthquakes. Beyond the Dutch case, the other major concentration of induced earthquakes is centered around fracking in Oklahoma, where American voters do not have viable environmental parties to vote for. One recent paper notably gets around this issue by focusing on the election of energy regulators (Boomhower, 2024). Beyond politics, a handful of social science studies investigates human consequences of induced earthquakes. The most relevant and comprehensive quantitative study is Koster and van Ommeren (2015) on the impact of induced earthquakes on property values.
Impact on the Netherlands
What follows is an overview of natural gas extraction and induced earthquakes in Groningen, mostly adapted from Verdoes and Boin (2021). We refer readers to this source for a more comprehensive retelling.
The Slochteren gas field in the Dutch province of Groningen was discovered in 1959. It would be the largest known gas field in Europe and soon became the backbone of energy both in the Netherlands and neighboring states. However, Groningen, a region typically free of earthquakes, began experiencing light tremors in the mid-1970s. Officials originally denied that the earthquakes had anything to do with the gas fields. It was not until 1993, through a study by the National Dutch Meteorological Institute (KNMI), that the earthquakes were linked to gas extraction. Most earthquakes were light, measuring below 3 on the Richter scale. However, as Groningen was not accustomed to earthquakes, local infrastructure was not built to withstand any level of tremors. Thus, even light earthquakes proved damaging.
In these early years, the people of Groningen did not appear particularly concerned (van Bezouw and Kutlaca, 2019). Things changed in 2012 when the strongest earthquake yet (3.6 on the Richter scale) hit the village of Huizinge. A 2013 study commissioned by the Groningen provincial government − the Meijer et al. (2013) report that opened this paper − confirmed increasing severity of the earthquakes, with the possibility things would worsen. The study recommended that extraction be stopped, putting earthquakes on the political agenda. Between 2012 and 2023, over 3300 homes have been demolished due to earthquake damage − up to 80% of homes in certain villages, 2 resulting in tens of thousands of children living in ‘a terrible situation,’ according to former Prime Minister Mark Rutte. 3 In total, thousands of earthquakes since the 1980s have damaged thousands of homes, adding to political pressure to shut down the Groningen gas field. 4
The Netherlands has a parliamentary government elected by proportional representation in one large national electoral district. Thus, there is no geographical loyalty from the most prominent elected body to the local electorates. This structure is relevant as the extraction of gas from the Groningen gas field fell under the power of the national government. Shell and Exxon Mobil formed a joint venture at the helm of the extraction, and the state bought almost all the resulting gas. The profits from selling the gas within the Netherlands and abroad, by some estimates, made up to 25% of government revenue. It is no surprise that the Dutch government wished to continue gas extraction despite whatever problems the local public faced.
The gas industry does provide some benefits to the local economy. It created 9,200 jobs in the region in 2013 (Meijer et al., 2013). For context, Groningen reported a labour force of approximately 286,000 that year − making the gas industry a reasonably important employer. However, unlike other environmentally taxing industries upon which local communities rely, such as coal mining (Gaikwad et al., 2022), the labour opportunities presented by gas drilling are comparatively smaller. Altogether, the province of Groningen was estimated to get only 1% of profits from gas extraction despite enduring most of its negative externalities.
Sentiment in the national government on the issue began to change around 2015. Verdoes and Boin (2021) attribute this to media attention. Key political and judicial decisions made gas extraction less financially viable as rulings for compensations began to tighten. Following a no-confidence vote against Rutte − accused of being unresponsive to constituents’ complaints − operations began shutting down in October 2023. Though the gas fields are no longer operational, pent-up frustration with a government prioritizing profit over citizens and the environment may have contributed to the November 2023 national election results where a new Labour−Green coalition won more seats than Rutte’s conservatives. It remains to be seen, however, if these policies will remain in place as the reopening of the gas fields would reduce reliance on Russian gas imports during present tensions.
Research design
Our main models present results from ordinary least squares regressions where polling station-level vote share of GL is the outcome variable. Our explanatory variables use a measure of earthquake impact called PGV that moderates earthquake magnitude with distance from the epicenter to the point of interest − such point for our purposes being the polling station in question. The main explanatory variable sums up this PGV across the previous government term; secondary models also test alternative operationalizations.
We focus our analyses on three Dutch provinces: Groningen − where the gas fields are − and two neighboring provinces, Friesland and Drenthe. All models include standard errors clustered by municipality (gemeente), the next smallest Dutch administrative division after provinces. We look for spatial non-linearity calculated through squared earthquake impact. To see if there is also temporal non-linearity, we include an analysis looking at earthquake effects broken down by year. Placebo tests using past election results are also presented to demonstrate that our results are not likely driven by confounders correlated with earthquake location. Finally, we present models with other parties’ vote shares as the outcome to consider broader effects of the earthquakes on electoral competition. The following sub-sections provide greater detail on each data source used.
Election data
The Dutch government makes general election data openly available online. 5 From 2010 onward, this data is available at the polling station level. As each polling station in the data is identified either by name or postcode, we can assign very specific location coordinates to most observations. A full Dutch postcode (four numbers and two letters) often refers to a specific street or even a portion of a street. We code locations in the Rijks-Driehoek system, a coordinate system used in the Netherlands. This system has the advantage of expressing coordinates directly in units of distance (metres or kilometres), allowing for easier computation of distances than Global Positioning System coordinates expressed in degrees.
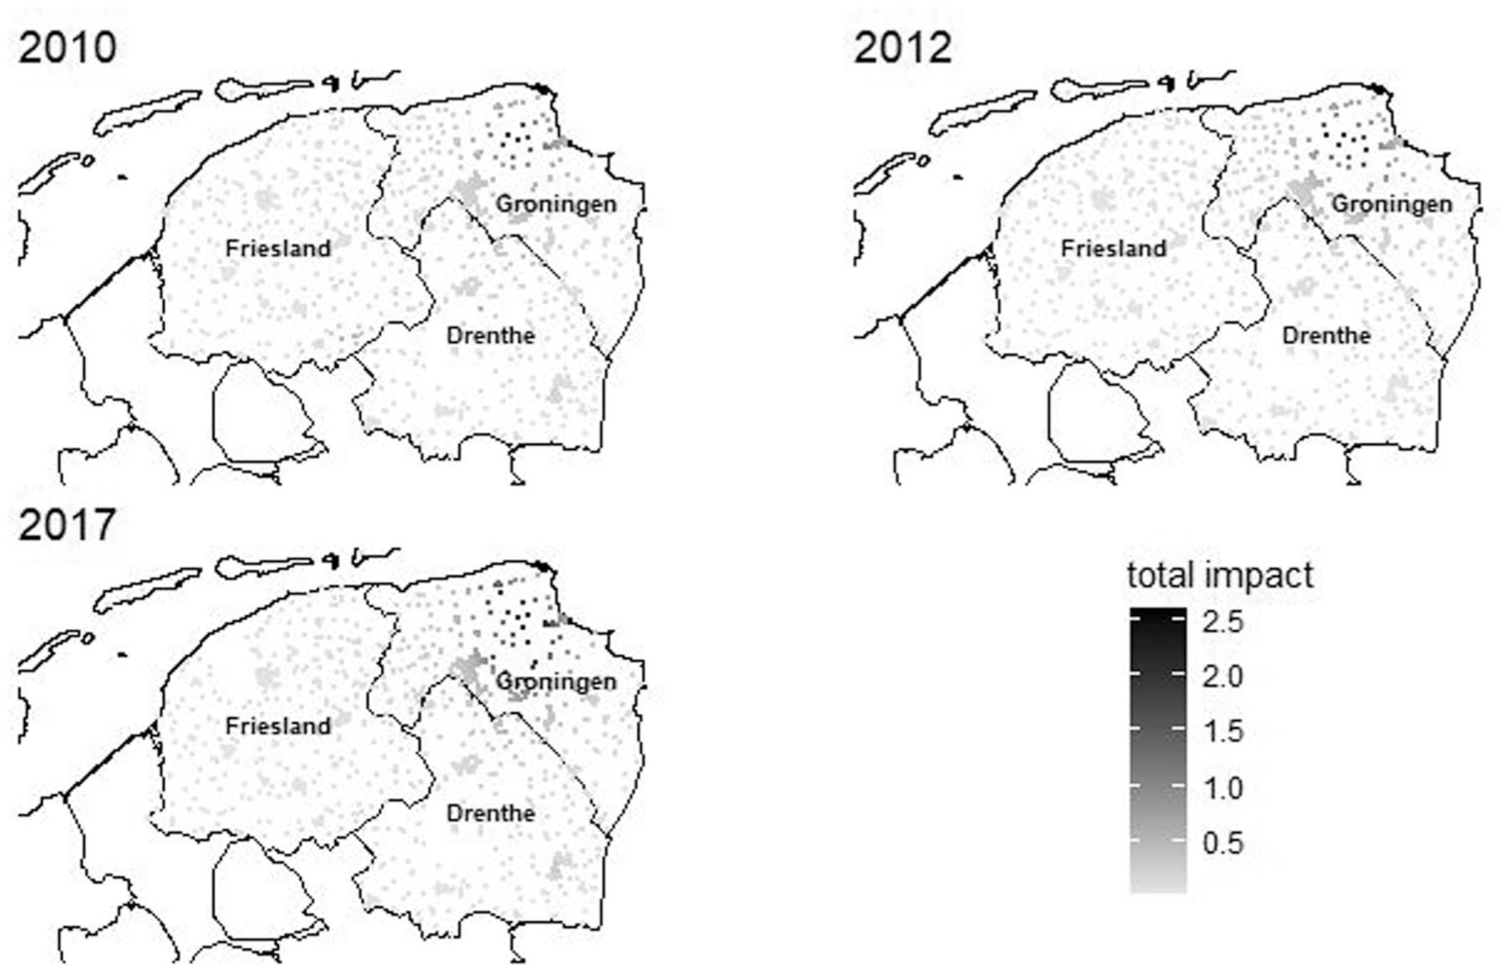
Our primary interest is polling station-level GL vote share, which serves as our main outcome variable. That is, the share of GL votes out of total votes cast at a particular polling station. The vote shares of other parties will also be used as outcome measures in secondary models. Maps of these polling stations across the three provinces can be found in Figure 1, which displays GL vote share by polling station for the 2010, 2012 and 2017 elections.
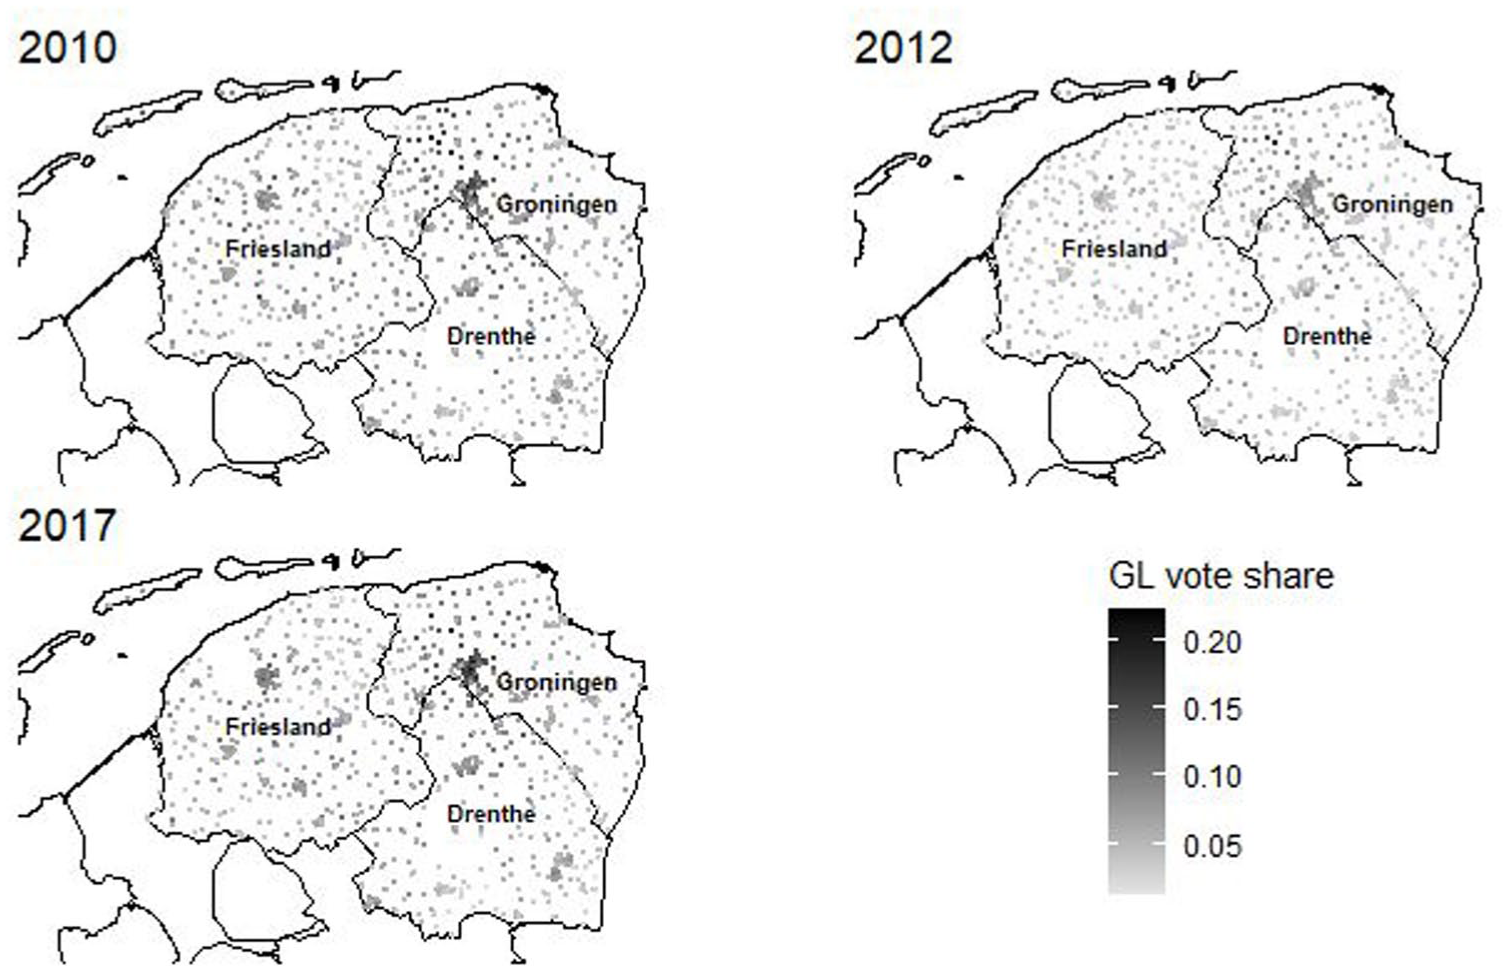
GroenLinks (GL) vote share across elections.
Fine-grained data is important for a study on disaster impact as proximity to hazards may be highly significant to lived experience. Our use of polling station-level data is likely the most fine-grained possible without individual-level data (which is difficult to collect at a large scale with sufficient anonymity). This gives us the appropriate balance of a broad sample but with geographical specificity.
Earthquake data
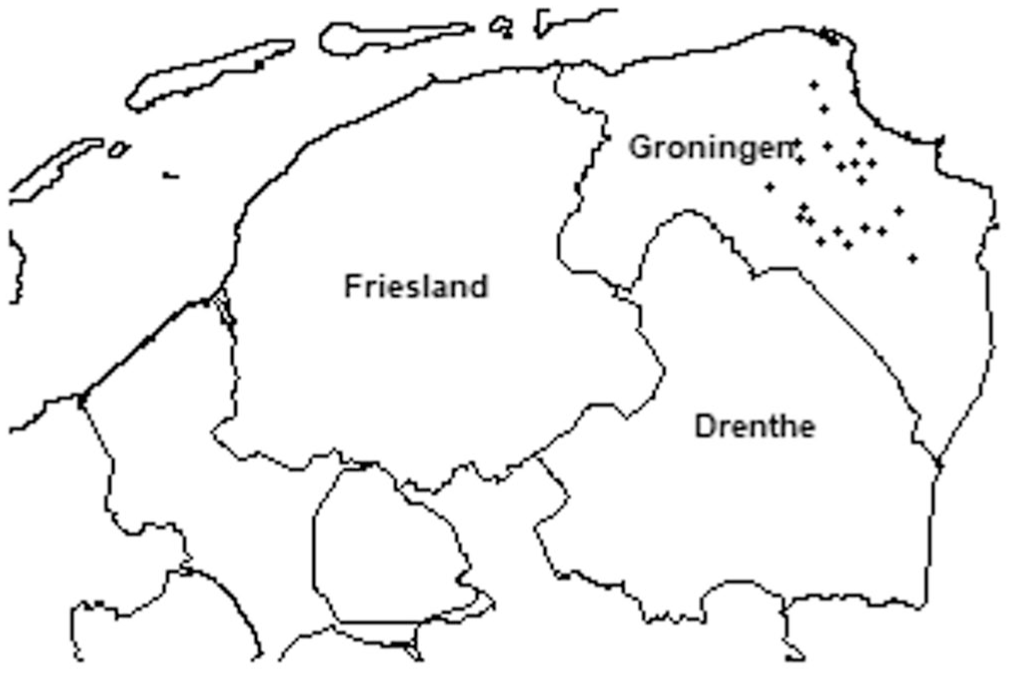
Earthquake data in the Netherlands is made available online by KNMI. 6 The data available to us includes locations and magnitudes of earthquakes from the mid-1980s onward. Figure 2 demonstrates that, while there is a concentration of earthquake closer to drilling sites, earthquakes affect more distant areas in both Groningen and the two neighboring provinces. This supports our assumption of randomness in earthquake distribution when controlling for distance from gas wells. It also shows earthquakes increasing over time.
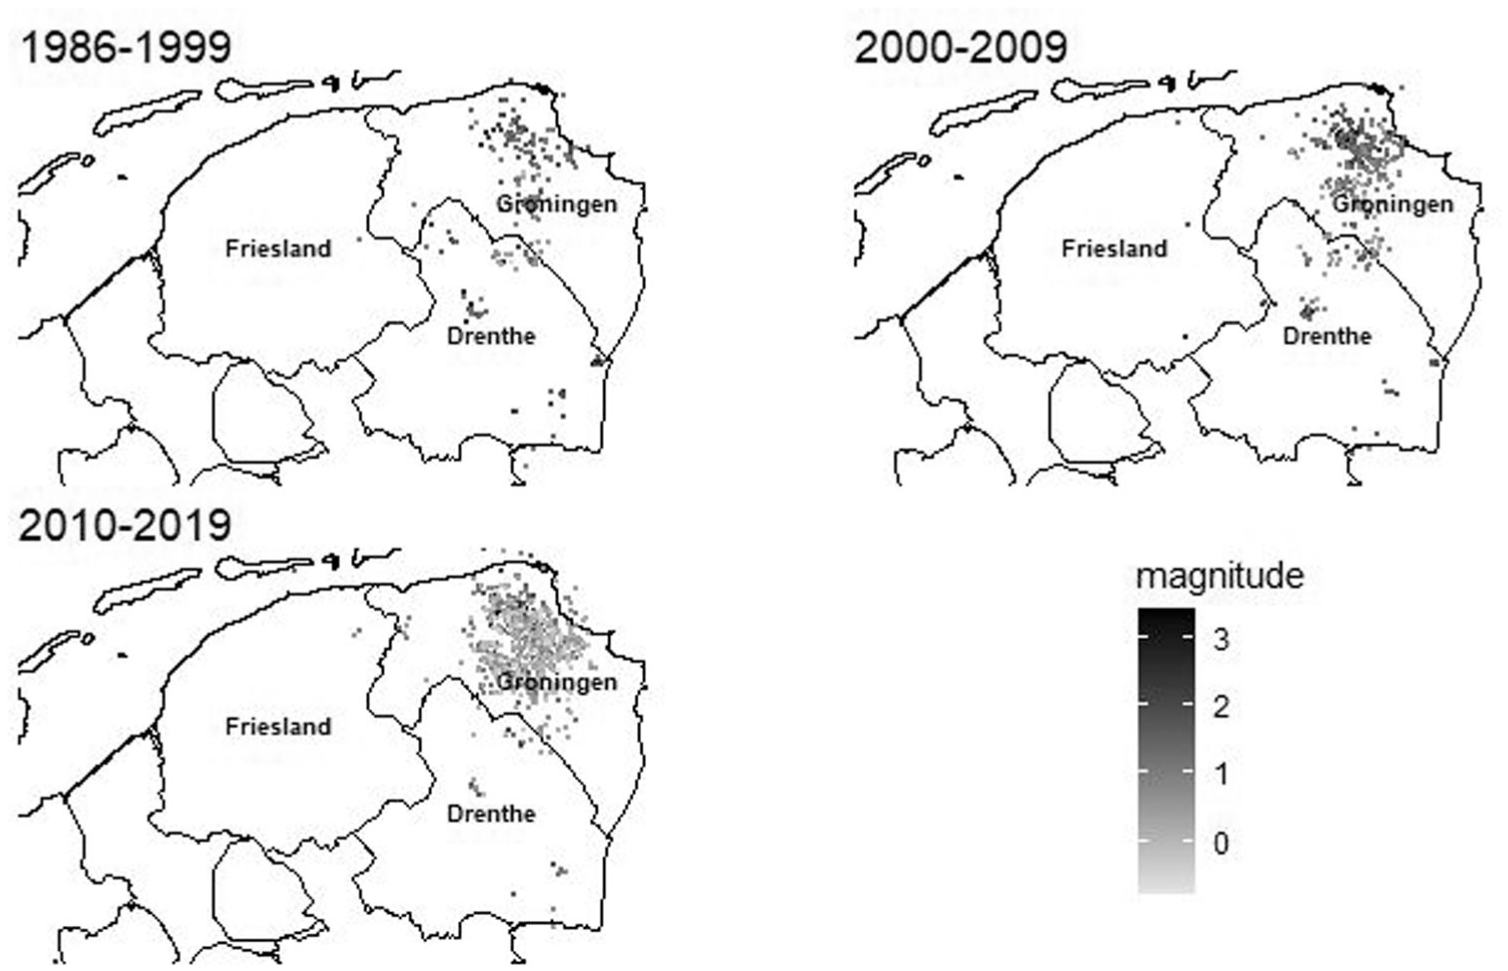
Earthquake magnitudes (Richter scale) over time.
Given we study elections in 2010, 2012 and 2017, the relevant set of earthquakes we use are those that occur under the incumbent government going into these elections. These range from 22 February 2007 (following the formation of the final government of Prime Minister Jan Peter Balkende − the starting point for earthquakes included for the 2010 election) up until 17 March 2017 (before the final election we study), for a total of 891 distinct earthquake incidents.
Using the epicenter and magnitude of the earthquake combined with the location of the polling station, we can calculate PGV − a measure of earthquake impact − of each earthquake for a given polling station. PGV is a measurement of earthquake impact at a particular location of interest that moderates the earthquake’s local magnitude with the distance to that location. It is specifically adjusted to better account for earthquakes of smaller magnitudes. We follow the latest methodology in calculating PGV described by Bommer et al. (2017). Briefly, PGV is highest near the epicenter of the earthquake and quickly approaches zero as the distance between the epicenter and the location of interest increases.
In more detail, PGV is determined by the following basic formula:

where
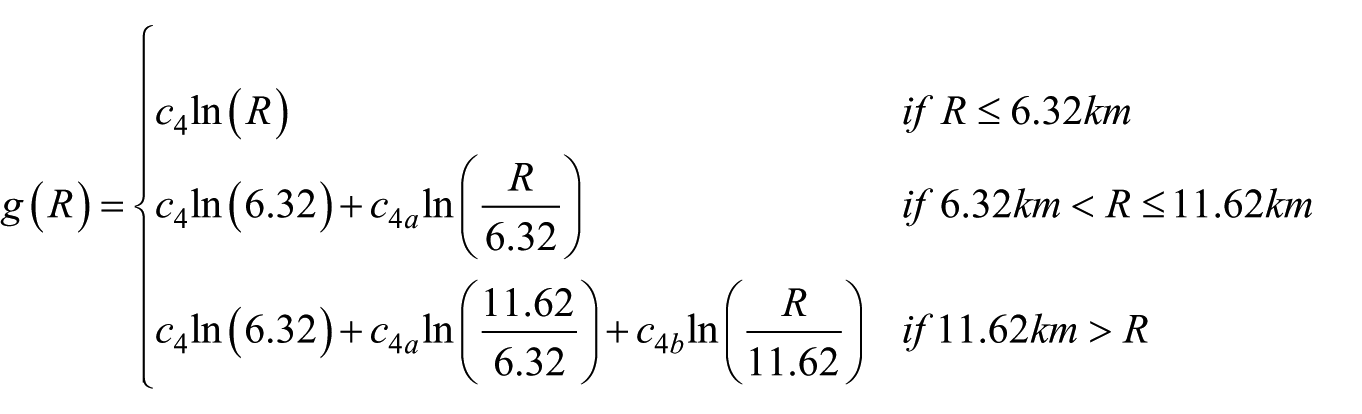
The adjusted distance
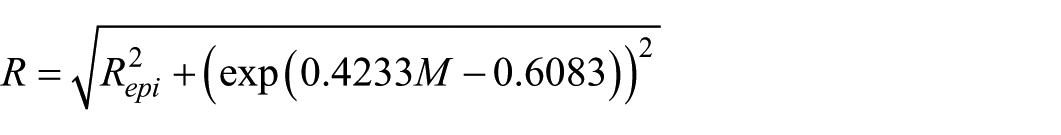
where
For each polling station-election year observation, we calculate PGV for every recorded earthquake between the installation of the previous government and the election date (which varies between 2 to 5 years). The sum of these values serves as our main explanatory variable. For any individual earthquake, PGV approaches zero quickly as distance grows (see graphs in Bommer et al. (2017)). Thus, this sum measure simultaneously approximates a threshold measure as earthquakes only add to the sum if they are sufficiently close and strong. Collectively, a 1 unit increase in sum earthquake impact is therefore equivalent to an increase by 1 in sum magnitude on the Richter scale. Figure 3 shows the distribution of PGV across all polling stations and all elections.
Total earthquake impact by election year.
The supporting information also includes results from analyses only considering the maximum earthquake impact in the period prior to each election as an alternative measure of the explanatory variable. However, we prefer sum impact as our primary measure given that it is more representative of the on-the-ground experience of repeated and regular earthquakes.
Earthquake impact at polling stations will not be accurate to the experience of every individual voter. But again, this is likely the most precise approximation possible without individual-level data, especially because Dutch voters are assigned a call-to-vote card (oproepkaart) that obligates them to use their nearest polling station. Herein lies the strength of our design that combines earthquakes with polling station-level election data to find appropriate variation in experiences of environmental adversity.
Further data and controls
All models control for mean distance between each polling station and active gas wells. Controlling for the location of gas extraction is key for our identification strategy which assumes that earthquakes are randomly distributed given the presence of drilling sites in the vicinity. Data on gas well activity and location is taken from Nederlandse Olie- en Gasportaal (NLOG, Dutch Oil and Gas Portal). 7 Figure 4 shows the location of each active gas well site used to create this control; NLOG data states that these were the only active gas wells for the studied period and all these gas wells were active for all three election periods in our data.
Drilling locations at the Slochteren gas fields.
All models also control for total votes cast at each polling station. This approximates an urban−rural control that is necessary given the importance of this divide in determining the pro-environment vote (Dolezal, 2010).
A more precise measure for urbanness (and further potential controls) is provided by Statistics Netherlands (Centraal Bureau voor de Statistijk) at the municipal level. 8 Unfortunately, these municipal-level variables are only available from 2016 onwards. This means that we are unable to have these controls vary by election year (which for our purposes are 2010, 2012 and 2017). Instead, we run additional models where we statically apply the 2016 values as controls for all three election-years, varying by municipality. Variables used in this manner include average total natural gas consumption, number of businesses in the ‘industry’ or ‘energy’ sectors, car density (number of passenger cars by area), and degree of urbanness (from 1 to 5).
Table A.1 in the Online Appendix offers a descriptive overview with median values for all these variables at the provincial level. They show reasonable balance in the covariates that serve as controls, though not perfect: Friesland has fewer cars while Drenthe has less industry. They also demonstrate the appropriate variation for variables that depend on proximity to gas extraction, namely the impact of earthquakes and distance to gas wells.
Various combinations of fixed effects are also included in some models. These can be either election year fixed effects (to account for unobservable differences across time), municipality fixed effects (to account for unobservable differences across location), or both simultaneously. Two-way fixed effects are especially useful when studying a staggered treatment (such as earthquakes that occur at different times or locations), as they can help isolate the treatment effect by comparing outcomes within the same region (or municipality in this case) before and after treatment. Nonetheless, the complex interaction between place and time fixed effects can make it difficult to interpret the estimated coefficients, especially when dealing with non-linear effects.
Results
We report effects in the main paper through marginal effect plots. Regression tables − including tests that subset to single provinces or include various fixed effects − can be found in the supporting information. See Online Appendix Tables A.2 and A.3 for the main results, Tables A.4 and A.5 for models with further municipal level-controls, Tables A.6−A.8 for non-linear models, Tables A.9 and A.10 for placebo tests and Tables A.11−A.14 for broader effects.
Main effects
The marginal effects shown in Figure 5 support the expectation that polling stations with greater earthquake impact will report a higher Green Party vote share. All nine presented models show positive correlation, although the main models with election year fixed effects and the model subsetted for Groningen are not conventionally significant. 9
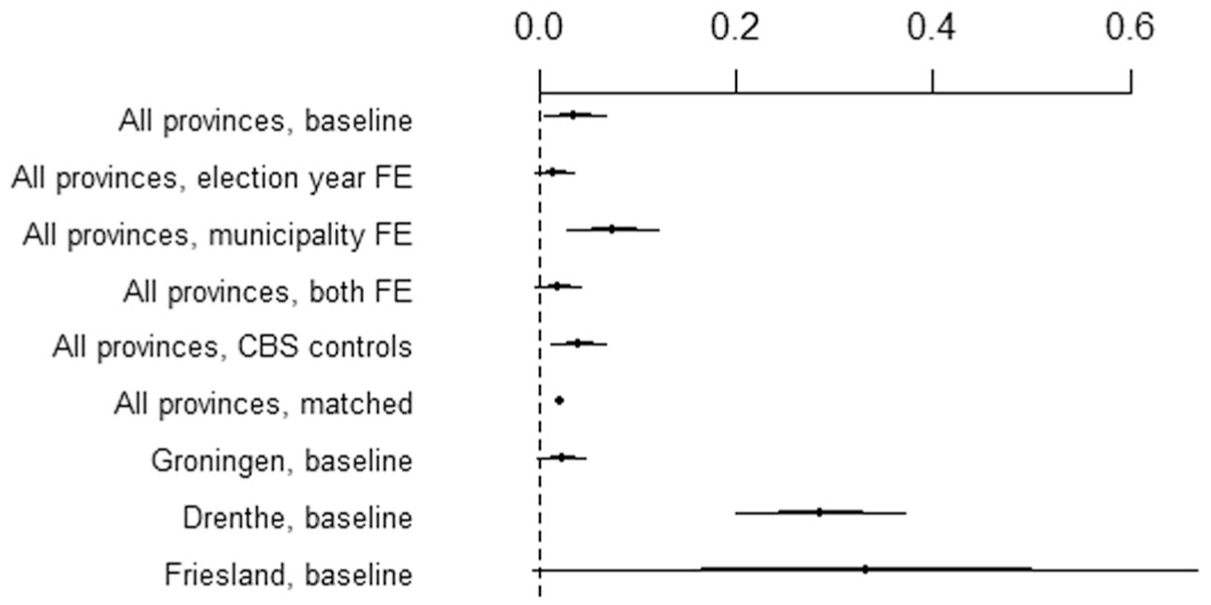
Marginal effects of earthquake impact since the previous election on GroenLinks vote share. All models use standard errors clustered by municipality, and control for number of votes cast and mean distance from active gas wells. This figure corresponds to Online Appendix regression Tables A.2, A.3 and A.4.
In the baseline model, we see a 3.5 percentage point increase in GL vote share associated with a 1-unit increase in earthquake impact. Across other specifications − including fixed effects, municipal-level controls with and without matching, 10 or subsetting to specific provinces − this effect varies from as low as 1.5 percentage points (model with election year fixed effects) to as high as 33 percentage points (model for Friesland). It is worth noting that observations within Groningen are more regularly treated with earthquakes than those in Drenthe or Friesland given their proximity to the gas fields, and thus the effects for Groningen may be more robust (though subsetting to just Groningen incurs issues of sample size).
The presence of fixed effects complicates the interpretation of causal variables. We briefly employ here some practices advocated by Mummolo and Peterson (2018) to support discussion. The following pertains to the model in Figure 5 with both fixed effects included simultaneously − corresponding to column 4 of Online Appendix Table A.2 − after accounting for the reduction in variance due to the application of fixed effects. Following this adjustment, a one standard deviation increase in earthquake impact increases the Green Party vote by 0.54 percentage points. An increase in earthquake impact equivalent to the size of the variable’s 95th percentile increases the Green Party vote by 3.03 percentage points. We argue that the latter value may be of particular interest: it captures the effect of moving voters from an area not prone to earthquakes to one highly exposed to earthquakes. Alternatively, it can be phrased as adding the effect of gas extraction (through its propensity to cause earthquakes) to an area without such extraction.
In the Online Appendix, further models are presented with alternative operationalizations of earthquake impact. One set uses the impact of the single strongest earthquake in the relevant period. Here, only the effect in the model subsetted to Drenthe is conventionally significant, but positive effects can also be seen in further models (see Online Appendix Tables A.19−A.22). Again, we reiterate that it is not surprising that significance is more difficult to find in this alternative specification as the causal variable has less range and spread. Histograms in Figures A.1 and A.2 of the Online Appendix visualize this. A further alternative looks at earthquake impact from only the two years prior to each election, where the results are less consistent (see Online Appendix Tables A.23 and A.24), suggesting that the aggregate effect may be driven by older earthquakes. This is suggestive that the temporal effects of earthquakes are not necessarily linear; we interrogate this further in the next sets of results.
Non-linear effects
Figure 5 shows that the marginal effect of total earthquake impact seems to be greater in the neighboring provinces of Friesland and Drenthe than in Groningen. This pattern aligns with our secondary expectation of a non-linear relationship between earthquake impact and the pro-environment vote.
With our data that is more precise in terms of impact and location, we can test for this non-linearity. We do this by adding a square of our primary explanatory variable of total earthquake impact into our original baseline model. The results of this model are presented in Figure 6, supporting the inverted u-shape relationship proposed. As earthquake impact increases up to around 1.5 PGV, the positive effect on voting for the Green Party grows, but the effect size is reduced for earthquake impacts beyond this point.
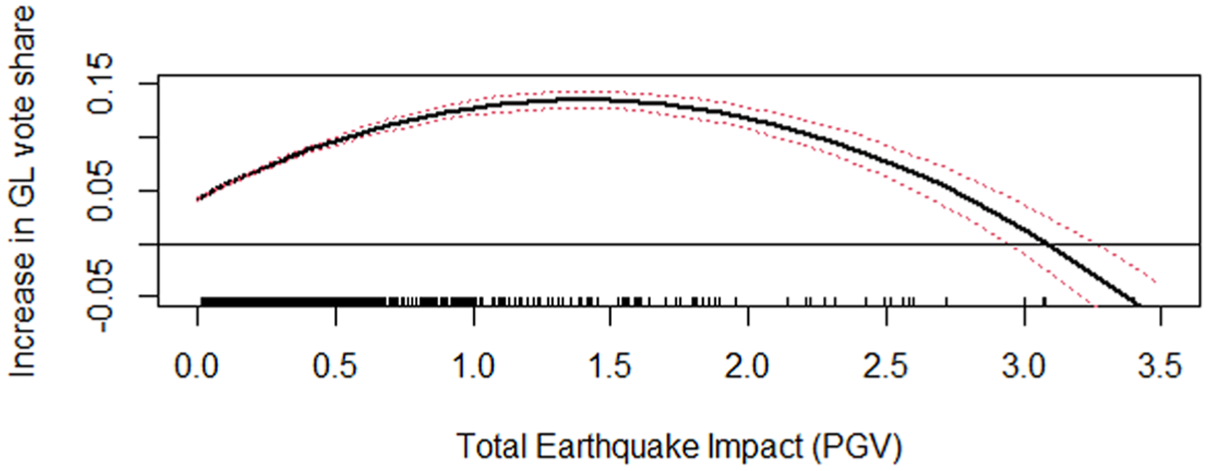
Marginal effects of earthquake impact on GroenLinks vote share − varying by level of impact. This figure corresponds to Online Appendix regression Table A.6.
What about temporal non-linearity? Is it also the case that earthquakes slightly removed from a given election are more likely to increase Green Party vote share? To address these questions, we break up the earthquake impact variable − which aggregated earthquakes over the previous government’s tenure − into one-year bins. That is, we create variables corresponding to impact from earthquakes that occur one, two, three, four and five years prior to each election. We then proceed to regress the first four bins in one regression model to obtain the disaggregated effect of earthquakes in particular time frames. Such a regression only includes data from the 2010 and 2017 elections. For the 2012 election, four bins could not be created as the outgoing government was in power for less than two years and thus the election must be excluded from this regression. We report marginal effects from these regressions in Figure 7.
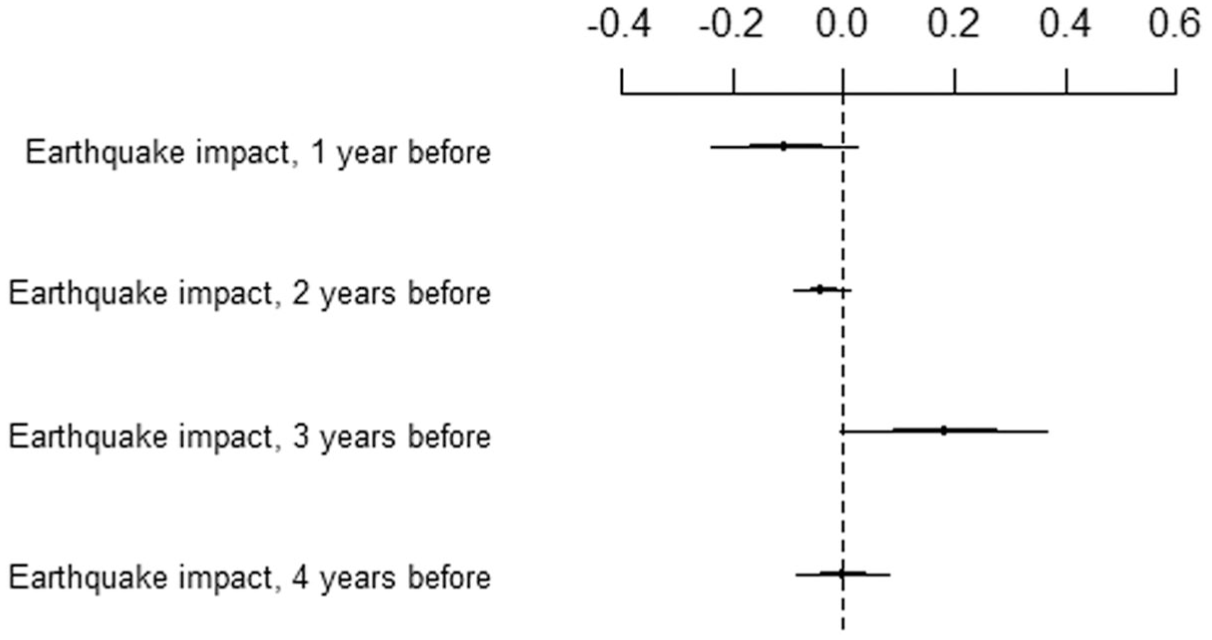
Marginal effects of earthquake impact binned by year on GroenLinks vote share. All models use standard errors clustered by municipality, and control for number of votes cast and mean distance from active gas wells. Only results from the model using all provinces’ data and no fixed effects are shown here. Only includes data from elections where four year-bins could be made, namely 2010 and 2017. This figure corresponds to Online Appendix regression Table A.7.
Figure 7 suggests some difference in the effect of earthquakes depending on the specific time frame. Earthquakes three years before the election appear to have a positive impact on voting, while earthquakes in the other bins instead report negative or near-zero effect sizes. Still, all these effects are statistically insignificant, and it is only when municipality fixed effects are added that earthquakes from three years ago become significant (Online Appendix Table A.7).
Placebo test
While we find that total earthquake impact since the previous election has a positive correlation with GL vote share in the current election, we still want to make sure that this association is being driven by the earthquakes themselves and not confounders associated with earthquake occurrence. For example, it could be the case that the same regions most impacted by earthquakes happen to also be home to the highest concentrations of GL voters.
Thus, we repeat the models run for our main results but using results from the previous election as the outcome variable. In other words, we are now measuring the effect of earthquakes following an election on that election’s results. If it is truly earthquakes that are driving the effects we found in the analyses above, then we should no longer find consistently positive effects of these irrelevant later earthquakes. This additional check reported in Figure 8 thus serves as a placebo test for our ‘treatment.’ The results shown in Figure 8 stand in stark contrast to the main effects shown in Figure 5. Now, rather than positive effects, we find either insignificant or even negative effects. In all, this test gives us more confidence that the positive effects identified earlier are due primarily to the earthquakes, and not some other difference between affected and unaffected areas.
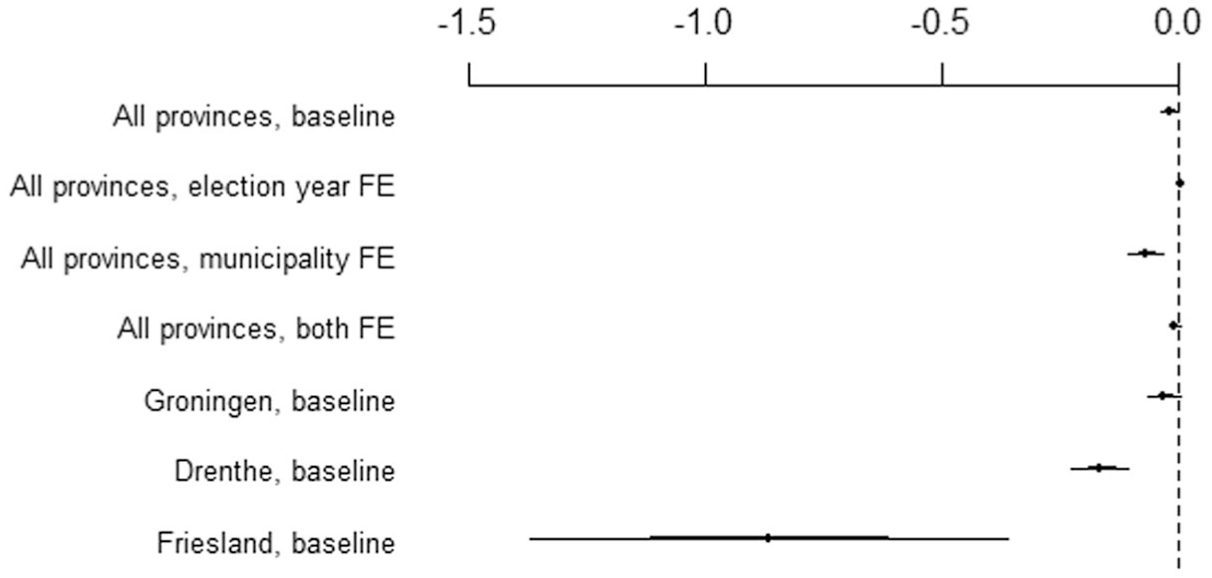
Marginal effects of earthquake impact on GroenLinks vote share in the prior election. All models use standard errors clustered by municipality, and control for number of votes cast and mean distance from active gas wells. This figure corresponds to Online Appendix regression Tables A.9 and A.10.
Broader effects
Finally, to see how earthquakes affect the vote share of other main parties in the Netherlands, we rerun the baseline model with vote shares of the other five largest parties in the Netherlands as the outcome variable. These are Christen-Democratisch Appel (CDA), Partij van de Arbeid (PvdA), Socialistische Partij (SP), Volkspartij voor Vrijheid en Democratie (VVD) and Partij voor de Vrijheid (PVV). Where relevant, a dummy variable for membership in the governing coalition is added to capture any possible incumbency effects.
Results are shown in Figure 9. The most notable effects are that induced earthquakes appear to significantly and negatively affect the vote share of PvdA, the Dutch Labour Party. If we accept that disasters can improve the popularity of Green parties, then the effect on PvdA popularity may reflect what is argued for by McAllister and bin Oslan (2021): because Green parties are typically competing for votes from left-leaning voters, other leftist parties suffer when Green parties gain in popularity. The effects for the remaining parties tested are either much smaller (for socialist SP and Rutte’s VVD) or statistically insignificant (for CDA and PVV). This suggests no broad waves of popularity or unpopularity brought on by the earthquakes outside of the Greens and pro-labour PvdA.
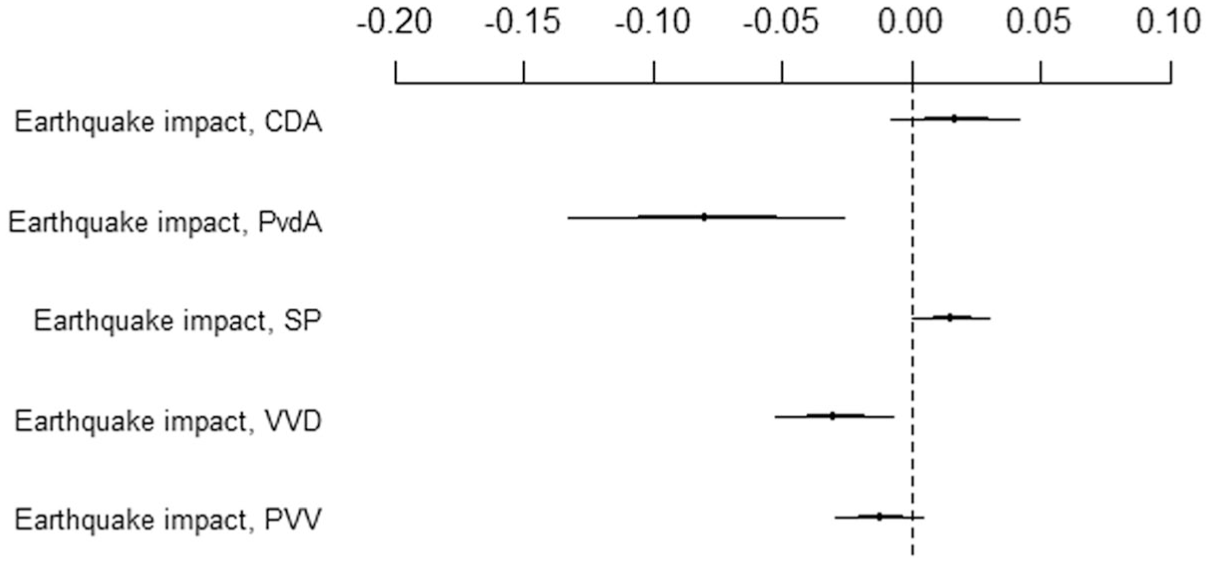
Marginal effects of earthquake impact across all provinces since the previous election on other parties’ vote shares. All models use standard errors clustered by municipality, and control for number of votes cast and mean distance from active gas wells. Only the model for each party that uses all provinces’ data and no fixed effects is included here. This figure corresponds to Online Appendix regression Table A.11.
The supporting information includes results for models that combine the vote share of GL with the vote share of PvdD − the next largest pro-environment party (Online Appendix Tables A.15−A.18). The results hardly change compared to the main models, likely due to the relatively small vote share of the latter party.
Conclusion
Throughout this study of induced earthquakes in the Netherlands, we discover evidence that exposure to human-caused environmental disasters is associated with pro-environment preferences at the polls. We achieve this with data of greater quality than what has come before, allowing us to demonstrate stronger support for this theory than previous empirical studies. We also demonstrate support for the possibility of a non-linear relationship between disasters and pro-environment preferences. This may help consolidate findings in the literature that show that citizens do not necessarily prioritize the environment post-disasters (Garside and Zhai, 2022; Hilbig and Riaz, 2024; Melville-Rea, 2022), as the most directly impacted may instead be prioritizing material well-being.
Supplemental Material
sj-pdf-1-ips-10.1177_01925121251397637 – Supplemental material for Shaking up the vote: The electoral impact of induced earthquakes
Supplemental material, sj-pdf-1-ips-10.1177_01925121251397637 for Shaking up the vote: The electoral impact of induced earthquakes by Jordan H McAllister and Afiq bin Oslan in International Political Science Review
Supplemental Material
sj-zip-2-ips-10.1177_01925121251397637 – Supplemental material for Shaking up the vote: The electoral impact of induced earthquakes
Supplemental material, sj-zip-2-ips-10.1177_01925121251397637 for Shaking up the vote: The electoral impact of induced earthquakes by Jordan H McAllister and Afiq bin Oslan in International Political Science Review
Footnotes
Acknowledgements
The authors thank Michael M. Bechtel, T. Ryan Johnson, Evelina Jonsson, Paul Meißner, Julian Müller, Benjamin S. Noble, Keith E. Schnakenberg, Heidi Tang and audiences at Environmental Politics and Governance Online 2023, ‘Earth Observation in the Social Sciences’ 2023, and Elections, Public Opinion and Parties 2024 for helpful feedback. They also thank J. Paul Elhorst, Hans R.A. Koster, Benjamin S. Noble, Jeremy Siow, Freek Ogink and Jos van Ommeren for their help in acquiring, processing, or analysing data.
Funding
The authors received no financial support for the research, authorship, and/or publication of this article.
Declaration of conflicting interests
The authors declared no potential conflicts of interest with respect to the research, authorship, and/or publication of this article.
Ethical considerations
Ethical approval not required. No human subjects nor individually identifying data were involved in this study.
Supplemental material
Supplemental material for this article is available online.
Notes
Author biographies
References
Supplementary Material
Please find the following supplemental material available below.
For Open Access articles published under a Creative Commons License, all supplemental material carries the same license as the article it is associated with.
For non-Open Access articles published, all supplemental material carries a non-exclusive license, and permission requests for re-use of supplemental material or any part of supplemental material shall be sent directly to the copyright owner as specified in the copyright notice associated with the article.