
Abstract
Dyadic isolation is the tendency of some individuals to be involved in pairwise interactions rather than in larger group interactions. This article investigates the interpersonal processes associated with the dyadic isolation of individuals with depressive symptoms. We hypothesize that such individuals tend to initiate more and stay longer in dyadic interactions compared to group interactions (dyadic preference hypothesis) and that individuals—irrespective of their own level of depressive symptoms—tend to join and stay longer in interactions when interaction partners have lower levels of depressive symptoms (depression avoidance hypothesis). We analyze two data sets (N = 123) of face-to-face interaction events (N = 86,915) collected with proximity badges at a social event. Hypotheses are tested using a relational event model (DyNAM-i) specifically tailored for modeling group interactions. In line with the dyadic preference hypotheses, individuals with higher levels of depressive symptoms are found to be more likely to join and stay in dyadic interactions. Post hoc analyses reveal that this result only applies to female participants. We find limited support for the depression avoidance hypotheses.
Keywords
As social beings, our emotions are significantly impacted by our relationships and social interactions (Baddeley, Pennebaker, and Beevers 2012; Nezlek, Hampton, and Shean 2000; Nezlek, Imbrie, and Shean 1994). Therefore, the study of mental health and the study of social networks are inevitably intertwined (Barnett and Gotlib 1988; Elmer 2020). Previous research has underlined the impact of social relations and interactions in the development of mental health problems such as depression (Kawachi and Berkman 2001; Keltner and Kring 1998) and the protective role of meaningful interactions in the development of depressive symptoms (Lin, Dean, and Ensel 2013; Schaefer, Coyne, and Lazarus 1981). But the link between mental health and social relations is bidirectional because mental health also affects how individuals interact and form ties with others. It has, for example, been shown that individuals with higher levels of depression are more likely to be socially isolated in both reported relationships and observed interactions (Elmer and Stadtfeld 2020; Kwapil, Silvia, and Barrantes-Vidal 2013; Schaefer, Kornienko, and Fox 2011; Teo 2013; van Zalk et al. 2010a).
But even when not completely isolated, individuals with depressive symptoms may have fewer interaction partners than their healthier peers if they are more likely to interact in dyads than in groups. The phenomenon that some individuals are found to interact more in dyads rather than in larger groups has been coined “dyadic isolation” (Elmer and Stadtfeld 2020)—emphasizing that persistent dyadic interactions can lead to the isolation of pairs of individuals from the rest of the interaction network. Elmer and Stadtfeld (2020) found that dyadic isolation was more prevalent among individuals with higher levels of depressive symptoms. For individuals with depression, dyadic isolation may serve as a precursor to complete social isolation because it can result in smaller social support networks and reduced contact with others. Some individuals may become completely isolated if their few interaction partners eventually reject or avoid them.
Another danger of dyadic isolation is that it might reinforce depressive symptoms. First, co-rumination behaviors can be expected to be more pronounced within dyads compared to larger groups (Rose 2002; Rose, Carlson, and Waller 2007). Moreover, negative affect contagion may also occur more often in dyads than groups (Coyne 1976a; Guan and Kamo 2016; Joiner and Katz 1999; van Zalk et al. 2010b). Like social isolation, dyadic isolation may contribute to a vicious cycle of maladaptive interaction patterns and depressive symptoms (Elmer 2020).
Although previous research found empirical evidence for dyadic isolation, the mechanisms contributing to its emergence are yet to be explored. This study aims to investigate the social processes leading to dyadic isolation in individuals with depression, focusing both on the preferences of individuals with depression and those of their potential interaction partners. Two general classes of social mechanisms are derived and empirically investigated. One relates to individuals with higher levels of depressive symptoms who might prefer dyads over groups (dyadic preference mechanisms); the other relates to their potential interaction partners who might avoid interactions with depressed peers (depression avoidance mechanisms), thus leaving them in interaction situations with fewer people involved. Both mechanisms can contribute to higher levels of dyadic isolation of individuals with depressive symptoms. Three temporal aspects are considered for each of the two mechanisms: individuals’ tendency to join an interaction, their choice of joining a particular interaction if multiple interaction opportunities exist, and their tendency to leave an ongoing interaction.
We analyze face-to-face interaction data collected with RFID social sensor badges (Cattuto et al. 2010; Elmer et al. 2019) at an introductory weekend for first-year undergraduate students. These observations are combined with survey data collected before the introductory weekend containing demographic attributes, prior social relationships, and levels of depressive symptoms. Data were collected as part of the Swiss StudentLife Study (Vörös et al. 2021) and were analyzed in aggregated form (i.e., not considering interaction dynamics) in the study of Elmer and Stadtfeld (2020). In the present study, we go beyond this initial analysis by examining the fine-grained temporal patterns of social interactions recorded by the social sensors. Using a social network perspective, we represent these social interactions as a dynamic two-mode network in which individuals (i.e., the first-mode nodes) form and dissolve ties to interaction groups (i.e., the second-mode nodes) when they join or leave an interaction. At every point in time, the affiliation of individuals with interaction groups is thus represented. The social network approach allows us to consider the social interaction behavior of an individual (ego) dependent on the behaviors of others (alters), thereby providing insights into the dyadic preference and depression avoidance mechanisms described previously.
Our analyses use a relational event model called DyNAM-i (Hoffman et al. 2020). This model expresses the likelihood of a sequence of nonindependent interaction events using the two-mode representation previously described. It considers every event in which an individual joins or leaves a group as the result of multiple processes. For instance, the likelihood of an individual joining a group may depend on the group’s characteristics (e.g., size or average depression level). In a nutshell, the model allows us to study the temporal relation between interactions and depressive symptoms and therefore test our hypotheses regarding dyadic isolation. It can control for other interpersonal processes, such as complete isolation, assortativity on different attributes (i.e., homophily), prior acquaintanceship, and previous interaction dynamics. We investigate how multiple processes simultaneously contribute to (a) individuals’ tendency to join interactions, (b) their choices of interaction groups, and (c) their tendency to leave an interaction that they are part of.
Theory and Hypotheses
Dyadic Preferences
Scholars have long argued that dyadic social situations differ from group situations (Becker and Useem 1942; Malloy 2018; Moreland 2010; Simmel 1902). Some empirical evidence suggests that this difference might be particularly salient for individuals suffering from depression. By studying verbal and nonverbal behaviors in dyadic and group interactions, Youngren and Lewinsohn (1980) found that deficits in interpersonal skills for individuals with depressive symptoms were found more often in groups than in dyadic situations. The authors conclude that “group interactions appear more problematic for depressives than dyadic interactions” (Youngren and Lewinsohn 1980:340). Other research suggests that individuals with a depression diagnosis report spending less time in groups than healthy individuals (Baddeley et al. 2012). Because these results rely on self-reports of social interactions, however, common-method biases might lead to overestimating that effect (Baumeister, Vohs, and Funder 2007; Bernard et al. 1984; Fredrickson and Kahneman 1993). Self-report biases may be particularly problematic when studying depression because individuals with depression can be prone to particular biases, such as discounting positive events or emphasizing negative ones (Nieto, Robles, and Vazquez 2020).
Several arguments could explain why individuals with depressive symptoms prefer dyadic over group interactions. First, dyads may facilitate co-rumination behaviors, often sought by individuals suffering from depression (Rose 2002, 2021; Rose et al. 2007). Co-rumination refers to “excessively discussing personal problems with a dyadic relationship and is characterized by frequently discussing problems, discussing the same problem repeatedly, mutual encouragement of discussing problems, speculating about problems, and focusing on negative feelings” (Rose 2002:1830). It remains unclear whether and how often co-rumination also occurs in groups because previous research has focused on dyadic co-rumination (Spendelow, Simonds, and Avery 2017). Co-rumination is likely to occur more often in dyadic settings, however, because these enable more intimacy (Becker and Useem 1942) and self-disclosure (Cooney et al. 2020; Solano and Dunnam 1985) than group settings. Second, dyadic interactions might alleviate the impairment of certain social skills associated with depressive symptoms (Segrin 2000). As mentioned earlier, these interactions generally offer greater intimacy and ease self-disclosure between interactions partners. Conversational dynamics are also less complex in dyads than in groups because they do not entail the formation of majorities and minorities (Simmel 1902), group norms and roles (Krackhardt 1999), and complex turn-taking rules (Cooney et al. 2020). This lower complexity might be favored by individuals with depression, often experiencing lower energy levels and diminished cognitive abilities (Beck 1979). All in all, individuals with higher levels of depressive symptoms might therefore prefer dyadic interactions over group interactions because they allow them to co-ruminate or because they find them easier to sustain.
At the same time, some arguments could point in the other direction. Because of impaired social skills (Segrin 2000) or social anhedonia (e.g., Atherton, Nevels, and Moore 2015), individuals with depression might favor group interactions because they require less participatory effort than dyadic ones. Because we found comparatively little evidence for this second line of argumentation, we expect individuals with depression to favor dyads over groups.
Preferences for dyadic interactions can be decomposed into two types. On the one hand, individuals with more depressive symptoms might prefer to join other isolated individuals and form dyads over group interactions (i.e., interactions with three or more individuals), thus increasing their time spent in dyads. How such a preference leads to dyadic isolation is illustrated by the top left of Figure 1. On the other hand, individuals may express their preferences for dyadic interactions by staying longer in dyadic interactions than in group interactions (equivalently, leaving group interactions faster), thus increasing their time in dyadic interactions and decreasing their time in group interactions. The top right of Figure 1 shows how such a preference will result in individuals with depressive symptoms leaving groups faster than they leave dyads.
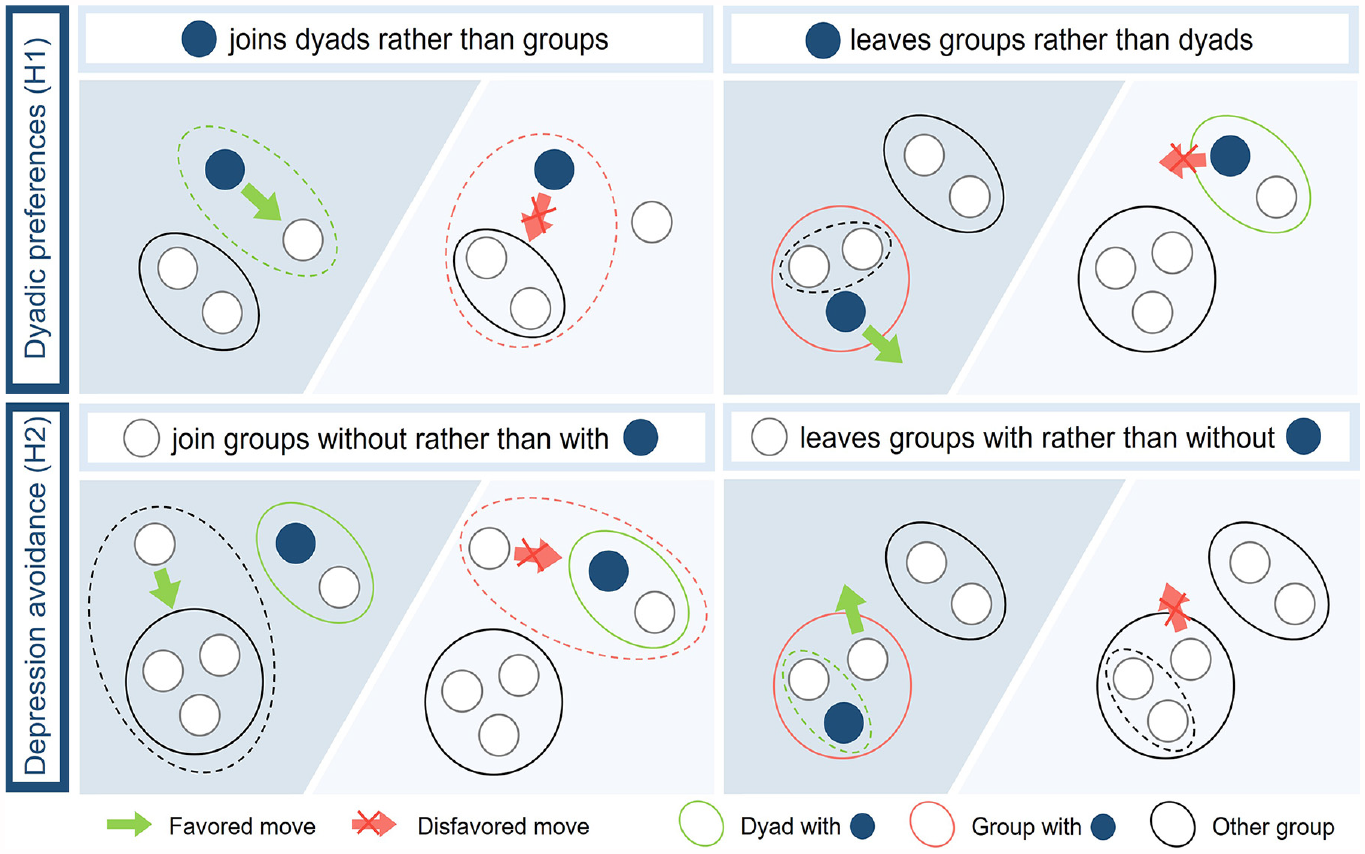
Graphical Representation of the Consequences for Dyadic Isolation of Dyadic Preferences and Depression Avoidance
We hypothesize the following:
Hypothesis 1a: There is a positive association between depressive symptoms and the tendency to join isolated individuals (thereby initiating dyadic interactions) rather than group interactions.
Hypothesis 1b: There is a negative association between depressive symptoms and the tendency to leave dyadic interactions faster than larger group interactions.
Depression Avoidance
Dyadic isolation might not only result from the preferences of individuals with depressive symptoms themselves but also from the preferences of others. Coyne’s interactional theory of depression (Coyne 1976b) emphasizes the importance of interpersonal dynamics: individuals with higher levels of depression are argued to induce a negative mood in others because of their negative mood and interpersonal problems associated with depressive symptoms (Barnett and Gotlib 1988; Segrin 2000). This contagion of negative mood may lead individuals to avoid others with depression (for a meta-analysis, see Segrin and Dillard 1992).
There is some evidence that even strangers can perceive the social impairments associated with depressive symptoms. For example, several experiments show that individuals perceive others diagnosed with depression as less socially skillful in their interactions (Gotlib and Meltzer 1987; Youngren and Lewinsohn 1980). Moreover, mood contagion related to depressive symptoms was reported in various contexts (Joiner and Katz 1999). Interactions with strangers having depressive symptoms can elicit negative feelings in face-to-face discussions (Marks and Hammen 1982; Strack and Coyne 1983) and phone calls (Coyne 1976a). The influence of depressive symptoms, however, particularly mood contagion, might highly depend on the context of interactions, as discussed by Marks and Hammen (1982). Most existing studies use self-reports (Segrin and Dillard 1992), prone to the previously mentioned biases.
Similar to dyadic preferences, the avoidance process described earlier can be broken down into two specific temporal processes. First, individuals might avoid joining interactions (irrespective of group size) with individuals having depressive symptoms. 1 If an individual (irrespective of one’s own depression level) decides not to join a dyadic interaction in which an individual with elevated levels of depression is engaged, the time spent by this individual in dyads is hypothesized to increase (see the bottom left of Figure 1). Individuals might also avoid staying in interactions with individuals having depressive symptoms and thus leave them faster. Individuals with depressive symptoms may then end up in increasingly smaller groups and eventually in dyadic interactions when other individuals leave groups that include them (see the bottom right of Figure 1).
We state the following two hypotheses:
Hypothesis 2a: There is a negative association between the level of depressive symptoms in an interaction group and the tendency of others to join this group.
Hypothesis 2b: There is a positive association between the level of depressive symptoms in an interaction group and the tendency of its members to leave this group.
Other Processes
Other processes can also contribute to the observed levels of dyadic isolation. The first would be individuals’ tendency to interact with similar others (i.e., assortativity or homophily; Lazarsfeld and Merton 1954; McPherson, Smith-Lovin, and Cook 2001). In the case of depression, previous research shows that individuals are more likely to befriend and interact with others that have similar levels of depressive symptoms (Elmer and Stadtfeld 2020; Schaefer et al. 2011; van Zalk et al. 2010a). If individuals with depressive symptoms tend to interact more together but also prefer dyadic interactions, they might be even more likely to be found in dyadic interactions. In that sense, assortativity on depressive symptoms might reinforce the dyadic preference process.
Moreover, dyadic isolation could result from a tendency of individuals suffering from depression to interact in smaller groups in general, without this tendency being particular to dyadic interactions. The time spent in dyadic interactions by these individuals would then be reduced compared to group interactions, thus contributing to the same outcome. Although we do not draw any hypothesis on assortativity or size preferences, we control for them in the analyses.
Empirical Setting
The hypotheses introduced here are tested on the data set presented by Elmer and Stadtfeld (2020), in which dyadic isolation was cross-sectionally associated with depressive symptoms.
Description of the Introductory Weekends
Data were collected during the introductory weekend of two undergraduate university programs one and two weeks into the programs, respectively. Both samples contained students, the event’s organizers, and a study confederate (Cohort 1
Interactions were collected from Friday evening to Sunday noon in the first cohort and from Saturday noon to Sunday noon for the second. During the data collection, a study confederate checked that participants would wear the RFID badges correctly but did not participate in social activities. Sleeping times were determined when the number of badges detecting an interaction dropped (this led to fewer interactions retained than in the original study). The times students were sleeping and periods with lectures and organized games were removed from the data.
During both weekends, meals were seated, but participants could pick with whom to share their meals. Generally, the participants were free to move around and alternated between various activities (e.g., conversation, playing games, dancing).
Depressive Symptoms
Depression scores were assessed using the German version of the Center for Epidemiologic Studies Depression Scale (Hautzinger and Bailer 1993), made up of 20 items on a 4-point scale (internal consistency: Cronbach’s α = .84). Scores in our samples ranged from 1 to 26 (
According to the thresholds proposed by Meyer and Hautzinger (2001), 8 individuals in the first cohort (i.e., 15 percent of the 53 respondents) reported symptoms corresponding to a clinically relevant level of depression (i.e., scores ≥ 16), and 25 (i.e., 47 percent) reported symptoms at the subclinically relevant level (i.e., scores ≥ 9 and <16). In the second cohort, these numbers were 14 and 14, respectively (i.e., 29 percent of the 48 respondents). All in all, these proportions were comparable to values observed in representative samples of university students (Eisenberg et al. 2007; Mikolajczyk et al. 2008). The proportion of individuals reporting clinical levels, however, was notably higher in the second group.
Other Individual Attributes
The first cohort included 73 participants, of which 57 were first-year students and 16 were organizers (students from the second year or above). It included 25 female and 48 male individuals ages 18 to 31 (
Previous Friendships
Students were asked the week before the event to report their friends by answering: “Which of your fellow students would you call a friend?” (originally in German). Because the weekend was organized early in the study program, most students did not know each other for long, as shown by low densities in the friendship networks (on average, individuals reported 2.4 friends among the other weekend participants in Cohort 1 and 2.2 in Cohort 2).
Face-to-Face Interactions
Face-to-face interactions were collected using RFID badges. Each badge was clipped to participants’ clothes at the chest level. It recorded the identifier of other badges in its proximity. Theoretically, any other badge could be detected within a distance of about 1.6 meters and an angle of 65 degrees, representing approximately the proximity needed for two individuals to engage in a face-to-face interaction (Elmer et al. 2019). To assess the accuracy of RFID badges in capturing face-to-face social interactions, Elmer et al. (2019) conducted a study in which they compared RFID data to hand-coded video data of the same interactions. They found that RFID badges captured 50 percent of the interactions (sensitivity), with usually shorter interactions because of detection interruptions. By merging interactions that were no longer than 75 seconds apart, researchers could improve the sensitivity to 65 percent, with only 5 percent of noninteraction time being incorrectly measured (specificity). These results suggest that RFID badges are a relatively conservative measure of face-to-face social interactions, with captured interactions being mostly true positives, but that interaction durations are sensitive to detection problems.
Three processing steps were applied to the original RFID recordings. The first step consisted of merging interactions that were separated by time intervals lower than 75 seconds (as described previously). The second step allowed us to define interaction groups rather than mere interaction dyads. Under this treatment, we assumed that if a simultaneous interaction was detected between individuals A and B and between B and C, then A, B, and C all must have been in a group interaction. The third processing step consisted in defining a list of time-stamped events consisting of nodes (representing the individuals) joining or leaving second-mode nodes (representing the interaction groups), hence creating a dynamic two-mode network. The first step therefore aimed at increasing the precision of the measure of interactions. The second and third steps were performed to allow the analyses of group interactions and the use of DyNAM-i models (requiring a group structure).
For the first cohort, we created 57,277 events, with 30,869 distinct time points defined at the level of the second and spread over a total of 132,692 seconds (≈37 hours). In the second cohort, for which the weekend was shorter, we processed 29,638 events, with 18,215 unique time points spread over 71,102 seconds (≈20 hours). With this data treatment, individuals interacted on average 7 hours and 53 minutes in Cohort 1 and 5 hours and 41 minutes in Cohort 2, and interactions groups were an average size of 2.9 (
Analytical Strategy
Our hypotheses are tested using the modeling framework of dynamic network actor models (Stadtfeld and Block, 2017), more specifically, the DyNAM-i extension developed for data in which actors form nonoverlapping groups and the composition of these groups changes through time (Hoffman et al. 2020). This model allows us to test our hypotheses while controlling for the dependencies between subsequent events (i.e., observations from one interaction are potentially statistically dependent of other interaction observations).
Model Definition
The idea of the DyNAM-i framework is to model the dynamics of interactions as represented by a dynamic two-mode network
The model assumes a three-step process, as illustrated in Figure 2: (1) isolated actors can decide at any time to join an interaction; these decisions are dictated by the joining rate model; (2) once an actor has decided to join an interaction (through Step 1), they must choose which available interaction they want to join; this choice is expressed by the choice model; and (3) an interacting actor can again at any time decide to leave their interaction; this is dictated by the leaving rate model. Steps 1 and 3 are dependent on each other because all actors always compete to do something (either join an interaction if they are isolated or leave one if they are not). Step 2 is independent of the others but conditioned on Step 1.
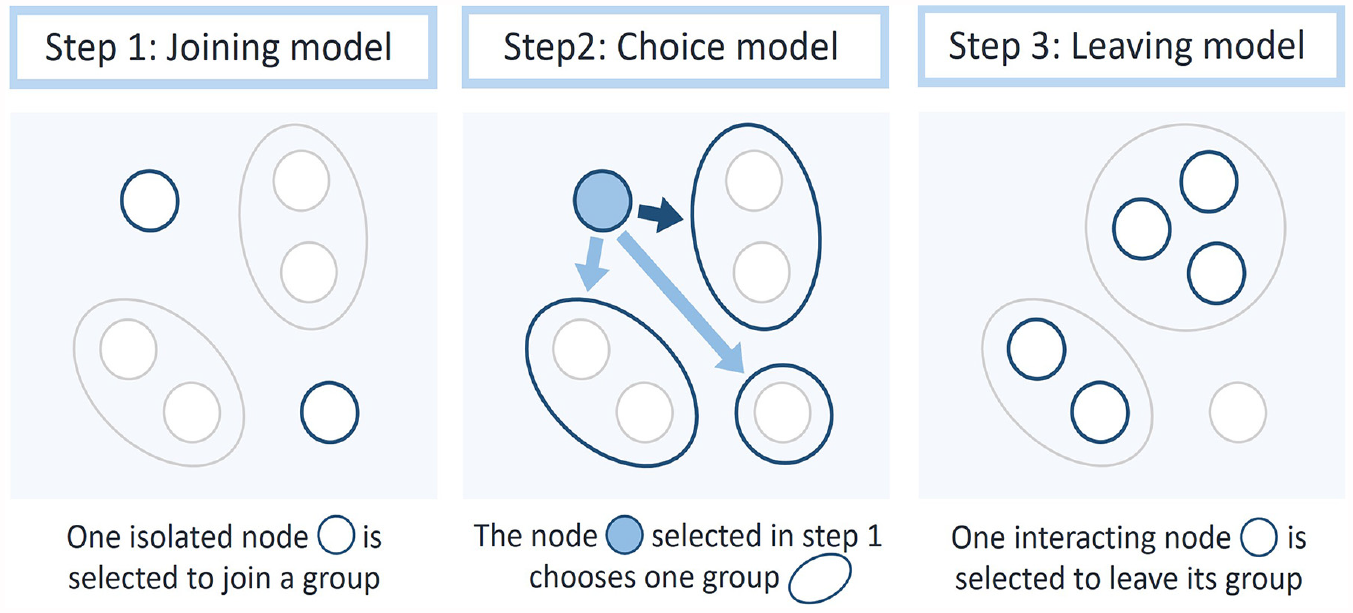
Graphical Representation of the Aims of the Three Parts of the Model for a Fictitious Situation with Six Nodes
The model captures dependencies between subsequent events in two ways. First, the opportunities for the actors to do something at each time point are constrained by the previous events leading to the groups observed at that time. Second, we may specify that the tendencies of actors to join and leave groups depend on their past interactions with others, as shown in the model specification section.
Rate models
Both rate models are expressed as Poisson processes and define the timing of interaction events, similar to other relational event models (Butts 2008; Stadtfeld and Block 2017). Each actor
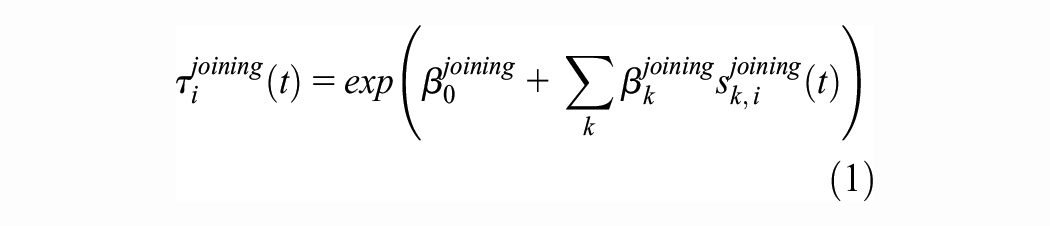
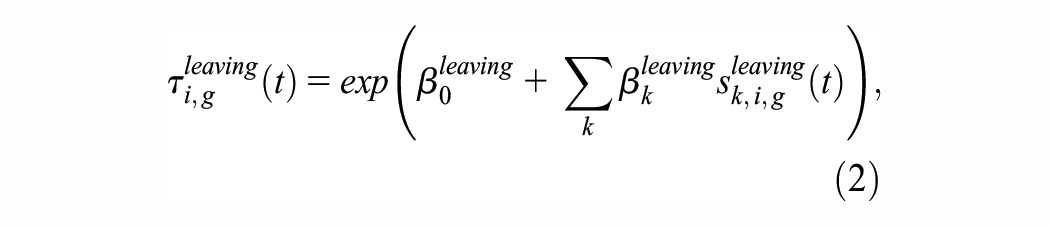
with
At any point in time, all actors compete to initiate an event, whether they are interacting or not. If an actor

Whenever a period was removed (e.g., when participants were sleeping), we considered that this period did not exist, essentially connecting the end of the previous period to the beginning of the upcoming period.
Choice model
The choice model is defined as a multinomial choice model based on utility functions

The probability of actor
One should note that parameters are constant across time, meaning that we assume that individuals’ interaction patterns are constant during the weekend. 5 Parameters for the three parts of the models are calculated using a maximum likelihood procedure (Stadtfeld and Block 2017) using the R package goldfish.
Model Specification
The statistics
The statistics in the choice model are identical to those in the leaving rate model: the first define why individuals choose particular groups, and the other defines why they stay within these groups. The joining model is specified and estimated because it contains important controls (e.g., individual depression levels) even if it does not include hypotheses-related effects.
Effects related to the hypotheses
We first test the tendency for individuals with higher depression scores to join isolated individuals and form dyads, which constitutes Hypothesis 1a, by including an interaction between a dummy effect for forming a dyadic interaction and the effect of the individual depression score. We add the same effect to the leaving rate model to test Hypothesis 1b. If we define


The model also includes two effects accounting for the tendency for individuals to choose or stay with others having higher levels of depressive symptoms, to test Hypotheses 2a and 2b, respectively. These effects are defined as the average depression score of individuals in a group


Covariate effects
The model also controls for other tendencies related to depression that might be operating at the same time and be confounded with the tendency to avoid groups with high depressive symptoms: (1) the tendency of individuals with higher levels of depressive symptoms to join or stay longer in interactions (i.e., sociability tendency), (2) the tendency for individuals to join and stay in groups with others having similar levels of depression (i.e., assortativity tendency; see theory and hypotheses), (3) the tendency to join and stay in groups with a particular level of depressive symptoms (i.e., conformity to a norm tendency).
Following the recommendation of Snijders and Lomi (2019), we operationalize the combination of these tendencies with four different statistics: the average score of a group an individual can join or leave (tests of Hypotheses 2a and 2b), the individual’s depressive score in the joining and leaving models (sociability tendency), the squared difference between the individual’s score and the average score of a group in the choice and leaving models (assortativity tendency), and the squared average of the group in the choice and leaving models (conformity tendency, in conjunction with the first statistics). 6 Although the group’s average score is a simple indicator of the group’s distribution, it assumes that the negative moods of individuals in a group somehow add up linearly. We also test a definition of the depression-related effects using the maximal score in a group to assess whether individuals with particularly high depression scores have a stronger impact. 7
The same effects are included for age. For gender, we use only three effects: an indicator for an individual being female, the proportion of women in a group, and the proportion of individuals of the same gender as the focal individual. 8 We include an interaction between organizer status and dyadic preference for the potential role of organizers in interacting with isolated individuals.
Structural effects
Structural effects are further included to capture the effects of group sizes. First, a dummy variable for dyads captures individuals’ tendency to prefer dyadic interactions. As mentioned earlier, this effect is interacted with the depression score of an individual choosing or leaving a group (tests of Hypotheses 1a and 1b). Second, the size of an interaction group is also added to the choice and leaving rate models. Similarly, the interaction between size and depression score tests whether individuals with depressive symptoms prefer smaller groups, which could be a confounding path for the previous effect (see theory and hypotheses).
Prior friendships and time effects
The effect of prior friendship is captured by the proportion of friends within a group in both the choice and the leaving models.
Three types of endogenous effects further capture the influence of past interactions and specify how previous events will affect the probability of a given event (effectively introducing further dependencies between our events). First, sociability effects capture the tendency of individuals involved in many interactions in the past to join more and stay longer in interactions and are calculated as the (normalized) number of past interactions of a given individual. They represent that some participants interact more or switch more frequently between interactions then others either because of unknown traits or technical reasons (e.g., the way badges were worn). Second, popularity effects represent the tendency for individuals to join and stay longer with those who interacted a lot in the past, measured using the average (normalized) number of past interactions in a group. Third, the tendency for individuals to interact and stay with others they have interacted with in the past is captured by inertia effects, which count for a given individual the proportion of group members who have interacted with this individual in the past. Past interactions were counted within specific time windows (i.e., 5 and 30 minutes).
Results
Descriptive Results: Dyadic Isolation
We first replicate the results of the study of Elmer and Stadtfeld (2020) concerning dyadic isolation. Similarly, we find a positive correlation between depression scores and ratios of dyadic interactions that is positive for both cohorts. A permutation test with 10,000 replications was computed to assess these correlations’ significance by permuting nodes randomly in the same logic as the quadratic assignment procedure specifically devised for network data (Krackhardt 1988). The correlation observed in the first cohort (
Model Results: Dyadic Isolation Processes
We turn to the analysis of the potential mechanisms leading to dyadic isolation by estimating the DyNAM-i models. Tables 1 and 2 present the estimated parameters of the choice, joining rate, and leaving rate models for each Cohort and Cohort 2, respectively. The parameters related to our hypotheses are indicated in bold. We indicate in parenthesis whether a statistic is calculated at the individual level (“ego”) or the level of the group (“group”). 10
Estimated Parameters for the Full Specification of the Choice and Rate Models in Cohort 1
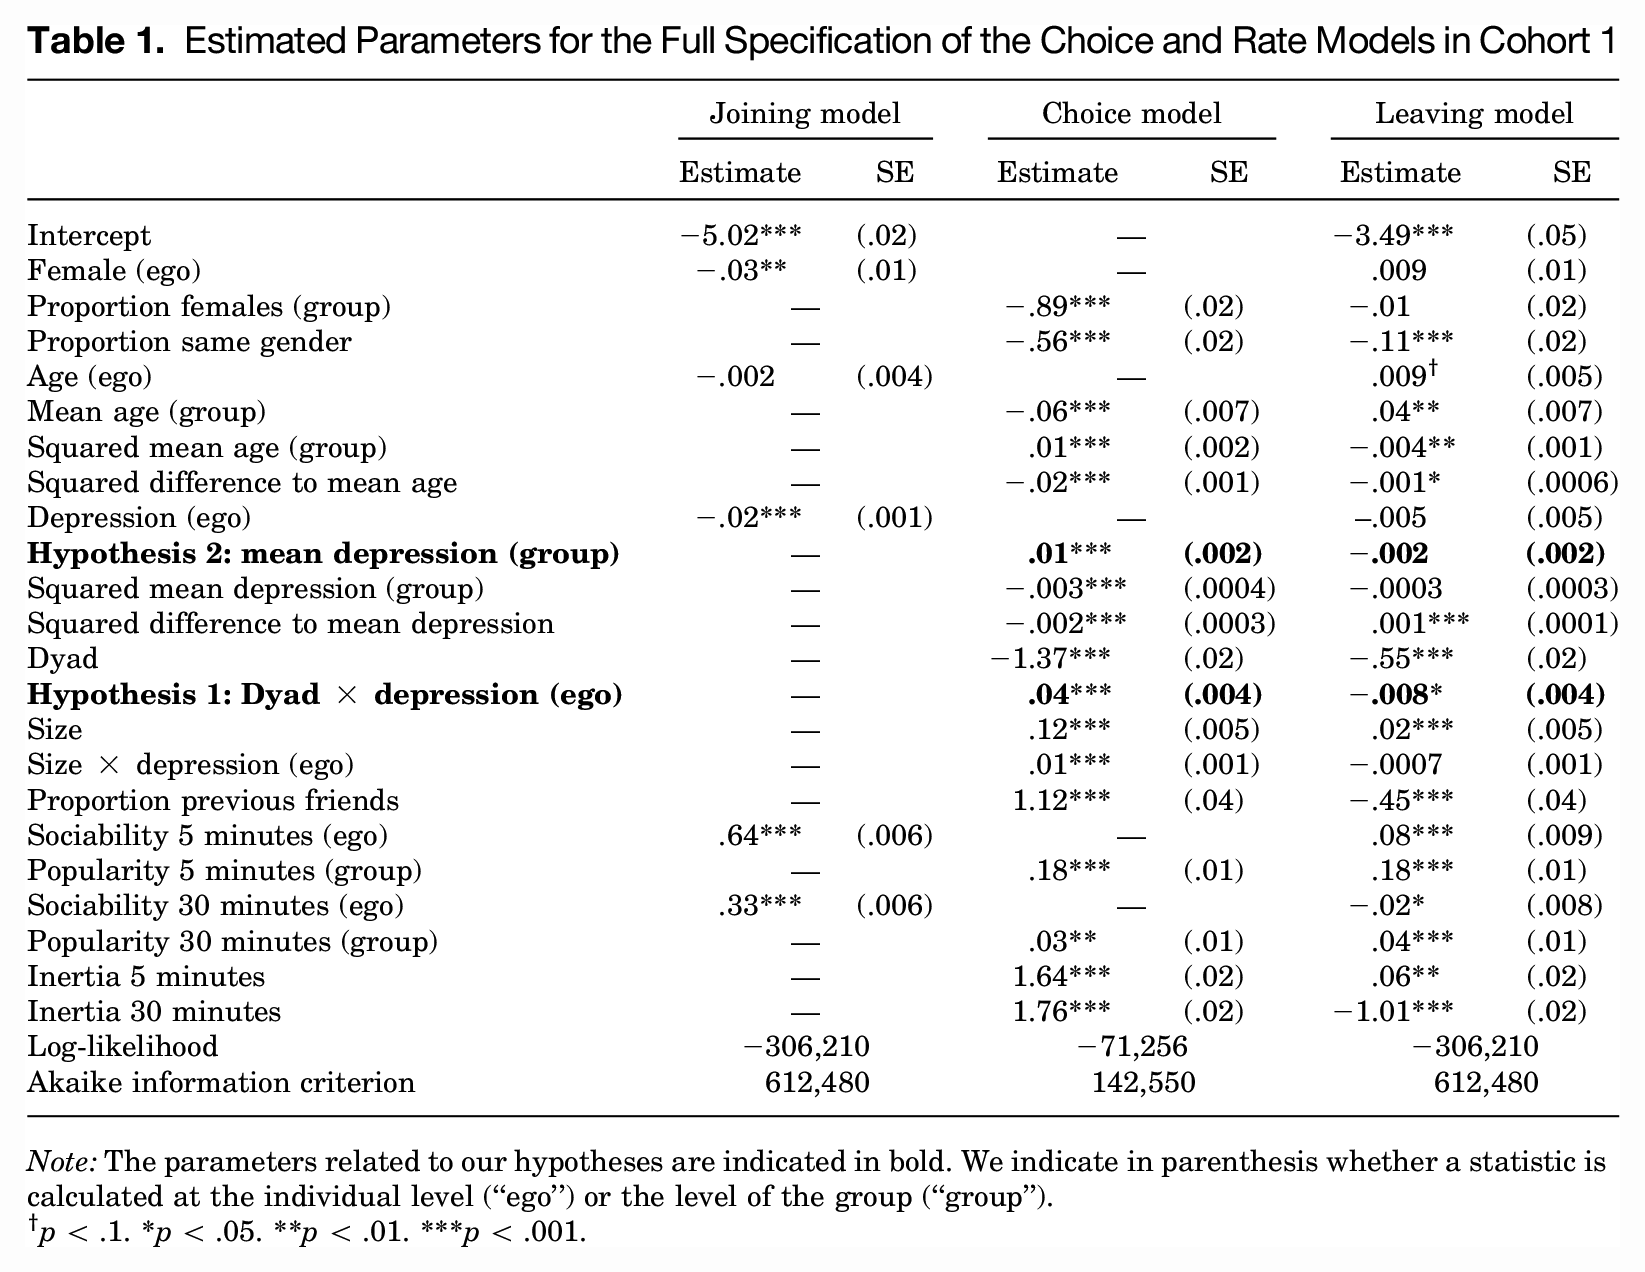
Note: The parameters related to our hypotheses are indicated in bold. We indicate in parenthesis whether a statistic is calculated at the individual level (“ego”) or the level of the group (“group”).
p < .1. *p < .05. **p < .01. ***p < .001.
Estimated Parameters for the Full Specification of the Choice and Rate Models in Cohort 2
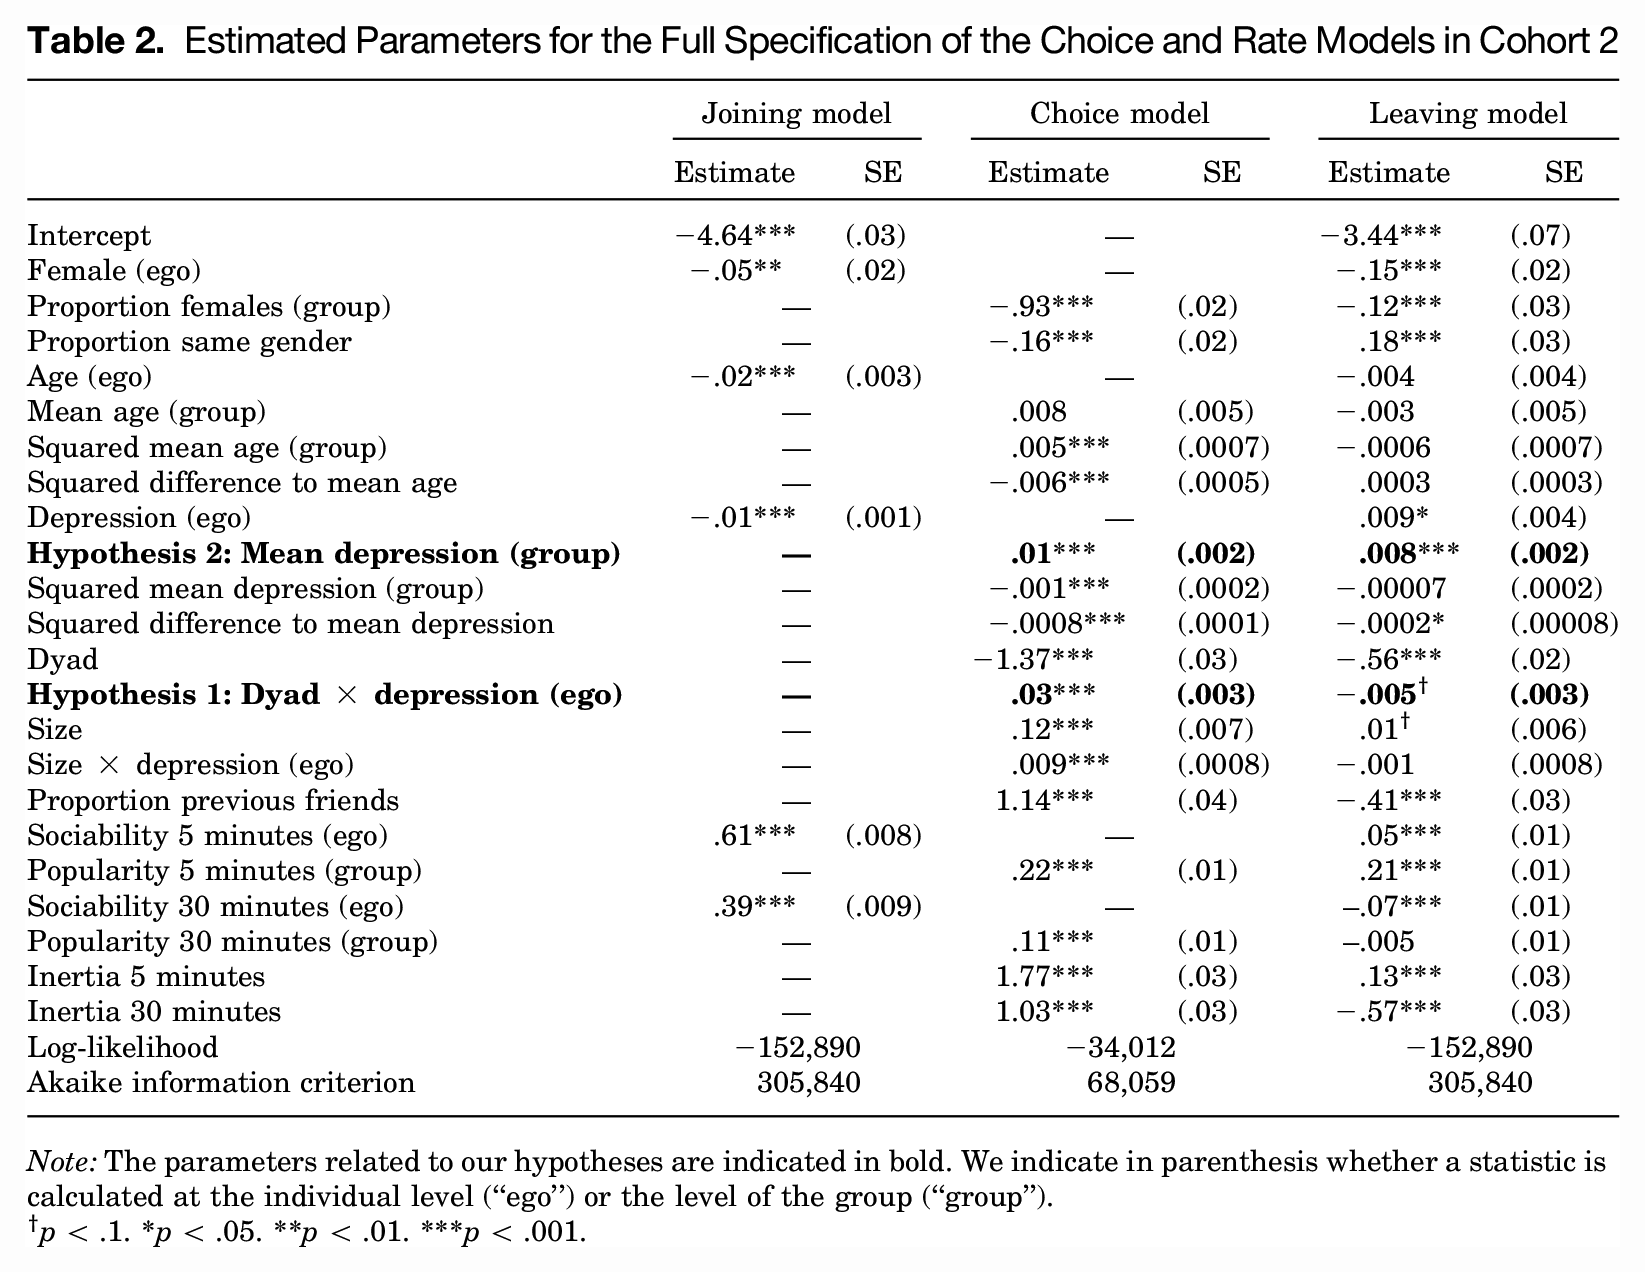
Note: The parameters related to our hypotheses are indicated in bold. We indicate in parenthesis whether a statistic is calculated at the individual level (“ego”) or the level of the group (“group”).
p < .1. *p < .05. **p < .01. ***p < .001.
Dyadic preferences
Regarding Hypothesis 1a, we find a positive and strongly significant parameter for the interaction between depression and dyadic interaction (Cohort 1:
The parameters’ values can further help us understand the magnitude of these effects. Regarding the effect related to Hypothesis 1a in the choice model, we use probability ratios to compare the probability of a given individual choosing a dyadic interaction over an interaction of a larger size. Figure 3a presents this probability depending on the depression score of the individual making this choice. This ratio is calculated using the parameters in Equation 4 related to the preference for dyads, the preference for larger sizes, and the interactions between these two preferences and the ego depression effect. Other parameters are discarded as we make the approximation that other characteristics of the groups remain constant (even though other statistics will likely be somehow affected).
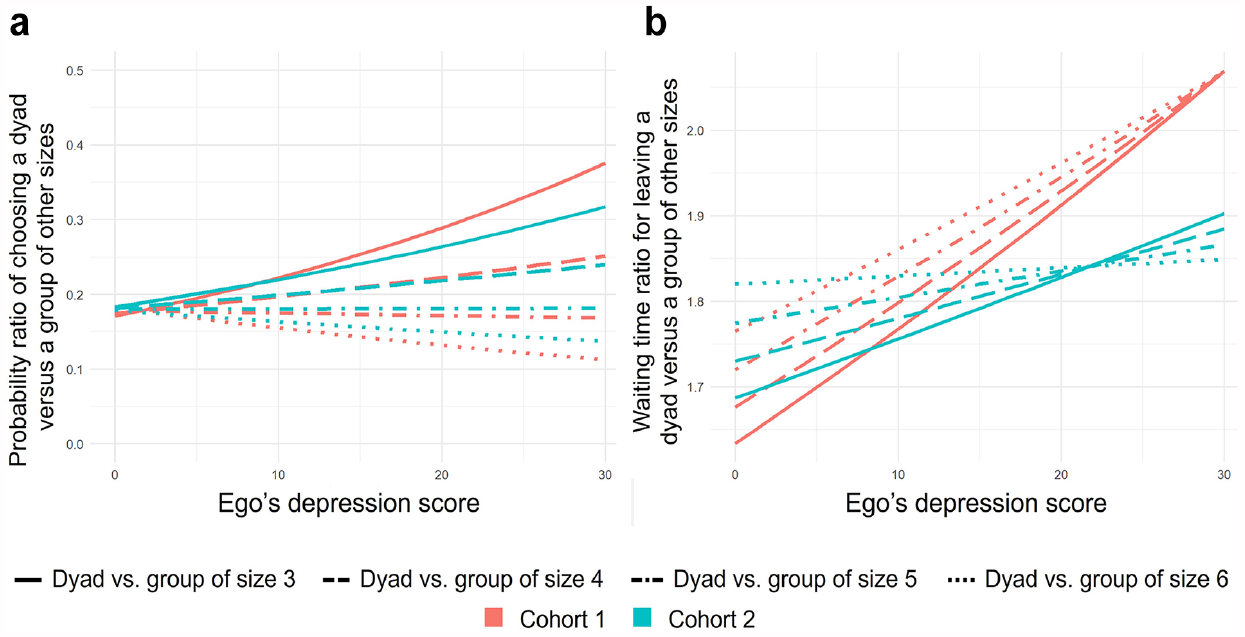
Interpretation of the Parameters Related to Dyadic Preferences: (a) Probability Ratio of Choosing a Dyad versus a Group of Size Three, Four, Five, or Six When Varying the Ego’s Depression Score; (b) Ratio of Expected Waiting Times in a Dyad versus a Group of Size Three, Four, Five, or Six When Varying the Ego’s Depression Score
Inspection of Figure 3a shows that the depression score of an individual increases their probability of choosing a dyadic interaction compared to groups of three or four (solid and dashed lines). In both cohorts, the chance of forming a dyad rather than a triad is approximately 50 percent higher for an individual with a depression score of 30 (i.e., a very high level of depressive symptoms) compared to an individual with a score of 0 (i.e., no depressive symptoms). More precisely, this ratio is 1.6 in Cohort 1 and 1.4 in Cohort 2. 12 When comparing dyads to groups of size five and more, we further notice that this tendency is reverted in both cohorts: individuals with higher scores have a higher chance of preferring very large groups over dyads.
As for Hypothesis 1b, we can calculate the ratio between the waiting time to leave a dyadic interaction and the waiting time to leave an interaction in a group of a larger size. This ratio is calculated using Equation 2, including the same effects as for Hypothesis 1a and discarding other effects again. Figure 3b presents these ratios depending on the ego depression score.
The ratio of time expected in dyads compared to groups (of all sizes) increases with the ego’s depression score, as hypothesized. This ratio is 1.2 times higher for an individual having a depression score of 30 compared to an individual with a score of 0 in Cohort 1. 13 It is only 1.1 times higher in Cohort 2. 14 Besides, the tendency for individuals with high depressive symptoms to stay longer in dyads becomes weaker when the compared group gets larger.
None of the results related to Hypothesis 1a changes in direction and significance level in our five robustness analyses.
15
Results related to Hypothesis 1b become insignificant in Cohort 1 when adding effects related to student status (
Depression avoidance
We first examine the direction and significance of the effects of mean depression scores corresponding to Hypotheses 2a and 2b. Regarding Hypothesis 2a, both cohorts’ positive and strongly significant parameters indicate that individuals preferably join groups with higher depression scores (Cohort 1:
We also find support for Hypothesis 2a in the models that do not include the effect of previous friendships and interactions in Cohort 1. 16 We could conjecture that individuals preferably befriended others with low depression scores, meaning that friendship possibly played a mediator role in depression avoidance. Other robustness analyses, however, are consistent with our conclusions, we thus refrain from interpreting this result further. 17
Other mechanisms
The parameter corresponding to the “depression (ego)” effect in the joining models is negative and significant in both cohorts, suggesting a tendency for individuals with higher depressive symptoms to join interactions less fast. Although not hypothesized, these effects are in the expected direction following previous literature on social isolation and depression (see introduction). The same effect in the leaving model is significant only for Cohort 2 but in the expected direction in both cohorts. It suggests that individuals with higher levels of depression tended to leave interactions faster.
The parameters “squared difference to mean depression” in Tables 1 and 2 for the choice models show that individuals tended to join interactions with others who have similar levels of depressive symptoms in both cohorts (i.e., assortativity tendency). Only results for Cohort 1 suggest that individuals were more likely to stay in groups with similar depression scores. 18
Post hoc analyses for gender
Prior research suggested that females favored more dyadic interactions than males in childhood and adolescence (Rose and Rudolph 2006) and were more prone to rumination (Johnson and Whisman 2013). Empirical studies of depression in adolescence further suggested that females with high levels of depression may suffer more from social isolation than males (Cheadle and Gossby 2012; Zhao, Robinson, and Wu 2020). Given these findings, we decided to check whether gender played a role in our results on dyadic preferences by adding an interaction between gender and the effect testing Hypothesis 1 (interaction between depression and dyadic preference). 19
The parameter for this new three-way interaction shows that females with higher levels of depression favor more dyads over groups than less depressed females in both the choice model (Cohort 1:
Discussion and Conclusion
This study aimed to understand the mechanisms governing the dyadic isolation of individuals with depressive symptoms in face-to-face interactions. Supporting our hypotheses on dyadic preferences, we find in both studied cohorts evidence for a positive association between depressive symptoms and forming dyadic interactions rather than joining groups (Hypothesis 1a). This result, however, only applies to groups of sizes three and four. We find only weak evidence for staying in dyadic interactions rather than groups in Cohort 1 (Hypothesis 1b). Regarding our hypotheses on depression avoidance, we find no association between the average level of depressive symptoms in an interaction group and the tendency of others to join (Hypothesis 2a) and only mixed evidence for staying in such a group (Hypothesis 2b).
The results for the first class of mechanisms align with previous research stating that individuals with depressive symptoms might have more difficulties interacting in groups than in dyads (Youngren and Lewinsohn 1980). It is also consistent with research on withdrawal mechanisms in social networks, which shows that individuals with higher levels of depressive symptoms tend to have fewer relations or interaction partners (Kwapil et al. 2013; Schaefer et al. 2011; Teo 2013). The inconclusive results for the avoidance mechanisms do not support Coyne’s interactional theory of depression (Coyne 1976b). It is in line, however, with recent studies on social networks that did not find much evidence for avoidance mechanisms (Elmer, Boda and Stadtfeld 2017; Schaefer et al. 2011). Our inconclusive results regarding avoidance mechanisms could be related to the festive context of the introductory weekends. Although individuals may be able to infer other’s depressed mood from verbal or visual cues (Segrin 2000), such cues may have been less salient in this context. It is also possible that participants were not well aware of each other’s mental health because they only knew each other for a few weeks.
Our models further considered the role of assortativity on depressive symptoms and group sizes. They provide evidence for a tendency to join interactions including individuals with similar levels of depression for both cohorts and a tendency to remain in those interactions in one cohort, consistent with studies of friendship networks (Schaefer et al. 2011; van Zalk et al. 2010a). This mechanism might act as a reinforcement of dyadic preferences: when individuals with depression simultaneously prefer similarly depressed others and dyadic interactions, we are even more likely to find isolated dyads with high levels of depressive symptoms. We find evidence, furthermore, for a positive association between depressive symptoms and the tendency to join and stay in groups larger than five. This finding indicates a potentially more complex relationship between depressive symptoms and group size than hypothesized. Individuals with higher levels of depressive symptoms may prefer dyads and large groups because they are comfortable “hiding” in larger groups in which fewer social contributions and interpersonal skills are required. Post hoc analyses also revealed that it was female participants with depression who were more prone to favor dyads over groups. These results are in line with previous studies arguing that female adolescents may be more isolated when suffering from depression (Cheadle and Gossby 2012; Zhao et al. 2020).
This study demonstrates the importance of examining the micro patterns of interactions to understand social processes related to depression. By collecting and modeling actual social interactions and using social sensors and statistical models adapted to these data, we can understand more precisely the micro-level mechanisms related to depressive symptoms in social interactions. Such insights would be difficult to get from self-reports or aggregated information, such as the ones provided in sociometric surveys. Our study also sheds light on the processes related to dyadic isolation, adding to our current knowledge about the vicious cycle of depression and social isolation. Whereas previous research has primarily focused on the general isolation of individuals suffering from depression (Kwapil et al. 2013; Schaefer et al. 2011; Teo 2013), this study suggests that these individuals may also isolate in pairs, with potentially detrimental outcomes for these isolated pairs. Such knowledge can be critical to identify potential pathways out of depression. Finally, our results highlight the importance of considering group sizes when studying social processes in face-to-face interactions.
Some limitations remain. First, the statistical model used here assumes individual agency, with individuals iteratively joining and leaving groups by themselves, but this assumption might not hold when interaction decisions are coordinated (among two or more individuals). A more complex model with split and merge transitions may be defined (for related models on static group data, see e.g., Hoffman, Block, and Snijders 2023; Peixoto 2020) but would require building theoretical expectations regarding coordinated group behavior in the context of depressive symptoms. Second, the direction of the parameters in the leaving model fluctuates, making the rate model harder to interpret than the choice model. This might result from the RFID sensors recording the duration of interactions less reliably than their mere occurrence. Third, our samples were relatively small and consisted only of university students, and the interactions were collected in a specific social context. Consequently, our results may not generalize to other groups and contexts when individuals do not know each other or, reversely, know each other very well.
Further research could further investigate the antecedents and consequences of dyadic isolation. Regarding its antecedents, the importance of gender differences may have been overlooked. The fact that females with depression may prefer dyads while males prefer groups could explain why a part of the literature is at odds with the dyadic preference hypothesis (e.g., Atherton et al. 2015; Segrin 2000). Our mixed results concerning the avoidance of individuals with depression particularly call for new analyses of avoidance mechanisms, potentially in other groups and contexts. It would also be useful to examine other characteristics of interactions (e.g., their content, location, or perceived quality). One could use such information to understand how exactly interaction dynamics dyads differ from groups, as previously argued (Becker and Useem 1942; Malloy 2018; Moreland 2010; Simmel 1902). Finally, the outcome of dyadic isolation could be considered in future analyses of depression in social networks.
Dyadic isolation may have adverse effects on individuals with depressive symptoms. This article uses novel behavioral data sources and statistical network techniques to assess the underlying social processes leading to this phenomenon. Our approach contributes to advancing our understanding of the vicious cycle linking depression and social isolation and identifying pathways out of this cycle.
Supplemental Material
sj-pdf-1-spq-10.1177_01902725241276407 – Supplemental material for Dyadic Isolation in Social Interactions: The Role of Depressive Symptoms
Supplemental material, sj-pdf-1-spq-10.1177_01902725241276407 for Dyadic Isolation in Social Interactions: The Role of Depressive Symptoms by Marion Hoffman, Christoph Stadtfeld and Timon Elmer in Social Psychology Quarterly
Footnotes
Funding
The author(s) disclosed receipt of the following financial support for the research, authorship, and/or publication of this article: Marion Hoffman acknowledges IAST funding from the French National Research Agency under Grant ANR-17-EURE-0010 (Investissements d’Avenir program).
Supplemental Material
Supplemental material for this article is available online.
1
We found no theoretical support for differentiating different group sizes.
3
Cohort 1:
5
We justify this choice by examining the evolution of group sizes in Appendix A, available with the online version of the article. More details on the mathematical definition of the model can be found in Appendix B (available with the online version of the article) and in ![]() .
.
6
8
9
10
11
If we adjust our significance threshold to .025 (with the Bonferroni method) because we are testing two cohorts, the result becomes insignificant.
12
In Cohort 1, for a score of 0, Ratio = exp(-1.37 + 0.12 × (2-1))/exp(0.12 × (3-1)) = 0.23, for a score of 30, Ratio = exp(-1.37 + 0.039 × (30-10.21) + 0.12 × (2-1) + 0.014 × (30-10.21) × (2-1))/exp(0.12 × (3-1) + 0.014 × (30-10.21) × (3-1)) = 0.37. In Cohort 2, for a score of 0, Ratio = exp(-1.37 + 0.12 × (2-1))/exp(0.12 × (3-1)) = 0.23, for a score of 30, Ratio = exp(-1.37 + 0.028 × (30-11.86) + 0.12 × (2-1) + 0.0092 × (30-11.86) × (2-1))/exp(0.12 × (3-1) + 0.0092 × (30-11.86) × (3-1)) = 0.32.
13
For a score of 0, Ratio = exp(0.017 × (3-1))/exp(-0.56 + 0.017 × (2-1)) = 1.78, for a score of 30,Ratio = exp(0.017 × (3-1)-0.00073 × (30-10.21) × (3-1))/exp(-0.56-0.0081 × (30-10.21) + 0.017 × (2-1)-0.00073 × (30-10.21) × (2-1)) = 2.06.
14
For a score of 0, Ratio = exp(0.011 × (3-1))/exp(-0.56 + 0.011 × (2-1)) = 1.77, for a score of 30, Ratio = exp(0.011 × (3-1)-0.0011 × (30-11.86) × (3-1))/exp(-0.56-0.0050 × (30-11.86) + 0.011 × (2-1)-0.0011 × (30-11.86) × (2-1)) = 1.90.
18
Bios
References
Supplementary Material
Please find the following supplemental material available below.
For Open Access articles published under a Creative Commons License, all supplemental material carries the same license as the article it is associated with.
For non-Open Access articles published, all supplemental material carries a non-exclusive license, and permission requests for re-use of supplemental material or any part of supplemental material shall be sent directly to the copyright owner as specified in the copyright notice associated with the article.