
Abstract
The Slider Measure of social value orientation (SVO) was introduced as an improvement from existing measures. We conduct an independent assessment of its suitability compared with the Ring Measure and the Triple Dominance Measure. Using a student sample, we assess the measures’ test-retest reliability (N = 88; using a longer time interval than previous studies) and sensitivity to random responses. Analyses pertaining to convergent validity, criterion validity, and the advantages of a continuous over a discrete measure are presented in the online appendix. Compared with alternatives, the Slider Measure has the highest test-retest reliability. However, it classifies random responses in an unbalanced way, assigning the vast majority of random responses to cooperative and individualistic, rather than altruistic and competitive, orientations. For all three measures, we propose improved ways of weeding out inconsistent responses.
Social value orientation (SVO) is one of the most frequently studied individual traits in research on prosocial behavior (Au and Kwong 2004; Murphy and Ackermann 2014; Murphy, Ackermann, and Handgraaf 2011; Thielmann, Spadaro, and Balliet 2020). SVO literature shows that SVO consistently relates to prosocial behavior both in experimental and nonexperimental studies (Balliet, Parks, and Joireman 2009; Pletzer et al. 2018; Thielmann et al. 2020; Van Lange et al. 2007; Van Vugt, Van Lange, and Meertens 1996).
SVO is defined by weights individuals assign to their own and others’ outcomes in situations of interdependence as well as by their inferred motivations and typical payoff allocations (Messick and McClintock 1968; Murphy and Ackermann 2014, Table 2). Most commonly, altruistic, cooperative, individualistic, and competitive orientations are distinguished (Au and Kwong 2004; Bogaert, Boone, and Declerck 2008; Murphy and Ackermann 2014; Van Lange et al. 2013), with the former two sometimes combined into one prosocial orientation.
As identified in a recent meta-analysis by Pletzer et al. (2018), the three most commonly used measures of SVO are the nine-item Triple Dominance Measure (TDM; Van Lange et al., 1997), the Ring Measure (RM; Liebrand and McClintock, 1988), and the Slider Measure (SLM; Murphy et al. 2011). The recently introduced SLM appears to have advantages over earlier approaches, based on comparisons by its authors (Murphy et al. 2011; Murphy and Ackermann 2014). The SLM’s test-retest reliability has been reported to be higher than that of the RM and TDM (Murphy et al. 2011). Compared with the RM, it is simpler to administer. Compared with the TDM, it is more complex but allows measurement of SVO on a continuous scale. As of yet, however, we have been unable to find an independent establishment of the SLM’s proposed advantages over alternatives.
In the main body of this article, we report on the three measures’ comparative test-retest reliabilities and the efficacy of the “consistency checks” they employ for weeding out random answers. Test-retest reliability is assessed over a period of approximately three months, a considerably longer period than previous studies on the SLM (Höglinger and Wehrli 2017; Murphy et al. 2011). The online supplement additionally reports on the measures’ convergent validity and inspects the impact on criterion validity of using a categorical rather than a continuous measure (in the case of the RM and the SLM).
Three Measures of SVO
Nine-Item TDM
Each item of the nine-item TDM (Van Lange et al. 1997) has three alternatives to choose from. Per item, each alternative represents one of the three SVO orientations: prosocial, individualistic, and competitive. The nine-item TDM is designed to be used as a purely categorical measure. Figure 1 shows an example choice from the nine-item TDM.
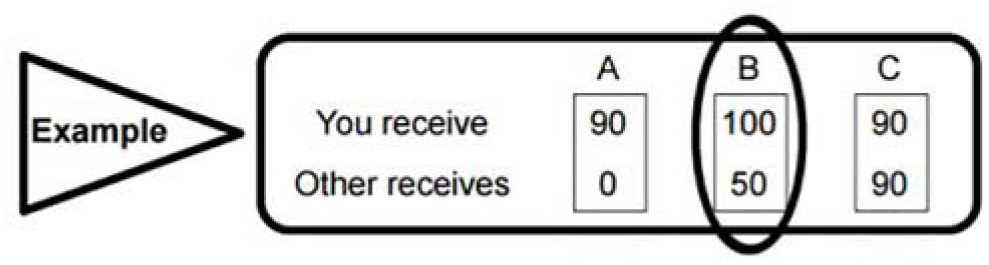
Example from the Nine-Item Triple Dominance Measure
RM
The RM of SVO is presented to participants as a set of items with payoff pairs between which they are expected to choose (the set contains 24 items, each with two payoff pairs; see Au and Kwong 2004). On each item, respondents are expected to choose the own-other payoff combination closest to their ideal payoff combination (Au and Kwong 2004; Liebrand and McClintock 1988). Based on the total allocation to self and the total allocation to other, the person’s SVO is computed as a point defined by an angle (representing the relative weight of payoffs to self and to other) and a vector length (representing how consistently responses indicate a single SVO) from the origin of the circle. When reduced to categories, the RM as used in this study distinguishes between altruistic, cooperative, individualistic, competitive, and sadistic orientations (Murphy and Ackermann 2014). Figure 2 shows an example choice from the RM.
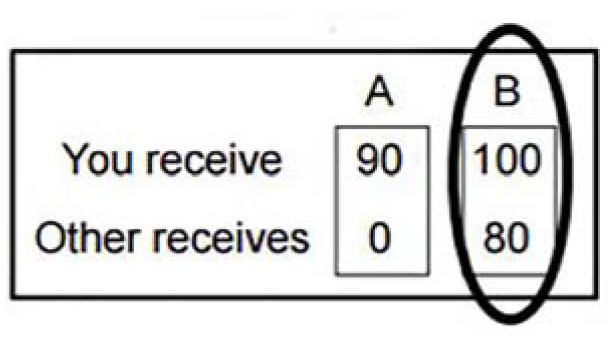
Example from the Ring Measure
SLM
The SLM allows continuous SVO measurement (Murphy et al. 2011; Murphy and Ackermann 2014). Respondents choose a resource allocation over a continuum of joint payoffs. Six primary decisions measure SVO. Nine secondary items can be used to disentangle inequality aversion (minimizing payoff differences between self and other) and joint gain maximization (maximizing the sum of payoffs to self and other). Participants are classified through a procedure similar to the RM. First, the mean allocations to self and other are calculated. Then, these means are adjusted so that the computed SVO angle will originate from the center of the circle described by the SLM. The ratio between the adjusted mean allocation to other and the adjusted mean allocation to self describes the tangent of the SVO angle, so the angle is computed as the arctangent (Murphy et al. 2011). When reduced to categorical orientations, the SLM distinguishes altruistic, cooperative, individualistic, and competitive orientations. Figure 3 shows an example choice from the SLM.
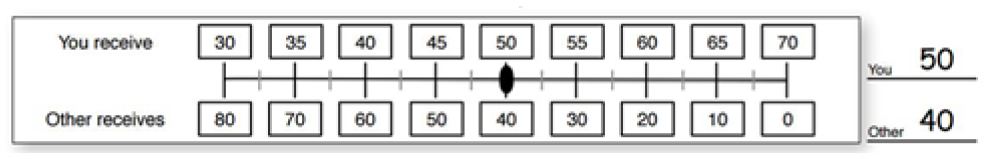
Example from the Slider Measure
Method
Data Collection
Data were collected among students at a Dutch university across four waves. The first wave of data collection took place from November 12, 2015, to November 21, 2015. The second wave took place from February 22, 2016, to March 14, 2016 (roughly three months after the first wave). The third wave of data collection took place from October 21, 2016, to October 26, 2016. The fourth wave took place from March 10, 2017, to March 20, 2017.
Questionnaires started with control questions, followed by the three SVO measures. 1 Six versions of the questionnaire were distributed, each with a different order of SVO measures, representing all possible orders. Which version of the questionnaire respondents took was determined by the desk at which they happened to sit down. All versions of the questionnaire, the codebook, and the online supplement for this study are hosted on the Open Science Foundation framework. 2 SVO measures in this study were not incentivized.
For each control question, a “no answer” option was provided. For the SVO measures, we provided one “no answer to any question in this section” checkbox at the start of each measure. Additionally, students were asked to sign a release form at the end of their participation in each wave, entitling the researchers to use the data. Responses of any students who did not sign this release form or indicated a desire that their answers not be used were not collected by the researchers. This study was approved by the ethics committee of the University of Groningen’s sociology department.
Sample
One hundred ten respondents participated in the first wave of this study (44 male, 66 female; 52 freshman and 58 sophomore; mean age = 19.83 years, SD = 1.64).
In the second wave, 97 respondents participated (33 male, 64 female; 38 freshman and 59 sophomore). Of these, 89 had also participated in the first wave. This freshman cohort had an unusually high dropout rate, apparently mainly among male students. In the online supplement, we investigate characteristics of dropouts. We find them to be similar to the remaining sample, apart from an overrepresentation of male first-year students.
In the third and fourth waves, a new cohort of freshmen participated, and sophomores from the first and second wave no longer participated. Because the subset of participants who participated in all four waves (or at least in both the first and the last wave) is small, we focus our analysis of changes over time on the first and second waves, which are approximately three months apart. This time interval is much larger than intervals in other comparative studies. Descriptive analyses of changes over longer periods of time are available in the online appendix.
Variables
Respondents completed each of the three SVO measures. For the SLM, respondents completed both the six primary items to determine their SVO and the nine additional items to distinguish between prosocial motives. Additionally, we asked each respondent to indicate their age, gender (male/female/other), year of study (first year or second year), most recent prior education/occupation, and current number of course credits.
Classification
For each measure, respondents were classified using the methods summarized previously. Scripts used to classify each respondent are available on the Open Science Framework. Within the prosocial type, it is common to distinguish between cooperatives (those who maximize joint outcomes or minimize inequality) and altruists (those who maximize the other’s payoff) (Au and Kwong 2004). The SLM calls these subcategories “altruists” and “prosocials” (Murphy et al. 2011). In this study, we use the terms “altruists/altruistic” and “cooperators/cooperative” to refer to the subtypes and the term “prosocials/prosocial” to refer to the combined type.
Robustness to Random Responses
Measures of social value orientation commonly include a consistency check, intended to exclude invalid or unclassifiable responses. Respondents who do not take their participation seriously and respond at random are a likely source of false positives and a useful benchmark. 3 By investigating the performance of each measure against random responses, we can gain insight into the effectiveness of these consistency checks.
Method
For measures with discrete choices, we can enumerate all possible profiles of choices and classify these. This applies to the Triple Dominance Measure, the Ring Measure, and the discrete version of the Slider Measure. For the TDM, we can calculate directly how likely it is that a participant who gives random answers is classified as each type or remains unclassified. Simulations for a continuous version of the SLM are omitted since they differed little from those obtained for the discrete SLM. Scripts written in R (R Core Team 2017) for the enumeration and classification of decision profiles are available on the Open Science Framework, and the enumeration method is discussed in more detail in the online appendix.
Nine-Item TDM
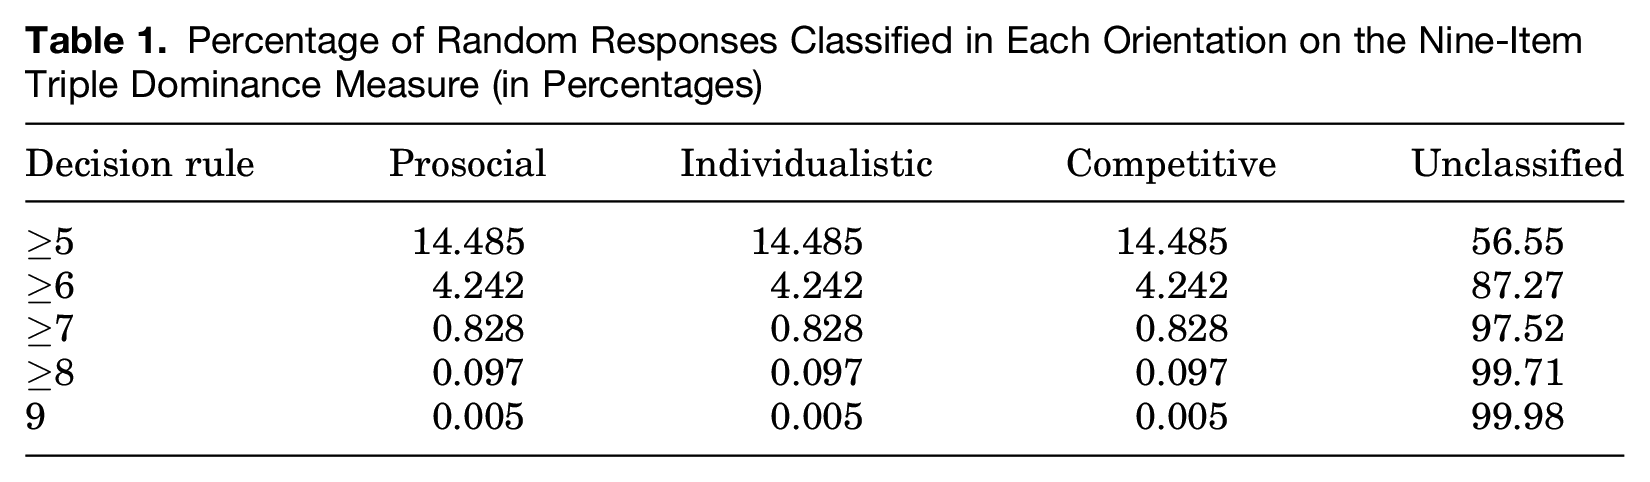
For the nine-item TDM, each choice represents a type. Participants are classified only if they indicate the same SVO orientation on at least six of the nine items (Van Lange et al. 1997), which often leaves a substantial number of people unclassified (Au and Kwong 2004). We can calculate directly how likely each classification is for a respondent who gives random answers. This results in a probability of 0.04242 of being classified as prosocial, the same probability for individualistic and competitive, and a residual probability of 0.8727 of remaining unclassified.
Table 1 shows us how the probabilities of classification change when the consistency threshold is varied. When the threshold is lowered to five consistent choices, slightly less than 43.5 percent of respondents who give random answers are classified. When the threshold is raised to seven, only about 2.5 percent of respondents who give random answers are still classified. Raising the threshold farther makes only a minor difference. Applying an increased threshold of seven consistent responses to our empirical sample consisting of the first observations for each respondent would lead to an increase in unclassifiable responses from 11 out of 171 (6.4 percent, see online supplement) to 29 out of 171 (17.0 percent).
Percentage of Random Responses Classified in Each Orientation on the Nine-Item Triple Dominance Measure (in Percentages)
RM
In order to determine the distribution of classifications for the RM given random responses, we enumerated all possible decision profiles across the 24 items of the RM using R. We then calculated the SVO angle and vector length for each decision profile. We applied the most common consistency check for the RM, which is based on the observed vector length. Decision profiles with a vector length of at least 25 percent of the maximum length are classified (Au and Kwong 2004).
No fewer than 55.38 percent of participants who give entirely random answers are classified into one of the SVO types. This suggests that the classification threshold of 25 percent of the maximum vector length may be too forgiving to effectively combat false positives. To investigate this further, we can compare the distribution of vector lengths obtained from our enumeration of all possible random decision profiles with the distribution of vector lengths among the first observations of each respondent in our student sample (N = 182). Figure 4 shows that there is very little overlap between the two distributions. In fact, if we were to move the classification threshold to the 95th percentile of the distribution of vector lengths from random answers (55.49 percent of the maximum empirical vector length), we would still classify 97.78 percent of our empirical cases. This result suggests there is room to exclude more false positives with a very minor increase in false negatives.
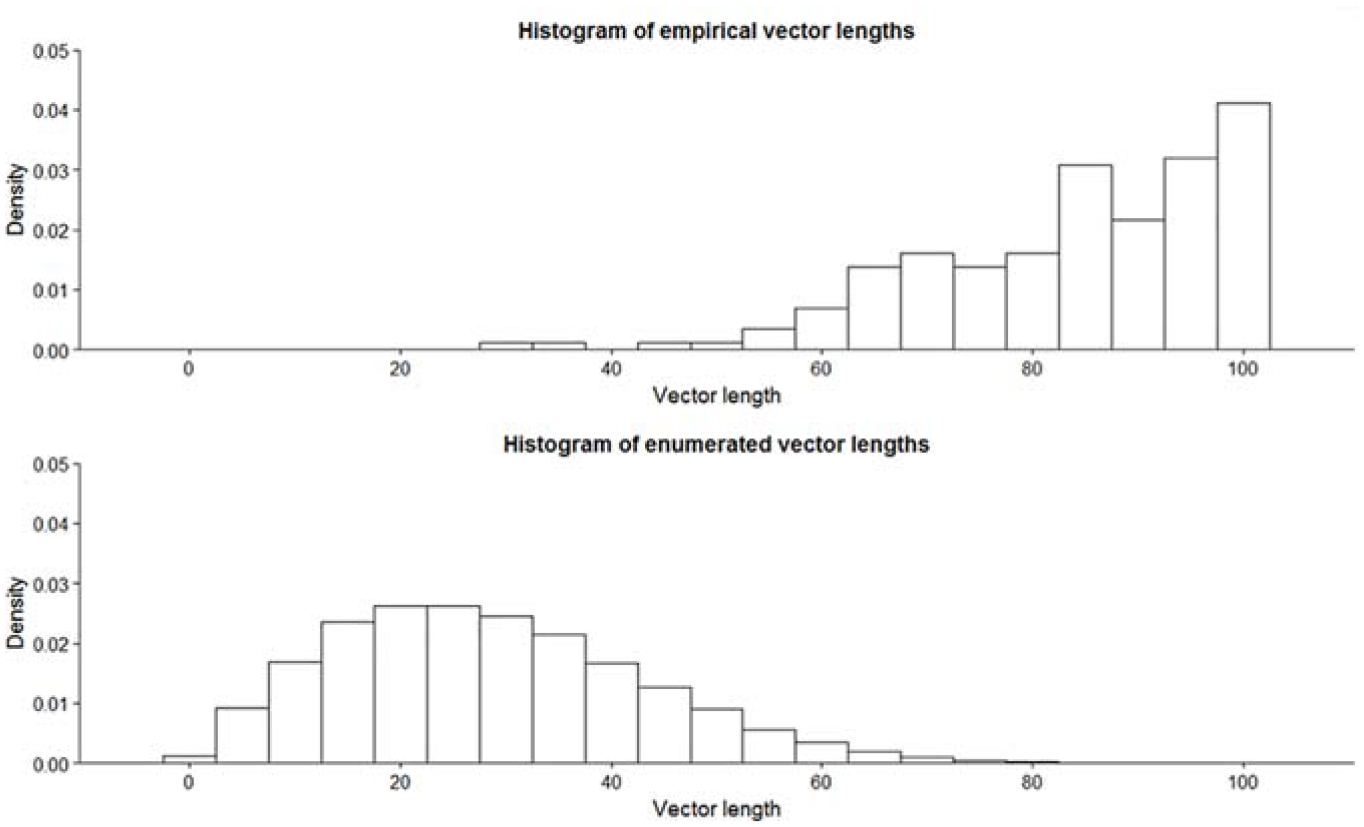
Empirical and Enumerated Distributions of Vector Lengths for the Ring Measure
SLM
The discrete SLM consists of six primary items, each with nine allocations to choose from. We enumerated all decision profiles using R, then calculated the SVO angle for each decision profile. The consistency check suggested for the SLM is to exclude responses that indicate intransitive preferences (Murphy et al. 2011; Murphy and Ackermann 2014). Transitivity of preferences entails that when a person prefers orientation A over B and prefers B over C, this person also prefers A over C.
We applied the SLM transitivity check to all enumerated decision profiles, resulting in transitive preferences 41.85 percent of the time. The effectiveness of the transitivity check as a consistency check is limited. On an aggregated level, the enumerated responses show substantially fewer transitive preferences than the empirical samples we know of. Nearly all responses from our empirical sample pass the transitivity check (98.87 percent), and this is similar to the 95 percent reported by Murphy et al. (2011). This suggests that when researchers find a much lower percentage of transitive preferences, there is a reason to be suspicious about the quality of responses. However, based on the calculated false-positive rate of 41.85 percent, the transitivity check cannot not be used effectively to filter out random responses or determine whether an individual response is genuine or random.
Alternatively, one could calculate vector lengths and exclude decision profiles with vector lengths below a threshold, as is done for the RM. We calculated the vector length of all enumerated decision profiles and empirical cases. Figure 5 shows that as with the RM, there is little overlap between the distributions. This suggests that a vector length criterion could be a suitable consistency check for the SLM. In the online supplement, we show how to apply this vector length criterion.
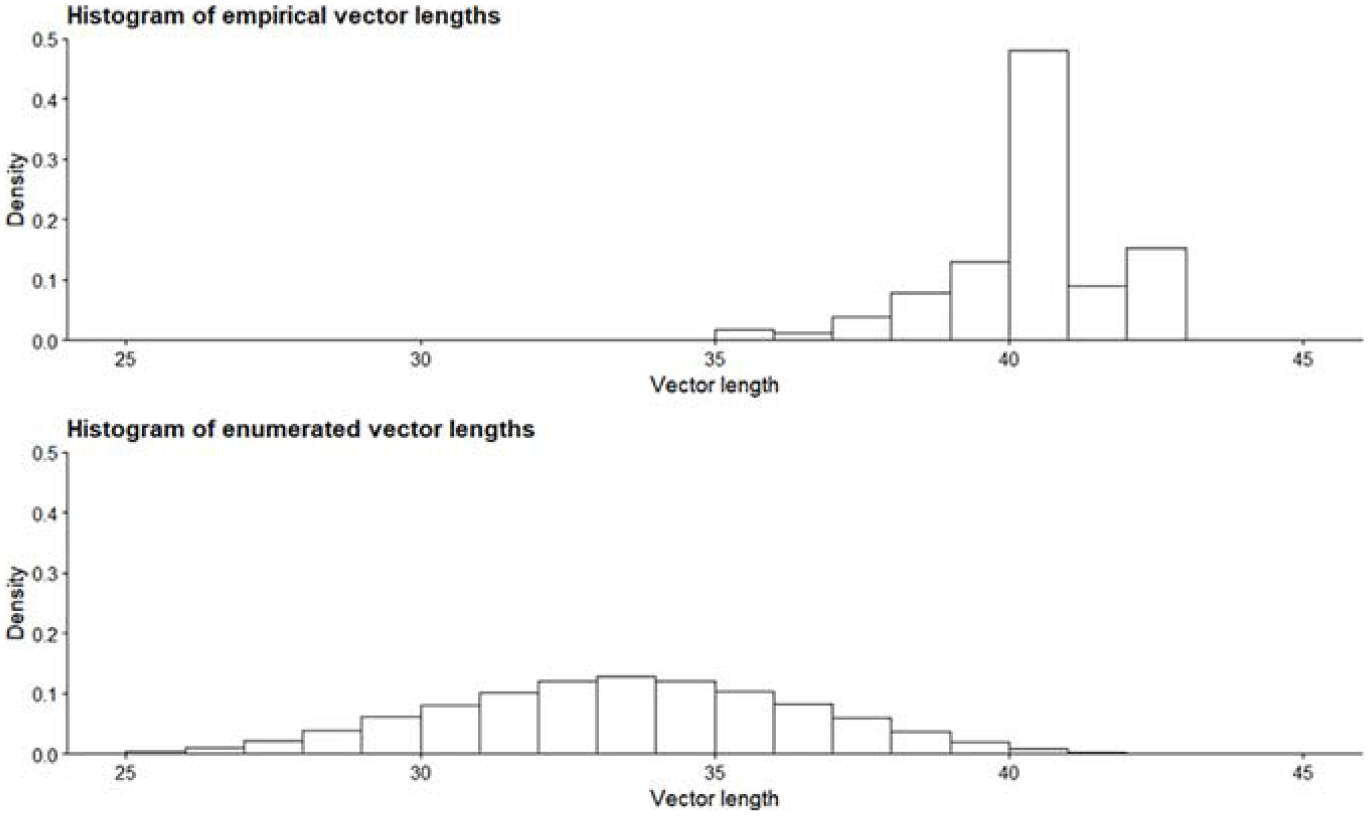
Empirical and Enumerated Distributions of Vector Lengths for the Slider Measure
In addition, the distribution of classifications is highly unbalanced. Of the enumerated decision profiles, 0.05 percent were classified as altruistic, 50.68 percent as cooperative, 49.23 percent as individualistic, and 0.05 percent as competitive. This implies that given some randomness in responses, the SLM is the SVO measure that has the strongest “steering tendency” in favor of particular categories (cooperative and individualistic) to the detriment of others (altruist and competitive). This tendency persists after applying a consistency check (regardless of whether this check is based on transitivity or on vector length).
Test-Retest Reliability
To investigate the test-retest reliability of the three measures in our sample, we compare how classifications changed between the first and second waves. 4 In total, 89 respondents took part in both these waves. Of these, 84 respondents completed the nine-item Triple Dominance Measure at both time points. The Slider Measure and Ring Measure, respectively, have 86 and 83 complete measurements at both time points. One respondent did not complete any of the three measures at both time points.
Results
With 77.9 percent, the percentage of respondents classified as the same type in the first and second waves is highest for the SLM. The percentage of consistently classified respondents was lowest for the TDM (66.7 percent). With 71.1 percent, the RM scores in between the other two measures. To test whether these differences are statistically significant, we estimate a multilevel logistic regression model. Using Waves 1 and 2, we coded (at most) three observations for each respondent, registering whether the respondent was classified as the same type (1 = yes, 0 = no) on each SVO measure they completed. We include a random error component for respondents (i.e., a Level 2 variance component) and estimate the model twice, once with all respondents (253 cases nested in 88 respondents) and once with only respondents who completed all three measures in Waves 1 and 2 (234 cases nested in 78 respondents). The independent variables are the three SVO measures. We use the TDM as the reference category. Table 2 reports the results.
Estimates of Multilevel Logistic Regression Models for Consistent Classifications
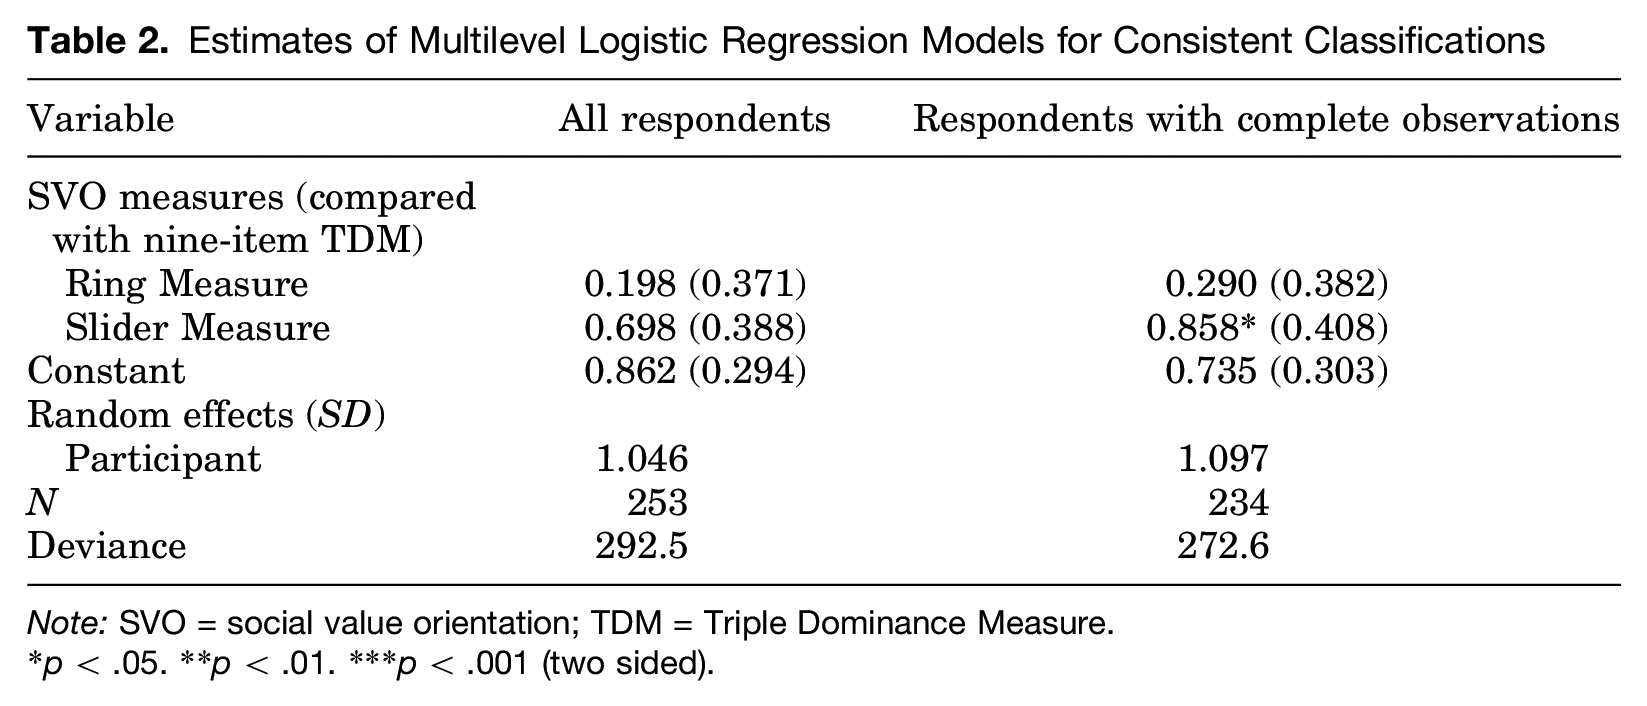
Note: SVO = social value orientation; TDM = Triple Dominance Measure.
p < .05. **p < .01. ***p < .001 (two sided).
As the descriptive results show, the SLM has the highest test-retest reliability. The test-retest reliability of the RM is not significantly higher than that of the TDM (p = .593, two sided with all respondents; p = .448, two sided with complete observations). The test-retest reliability of the SLM is significantly higher than that of the TDM when considering only respondents with complete observations (p = .036, two sided) and not when considering all respondents (p = .072, two sided). The difference between these models is small. Reestimating the model with the RM as reference category shows no significant differences to either the nine-item TDM or the SLM.
Discussion and Conclusion
Based on our results, and on previous literature on the advantages and disadvantages of various measures of social value orientation (Murphy and Ackermann 2014), we recommend the Slider Measure as the most suitable measure of SVO for most situations. From the literature, we know that the SLM is efficient and easy to implement, allows for a continuous measure of SVO, allows a distinction between inequality aversion and joint outcome maximization, and produces internally consistent results (Murphy et al. 2011; Murphy and Ackermann 2014). In our results, the SLM mainly distinguishes itself from the Triple Dominance Measure by enabling continuous measurement of SVO and by its higher test-retest reliability. Its test-retest reliability is also higher than that of the Ring Measure, though not significantly so. Compared to the RM, the SLM is more efficient (requiring fewer items) and has secondary items that can distinguish inequality aversion from joint outcome maximization.
We can confirm the observation made by Murphy et al. (2011) that the SLM has the highest test-retest reliability among the three measures tested and, based on supplementary analyses presented in our online appendix, that it scores well on convergence with the other two measures. The test-retest reliability of the SLM is not as high as in Murphy et al., who reported 89 percent consistency, or a correlation between angles of r = .915, but this is not surprising given the considerably longer time frame in our study compared with Murphy et al.
While we generally recommend the SLM, we propose an adjustment to the consistency check used to exclude invalid responses. Murphy et al. (2011) propose the transitivity of respondents’ preferences as an indicator of invalid responses. We find that the transitivity check does not effectively filter out random responses. A vector length criterion can be used instead, for which we provide instructions in our online supplement. If many invalid responses are expected (e.g., when working with a sample that does not take the study seriously), it is worth considering the TDM, which has a strict consistency check by default. While the consistency checks for the SLM and RM can be adjusted to exclude more invalid responses, the TDM also has the advantage that random errors made by participants do not bias their classification toward any particular orientation.
Based on supplementary analyses presented in our online appendix, we generally concur with recent remarks in the literature that it seems worthwhile to attempt to avoid SVO classifications and instead use a continuous measure of SVO (such as the angle computed by the RM or the SLM). Restricting SVO to a categorical measure is inconsistent with the definition of SVO, discards valuable information on inter- and intrapersonal variation (see also Murphy et al. 2011) and risks over- or underfitting the relationship between SVO and an outcome of interest. However, categorical measures may be preferable if the shape of this relationship is uncertain.
Our study has several limitations related to our sample and our opportunities for data collection. First, our sample is very homogeneous, consisting entirely of sociology students. This may have affected the distribution of orientations we observed as well as the consistency of answers. Although the distribution of orientations we obtained is not inconsistent with previous research, including research using psychology students (Van Lange, Schippers, and Balliet 2011) and research using a representative sample of the Dutch population (Van Lange et al. 1997), samples from different fields (Van Lange et al. 2011) or different countries may show very different distributions. Additionally, the sample suffered from attrition, particularly (unfortunately) among the group of students that we tracked through all four waves of the study. This results in a small sample size (only 27 students) when comparing the first with the last wave. As a result, we have relegated analyses of test-retest reliability over periods longer than three months to the online supplement.
The SVO questionnaires in our study were not incentivized. The payoff allocations our respondents chose were purely hypothetical, and no money was distributed to our respondents. Offering incentives, or making the study incentive compatible by using something like a lottery, may be preferable. Incentivizing such measures is believed to improve the honesty of responses (Murphy and Ackermann 2014). Whether, or to what extent, reported SVO is affected by incentives is unclear. As far as we are aware, there are no studies directly comparing incentivized and nonincentivized SVO questionnaires.
In addition, there are a number of properties of the SLM that we have not evaluated (such as its ability to predict behavior in social dilemmas) and for which we are mostly relying on an evaluation by the original author of this measure. The SLM’s ability to predict behavior in social dilemmas has been reviewed by Thielmann et al. (2020), who found that the predictiveness of the SLM did not differ significantly from that of the other available measures. We also did not evaluate the secondary items of the SLM, which are intended to distinguish between inequality aversion and joint gain maximization within the cooperative orientation, because neither of the other two measures can make this distinction. An additional independent review of the SLM that includes these aspects would be useful.
Supplemental Material
sj-docx-1-spq-10.1177_01902725211008938 – Supplemental material for Comparing the Slider Measure of Social Value Orientation with Its Main Alternatives
Supplemental material, sj-docx-1-spq-10.1177_01902725211008938 for Comparing the Slider Measure of Social Value Orientation with Its Main Alternatives by Dieko M. Bakker and Jacob Dijkstra in Social Psychology Quarterly
Footnotes
Declaration of Conflicting Interests
The author(s) declared no potential conflicts of interest with respect to the research, authorship, and/or publication of this article.
Funding
The author(s) disclosed receipt of the following financial support for the research, authorship, and/or publication of this article: Dieko M. Bakker acknowledges financial support by the Netherlands Organization for Scientific Research (NWO) under the 2018 ORA grant ToRealSim (464.18.112).
Supplemental Material
Supplemental material for this article is available online.
1
The social value orientation questionnaires (paper-based versions of the Triple Dominance Measure, the Ring Measure, and the Slider Measure) were downloaded from ![]() . Currently, only the Slider Measure can be downloaded there. The Slider Measure used in this study is Version A, with adapted instructions.
. Currently, only the Slider Measure can be downloaded there. The Slider Measure used in this study is Version A, with adapted instructions.
2
3
Performance against predictable answering patterns is evaluated in the online supplement. Such predictable patterns are perhaps more common than true randomness, but their effect depends on, for example, the order of items. Because truly random responses are not affected by details of the questionnaire, we focus on random responses in the main text.
4
We further compared classifications from Waves 3 and 4 with classifications from Wave 1. The more time has passed since the initial measurement, the greater the percentage of individuals whose classification has changed. This suggests some genuine change in social value orientation over time. However, these results must be interpreted with caution as only 27 individuals participated in both Wave 1 and Wave 4 while only 22 participated in all four waves. More detail on these descriptive analyses is available in the online supplement.
Bios
References
Supplementary Material
Please find the following supplemental material available below.
For Open Access articles published under a Creative Commons License, all supplemental material carries the same license as the article it is associated with.
For non-Open Access articles published, all supplemental material carries a non-exclusive license, and permission requests for re-use of supplemental material or any part of supplemental material shall be sent directly to the copyright owner as specified in the copyright notice associated with the article.