
Abstract
In today’s information-driven society, researchers often face challenges when navigating the vast resources available to support their careers. They typically rely on bibliographic databases while conducting literature reviews or searching for potential publication venues. However, they often overlook additional opportunities for publishing, finding collaborative partners, and exploring relevant topics. Bibliometrics, the field that analyses publications, employs various techniques to evaluate research trends, assess scientific impact, and discover funding and grant opportunities that can help researchers go beyond their needs. Bibliometrics methods can be instrumental in the career development of researchers, enhancing the impact, visibility, and quality of their work. Despite the significant benefits of bibliometrics for researchers, many of them do not fully utilise bibliometric tools. A fear of an over-reliance on quantitative data is one of the main reasons for this. To gain a deeper understanding of researchers’ perceptions of bibliometrics, this study conducted ten online interviews with academics and research staff at the University of Leeds, a research-intensive university. NVIVO software was used for qualitative data analysis and coding. Based on the analysis of the interviews, participants discussed three key themes: Journal Impact Factor, bibliometric concerns, and the use of bibliometrics for publication analysis. According to the responses, there is a significant polarisation between the potential and concerns of bibliometrics. Promoting the benefits of bibliometrics for researchers requires raising awareness through education and training. It is important to emphasise how bibliometrics can support career development and to combine bibliometrics with other metrics. Utilising real-world scenarios in bibliometrics training sessions can engage researchers and empower them to become active learners. Additionally, sharing case studies or success stories of researchers and institutions that have effectively used bibliometrics can illustrate its positive impact on career advancement, research output, and collaborative efforts. Highlighting these examples can motivate others to leverage bibliometrics in their own work.
Keywords
Introduction
In today’s fast-paced world, we are inundated with an overwhelming amount of information, which poses significant challenges in effectively managing this big data. Researchers, while frequently relying on established databases for their work, often miss out on valuable opportunities for publishing their findings. They may also overlook potential collaborators who could significantly enrich their projects and emerging topics that might provide fresh avenues for exploration. These missed opportunities can hinder their research careers and limit the impact of their work in the scientific community.
Bibliometrics is a field that employs statistical methods to analyse academic literature and offers several advantages for researchers. It helps track the impact of research, identify key journals and publishers, and uncover funding opportunities. Additionally, bibliometrics enables the discovery of emerging trends, collaboration possibilities, and the establishment of professional networks. This discipline also aids in recognising interdisciplinary research and supports career growth by providing access to extensive multidisciplinary research databases. Overall, bibliometrics allows researchers to easily explore the work of their peers and discover new research opportunities and avenues (Åström et al., 2011).
This dynamic interdisciplinary aspect of bibliometrics spans all scientific disciplines, demonstrating its versatility and it has become an integral part of research quality evaluation and has been changing the practice of research (Bornmann & Leydesdorff, 2014). Bibliometric analysis plays a vital role in uncovering gaps and trends within the vast landscape of scientific literature. By meticulously examining citation data, publication patterns, and research networks, this analysis offers deep insights into emerging areas of research, identifies influential publications that shape the field, and explores potential avenues for future exploration. Bibliometric studies that are well done can build firm foundations for advancing a field in novel and meaningful ways (Donthu et al., 2021; Öztürk et al., 2024).
The Use of Bibliometrics
Researchers employ a variety of qualitative and quantitative approaches to comprehend and organise past research findings. Among these methods, bibliometrics emerges as a powerful tool that offers a systematic, transparent, and reproducible way to analyse scientific literature through the statistical measurement of various elements related to science, scientists, and scientific activities (Broadus, 1987; Diodato & Gellatly, 1994; Pritchard, 1969). What makes bibliometrics unique is its focus on quantitative analysis of publications, which provides objective and reproducible results. In an era characterised by an overwhelming deluge of new information, evolving concepts, and extensive data, bibliometrics becomes vital. Furthermore, bibliometrics plays a critical role in recognising the most prolific researchers and institutions, ultimately presenting a comprehensive view the big picture of the scientific landscape and its development over time (Aria & Cuccurullo, 2017; Crane, 1972).
There are several software tools that support bibliometric analysis. The most notable tools in this field include CitNetExplorer (van Eck & Waltman, 2008), VOSviewer (van Eck & Waltman, 2010), SciMAT (Cobo et al., 2011), BibExcel (Persson et al., 2009), the Science of Science (Sci2) Tool (http://sci2.cns.iu.edu), CiteSpace (Chen, 2006), VantagePoint (https://www.thevantagepoint.com), and bibliometrix (Aria & Cuccurullo, 2017) Although bibliometrics has been applied across various disciplines over time, conducting bibliometric analysis is complex. It involves multiple steps and requires various analyses and mapping software tools, many of which are often only available through commercial licenses (Guler, Waaijer, and Palmblad, 2016). This complexity is further heightened by the fact that relatively few researchers and practitioners have the qualification and training necessary to effectively use bibliometrics (Briner & Denyer, 2012). As a result, the burdensome nature of the process limits the potential of bibliometrics, particularly for scholars and practitioners who lack general programming skills (Aria & Cuccurullo, 2017).
Bibliometrics has been widely used in the literature to analyse geographical and global research (Lin, 2012; Zhuang et al., 2013), as well as to explore specific research themes (Huffman et al., 2013), subject domains, or disciplines (Dalpe, 2002; Liu et al., 2012; Zibareva et al., 2014). It has also been employed to examine certain types of literature and authorship (White & McCain, 1998). As a result, bibliometrics is recognised as a crucial method for enhancing research, such as through horizon scanning for emerging science and technology areas. Topics within the science, technology, and innovation sector can be identified using advanced methods, including machine learning and Latent Dirichlet Allocation (Javier et al., 2022).
Bibliometrics and Peer Review
Researchers are continually subjected to various forms of evaluation, which play a crucial role in their careers and professional advancement. Key areas affected by this assessment include publication quality, hiring decision practices, tenure and promotion, and the allocation of research funding. Historically, the standard method of evaluation has been peer review, where research was assessed by experts in the same field. This process is intended to ensure that only high-quality research is recognised. However, in recent years, there has been a notable shift in the evaluation landscape. Due to constraints such as limited financial resources and the growing bureaucratisation of the scientific process, traditional peer review is increasingly being supplanted or augmented by bibliometric methods (Haustein & Larivière, 2015).
Despite the merits of these two approaches, it is important to recognise that neither system can provide a comprehensive or entirely unbiased evaluation of research quality on its own. Peer review, while grounded in expert judgment, can be influenced by subjective bias and conflicts of interest. Conversely, bibliometric methods, while objective in their numerical analysis, often fail to capture the nuances and contextual richness of research contributions. As such, a combined approach that integrates peer review with bibliometric analysis is increasingly viewed as the most effective means of evaluating research output.
Nevertheless, the reliance on bibliometric indicators for evaluative purposes has attracted considerable criticism from scholars across the globe. Critics argue that bibliometrics presents a narrow view of research quality, often prioritising quantity over quality and discouraging innovative or interdisciplinary work that may not conform to conventional citation patterns. The growing discontent surrounding bibliometrics in research evaluation suggests that the professionalisation of bibliometric expertise – where evaluators must not only understand metrics but also the complexities of research practices – remains a highly debated and contested topic in the academic community (Jappe et al., 2018).
Many articles in the literature discuss the limited use of bibliometrics, arguing that it is impossible to quantify the intensity and success of research conducted in universities with a single number. Consequently, rankings based on citations are often criticised, that is, for their focus on quantity over quality. There is a growing acknowledgement of the importance of adopting more holistic and multidimensional methods for evaluating academic work. This includes considering factors such as societal impact, interdisciplinarity, and collaboration. While these rankings can help universities pursue academic and research excellence, they may also limit scholarly diversity (Lo & Allen, 2023).
Bibliometrics Education
Bibliometrics is primarily used professionally in research university libraries and research offices where they support strategies to maximise visibility and impact of institutions. Many professionals currently working with bibliometrics have entered these roles without formal education in the field. As a result, the lack of specialised qualification can occasionally lead to challenges such as the misinterpretation of indicators, a limited understanding of the underlying methodologies, and an overemphasis on simplistic metrics, such as totals counting, without fully considering their limitations. There is often a lack of education available in specific countries, or the only training practitioners receive is from vendors directly. Many training options are too expensive or are tailored to scholars and researchers, leaving librarians and professionals out. Additionally, these trainings may be too generic and not tailored to the specific needs or contexts within which they are operating. As a result, these professionals often struggle in their jobs feeling isolated or too much pressure or expectations on them. As a potential solution they have formed communities of practice.
Scholars have examined the challenges associated with teaching bibliometrics, highlighting the lack of trained educators as a significant gap in bibliometric training. They have pointed to issues within bibliometric education across libraries and information schools, where educational institutions are responsible for instructing students in bibliometric methods, alongside other research methodologies within library and information science (Schrader, 1981). In response to this gap, universities have developed specialised courses that not only teach participants how to employ bibliometrics as a research tool but also introduce them to its underlying principles and theories. Some institutions and university departments have even established comprehensive bibliometric education programs. For instance, the first textbook dedicated to this field, Citation Analysis in Research Evaluation, was introduced at the Centre for Science and Technology (CWTS) at Leiden University to serve as a study guide for their graduate course on Measuring Science. In addition to CWTS’s courses, the European Summer School for Scientometrics has been held annually, hosted by the Universities of Berlin, Vienna (Austria), and Leuven (Belgium) since its inception in Berlin, Germany. Despite the significant role bibliometrics plays in both basic and applied research, its integration into educational programs remains limited, as evidenced by the small number of Library and Information Science courses that cover the subject.
It is essential to promote field-based teaching and learning experiences in bibliometrics, carefully selecting the most suitable content, didactic resources, and pedagogical approaches for practitioners and librarians. Gonzalez-Alcaide (2017) conducted a review of research papers on bibliometric pedagogy, summarising the key competencies and skills needed for the subject. For example, the author recommended teaching bibliometrics through seminars in which the methods, results, and empirical work of studies are discussed in the context of real-world projects, such as collection development in an interdisciplinary setting. One example of a bibliometric course using real cases involved two concurrent components: the first part consisted of seminars with small groups of eight participants, where they prepared and discussed abstracts using the bibliometric methods taught by the educator. The second, empirical component focused on developing skills in online database searching, text-processing software, co-citation analysis, and bibliographic coupling. Historically, scientometrics has focused on applying statistical measures to scientific contexts. However, to promote inclusivity in the arts and humanities, some scholars suggest returning to a ‘Biblio’ (bibliometric) approach rather than a ‘Sciento’ (scientometric) one. Zuccala (2016) explored the role of bibliometrics in the humanities, proposing that well-trained instructors could effectively provide participants with foundational knowledge in constructing mathematical indicators while fostering a problem-oriented learning environment. This approach could help cultivate humanistic bibliometricians, encouraging participants to reflect on new, discipline-relevant indicators for scholarly research outputs in the humanities (Zuccala, 2016).
Bibliometrics Perceptions
Previous research suggests that researchers have ambivalent views on citations and citation-based metrics (Buela-Casal & Zych, 2012; Hargens & Schuman, 1990). For instance, in a survey conducted by Aksnes and Rip (2009), participants acknowledged the use of citations for evaluative purposes but also revealed that they do not closely monitor citations of their own work. This ambivalence may stem from the perception that focussing too much on one’s own citations is considered inappropriate. Researchers also develop ‘folk theories’ about citations, such as the belief that being ‘trendy’ is more important than the quality of the work or that the citation rate of a paper is influenced more by the author’s status than the content (Aksnes & Rip, 2009). In a later survey by Derrick & Gillespie, 2013, over 60% of respondents indicated they would incorporate bibliometric indicators into their applications if they saw it as advantageous. However, the same percentage of respondents (60%) also agreed that such indicators encourage researchers to ‘cheat’ or ‘game’ the system. Scholar’s attitudes regarding bibliometrics are mixed; many are critical of these measures, while at the same time feeling pressured to use them. One main tension described by our respondents is between intradisciplinary criteria of quality and formalised indicators and negotiating these ‘orders of worth’ is a challenging balancing act, especially for younger researchers (Hammarfelt & Haddow, 2018).
A survey conducted by Martin and Skea in 1992 explored academics’ opinions on various research performance measures, including citation indicators. The researchers identified several limitations associated with using citations to evaluate university departments. Nonetheless, a significant majority (67%) of respondents believed that citations should still be included in such assessments. They are based on their experience of scientific publishing, communication, recognition and rewards, and the stories that are told about citations rather than on systematic study (Aksnes & Rip, 2009). Some researchers have contributed to an emerging discussion on what is tentatively being called ‘citizen bibliometrics’ (Leydesdorff et al., 2016; Wouters et al., 2015). In recent inquiries the term has been introduced to denote nonprofessional use of bibliometrics by managers and researchers which, importantly, is preferred over more commonly used but pejorative terms like ‘amateur-’ or ‘layman- bibliometrics’ (Glaser & Laudel, 2005). So far ‘citizen bibliometrics’ remains an underspecified concept, but to our minds, it carries highly promising normative and descriptive implications, which we will seek to expand upon here (Hammarfelt & Rushforth, 2017). Academic surveys have been used to gain insights into their perceptions and practices regarding research metrics (Aksnes & Rip, 2009; Derrick & Gillespie, 2013). However, this latter literature is strongly centred on science fields, with very few studies involving researchers in the humanities (Lewis & Ross, 2011).
The Bibliometrics Service Teaching Programme at the University of Leeds
The Library Bibliometrics Service supports the university’s research community by enhancing research visibility, generating bibliometric reports that analyse university outputs, and helping identify appropriate publishing venues. The experienced staff of the Bibliometrics Service also organises workshops and teaching seminars, which are standalone sessions held throughout the academic year to enhance the academic and research skills of university staff and research students. These workshops are available both in-person and online. Traditionally, the workshops were delivered on-campus, which allowed for direct evaluation of participants’ bibliometric knowledge. However, in response to the COVID-19 pandemic, all workshops were redesigned to be more interactive and participant-centred, with a focus on adapting to the online learning environment.
The University of Leeds offers an ideal environment for integrating the principles of inclusive practice, thanks to its diverse participant population, which includes individuals from various world regions and cultural backgrounds. In the workshops, for example, participants from the arts and humanities worked alongside early-stage Postgraduate Researchers (PGRs) and experienced physicists seeking to enhance their understanding of publishing sources. This dynamic mix fosters a rich learning experience, while also presenting unique challenges (i.e. different levels of bibliometrics understanding and needs). Although some participants may initially express scepticism – such as non-STEM researchers who may feel that bibliometrics is irrelevant to their work – the goal of the bibliometrics workshops is to demonstrate its value to enhance their research and engage all participants in the process, showcasing the benefits of bibliometric tools for diverse research fields.
The courses were co-taught by two university library colleagues. Some participants shared feedback through the evaluation survey, noting that they did not see the benefit of having two instructors during a short teaching session. Despite this feedback, we remain positive in the value of collaboration and teamwork for teaching and its potential to enhance the learning experience. A different approach may have been more effective for bibliometrics; for instance, one facilitator could have focused on guiding the preliminary work, while the other led the real-time sessions. Additionally, one instructor could have engaged with participants via the chat feature, while other instructor would deliver the content. Research has shown that collaboration between educators can improve participant performance (Goddard et al., 2010; Lara-Alecio et al., 2012). However, studies also highlight the complexity of teacher collaboration, suggesting that its success depends on the intricate dynamics between instructors. To more accurately assess the impact of collaboration on participant outcomes, future research should consider moderating or mediating factors, such as leadership, teacher self-efficacy, and participants’ motivation (Mora-Ruano et al., 2019).
Our bibliometric workshops are designed to accommodate up to 100 participants; however, they often experience low enrolment. Despite consistently receiving positive feedback from attendees, we typically have between 10 and 15 participants, which is less than half of our capacity. This low attendance is particularly surprising given that we are employed by a university with a strong emphasis on research. After analysing the feedback, we found that participants expressed a keen interest in enhancing their ability to use bibliometrics in future work and in finding more efficient ways to search for relevant literature, authors, and journals.
This motivation led to the undertaking of the present research: to better understand the perceptions of the discipline and the reasons behind low engagement. By exploring participants’ engagement with bibliometrics, academic practice can be improved. For example, it can provide valuable insights into the feedback received from seminars. Additionally, this research may uncover the underlying beliefs of academic colleagues, allowing bibliometrics to be presented in a more appealing way and highlighting its relevance and advantages for their specific goals and contexts. Understanding these perceptions will help communicate bibliometrics as a valuable research tool to a broader audience, thereby increasing its potential and impact.
This study seeks to deepen our understanding of the academic interests of individuals and the various barriers that hinder their full engagement in their respective fields in bibliometrics. By addressing these factors, we can develop more tailored content that resonates with their unique experiences, thus ensuring it meets their specific needs. Research has demonstrated that when staff members perceive a learning activity as unproductive or not worth their time and effort, their level of participation may decrease significantly; in some cases, they may even withdraw from these activities entirely. To counteract this tendency, it is essential to make the tasks personally meaningful to them. We can enhance teaching by creating connections between the activities and their prior knowledge or experiences, thereby illustrating the relevance and significance of each task (Bigg & Tangg, 2011; Biggs, 1996, 1999).
The research questions are as follows: Q1: Are scholars at the University of Leeds aware of the potential of bibliometrics? Q2: What perceptions do researchers have of the bibliometrics field? Q3: Do these perceptions vary across different subject disciplines? Q4: Does the inclusion of the term ‘metrics’ influence staff engagement with bibliometrics?
Data and Methods
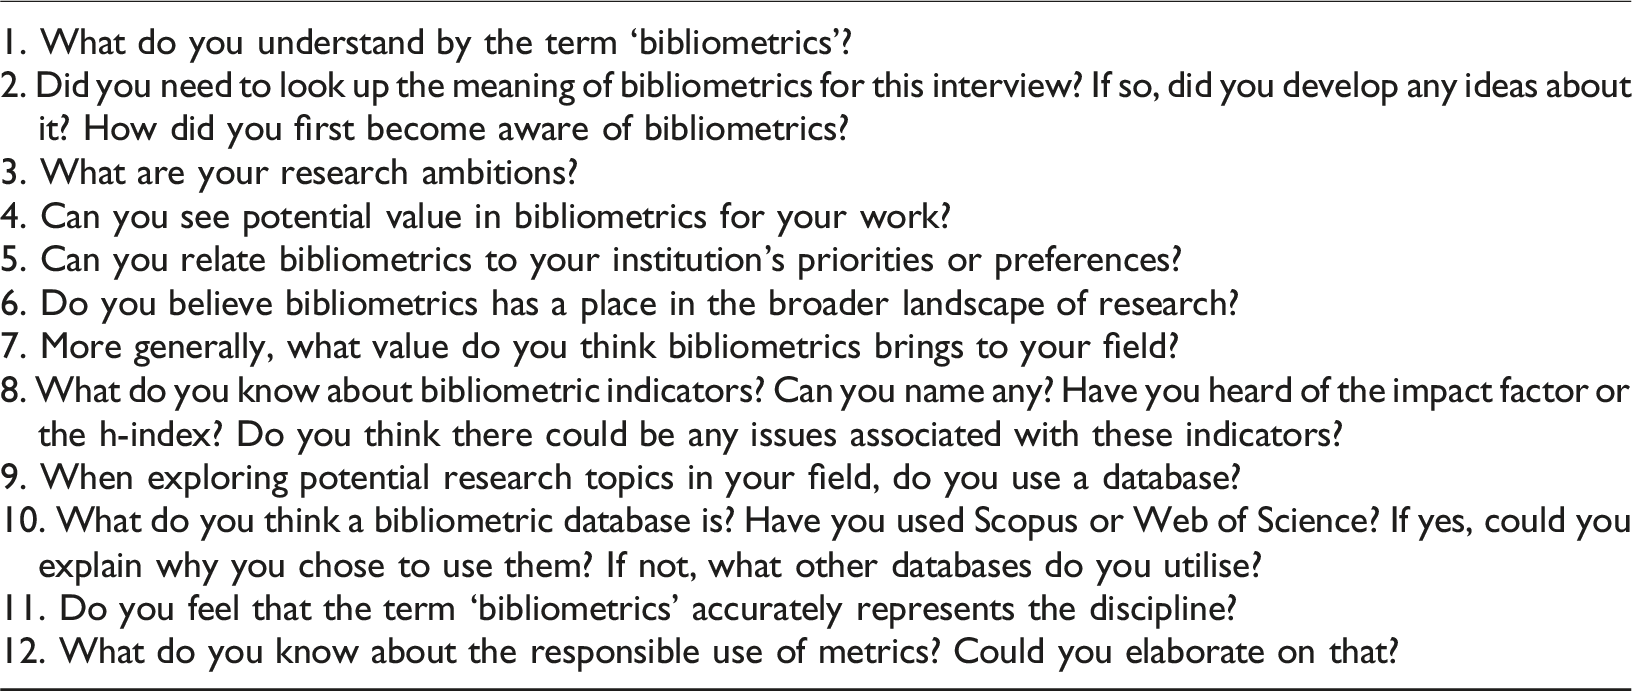
This study gathered data from interviews conducted with research staff from two university faculties: the Faculty of Medicine and Health and the Faculty of Environmental Sciences. Staff members from both faculties received email invitations to participate in the study, along with a brief introduction to the project. Ten participants agreed to take part in online interviews via Microsoft Teams, and a backup questionnaire was made available. Although this was an open call for participation, it was necessary to have an alternative plan in case potential researchers declined. Therefore, the assistance of gatekeepers was sought to help disseminate the invitation. The study primarily targeted academics who currently hold research or academic positions, rather than postgraduate researchers (PGRs) or research students. PGRs were avoided because bibliometrics may not be a priority (just yet) for them, and their responses could potentially distort the results. Interviews were deemed the most appropriate method for this research, as they allowed for the opportunity to listen to researchers and gain first-hand perspectives.
Ten interviews were conducted with research staff using Microsoft Teams. Although the interviews were planned to last no longer than 20 minutes, their semi-structured nature resulted in an average duration of 45 minutes. This extended duration was mainly due to the open-ended questions, which often led the researchers off-topic. Additionally, the introduction of the author as a bibliometrician to the participants may have hindered their ability to express themselves freely, further complicating the challenge of distinguishing personal opinions from factual arguments. Microsoft Teams transcripts served as the primary data source for this study. The live transcripts were automatically saved in Teams by the meeting organizer’s Exchange Online account and were securely deleted at the conclusion of the research for ethical and data protection reasons. The total length of all interview transcripts amounted to 300 pages. NVivo software was used for qualitative data analysis and coding. Coding qualitative data involved organising and categorising textual information to identify patterns. The response data were manually prepared, cleaned, and coded to identify recurring themes, sentiments, and perceptions, which facilitated the identification of clusters.
Initial Codes (or Categories) were created. This involved breaking down the text into smaller units (words, phrases, or sentences) and assigning initial labels or ‘codes’ that represent the key concepts or ideas. For example, if a participant mentions, ‘there is resistance to anything with the word “metric,”’ it was categorised as ‘Resistance to metrics’.
Here are several insightful literal quotes gathered from the interviews: - ‘I think the cultural resistance in academia to anything with the word “metric” in it is mainly about resistance to performance management’. - ‘In the Arts and Humanities, and social sciences in particular, anything that converts qualitative work into numbers or metrics is sometimes resisted’. - ‘There is a suspicion of statistics and measures among people who don’t understand statistics and measures’.
The data collection was conducted in September 2022.
Results
The first figure is a word cloud representing the total responses from participants. Only the responses were analysed, excluding the questions. A word cloud is a powerful visual representation that highlights the frequency of specific terms or phrases in a dataset (Figures 1 and 2). Word Cloud of Participants’ Responses Horizontal Dendrogram Cluster Analysis Using a Similarity Metric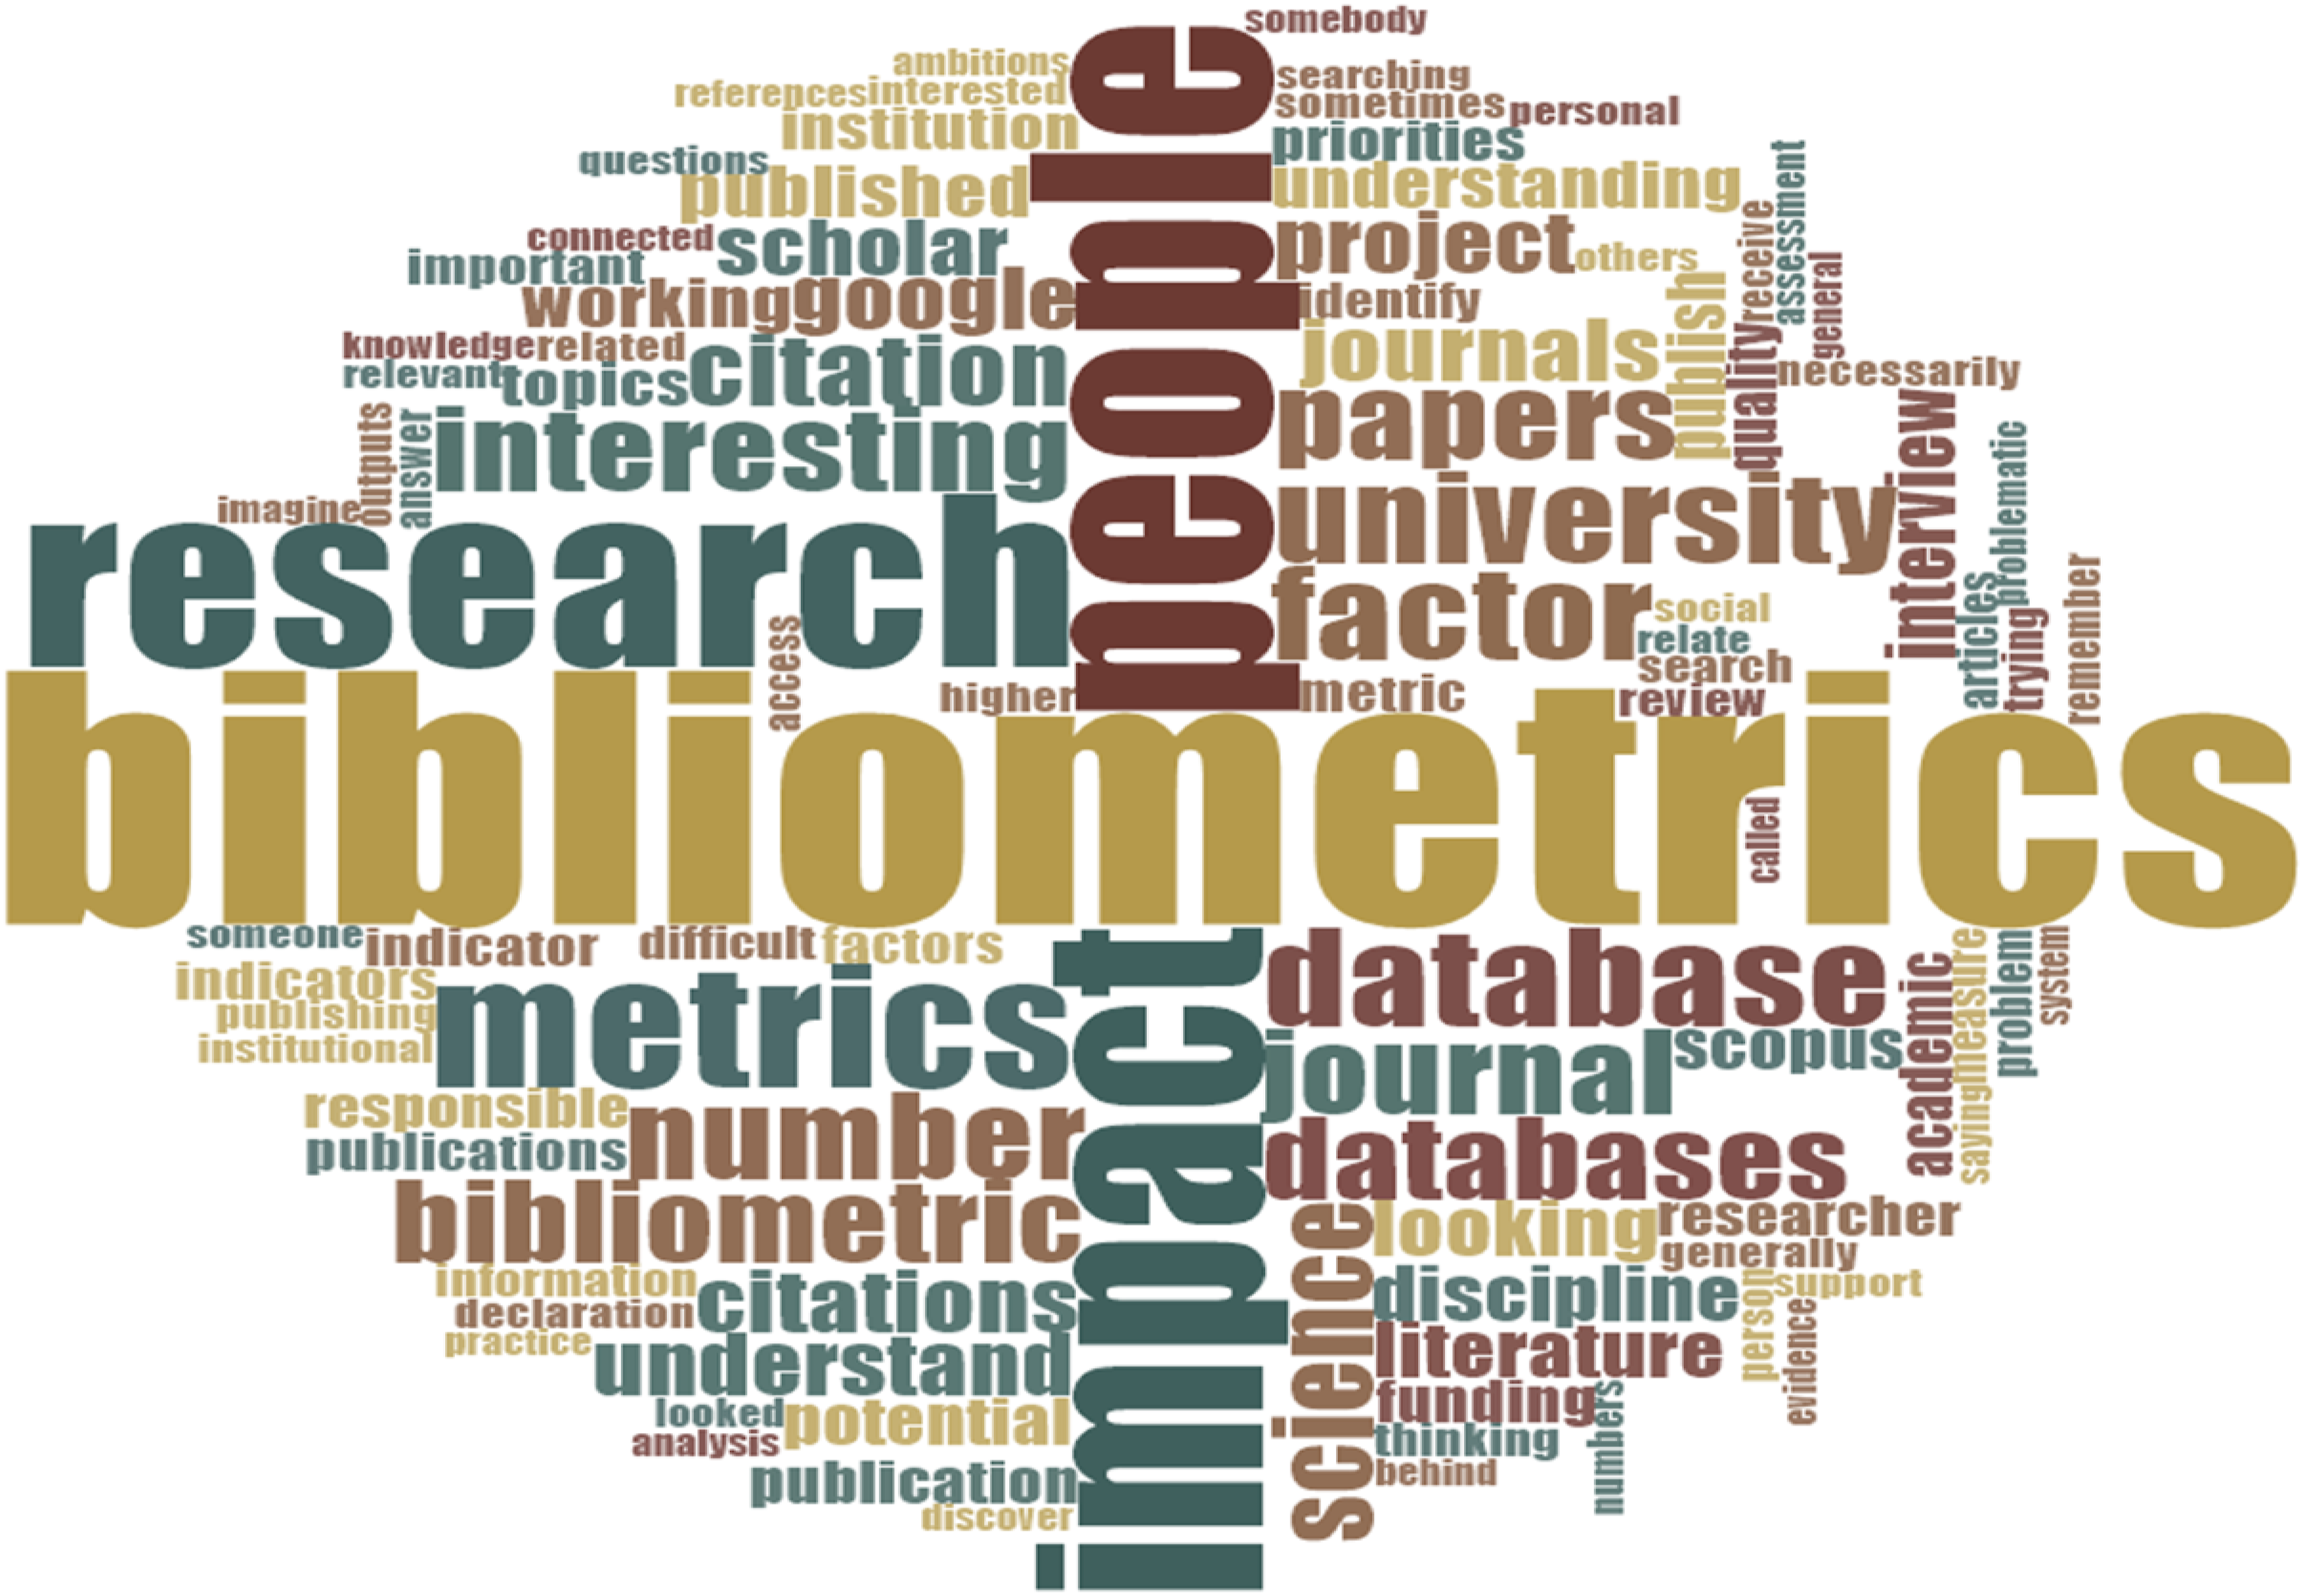
The words contained in the selected sources or nodes are compared. Sources or nodes that have a higher degree of similarity based on the occurrence and frequency of words are shown clustered together. Sources or nodes that have a lower degree of similarity based on the occurrence and frequency of words are displayed further apart. Word clouds are powerful tools for understanding language. Using varying font sizes and colours, they visually represent the most frequently occurring words in a text, dataset, or conversation. This format highlights key themes and patterns, providing insights into recurring ideas and emotions. Word clouds help language devotees, researchers, and data analysts identify central themes and sentiments by focusing on word frequency. Additionally, they can reveal unexpected patterns that may not be obvious in traditional text analysis, such as common complaints or praises in customer reviews, aiding businesses in pinpointing areas for improvement or leveraging strengths.
Identifying key themes and patterns involves analysing frequent terms within the data. The larger words in the word cloud represent terms that appear frequently. These words can indicate key topics or themes that are prominent in the data. For example, if we observe interview responses related to bibliometrics, we might find that terms like ‘Bibliometrics’, ‘Impact’, ‘People’, and ‘Research’ appear larger and more prominently.
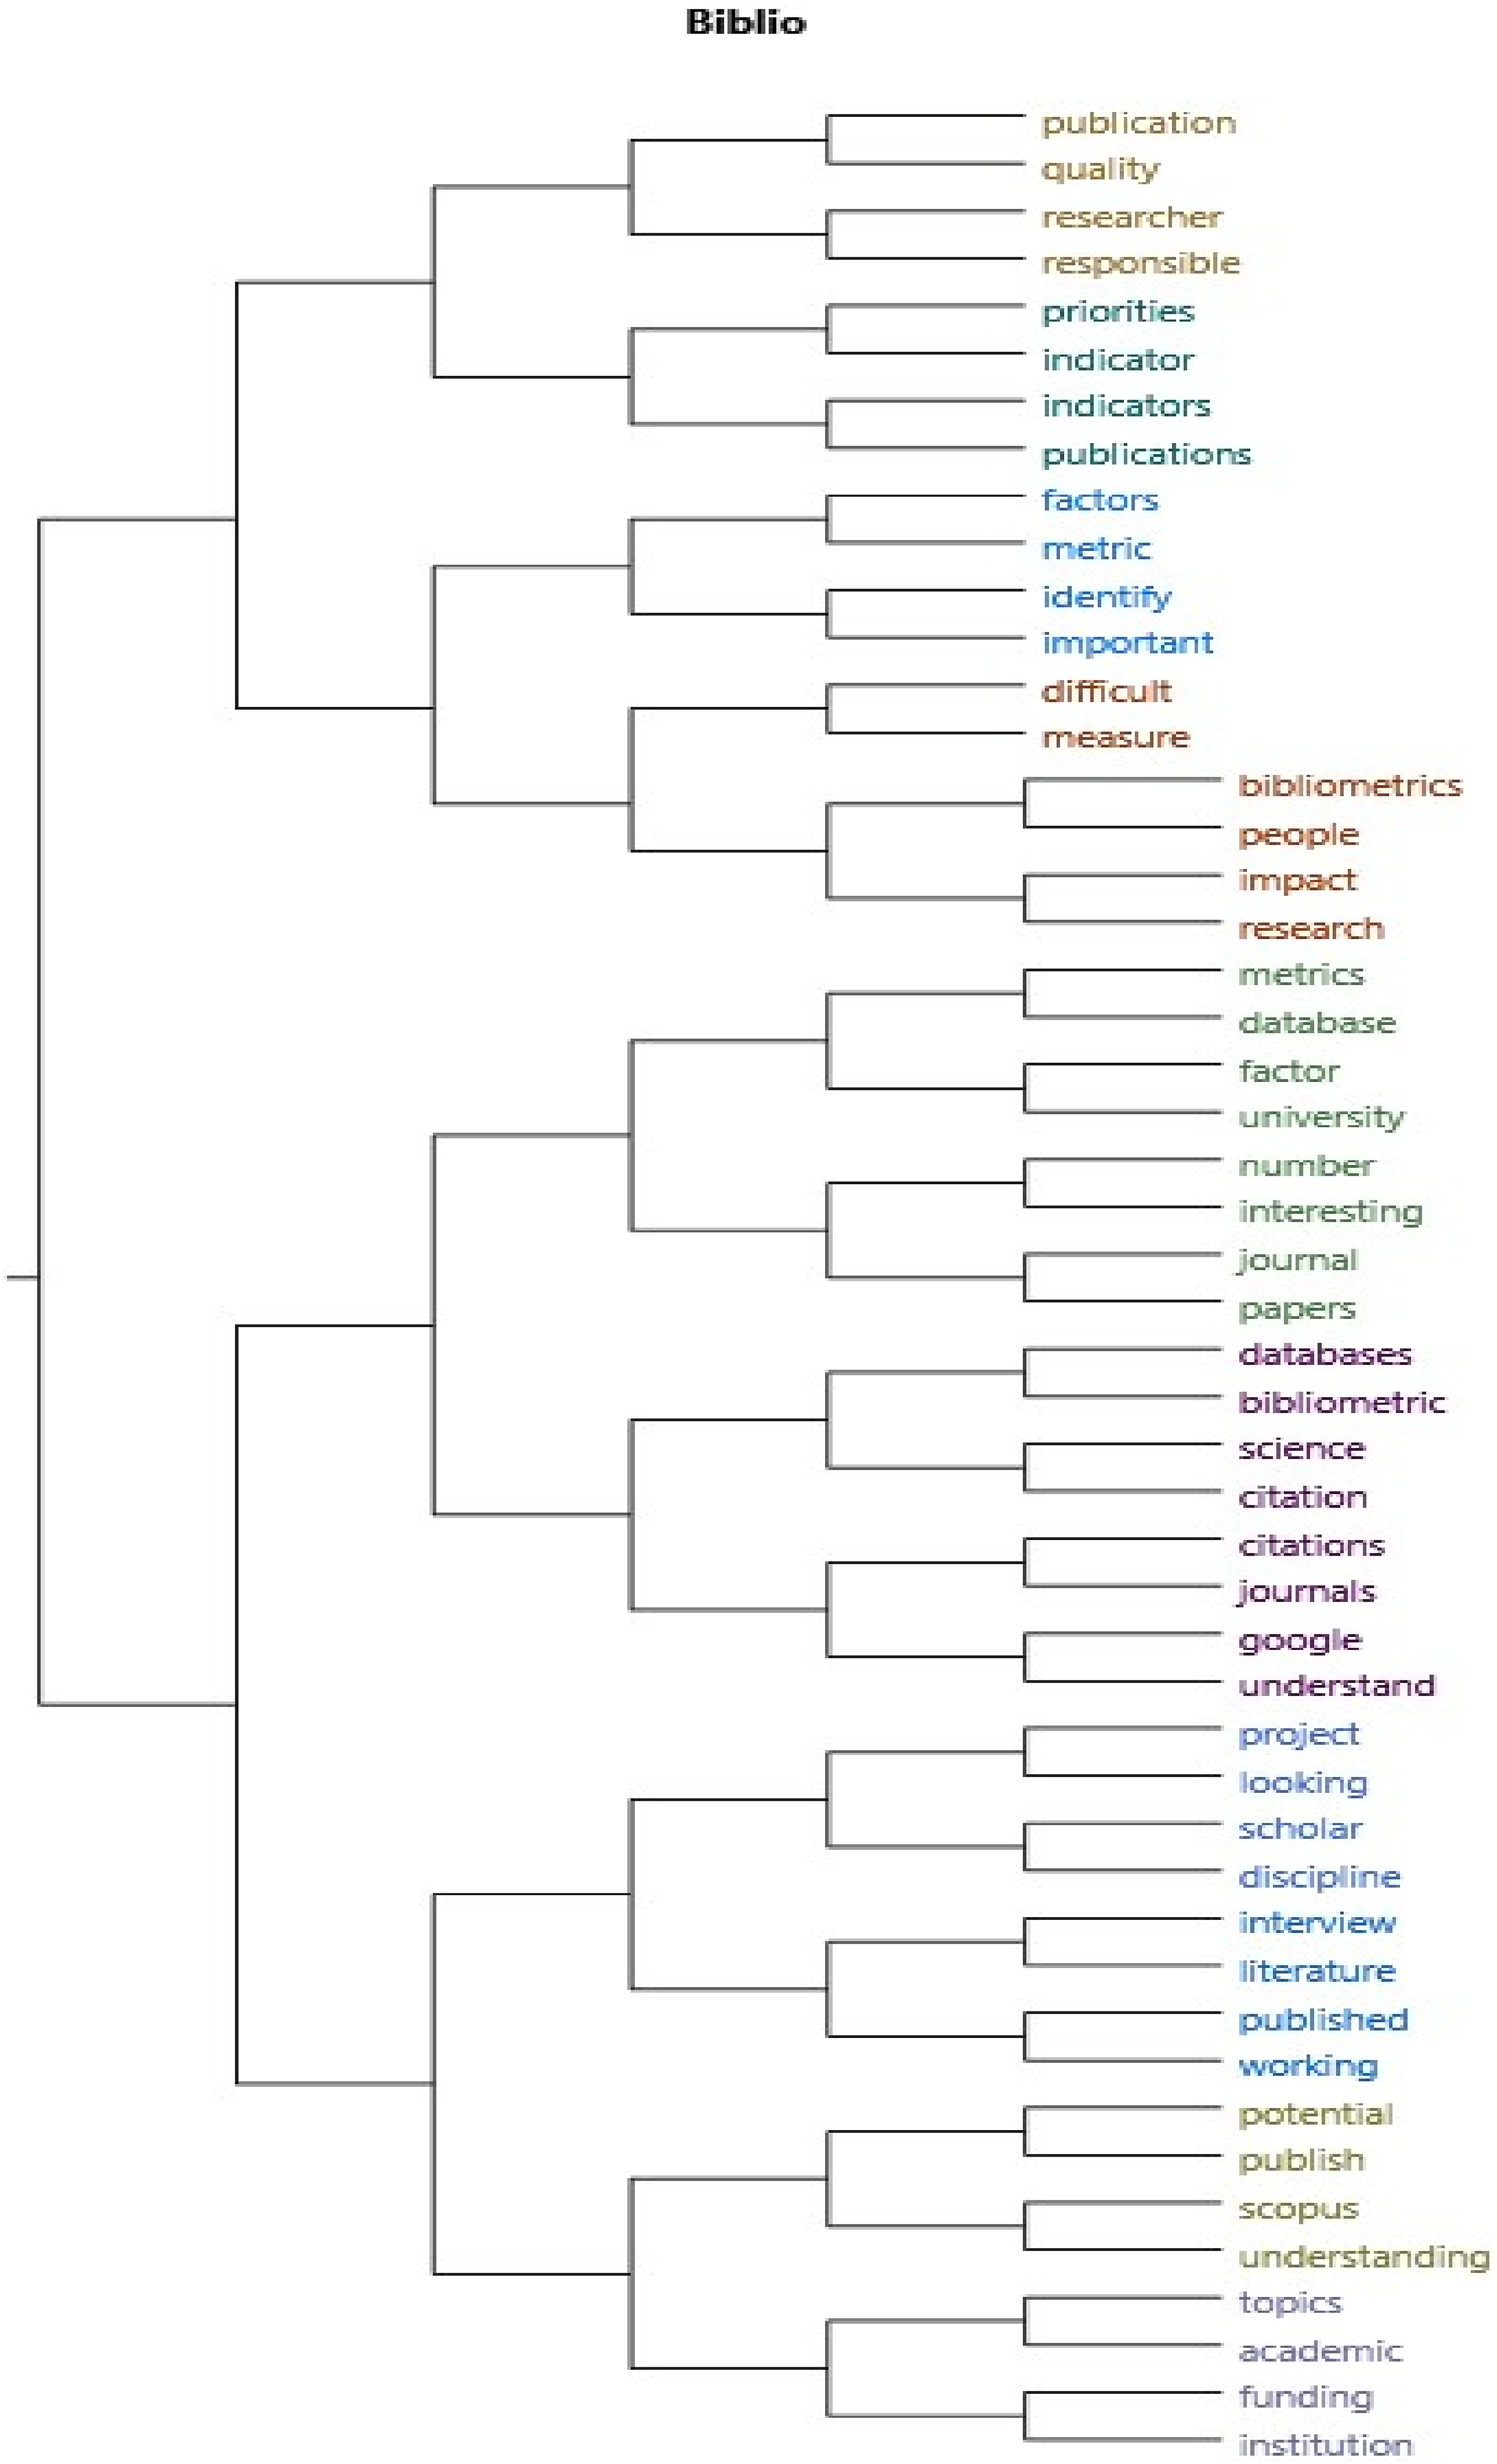
The second figure illustrates a comprehensive cluster analysis that employs the Pearson correlation coefficient as a similarity metric. This analysis focuses on identifying and examining each distinct word in the text of the various files under consideration. By calculating the similarity index for every possible pair of items, the software NVivo organises these items into several clusters, with a default setting of ten clusters. To achieve this clustering, NVivo utilises the complete linkage hierarchical clustering algorithm, also known as the farthest neighbour method. This agglomerative clustering technique starts with each individual element occupying its own unique cluster. As the process progresses, these initial clusters are sequentially merged into larger, more inclusive ones. This continues until all elements are eventually consolidated into a single comprehensive cluster, allowing for a holistic view of the data. The results of this clustering analysis can be effectively visualised through a dendrogram, a tree-like diagram that displays the relationships among the clusters. The dendrogram not only shows the sequence in which the clusters are merged but also illustrates the distance at which each fusion occurs. This visualisation aids in understanding the structure and hierarchy of the data, providing insights into the patterns and relationships between the different words analysed.
In the figure, we observe a horizontal Dendrogram diagram where similar items are grouped together on the same branch while different items are positioned farther apart. Dendrograms serve as a valuable tool for comparing pairs of items, illustrating clusters represented as groups of items (e.g. words) organised based on their similarity. Each cluster signifies items that are more alike than those in other groups.
Items that are clustered more closely indicate a greater degree of similarity; for instance, publications, researchers, quality, and responsibility are positioned near one another in the diagram, reflecting their relatedness based on the chosen Pearson correlation coefficient similarity metric. Conversely, items placed further apart represent more dissimilar data points according to the same metric. For example, institutions’ and researchers' words are distanced, suggesting that perhaps their priorities in research differ. The dendrogram’s colour coding highlights different clusters, with distinct colours assigned to indicate various groups or relationships. This use of colour facilitates quick identification of unique patterns or relationships among the items.
To effectively identify the various categories, present in the responses, a thorough analysis of the complete dataset was conducted. This initial review aimed to develop a holistic understanding of the content, which included carefully reading through each response to grasp the general themes and sentiments expressed by the participants. Once this preliminary examination was completed, the next focus shifted to identifying repeated comments – specific phrases, words, or concepts that consistently emerged across multiple responses. By pinpointing these recurring elements, we could gain valuable insights into the prevalent themes in the data. Following the identification of these repeated themes, the responses were systematically categorised into broader classes. This step required a thoughtful grouping of similar responses to highlight the emerging themes more clearly. The process involved analysing the nature of the repeated comments across all responses, ensuring that each category accurately represented a distinct aspect of the data. Ultimately, this detailed categorisation facilitated a deeper understanding of the respondents’ perspectives and allowed for a more structured analysis of the findings.
The categories are as follows: • Journal Impact Factor. • Concerns on bibliometrics. • Analysing publications. • Citations. • Positive bibliometrics. • Search engines such as Google Scholar. • Bibliometrics indicators. • Bibliometrics and where to publish. • No heard about responsible metrics. • Using bibliometrics databases.
Based on the data presented in Figure 3, the three categories with more words were as follows: Journal Impact Factors: Participants expressed positive comments on how impact factors of journals influence publication decisions and the perceived prestige of various journals within their fields; however, they also expressed concerns being used as an evaluation tool. Concerns of Bibliometrics: There were numerous discussions regarding the challenges and limitations of bibliometrics, highlighting concerns about its accuracy and the potential for misuse in evaluating research quality. Analysing publications: Many participants emphasised the role of bibliometrics in searching for publications but also indicated a growing reliance on these metrics to gauge research performance. These themes collectively reflect the participants’ keen awareness of the complexities and implications of bibliometrics in the academic landscape. Categorisation of Interview Responses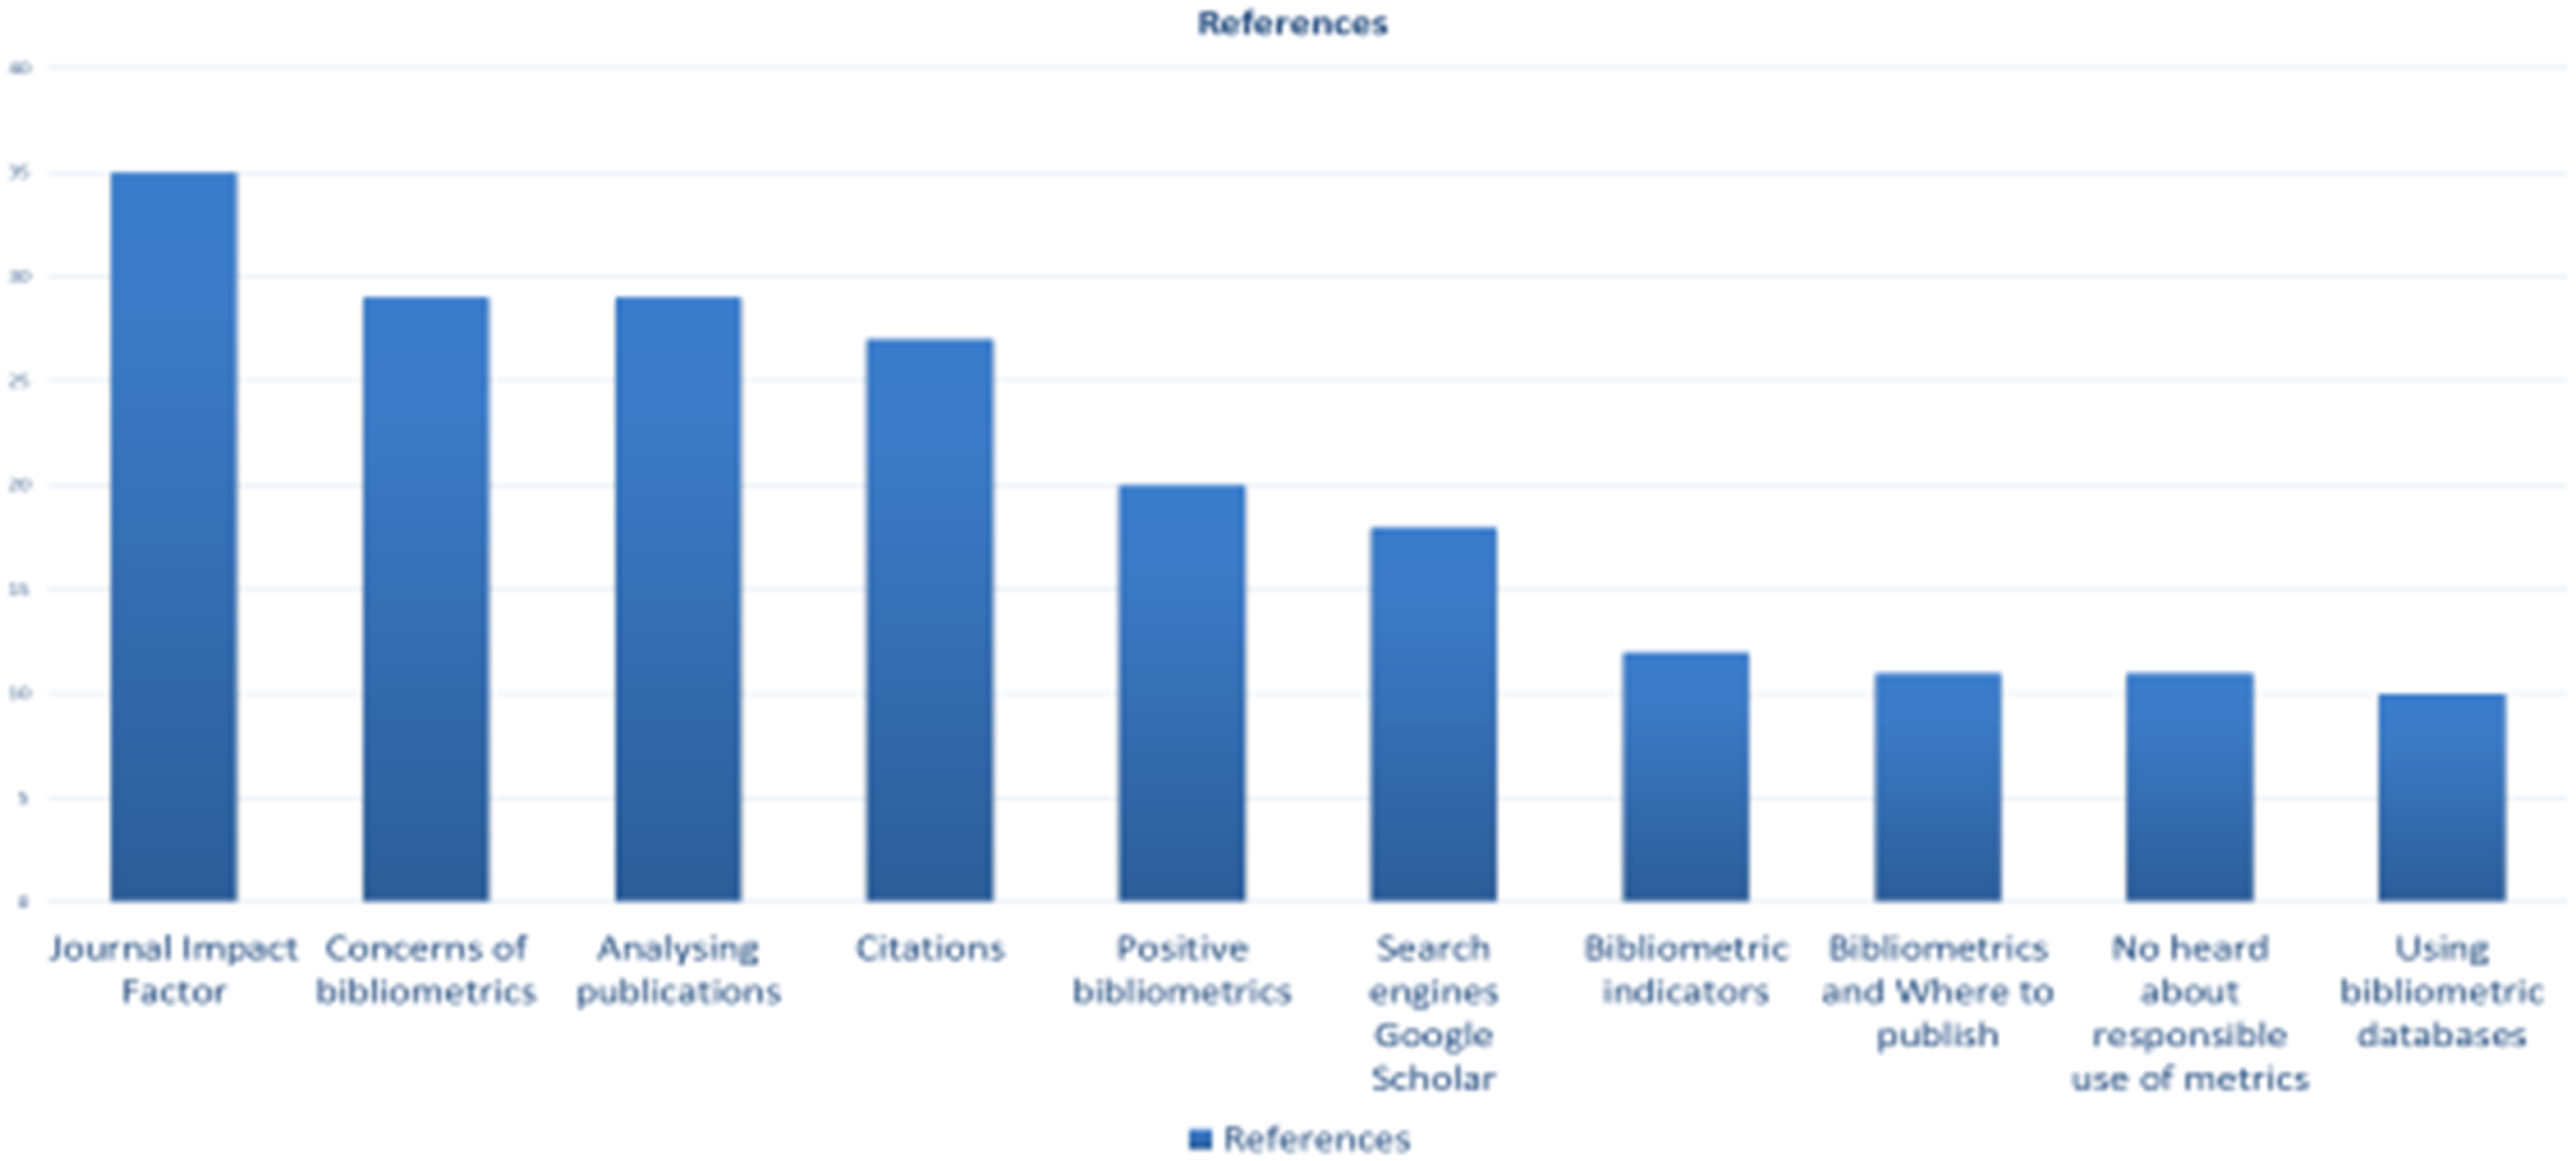
The figure above illustrates the process of organising responses into distinct categories for analysis. Each response is analysed and classified based on common themes or criteria to enhance understanding and facilitate further investigation.
During the interview, the Journal Impact Factor emerged as the central theme, being mentioned a total of 35 times across the sample of interviews. Figure 4 offers a detailed analysis of the responses related to the Impact Factor, highlighting it as the most prominent topic among the academics interviewed (Figure 4). Sample of Respondents That Mentioned Impact Factor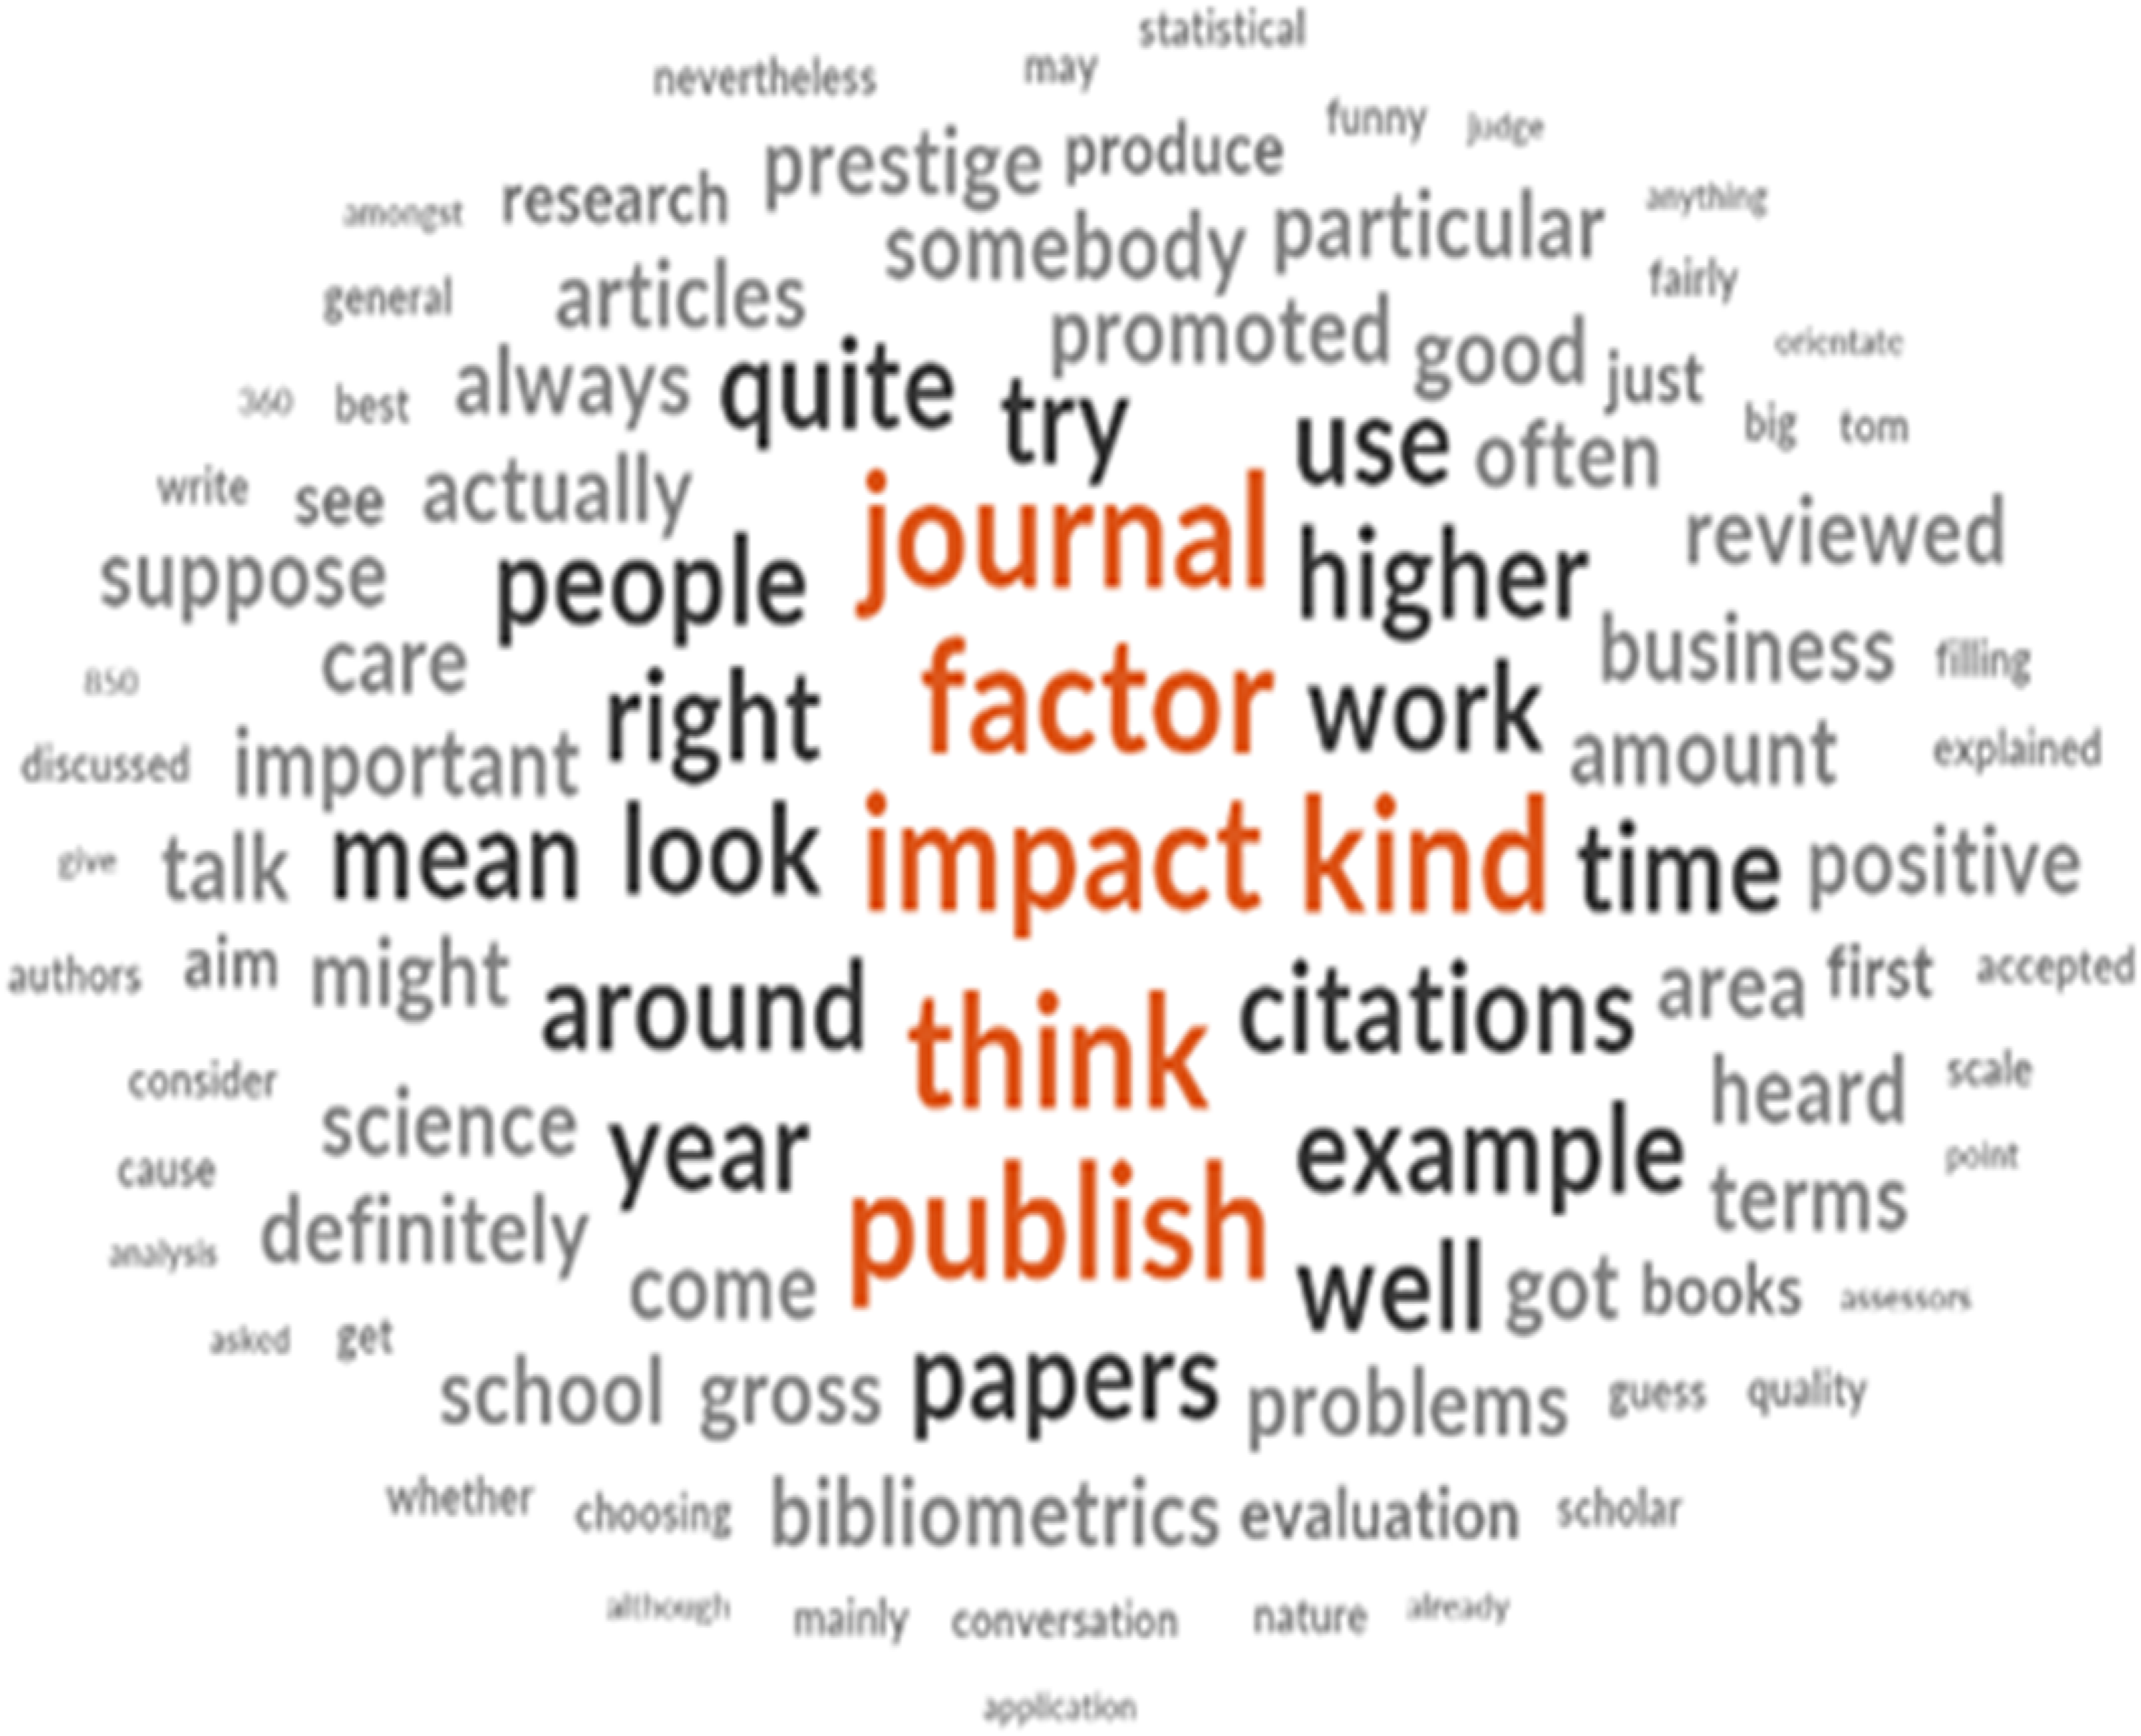
Upon examining the figure, it is clear that discussions about impact factors often focus on several key terms. One of these is citations, which refer to the frequency with which scholarly works are referenced. Another important term is promotions, which can be influenced by an individual’s publication record. Prestige is also commonly mentioned, as it serves as a measure of the quality and influence of research outputs. Furthermore, the concept of prestige highlights the reputational aspects associated with academic journals and their effects on authors’ careers.
Important considerations regarding various problems that can arise in this context include measurement issues and the potential misuse of impact factors as the sole indicator of research quality. Additionally, the intersection of academic work and business practices is an aspect worth noting. Interestingly, during these discussions, someone introduced the term ‘positive’ in relation to impact factors. This brought an unexpected perspective on how these metrics can influence scholarly work and reputations in a beneficial manner.
Limitations of the Study
This research project encountered several limitations that should be considered when interpreting the findings. First, it became evident that the participants possessed prior knowledge of the topic, likely due to their interactions with gatekeepers. This highlights the influence of gatekeepers in shaping participants’ understanding of the subject matter, which may have introduced bias into their responses. Second, the study’s small sample size limited the ability to capture a broad range of perceptions, particularly across disciplines such as the Social Sciences and Humanities. Despite efforts to gather a diverse dataset, the limited number of participants from these fields made it difficult to draw universal conclusions regarding bibliometrics in these areas. Finally, while the open-ended questions used during interviews typically led to sessions lasting up to 45 minutes, this time investment was ultimately beneficial. The responses yielded rich insights, enhancing the depth and breadth of the findings. However, it is worth noting that participants often needed prompting to recall specific research-related terms, which could have influenced the spontaneity and richness of their responses.
Discussion and Conclusions
To cultivate a deeper interest in bibliometrics among researchers, an effective strategy is to engage them in practical, real-world scenarios that highlight how bibliometric tools can benefit their professional development and advance their careers. For instance, a bibliometrics session could incorporate dynamic active learning strategies. This approach would transform participants from passive recipients of information into engaged, collaborative learners who work together to confront and solve tangible challenges they may also face in their academic careers. The results of this collaborative effort would provide benefits that they can apply both immediately and in the long term. Presenting bibliometrics in a tailored manner, adapted to the needs and challenges of researchers within their discipline, would be more impactful than simply using general data focused on evaluate performance. This approach would positively influence how they view the discipline, helping them see its direct relevance and value to their professional growth.
Collaborative learning and peer teaching pedagogy would encourage group work, or peer teaching can help researchers learn from one another’s strengths and foster deeper understanding through collaborative problem-solving. A possible scenario involves a diverse group of staff members being tasked with identifying an ideal new researcher to join the institution’s prestigious Computing and Mathematics subject area. Leveraging their expertise in bibliometrics, the participants will engage in thoughtful discussions and collaborative decision-making processes to critically analyse various candidates. Once the group has reached a consensus, they would present their well-reasoned findings and the rationale behind their choices to the rest of the class, fostering an interactive environment where they receive constructive feedback from their peers.
Through project-based and inquiry-based learning promoting active learning could work well in a bibliometric session, shifting from the role of a lecturer to that of a facilitator. In this scenario, inquiry learning would entail developing questions, making observations, conducting research to determine what information has already been recorded, developing methods for experiments, developing instruments for data collection, analysing and interpreting data, outlining possible interpretations, and making predictions for future research to assist participants in identifying a problem to solve to create their research project. Participants would see inquiry-based learning as research and integrate research and teaching, where both participants and teachers are ‘compatriots in the search for knowledge’ (Justice et al., 2007). However, it is recognised that many factors, such as the nature of the institution (e.g. research intensive universities vs. teaching universities), the disciplinary context (e.g. different views in bibliometrics in medicine than in art and humanities), and knowledge background (e.g. researchers where publications are not the core aspect of their performance), could influence the successful launch of bibliometric education.
Bibliometrics education should be broadly available, reaching beyond prestigious institutions with the resources to afford and offer specialised bibliometric courses and ensuring access for a wide array of participants from various backgrounds. This education must be developed across various global regions, ensuring that individuals from different backgrounds and contexts can benefit from it. It is essential that the approach to teaching bibliometrics is inclusive, and open, fostering an environment where all types of participants can engage, learn, and grow. Develop a bibliometrics accessible to all. In doing so, this education should not only enhance individual knowledge but also contribute to the overall development of different communities and sectors involved in scholarly communication and research evaluation (Brew, 2003, 2006; Robertson, 2007; Robertson & Bond, 2005).
Furthermore, in academic workshops and seminars, the method of guided inquiry can be employed, wherein thought-provoking questions are posed to stimulate research while granting scholars the autonomy to explore these questions in depth. For example, a question such as “Why do certain regions of the world receive fewer citations than others?” could be raised. Researchers can leverage available resources to bridge theoretical knowledge with practical applications by taking ownership of investigating this issue. This process fosters individual academic growth and opportunities for collaborative learning between instructors and participants to understand the context. While smaller-scale inquiry-based exercises are recognised for enhancing research skills, comprehensive inquiry-based courses or degree programs substantially improve learning outcomes (Kuhlthau et al., 2015).
Flipped Classroom instructors can provide pre-recorded lectures on bibliometric concepts like citation analysis, the h-index, or impact factors and then use the in-class time for practical exercises, such as performing citation analysis on a given set of articles, interpreting bibliometric data, or discussing the limitations of these metrics. In active learning with data analysis, where participants use hands-on learning activities, students can interact directly with bibliometric data using tools like VOSviewer and CiteSpace. These tools allow researchers to visualise citation networks, impact factors, and author collaborations.
Moreover, it is essential to establish clear expectations for our teaching approach in bibliometrics and the rationale behind it, highlighting the benefits it brings to researchers. It is also important to acknowledge that our efforts to promote inclusivity may encounter cultural differences. What enhances inclusivity for one group – such as European participants – may not align with the expectations of participants from other cultural backgrounds. Nevertheless, we can foster an inclusive environment where all participants feel comfortable sharing their thoughts, regardless of their cultural backgrounds. For example, providing a whiteboard or anonymous platform can help more reserved participants express their views with greater ease. Additionally, bringing together participants from diverse backgrounds, such as early-career and senior researchers, can enrich the exchange of ideas and contribute to a more dynamic and insightful learning experience.
As mentioned in the interviews by researchers, resistance to metrics in academia is often rooted in a broader aversion to performance management, particularly the belief that metrics are primarily used to evaluate researchers’ performance. This concern can generate increased pressure and anxiety, as scholars may fear that their work will be reduced to mere numbers. A deeper exploration of this issue is necessary to identify potential solutions that could help mitigate these concerns and foster a more positive outlook toward bibliometrics in academia. Such an examination could reveal the benefits of bibliometric analysis, demonstrating its value in enhancing research evaluation without compromising the richness of qualitative contributions. Researchers may hesitate to adopt metrics, fearing they oversimplify the complexity and depth of their scholarly work by focusing solely on publication counts. However, with a balanced approach and proper engagement, bibliometrics can complement rather than diminish the value of research, offering valuable insights without overshadowing the richness of the work itself.
By integrating various pedagogical approaches, educators can provide a comprehensive and engaging learning experience in bibliometrics, ensuring that researchers gain both theoretical knowledge and practical skills in this crucial area of academic research. Participants in the study observed that while the term ‘bibliometrics’ accurately reflects the discipline, they mainly associate it with evaluation metrics. Consequently, there may be value in renaming the field to better capture its broader scope. This study aims to present bibliometrics in a way that moves beyond an overemphasis on evaluation metrics, emphasising its multifaceted nature and diverse applications.
Pedagogical literature has addressed issues related to low engagement, particularly in the context of teaching in the post-COVID-19 environment. Engagement is recognised as a crucial indicator of effective teaching, helping to sustain attention and motivate participants, especially in online settings (den Brok et al., 2006; König & Pflanzl, 2016). Drawing on these insights, we have re-evaluated our assumptions about attendance and engagement in bibliometric training. It is possible that low attendance is not solely tied to the subject matter but may also be influenced by other factors that warrant further investigation.
Future Research
It is crucial to critically assess the effectiveness of interviews in gathering relevant information for the project. Exploring alternative methodologies discussed in existing literature could have provided valuable insights from researchers, potentially enriching the project. Future research should focus on evaluating the applicability of various methodologies, drawing from current studies to ensure the most effective approach is used.
It is also important to recognise that this project represents only a small fraction of the work that remains. Further tasks include situating the project within the broader scientific literature, understanding the characteristics of researchers, and offering personalised support to address their needs.
The potential benefits of this research extend well beyond its current scope, with significant implications for library schools in the United Kingdom and internationally. The author of this present paper is committed to continuing this work as a key component of their academic practice and plan to collaborate with global organisations and communities, such as LIS Bibliometrics community, CILIP, and other library and information associations, to advance the field further.
Statements and Declarations
Footnotes
Conflicting Interests
The author(s) declared no potential conflicts of interest with respect to the research, authorship, and/or publication of this article.
Funding
The author(s) received no financial support for the research, authorship, and/or publication of this article.