
Abstract
Subjective age—how old individuals feel, look, behave, think, identify based on interests, and wish to be—is a multidimensional construct linked to health and wellbeing. We examined whether stable (self-perceptions of aging, aging expectations) and daily (stress, affect) factors predict six subjective age dimensions: Felt, Look, Behave, Mental, Interest, and Ideal Ages. A community sample of 209 Australian adults (19–84 years; Mage = 54.56, SD = 17.49; 64.59% female) completed two 7-day diary bursts 4 weeks apart, providing 2,385–2,419 observations collected near the end of COVID-19 restrictions. Multilevel models estimated between-person (stable) and within-person (daily) associations and tested moderation by chronological age. Between persons, lower positive affect was associated with older subjective age across all dimensions except Ideal Age. More negative self-perceptions of aging predicted older Ideal Age. Age moderated the relationship between self-perceptions of aging and Interest Age: negative self-perceptions were linked to younger Interest Ages, especially among older adults. Within persons, days with higher positive affect predicted feeling younger for all except Ideal Age, whereas higher negative affect predicted older Felt Age. On days with more stress, people reported older Felt, Mental, and Interest Ages. Findings support subjective age as a dynamic, multidimensional construct in understanding aging.
Keywords
How old a person feels, or their subjective age (SA), predicts many indicators of successful aging, including physical activity (Wienert et al., 2015), quality of life (Huang et al., 2017), and physical, mental, and cognitive health (Aftab et al., 2022; Alonso Debreczeni & Bailey, 2021). SA is increasingly viewed as a multidimensional construct shaped by both stable beliefs about aging and daily experiences (Barrett & Montepare, 2015; Diehl et al., 2014; Kastenbaum et al., 1972). Theoretical frameworks propose that SAs are created through anchoring and adjusting in response to distal internalized representations of aging and proximal everyday experiences (Hughes & Touron, 2021; Montepare, 2009). Distal anchors such as self-perceptions of aging (SPA) and expectations regarding aging (ERA) provide broader age-related frameworks that guide longer-term SA trajectories. Proximal cues, which Montepare (2009) originally described as discrete age-related events, were expanded by Hughes and Touron (2021) to include ongoing situational influences from the “Immediate Context,” such as daily stressors and affective states, which can lead to short-term fluctuations in subjective age. The contextual model emphasizes that SA varies across contexts and that repeated situational exposures may accumulate to create long-term change (Hughes & Touron, 2021). The current study examines both stable and daily predictors of six SA dimensions (Felt, Look, Behave, Mental, Interest, and Ideal Ages) in an adult life-course sample.
Although recent literature recommends using multidimensional measures for a more nuanced understanding of subjective aging (Barrett & Montepare, 2015; Diehl et al., 2014; Kotter-Gruhn, Kornadt, & Stephan, 2015), approximately 70% of studies still use the single-item Felt Age question (Pinquart & Wahl, 2021). Furthermore, composite scores may obscure dimension-specific processes and limit understanding of how context shapes subjective aging. SA dimensions may show varying relationships with different contexts and a multidimensional approach could examine this possibility (Hughes & Touron, 2021). For example, experiencing a tip-of-the-tongue memory failure that has been interpreted as age-related may have a greater impact on feeling mentally older than feeling physically older as the latter may rely more on appearance and physical characteristics.
Beyond methodological considerations, clarifying how individual SA dimensions relate to stable beliefs and daily experiences is conceptually important. Different dimensions may reflect distinct psychological processes and vary in their sensitivity to context. Because age-related stereotypes operate across physical, cognitive, and behavioral domains, SA should be assessed in a way that mirrors these multidimensional pathways (Hughes & Touron, 2021). Identifying which experiences or beliefs shape specific SA dimensions can clarify theoretical models of SA, explain why dimensions may respond differently to daily contexts, and may help identify relevant factors for interventions targeting specific facets of subjective aging.
SPA and ERA are considered higher-order views on aging constructs that develop over the lifespan and directly impact SA (Wurm et al., 2017). More negative SPA and more positive general beliefs about aging generally predict older SA (Bodner et al., 2017; Hess et al., 2017). Within the contextual model (Hughes & Touron, 2021), these constructs may serve as distal anchors that influence baseline SA across dimensions and potentially contribute to between-person differences. However, the model also suggests that associations between life contexts and SA may vary across dimensions. It may be that relationships between SA and stable age-related predictors like SPA and ERA differ depending on the specific SA dimension examined, highlighting the need to examine these associations beyond composite or unidimensional measures.
SA can also adjust in response to contextual cues such as affective states, stressors, and social or physical experiences (Hughes & Touron, 2021; Montepare, 2009). Consistent with this, within-person factors accounted for 19%–40% of daily variability in Felt Age among older adults (Bodner et al., 2021) and 60%–75% in Felt and Look Age among younger adults (Lee & Neupert, 2024). Stress and affect are well-established proximal predictors of daily Felt and Look Age (Klaiber & Pauly, 2025; Kotter-Gruhn, Neupert, & Stephan, 2015; Lee & Neupert, 2024). Affective experiences may provide feedback about perceived energy and ability to meet daily demands. Days when individuals report more stress or negative affect could serve as proximal cues that indicate experiencing more challenges and contribute to older SA ratings. On the other hand, positive affect may reflect greater vitality or functioning, contributing to a younger SA. However, there is emerging evidence that these effects may vary across dimensions. For instance, Kornadt et al. (2025) showed that prior-day stressors did not predict Felt or composite SA, yet were associated with older Behave Age when dimensions were examined separately. These mixed but promising findings underscore the value of a multidimensional approach. Rather than relying on composite or unidimensional scores, examining daily fluctuations across distinct SA dimensions may clarify when and which proximal experiences matter.
Chronological age can also influence interpretations of SA and age-related constructs. Adolescents and young adults sometimes report feeling older than their chronological age, whereas people in their mid-to-late 20s typically report feeling younger, with the discrepancy between subjective and chronological age widening into very late adulthood (Pinquart & Wahl, 2021). Feeling relatively older in youth may reflect maturation and growing independence (Galambos et al., 2009), while a younger SA in later life may protect against negative age stereotypes by facilitating psychological distancing from one’s age cohort (Weiss & Lang, 2012). Though age stereotypes develop early in life, SPA and ERA may be more salient among mid-life and older adults due to their increasing self-relevance and the assumed shift from subconscious to conscious processing of these views (Diehl et al., 2014; Levy, 2009; Wurm et al., 2017). Chronological age may therefore moderate associations between distal anchors and SA. Because SA may carry different meanings at different life stages, researchers should consider using proportional discrepancy scores to distinguish individuals of different chronological ages who report the same subjective-chronological age discrepancy, particularly in life-course samples (Kotter-Grühn & Hess, 2012).
The Current Study
This study examined how stable (SPA and ERA) and contextual predictors (daily stress and affect) relate to six SA dimensions (Felt, Look, Behave, Mental, Interest, and Ideal Ages) in a life-course sample of Australian adults assessed near the end of COVID-19 lockdowns. We tested whether daily SA fluctuations were associated with stress and affect, whether SPA and ERA predicted between-person differences in SA, and whether chronological age moderated the association between SPA, ERA, and SA. Based on prior work, we expected that higher stress, lower positive affect, and higher negative affect would predict older daily SAs, particularly for Felt and Look Age. We also hypothesized that more negative SPA and more positive ERA would relate to older SA at the between-person level. Due to limited evidence beyond Felt Age and mixed dimension-specific findings, we adopted an exploratory approach rather than specifying hypotheses for each predictor-dimension pairing.
Methods
Study Design
This was a secondary analysis of the Labs without Walls study (Brady et al., 2023), an 8-week remotely administered project examining short-term fluctuations in self-perceptions of age and gender using a measurement-burst design (Nesselroade et al., 1991). The project was approved by the UNSW Human Research Ethics Committee (HC200792) and all participants provided informed consent. Participants consented to deidentified data being shared externally only with approval from a human research ethics committee and the study research team. The study was not preregistered but analytic code is available at https://osf.io/ayf85. We follow the STROBE reporting guidelines for observational cohort studies (Von Elm et al., 2007; see Supplemental Appendix A for reporting checklist).
The free research app, developed using Apple ResearchKit (Apple Inc., 2023), administered a baseline questionnaire, cognitive and sensory tasks, an end-of-study survey, and four 7-day measurement-bursts that alternated between assessing daily SA or gender expression. All surveys and tasks remained in participants’ task list for up to 3 days. Timestamps were checked for daily surveys to ensure multiple entries were not submitted on the same day. Throughout the study, an Apple Watch passively collected health and environmental data. The current study only reports data from the two SA bursts and baseline survey.
Participants
229 participants were recruited nationally between May 2021 and January 2023, near the end of Australia’s COVID-19 lockdowns. Recruitment took place through online expression-of-interest forms, volunteer registries, job boards, email newsletters, and social media. Eligible participants were aged 18 to 85 years, resided in Australia, spoke English, owned an iPhone 6 S or newer, and consented to download a free research app. Recruitment was stratified by sex (male, female) and seven age groups (e.g., 18–25, 26–35), with a target of 10 to 20 participants per group to ensure life-course representation.
As this was an exploratory secondary analysis, participants were limited by the available sample size for the study. Final analyses included 209 participants (Mage = 54.56, SD = 17.49, age range = 19–84, 64.59% female; see Table 1) who completed the baseline, at least 50% of the daily SA surveys, and surveys were at least 12 hours apart. Two participants were excluded for not completing the baseline, one for not completing any daily surveys, one for careless responding, and 16 did not meet the survey minimum. The study achieved an 82.9% daily survey completion rate and 78.9% of these were completed on the scheduled day. Participants completed between 6 to 14 surveys (M = 11.6; median = 12). Most participants were female (64.59%), Caucasian (80.38%), married or in a relationship (71.77%), reported good health (41.15%), and from the top two household income brackets (44.97%). Among those who reported their postcode (n = 207), most resided in the three most populous states: NSW (61.8%), Queensland (13.0%), and Victoria (10.6%).
Participant Demographic Information (N = 209).
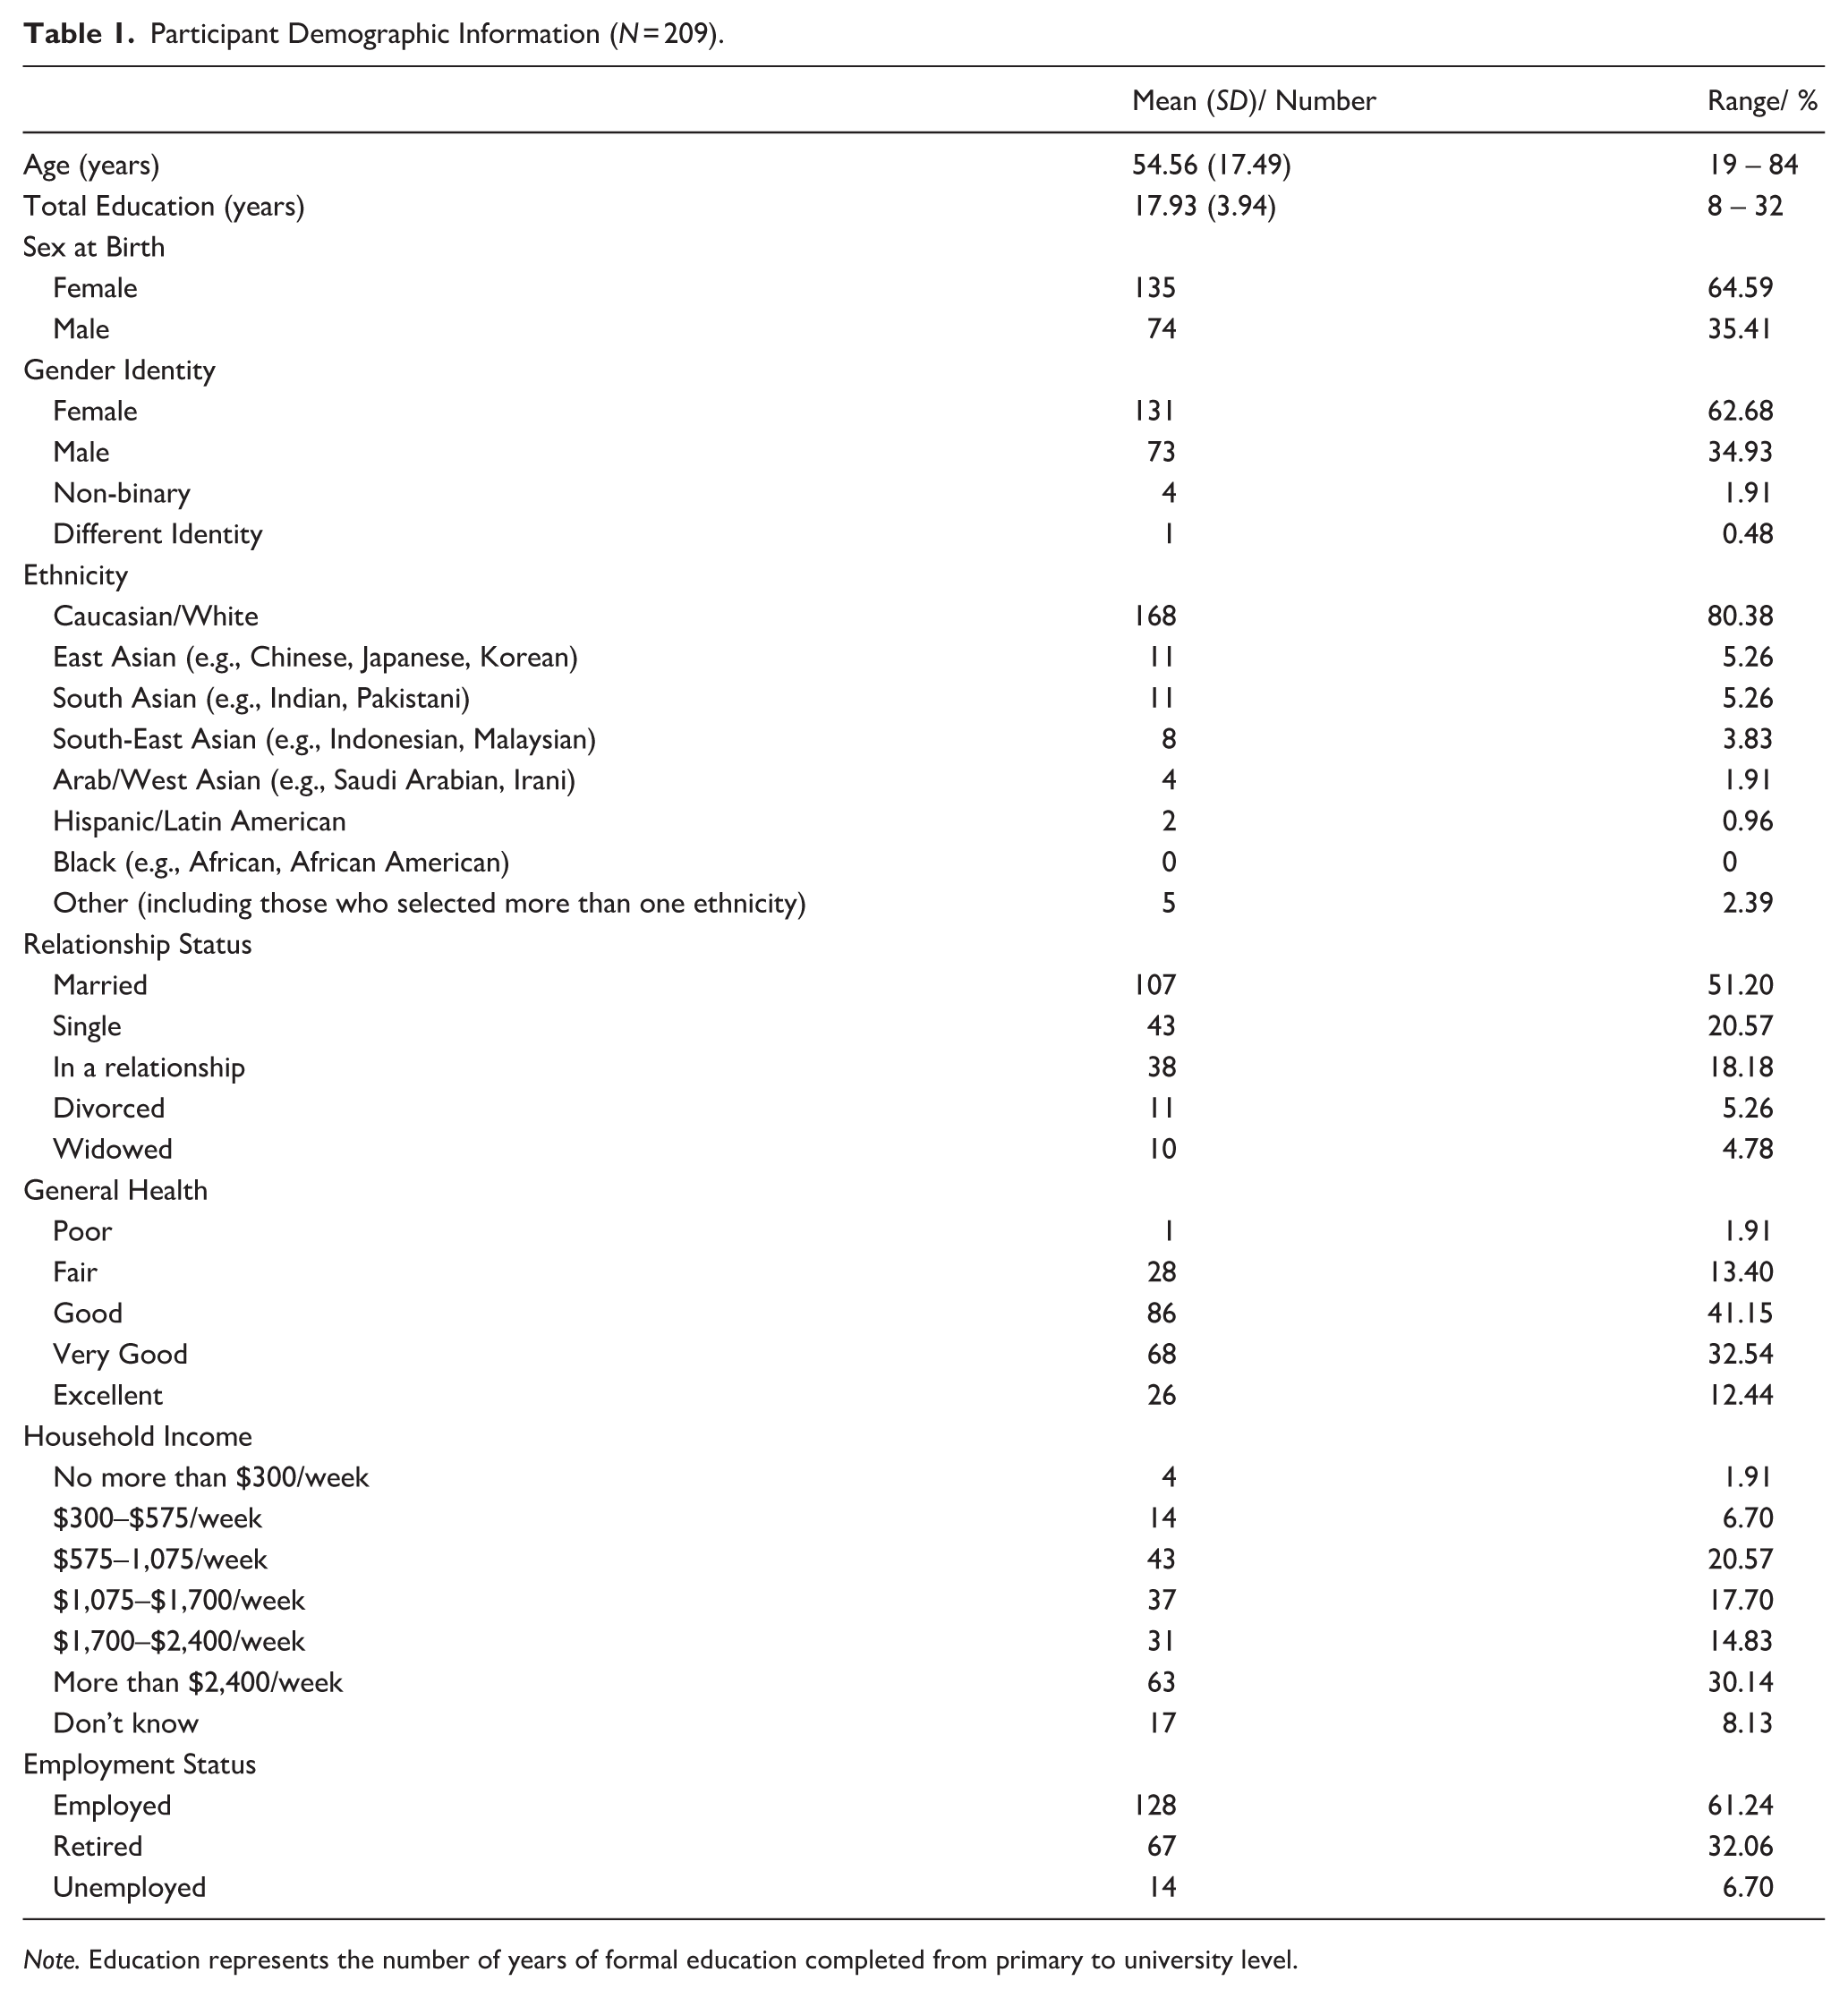
Note. Education represents the number of years of formal education completed from primary to university level.
Measures
Sociodemographic variables included chronological age (in years), sex recorded at birth (male, female, intersex), gender identity (male, female, non-binary, or self-described), ethnicity, education, household income, and employment status. Up to two ethnicities could be selected from nine options (e.g., Aboriginal/TSI, Pacific Islander) and participants could self-describe. Education was reported as total years of formal schooling (combining primary, secondary, and tertiary education). Household income followed Australian Census income brackets, and employment status was categorized as employed, unemployed, or retired.
Baseline Self-perceptions of Aging
Self-perceptions of aging (SPA) were measured using the five-item Attitudes Toward Own Aging sub-scale of the Philadelphia Geriatric Morale Scale (Lawton, 1975), where higher scores indicate more negative views. Participants rated items such as “I am as happy now as I was when I was younger” on a 1 (strongly disagree) to 4 (strongly agree) scale. Internal consistency among the items was acceptable (Cronbach’s α = .74) and item scores were averaged.
Baseline Expectations Regarding Aging
Aging expectations were assessed with the 12-item Expectations Regarding Aging scale (ERA; Sarkisian et al., 2005), which includes sub-scales on physical health, mental health, and cognitive function. Participants rated the truth of statements such as “Forgetfulness is a natural occurrence just from growing old” on a scale from 1 (definitely true) to 4 (definitely false). Higher scores indicated more positive aging expectations. Internal consistency for the full scale was good (Cronbach’s α = .87); subscales were not used in analyses and thus are not reported.
Daily Multidimensional Subjective Age
SA was measured with a modified Ages of Me measure (Kastenbaum et al., 1972). This approach was chosen over others (e.g., life domains; Kornadt et al., 2018) to understand SA in terms of various individual characteristics and for greater comparability with other studies. Participants rated six dimensions of SA: Felt (“How old do you feel today?”), Look (“How old do you think you look today, based on your physical appearance alone?”), Behave (“How old do you think you behaved today, based on your actions?”), Mental (“Based on your mental performance today, how old do you feel?”), Interest (“Based on your interests and activities today, how old do you think people would judge you to be?”), and Ideal Age (“If you could choose your age, how old would you like to be?”). Participants reported their SAs from 0 to 120 years. Outliers more than 3 SD from the mean were excluded (n = 8–42 observations; 0.33%–1.73%).
Proportional discrepancy scores were calculated for each dimension by subtracting chronological age from SA, dividing by chronological age and multiplying by 100, following recommendations for studies with an adult life-course sample (Kotter-Gruhn, Kornadt, & Stephan, 2015; Rubin & Berntsen, 2006; Wettstein et al., 2023). Negative scores represent the percentage that participants felt younger than their chronological age and 0 indicates feeling the same as their chronological age. As each SA dimension was analyzed separately, intraclass correlations (ICCs) for each item are given in the results.
Daily Affect
Daily positive and negative affect were assessed using the I-PANAS-10 (Thompson, 2007), with the wording adapted to suit daily testing. Participants were asked, “Thinking about your mood over the last 24 hours, to what extent have you felt...” followed by a list of five positive and five negative emotions including upset, hostile, alert, and inspired. Response options ranged from 1 (not at all) to 5 (extremely), with higher scores indicating greater endorsement of positive or negative affect. Multilevel reliability was calculated following methods from Scott et al. (2020) which is an extension of Cranford et al. (2006) developed for multilevel models using intensive longitudinal designs. Between-person reliability (RBP) was .997 for positive affect and .993 for negative affect. Within-person reliability (RWP) was .885 and .858, respectively.
Daily Stress
As there were no well-established, brief, multi-domain perceived stress measures sensitive to the unique COVID-19 research context, we developed a five-item daily stress scale based on domains from the Daily Inventory of Stressful Events (Almeida et al., 2002) with two additional items on global events and the COVID-19 pandemic. Participants rated daily stress related to work, finances, relationships, global events, and COVID-19 (e.g., “How stressed have you felt today about your relationships?”), using a 1 (not stressed at all) to 5 (extremely stressed) scale. A composite score was calculated by averaging the five items for each day. Higher scores indicated more daily stress and reliability was satisfactory (RBP = .993, RWP = .702).
Procedure
After eligibility screening, participants provided informed consent and completed onboarding through the study app. They completed the baseline survey on day 1 and two 7-day bursts of daily subjective aging surveys (days 8–14 and 36–42).
Statistical Analysis
Analyses were conducted in R (v4.4.1; R Core Team, 2024). Primary analyses used the lme4 package (v1.1.35.5; Bates et al., 2015) for multilevel modeling with sjPlot (v2.8.16 Lüdecke, 2024) to format model output, and car (v3.1.3; Fox & Weisberg, 2019) to assess multicollinearity. Data processing and visualization used tidyverse (v2.0.0; Wickham et al., 2019), with additional packages including psych, jtools, Rmisc, and ltm for supplementary analyses and formatting.
Multilevel models were used to examine time-varying associations, allowing inclusion of participants with incomplete data. Unconditional models first partitioned between- and within-subjects variance for each SA dimension using ICCs. ICCs indicate the proportion of observed between-person variance though it cannot separate true variance from potential measurement error at either level. As no significant variability was found between the two assessment bursts, data were pooled to retain a 2-level structure and increase power (see Supplemental Appendix B).
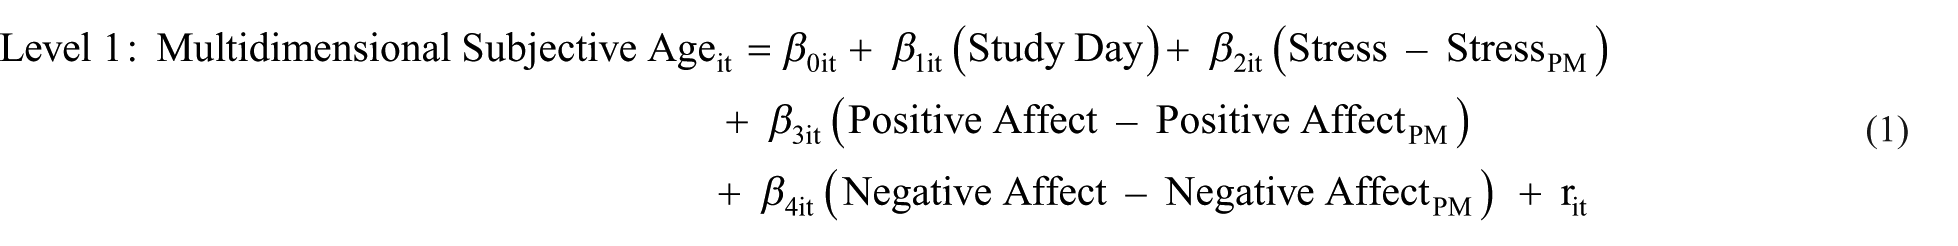
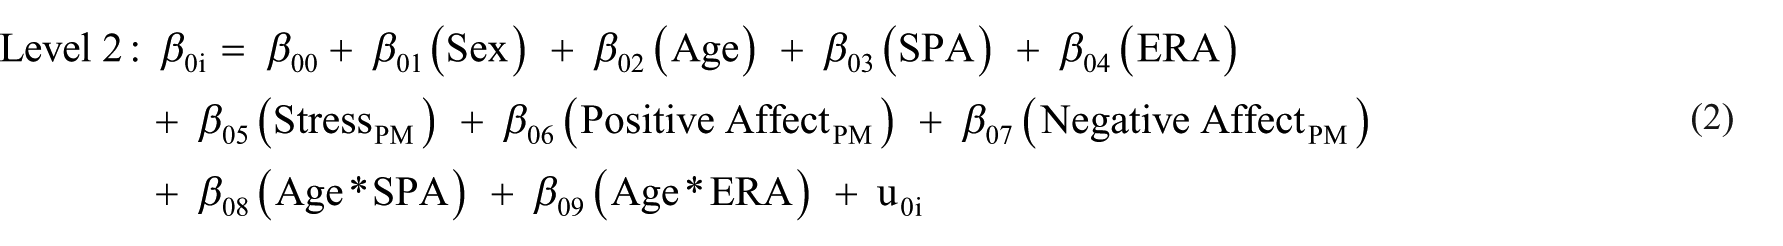
For each SA dimension, fixed-effect predictors included SPA, ERA, daily stress, positive affect, and negative affect (Equation 1). Daily predictors were person-mean centered, and corresponding person-means were entered at level 2 to disaggregate within- and between-person effects relative to each participant’s mean (Equation 2). Within-person effects tested whether fluctuations in daily stress and affect were associated with SA, while between-person effects tested whether adults with higher average stress or affect differed in their SA. Interaction terms were included to test whether age moderated associations with views of aging. Controls included age, sex at birth, and study day. Simple slopes and the Johnson-Neyman analyses were run for significant interactions. Random effects were included where there was significant variability for the intercept, study day, and daily variables to model different effects to across participants.


As multilevel models assume independence between predictors, multicollinearity between predictors were assessed using variance inflation factors (VIFs), which estimate how much the variance of each predictor’s coefficient is inflated due to correlations with other predictors. VIF was calculated using the formula:

where Rp2 is the portion of variance from regressing predictor p on the other predictors. Values start from 1, indicating no collinearity, with higher values reflecting increasing multicollinearity. Although there is no clear consensus on cutoffs, studies commonly use a limit between 5 and 10 which allows for 89%–95% of variability to be accounted for by other predictors (Thompson et al., 2017). We acknowledge the arbitrary nature of thresholds but adopted a more conservative VIF threshold of 2.5 (corresponding to around 78% shared variance) for non-interaction related terms.
Results
Descriptive Statistics and Within-Person Fluctuations
Table 2 shows descriptive statistics and within- and between-person correlations above and below the diagonal. ICCs of daily variables are given on the diagonals in bold. Between-person Pearson’s correlations ranged from r = -.48 (Interest Age and Positive Affect) to .89 (Behave and Interest Age). Older ages correlated with younger proportional SAs, more positive mood, and less negative mood and stress. Despite significant correlations, all non-interaction VIFs were less than 1.997, suggesting low risk of multicollinearity (less than 71% shared variance).
Descriptives and Correlations of Study Variables (N = 209).
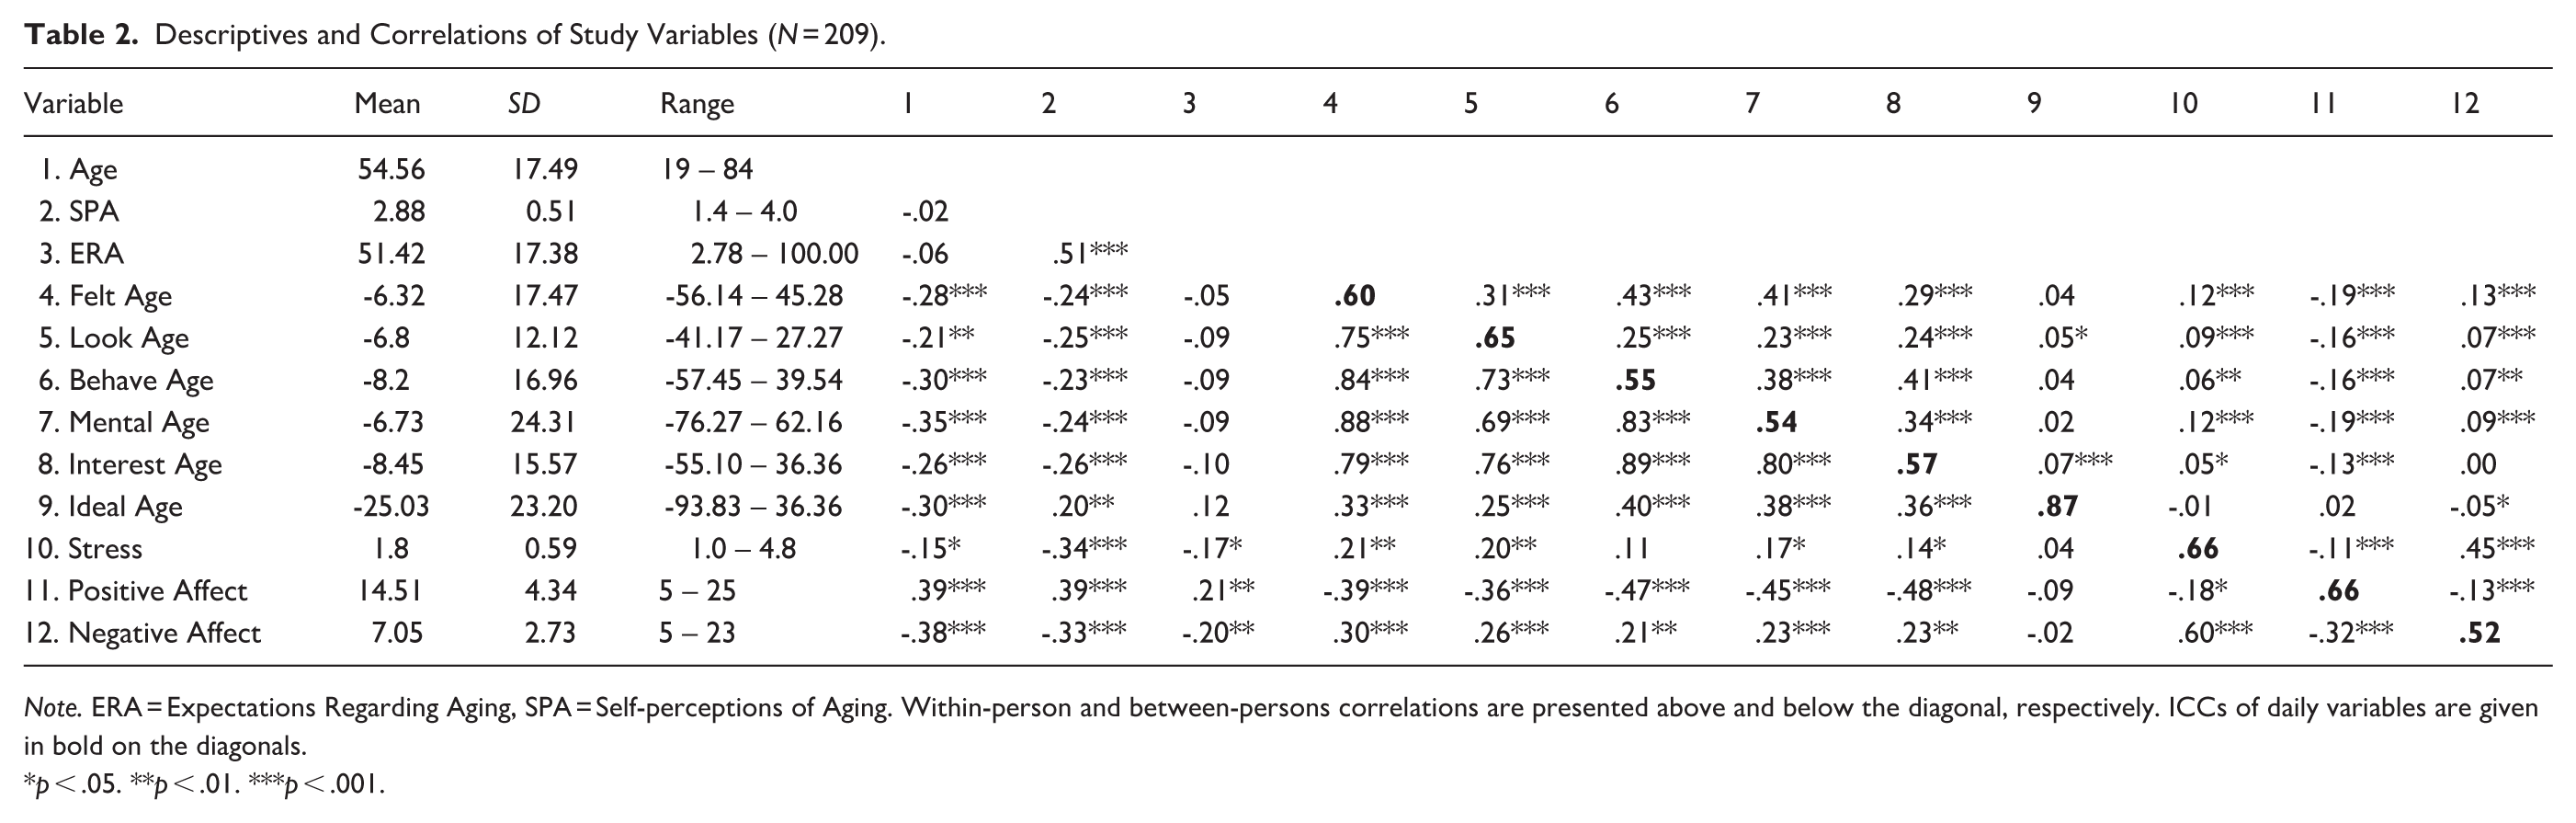
Note. ERA = Expectations Regarding Aging, SPA = Self-perceptions of Aging. Within-person and between-persons correlations are presented above and below the diagonal, respectively. ICCs of daily variables are given in bold on the diagonals.
p < .05. **p < .01. ***p < .001.
Each SA dimension varied over the 14 days, though younger adults and some dimensions fluctuated more than others (see Supplemental Appendix C). Ideal Age had the youngest SA overall and had the largest range of responses, from -35.6% to -0.3%, whereas the other dimensions ranged from -15.1% (Behave Age) to 8.0% (Mental Age), as seen in Supplementary Figure 1. ICCs from unconditional models show 87% between-person variance for Ideal Age and 54%–65% for the other dimensions (Supplementary Table 1). Likelihood tests demonstrated that models with predictors were a better fit than unconditional models (χ2 = 74.56 to 360.18, p < .001). Overall, models explained 64.3% to 71.9% of total variance (conditional R2) with the fixed effects contributing 13.1% to 65.4% (marginal R2; Table 3).
Coefficients and SE for Six Aspects of Subjective Age (N = 209).
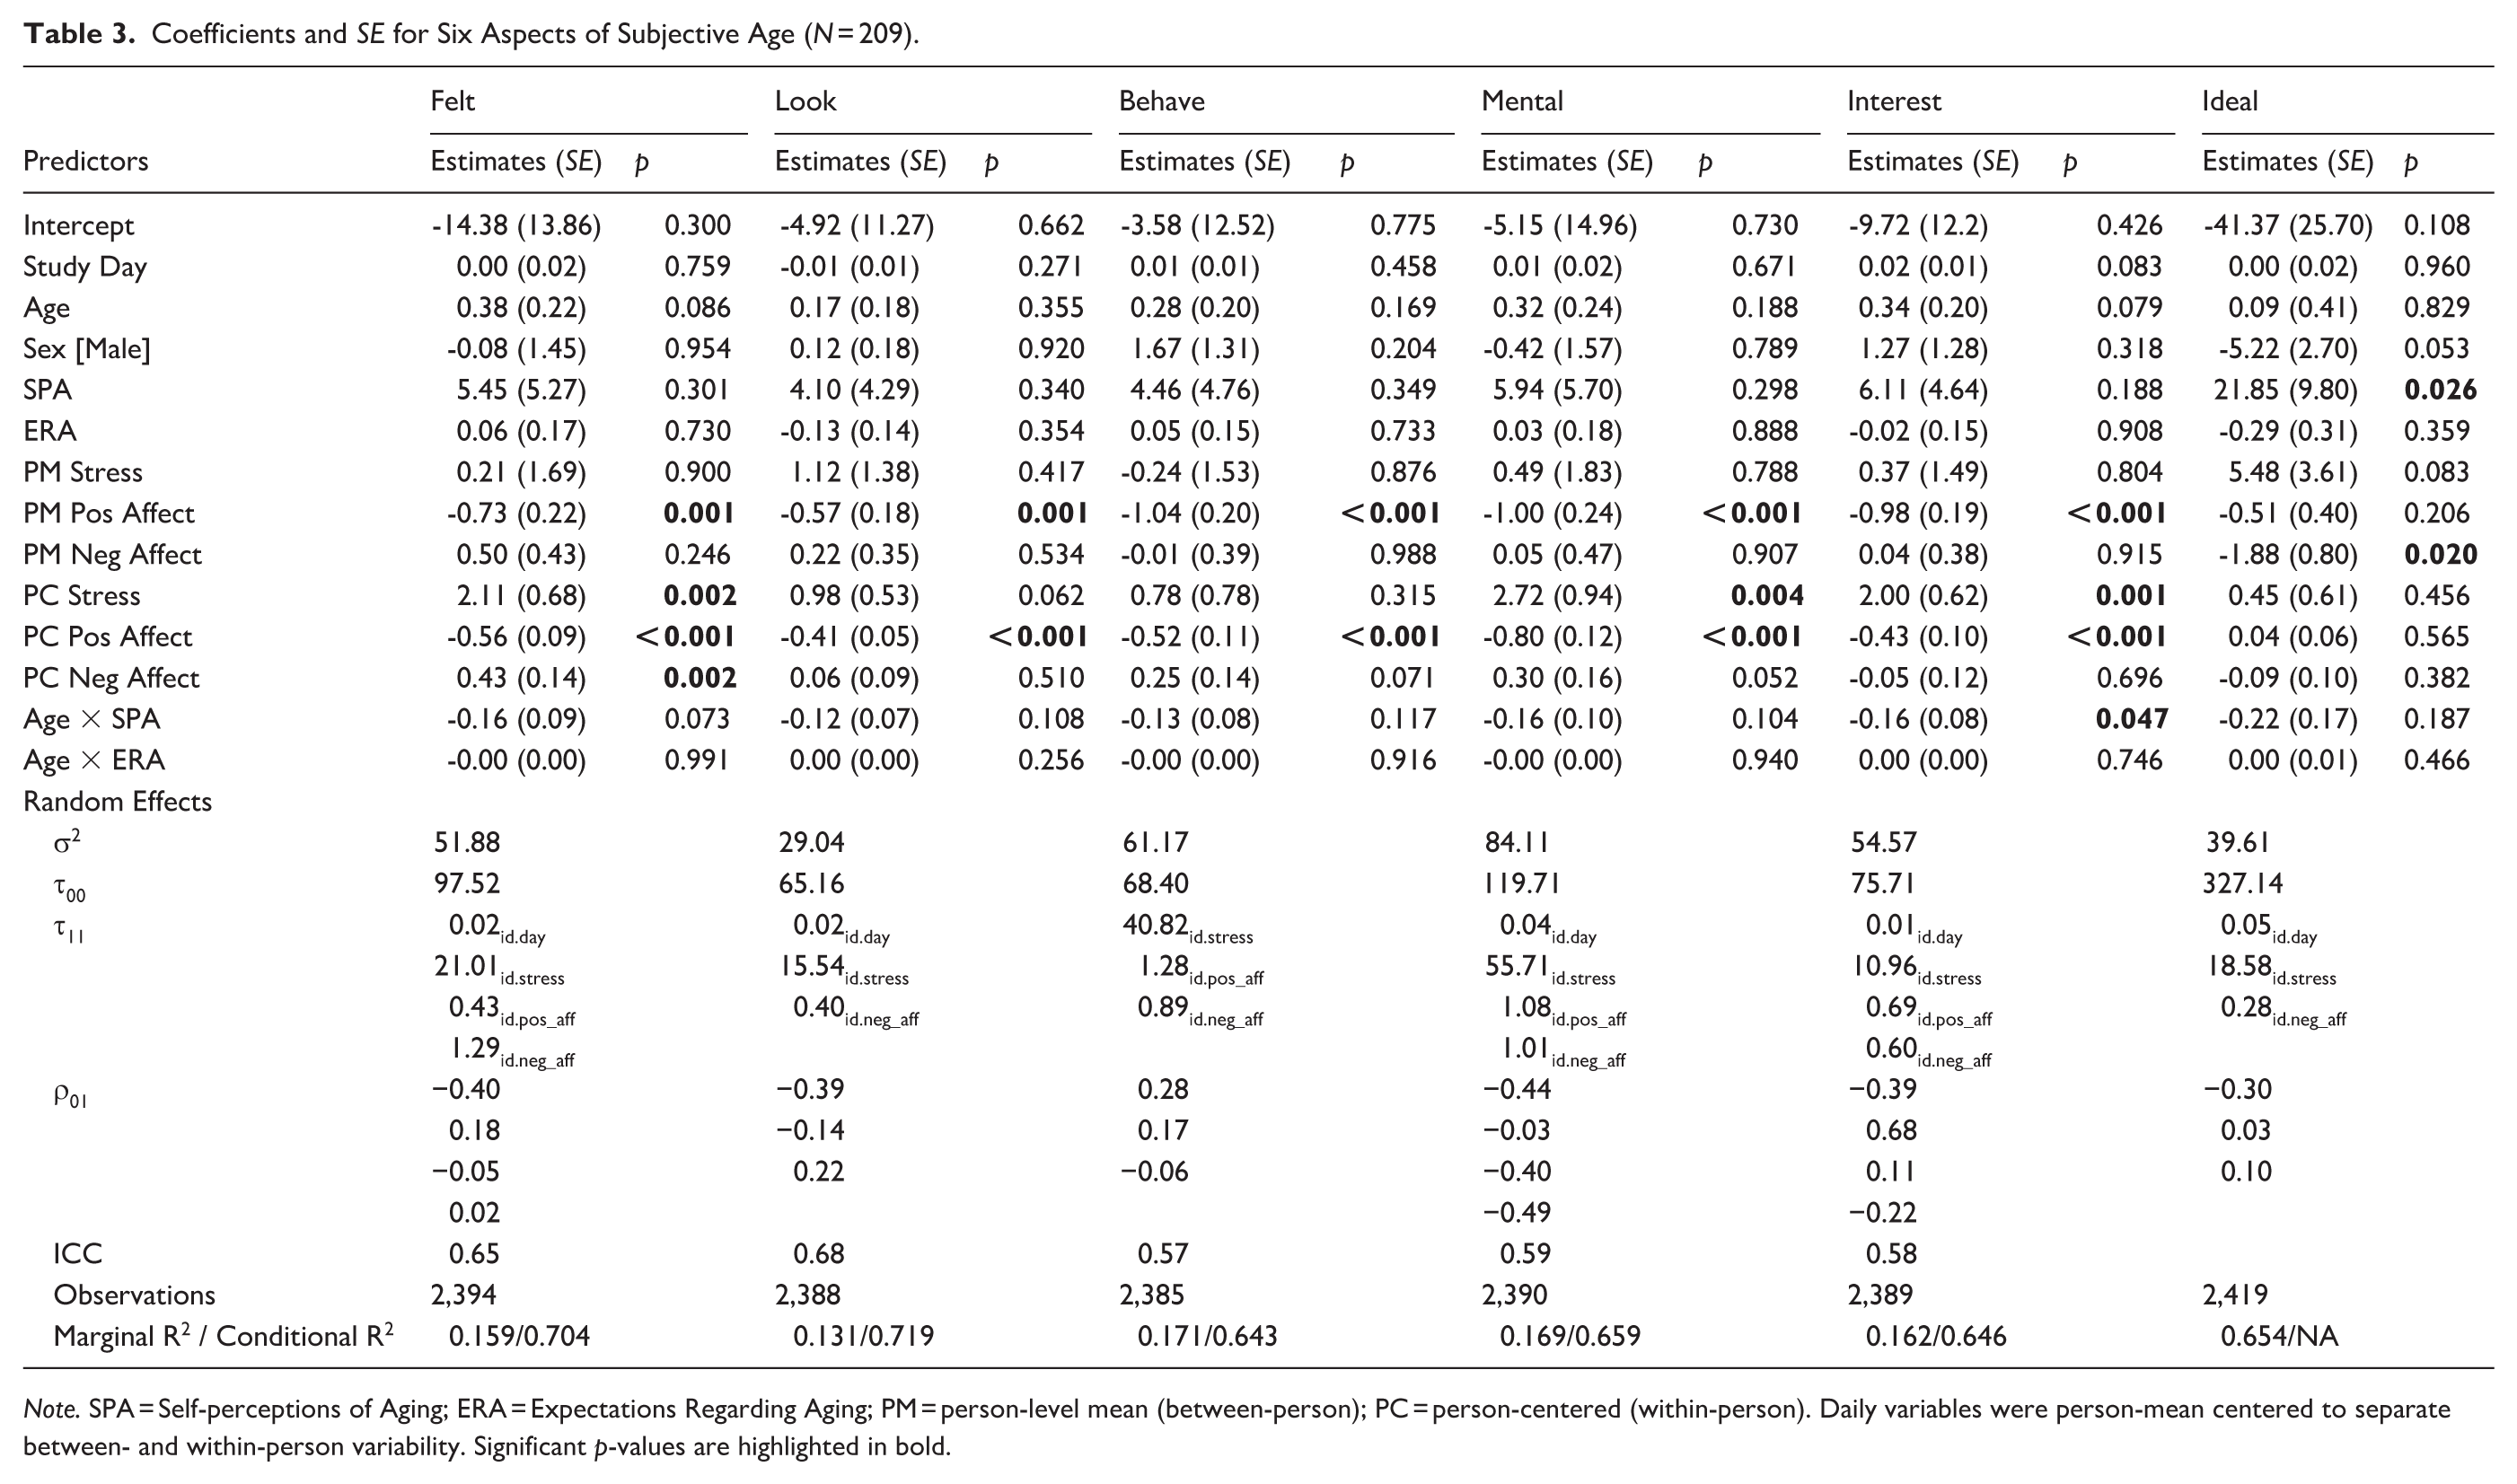
Note. SPA = Self-perceptions of Aging; ERA = Expectations Regarding Aging; PM = person-level mean (between-person); PC = person-centered (within-person). Daily variables were person-mean centered to separate between- and within-person variability. Significant p-values are highlighted in bold.
Subjective Age Predictors
Examining between-person variables, for all SA dimensions except Ideal Age, participants higher in positive affect reported younger SAs than those with lower positive affect and people with more negative affect reported older Ideal Age (Table 3). With every additional unit of negative SPA, participants had a 21.85% increase in Ideal Age indicating they reported relatively older Ideal Ages (p = .026). Interestingly, chronological age moderated the association between SPA and Interest Age. The Johnson-Neyman interval indicates the association between SPA and Interest Age was only statistically significant for adults over 57.07 years (Supplemental Appendix C; Supplementary Figure 3). Simple slopes were non-significant 1 SD below mean age (38.54 years, b = -0.00, SE = 1.99, p > .999) and the mean age (55.71 years; b = -2.73, SE = 1.49, p = .07). However, the slope was significant at 1 SD above mean age (72.88 years, b = -5.45, SE = 2.06, p = .01). Therefore, the relationship between more negative SPA predicting younger Interest Age was stronger among older than younger adults, only becoming significant later in adulthood (Figure 1).
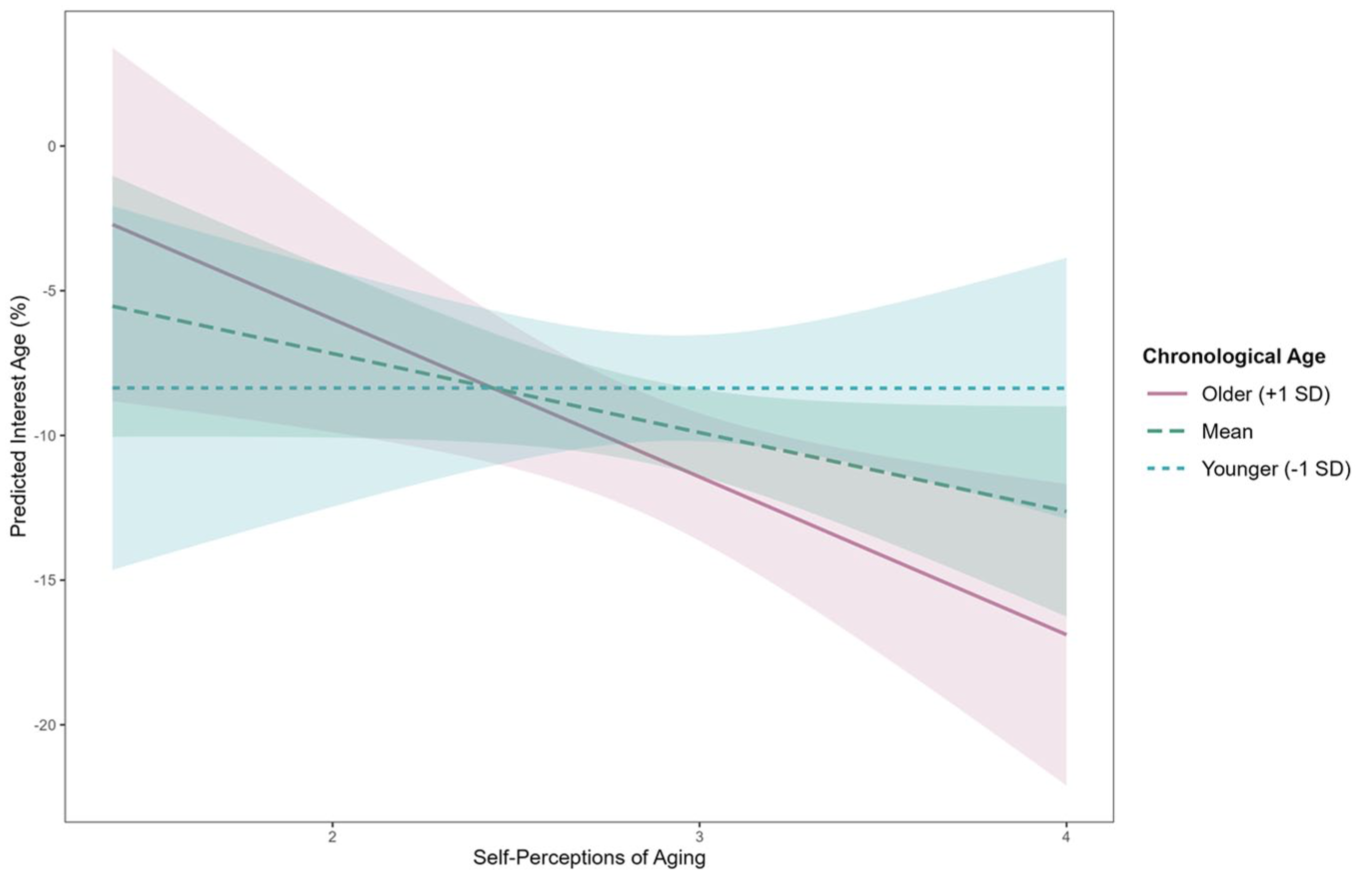
Age Moderating the Effect of Self-Perceptions of Aging on Proportional Interest Age (N = 209). Higher self-perceptions of aging indicates more negative perceptions. Shaded bands give 95% CI for slopes.
Regarding within-person effects, participants reported a younger SA on days when they experienced more positive affect than average in all SA dimensions except Ideal Age. Higher daily negative affect predicted older Felt Age. Daily stress was significant for Felt, Mental, and Interest Ages. With each additional unit of stress more than their personal average, participants reported feeling between 2% and 3% older.
Discussion
This study examined how stable and daily factors predict Felt, Look, Behave, Mental, Interest, and Ideal Ages among Australian adults aged 19 to 84 years. By assessing SPA, ERA, affect, and perceived stress, we aimed to clarify whether these predictors of Felt Age would generalize to other dimensions. Consistent with the view that SA is a dynamic and multifaceted construct (Barrett & Montepare, 2015; Diehl et al., 2014; Kotter-Gruhn, Kornadt, & Stephan, 2015), significant predictors in the study were mainly proximal daily experiences rather than stable beliefs and traits, though the magnitude and consistency of relationships varied across dimensions. Chronological age also moderated the effect of SPA on Interest Age, suggesting that personal age-related beliefs may have a greater impact on SA among middle-aged and older adults.
The significant within-person effects of less daily stress, more positive affect, and less negative affect predicting younger SAs partially extend prior findings on Felt and Look Age to other dimensions (Bellingtier et al., 2015; Klaiber & Pauly, 2025; Lee & Neupert, 2024). Within-person associations between positive affect and SA fluctuations were significant in five dimensions, whereas negative affect and stress predicting older SA were only significant for Felt, Mental, and Interest Ages in the current dataset. In other words, we found that same-day positive affect was a more consistent predictor of multidimensional SAs compared to same-day negative affect and stress. These findings support the idea that daily contexts shaping stress and emotional states may also influence SA fluctuations in a dimension-specific manner (Hughes & Touron, 2021).
On the other hand, results indicated few between-person predictors of SA. People with higher average positive affect reported younger Felt, Look, Behave, Mental, and Interest Ages, and more negative affect was associated with younger Ideal Age. However, we did not find any other significant associations with negative affect, and stress was not associated with any SA dimension. This partially contrasts with other studies that generally find stress and negative affect are associated with older Felt and composite SA (Agrigoroaei et al., 2017; Bellingtier & Neupert, 2019; Goecke & Kunze, 2020). Taken with the previous significant within-person associations, it seems that daily fluctuations have a greater influence on SA ratings than stable trait-like affect and perceived stress.
Although SA dimensions, SPA, and aging expectations all fall under the broader theoretical construct of views on aging (Wurm et al., 2017), the current study found few significant associations. Interestingly, people with more negative SPA reported older Ideal Age, suggesting that Ideal Age may be associated with broader internal age-related representations (Ward, 2010). Chronological age also moderated the effect of SPA on Interest Age, suggesting that negative self-perceptions had a stronger effect among middle-aged and older adults compared to younger adults. This small but significant interaction aligns with theories suggesting that stereotypes and self-perceptions evolve and are internalized over the lifespan to become increasingly more salient (Diehl et al., 2014; Levy, 2009; Wurm et al., 2017). The relationships between multidimensional SAs and views of aging constructs across the lifespan warrants further empirical attention.
Our results partially support Wurm et al.’s (2017) framework that proposes age stereotypes and SPA inform SA over the lifespan. However, the lack of significant findings may be due to our study being underpowered to detect smaller effects. A potential alternative explanation is the influence of the COVID-19 context. Wettstein and Wahl (2021) found a sharp increase in negative SPA between 2017 and 2020, a change five times steeper than previous waves, whereas the change in Felt Age remained relatively stable over the same period. The pandemic may have disproportionately impacted SPA more than Felt Age and potentially other SA dimensions. If our participants reported similar changes due to pandemic-related stressors, this may have altered typical associations, potentially acting as a contextual confound. While we only measured SPA and ERA at one time point, limiting us to treating them as between-person factors in analyses, it may be valuable for future research to examine if these perceptions fluctuate over shorter timescales and whether their relationship with SA varies across different contexts.
Ideal Age May be a Distinct Aspect of Subjective Age
The substantial within-person variance, indicated by the ICCs, particularly for Felt, Look, Behave, Mental, and Interest Ages, reinforced the dynamic nature of SA. This is consistent with prior research demonstrating within-person fluctuations between days and hours in the day for Felt and Look Ages (Bodner et al., 2021; Kornadt et al., 2022; Kotter-Gruhn, Kornadt, & Stephan, 2015; Lee & Neupert, 2024). Across dimensions, bivariate correlations suggested there was more shared variance among Felt, Look, Behave, Mental, and Interest Ages than with Ideal Age. All between-person correlations of SA were positive and significant, with strong associations between Felt, Look, Behave, Mental, and Interest Ages. Within-person correlations were more modest but remained significant, whereas correlations with Ideal Age were weak and mostly non-significant. These findings suggest that Ideal Age is relatively distinct from other SA dimensions, whereas the remaining dimensions may share substantial overlap at both the between- and within-person levels. Although all SA dimensions were significantly correlated, the higher between-person variance observed for Ideal Age suggests greater within-person stability for this dimension than the others. Based on the patterns of within-person variability, Ideal Age may be a distinct dimension. Previous factor analyses found that all SAs loaded well onto one factor but Ideal Age had the lowest loading and may be targeting a different aspect of our identity (Teuscher, 2009). Unlike Felt Age that is a perception based on one’s immediate context, Ideal Age may rely on broader comparisons with internal age-related beliefs and developmental models (Ward, 2010).
Strengths and Limitations
This study had several strengths and limitations. In terms of data collection, despite an 8 week duration spanning from baseline to the conclusion of the second SA burst, and the absence of financial incentives beyond travel reimbursement for the sub-sample who attended an in-person onboarding, the study achieved a commendable 82.9% completion rate. Furthermore, during the two critical 7-day SA burst periods, administered four weeks apart, 78.9% of surveys were completed on the scheduled day. This level of compliance compares favorably to the average of 79% reported in a meta-analysis of ecological momentary assessment studies (Wrzus & Neubauer, 2023), particularly considering that most studies in that meta-analysis offered incentives.
However, these results must be interpreted with caution as this was an exploratory secondary analysis. Though we used all available data, it may be underpowered to detect small but meaningful effects and multiple comparisons may inflate the risk of type 1 errors. A Bonferroni adjustment was not applied since it increases the risk of Type 2 errors and obscures potentially meaningful results. Future confirmatory studies with larger samples are needed to verify these preliminary associations and determine whether smaller significant effects exist.
There were also limitations in the larger study’s design and data collection. COVID-19 may have been a contextual confound that influenced participants’ ratings of SA and views of aging, as suggested by Wettstein and Wahl (2021). In addition, the 8 week duration of the study and convenience sampling may limit the generalizability of the findings to broader populations and longer timeframes. Conversely, the online delivery method enhanced accessibility for underrepresented groups, such as individuals living in remote areas or those with mobility limitations. While the aim was to capture an adult life-course sample, individuals over 85 years of age were not represented in the final sample. Moreover, the study application’s compatibility solely with iOS devices may have introduced a sampling bias. Finally, our current analyses treated SPA and ERA as unidimensional constructs. The unidimensional SPA measure was chosen to reduce participant burden in the larger study and although ERA had three subscales, they were not examined individually in analyses due to the study’s sample size. Future research could benefit from examining SA in samples unaffected by COVID-19 restrictions, independent of participants’ smartphone operating systems, and explore relationships with multidimensional SPA and ERA such as using the Awareness of Age-Related Change scale.
Future Directions
The current study relies on daily diary surveys, which may reflect participants’ retrospection over the entire day rather than their momentary SA (Hughes & Touron, 2021). It is plausible that affect and stress have a more pronounced impact on SA when assessed “in-the-moment” compared to after a delay. Furthermore, the relationships between SA dimensions and the predictors in this study may be bi-directional. For example, among middle-aged and older adults, there were significant bi-directional relationships between prior day multidimensional SAs predicting next-day positive uplifts and vice versa (Kornadt et al., 2025). Future studies should consider employing shorter assessment intervals (e.g., hourly) to capture short-term dynamics and investigate bi-directional effects by examining whether SAs predict future experiences and psychological states.
In addition, the current paper only examined age moderations for the stable predictors SPA and ERA. However, daily variables such as affect and stress may also be moderated by age. The socioemotional selectivity theory (Carstensen, 1992) proposes that due to a shift in their perception of the time they have left, older adults prioritize emotionally meaningful, positive experiences whereas younger adults tend to pursue new knowledge and experiences. Therefore, future studies may examine whether associations between daily affect and multidimensional SAs are moderated by age.
Finally, the I-PANAS-10 was selected as a brief measure of affect to minimize participant burden within the larger study. However, as noted by Harmon-Jones et al. (2016), this measure primarily measures high-arousal emotions. Future research might explore the potential influence of low-arousal affective states on SA across adulthood.
Conclusion
Overall, our study offers preliminary evidence that there may be different associations between stable and daily predictors and each SA dimension. Potential differences in relationships in within-person stress, positive and negative affect support the need for a multidimensional approach. Examining dimensions separately may provide a more complete understanding of subjective aging processes than using a single-item “Felt Age” question (Pinquart & Wahl, 2021) or composite scores that assume SA dimensions behave similarly. Although effects were small, chronological age may also moderate SPA on Interest Age suggesting that these self-perceptions may become increasingly salient and relevant as we age (Diehl et al., 2014).
Supplemental Material
sj-pdf-1-jbd-10.1177_01650254251413126 – Supplemental material for Predicting daily fluctuations in multidimensional subjective age among adults aged 19 to 84 years
Supplemental material, sj-pdf-1-jbd-10.1177_01650254251413126 for Predicting daily fluctuations in multidimensional subjective age among adults aged 19 to 84 years by Shally Zhou, Brooke Brady, Lidan Zheng, Shevaun D. Neupert and Kaarin J. Anstey in International Journal of Behavioral Development
Footnotes
Acknowledgements
The authors thank all the volunteers for participating in and contributing to this project.
Author Contributions
Ethical Considerations
The UNSW Human Research Ethics Committee approved the Labs without Walls study on December 18, 2020 (HC200792).
Consent to Participate
All participants gave written informed consent prior to their study onboarding. As part of the consent process, participants chose whether their de-identified data could be shared beyond the immediate research team provided there was approval from a relevant human research ethics committee and the Labs without Walls research team.
Funding
The authors disclosed receipt of the following financial support for the research, authorship, and/or publication of this article: The Labs without Walls project was funded by UNSW Ageing Futures Institute. KJA, BB and LZ are supported by the Australian Research Council Laureate Fellowship (FL190100011). SZ is supported by the Australian Government Research Training Program scholarship, ARC Centre of Excellence in Population Ageing (CE170100005) and Neuroscience Research Australia.
Declaration of Conflicting Interests
The authors declared the following potential conflicts of interest with respect to the research, authorship, and/or publication of this article: While Apple Inc. provided Apple Watch devices for the research through their Investigator Support Program, Apple was not involved in the design of the research, nor in the collection, analysis, or interpretation of the research data.
Data Availability Statement
Data came from Labs without Walls, an app-based study investigating short-term fluctuations in SA and gender expression over 8 weeks (see Brady et al., 2023 for protocol). The study design and materials were pre-registered through Open Science Framework (OSF; ![]() ). This study’s hypotheses and detailed analysis plans were not pre-registered, but the analytic code is available on OSF. Other variables in the dataset will be the subject of future publications. Data cannot be uploaded to a repository as participants consented to sharing deidentified data outside the immediate research team only with approval from a human research ethics committee and the immediate research team. However, authors can be contacted with any questions related to the data.
). This study’s hypotheses and detailed analysis plans were not pre-registered, but the analytic code is available on OSF. Other variables in the dataset will be the subject of future publications. Data cannot be uploaded to a repository as participants consented to sharing deidentified data outside the immediate research team only with approval from a human research ethics committee and the immediate research team. However, authors can be contacted with any questions related to the data.
Supplemental Material
Supplemental material for this article is available online.
References
Supplementary Material
Please find the following supplemental material available below.
For Open Access articles published under a Creative Commons License, all supplemental material carries the same license as the article it is associated with.
For non-Open Access articles published, all supplemental material carries a non-exclusive license, and permission requests for re-use of supplemental material or any part of supplemental material shall be sent directly to the copyright owner as specified in the copyright notice associated with the article.