
Abstract
This study compared equal age groups from two cohorts from the Midlife in the United States (MIDUS) study surveyed at different times to characterize societal changes in measures of subjective age and age threshold. Two successive MIDUS cohorts were utilized (1995–1996 and 2011–2014; age range 25–74). Outcomes included subjective age (felt age and desired age) and age threshold. Following multiple imputations of missing data and balancing methods, weighted linear regression measured associations between subjective age outcomes and cohort, sex, and chronological age. Individuals of the later MIDUS cohort reported older felt age and younger desired age in middle age groups (35–64 years old). An increase in age threshold was observed only in older age groups (65+). Possible underlying historical changes in health and societal age stereotypes are explored to explain the observed trend toward older felt age and age threshold, but a younger desired age.
Introduction
In recent years, a growing body of evidence has suggested that positive views on aging, at both the societal and individual level, contribute to healthier aging and longer lives (for recent reviews and meta-analyses see, for example, Chang et al., 2020; Debreczeni & Bailey, 2021; Westerhof et al., 2023). Conversely, other studies have shown that views on aging change in individuals longitudinally over time as a consequence of health-related problems (e.g., Diehl et al., 2021; Prasad et al., 2023). Comparatively little is known about whether or not a collective shift in views on aging has occurred over historical time, and if so, whether this shift is equally observable in different age groups. The present study therefore aims to compare different views on aging and how they change over time in age groups between 25-74 years, by equally considering changes in two measures of subjective age (felt age, desired age) and a measure of age threshold (i.e., the age at which middle age is considered to end).
Understanding how views on aging change, both throughout the life span and across the course of history, is important against the background of the currently ongoing Decade on Healthy Aging, declared by the World Health Organization and the United Nations. One of the key objectives of this initiative is to reduce ageism, which is mainly reflected in views on aging. In order to better understand if and how views on aging have already changed in the United States during a period of about 20 years, the current study compares two cohorts of individuals from the Midlife in the United States (MIDUS) study (Brim et al., 2020; Ryff et al., 2017) which was sampled during two different historical time frames (1995–6 and 2011–2014).
Subjective Age and Age Threshold Reflect Different Facets of Views on Aging
Subjective age refers to how young or old one feels relative to one’s chronological age (Kotter-Grühn et al., 2009) and is considered a meaningful construct across the lifespan and different cultures (Barak, 2009; Montepare & Lachman, 1989). Adopting a younger subjective age has been associated with better physical, functional and mental health outcomes, similar to self-perceptions of aging (for meta-analyses, see Debreczeni & Bailey, 2021; Westerhof et al., 2023).
Montepare (2009) has developed a subjective age framework in order to better understand when and why individuals feel younger or older than their actual age throughout the lifespan. She posits that age markers, triggered by historical events (e.g., birthdays), physical events (e.g., a heart attack), normative events (e.g., reaching retirement age) or social events (e.g., social interactions), may explain changes and variations in subjective age. The higher importance of social reference points might explain why subjective age is only moderately associated with self-perceptions of aging, which are more strongly anchored in personal experiences of aging (Spuling et al., 2020).
Subjective age is most commonly measured by asking the question, “How old do you feel?” (referred to as felt age). Several studies (Hubley & Russell, 2009; Keyes & Westerhof, 2012; Kinjo et al., 2024) have pointed to the unique impact of additional subjective age measures such as desired age (i.e., how old one would like to be), also known as age identity (Diehl et al., 2014). For example, the study of Keyes and Westerhof (2012) showed different associations of felt age and desired age with well-being and mental health. Moreover, prior research suggests that many older adults would like to be considerably younger than they feel (for a review see Barak, 2009). Whereas felt age is more related to the personal context (i.e., psychological states and physical sensations), desired age more strongly relates to the social context (i.e., social experiences and identification with social groups; Diehl et al., 2014).
Both adopting a younger felt age and a younger desired age in adulthood may serve as a protective strategy to maintain a positive self-concept and thus as a useful coping mechanism to combat the threat of ageism. This distancing from negative age stereotypes is a well-known phenomenon which is referred to as age-group dissociation (Weiss & Kornadt, 2018).
Age-group dissociation also seems to play a role when individuals are asked about the age at which middle-age is considered to end, or old age is considered to begin (age threshold). Older adults usually assign a higher age threshold compared to younger individuals despite the existence of a major reference point shared by all age groups, the statutory retirement age. In sum, subjective age (felt age, desired age) and age threshold are distinct constructs that may reflect how individuals deal with age stereotypes and ageism. However, it is important to note that subjective age and age threshold could also measure the extent to which a person has internalized ageism and ableism (Gendron et al., 2018, 2024). The background for this alternative interpretation lies in the cue “old” that is used in the wording of all three indicators. For instance, the question “how old do you feel” could be interpreted by the respondents as “how sick, tired, disabled (…) do you feel” and may thus equate old age with decline and disability (Gendron et al., 2018).
Subjective Age and Age Threshold Change Across the Life Span
The literature on subjective age concurs that starting from young adulthood most adults report feeling younger than their actual age (Pinquart & Wahl, 2021). Some studies suggest that on average the difference in felt age and chronological age continues to grow with old age (Montepare & Lachman, 1989). Because older individuals can subjectively feel much younger than younger persons (e.g., an 80-year-old can feel 30 years younger, which is unlikely for a 40-year-old), the proportional discrepancy score has been established as a common adjustment (Kotter-Grühn et al., 2016).
Most cross-sectional studies assume a linear relationship between subjective and chronological age (e.g., Montepare & Lachman, 1989; Pinquart & Wahl, 2021), yet the association also can be non-linear with noticeable changes occurring when one transitions from identifying with one perceived age group to another (Galambos et al., 2005). A recent meta-analysis of primarily cross-sectional studies also found that while a linear association best defines the relationship between absolute subjective age scores, a nonlinear quadratic curve better models proportional discrepancy scores (Pinquart & Wahl, 2021). For example, several studies suggest that the proportional subjective age discrepancy actually remains relatively stable or plateaus after middle age (Pinquart & Wahl, 2021). Also, the tendency to report an older age threshold may attenuate in the oldest age groups (e.g., Kornadt & Rothermund, 2011). Such documented age-specific patterns in views on aging underline the importance of considering non-linear relationships between chronological and subjective age or age threshold when measuring cohort changes in views on aging.
Theoretical Underpinnings of Historical Changes in Subjective Age and Age Threshold
Although a better understanding of the trajectory of subjective age and age threshold across the lifespan is emerging, still little is known about changes in these measures across historical time. It is necessary to examine subjective age and age threshold across different birth cohorts since views of aging are closely connected to and shaped by societal factors that can change from one generation to the next. The Historical Changes in Developmental Contexts (HIDECO) theoretical framework proposed by Drewelies et al. (2019) is useful for hypothesizing how historical changes could affect views on aging. HIDECO assumes that historical change comprises gradual processes involving interactions between many life domains (e.g., changes in health can trigger changes in psychosocial factors). The framework considers four areas of historical change that influence human development: individual resources (including education, health, cognitive and psychosocial function); social embedding; technological advancements; and Zeitgeist and norms (Drewelies et al., 2019).
Two primary pathways from the HIDECO model were applied to this study: 1. Changes in health, health behaviors and lifestyle and 2. Societal definitions of attitudes, social roles and age norms (Drewelies et al., 2019). HIDECO purports that differences in health, health behaviors and lifestyle are important for understanding historical changes in a variety of psychosocial outcomes due to their interactions with morbidity and functional limitations (Drewelies et al., 2019). Therefore, an increase in felt age and a reduction in desired age was hypothesized between the successive cohorts based on a decline in several health indicators of the U.S. population. For example, although some evidence suggests that treatment advances have led to delayed disability despite a rising prevalence of chronic diseases (Crimmins et al., 2021), the U.S. is the only developed country demonstrating a plateau in healthy life years since 2000 (WHO, 2021), indicating continued functional limitations in at least some sectors of the population that might make one feel older yet wish to be younger (i.e., increase felt age and reduce desired age). Additionally, obesity has increased not only among adults over age 65 (Federal Interagency Forum on Aging-Related Statistics, 2020) but also among adults aged 20–44 in the last decade (Aggarwal et al., 2023). In addition to increasing the risk for co-morbid conditions, an earlier onset of obesity could increase felt age by changing personal decision-making related to health behaviors and lifestyle (e.g., choosing to exercise less).
A second pathway from the HIDECO model, namely societal age norms, was applied to understand how historical changes could affect age threshold. Similar to most developed countries, the U.S. has experienced a steep increase in the proportion of older adults in the last decade (Caplan, 2023). Evidence suggests that societies experiencing rapid population aging have more negative self-perceptions of aging (Wolff et al., 2018) and persons living in such societies have more negative age stereotypes (North & Fiske, 2015). Indeed, a linear rise in negative age stereotypes in the U.S. has been documented in studies of language use (Ng et al., 2015). Together, these changes may foreshadow a higher age threshold in later-born cohorts as individuals attempt to disassociate themselves with old age groups.
Empirical Evidence for Historical Changes in Subjective Age and Age Threshold
A few empirical studies examined changes in views on aging between different birth cohorts. A recent study analyzed historical changes in subjective age and other views on aging over 20 years by comparing two older cohorts (aged 60 or older) from Germany and the United States [the Berlin Aging Studies (BASE) & the Midlife in the United States (MIDUS) study] (Wahl et al., 2022). The authors found no cohort differences in subjective age or other measures of views on aging. On the contrary, a novel study by Wettstein et al. (2023) measured historical shifts in within-person longitudinal changes in subjective age using both linear and quadratic models. This study sampled adults from the German Ageing Survey (DEAS) and found that later-born cohorts indeed feel younger by 2% every birth-year decade, indicating a historical trend toward feeling younger in the second half of life. Wettstein and colleagues reported that the pattern of historical change did not vary by age group in their middle to old-aged cohort (birth year 1911–1974) (Wettstein et al., 2023).
To our knowledge, only one study so far examined changes in age threshold between different birth cohorts. Comparing data from the European Social Survey (ESS) assessed in 2008 and 2018, this study points to an increase in the perceived onset of old age in the later cohort (Augustyński & Jurek, 2021). Based on the same survey, additional findings suggest a higher age threshold in countries with higher life expectancy at age 65, in countries with higher labor force participation rate of older employees, and with an older retirement age (Jurek, 2022). The U.S. is the only Western developed country demonstrating a recent plateau in life expectancy at age 60 (WHO, 2021). On the other hand, while the official retirement age has remained constant, the percentage of adults continuing to work full time at age 65+ (19%) or 75+ (9%) has risen steadily since the 1990s (Pew Research Centre, 2023), which might reflect in a higher age threshold. These recent studies are intriguing as they begin to develop an understanding of historical shifts in views on aging across different cohorts; however, none of the studies has compared historical changes in both measures of subjective age and age threshold.
The Present Study
This study aims to add to the emerging literature on historical changes in subjective age and age threshold by comparing ratings between two cohorts from the Midlife in the United States (MIDUS) study aged 25–74 years. The primary study objective is to compare differences in various measures of subjective age and age threshold between equal age groups of two cohorts surveyed at different times, while controlling for potential sources of bias using balancing techniques. Given some evidence in support of a non-linear relationship between subjective and chronological age across the life span, as well as an understanding that historical changes can shape beliefs and behaviors in age-specific ways, non-linear relationships between subjective age, age threshold and chronological age were modeled in addition to linear relationships. Based on evidence toward negative health changes and negative social norms surrounding aging, an increase in felt age, decrease in desired age and increase in age threshold were predicted.
Methods
Participants and Procedure
Two deidentified, publicly available datasets from the MIDUS study were utilized for this study. Information about the MIDUS sample selection and measures are available online (cf. Author Note), and any data exclusions or manipulations are described herein. All data preparations and analyses were done using R version 4.1.3 (R Development Core Team, 2022).
The MIDUS study is a long-standing interdisciplinary study of behavioral, social, and psychological factors as they relate to age-associated physical and mental health. MIDUS participants were drawn from a nationally representative random-digit-dial sample of non-institutionalized English-speaking adults in the United States, and data were collected using initial telephone interviews and follow-up mail questionnaires. The first dataset (MIDUS 1, abbreviated as M1) comprises survey data collected from 1995 to 1996 (Brim et al., 2020) from 7,108 adults aged 25 to 74. A refresher sample of 3,577 adults aged 25 to 74 was drawn to replenish the original sample between 2011 and 2014 (MIDUS Refresher 1, abbreviated as MR) (Ryff et al., 2017). While the MR study also included a separate sample of African Americans to increase minority sampling, this data set was not utilized in the present study since a similar population was not available for the M1 cohort. MIDUS data collection is reviewed and approved by the Education and Social/Behavioral Sciences and the Health Sciences Institutional Review Boards at the University of Wisconsin-Madison.
Measures
The primary explanatory variables were MIDUS cohort (M1 versus MR) and chronological age. The main outcome variables included two measures of subjective age and a measure of age threshold. Subjective age was defined as: (1) the age the respondent feels like most of the time (felt age) and was assessed using the prompt “Many people feel older or younger than they actually are. What age do you feel most of the time?”; (2) the age the respondent would like to be (desired age) was measured with the prompt, “Now imagine you could be any age. What age would you like to be?”. Both subjective age measures were calculated as a proportional discrepancy score, calculated by [subjective age – chronological age]/chronological age] (Kotter-Grühn et al., 2016). Age threshold was defined as the age the respondent believes middle age ends (women/men no longer middle age) and measured with the prompt, “At what age are most men/women no longer middle aged?”.
Participant Characteristics as Observed in MIDUS-1 and MIDUS-R Cohorts Pre- and Post-weighting.
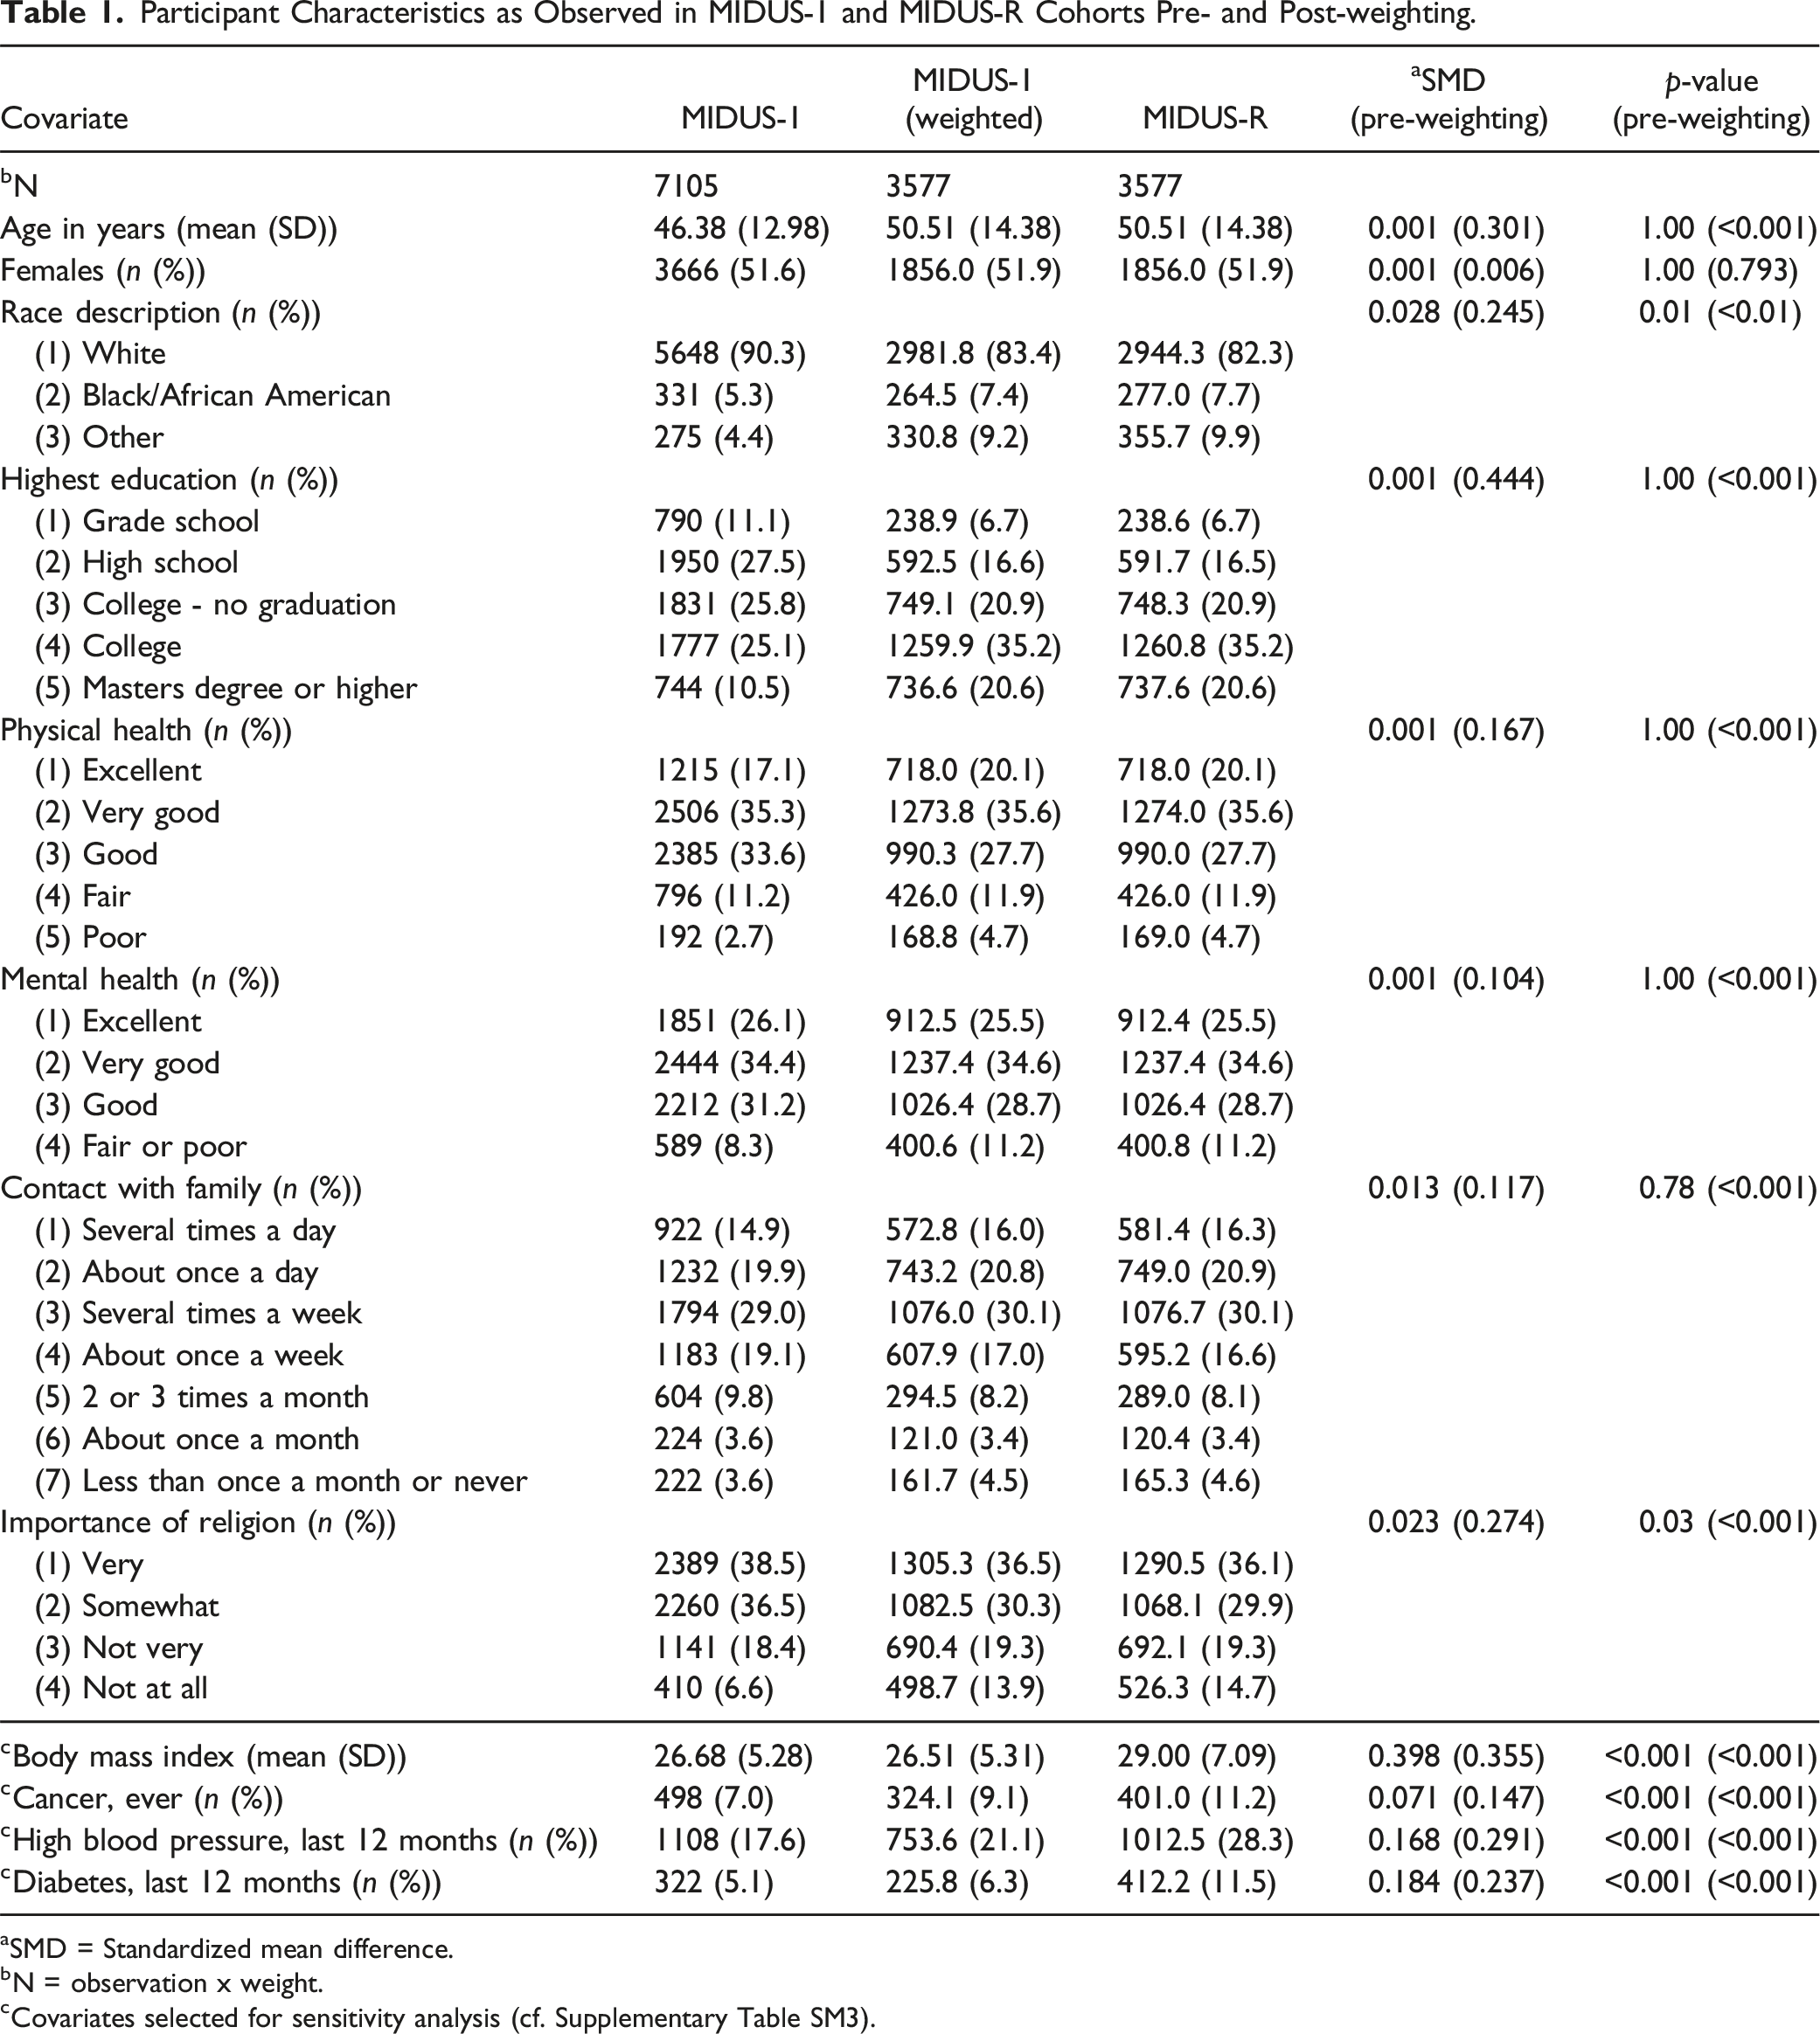
aSMD = Standardized mean difference.
bN = observation x weight.
cCovariates selected for sensitivity analysis (cf. Supplementary Table SM3).
Statistical Analyses
Confounding resulting from covariate imbalance is an inherent shortcoming in observational study designs. Various balancing approaches have been developed to mimic a randomized design and to obtain valid group comparisons in observational studies (Stuart, 2010). Due to missing data of different extents in both cohorts, a balancing algorithm adapted to multiple imputations of missing data was applied (Pishgar et al., 2021). In brief, the applied algorithm is as follows: (1) selection of confounders, (2) imputation of missing data using a broad imputation model, (3) weighting based on selected confounders within each imputed data set (Pishgar et al., 2021), (4) balance assessments, (5) analysis of weighted data sets, and (6) pooling of results. Possible confounders were selected from the MIDUS data dictionary based on their theoretical association with felt age, desired age and age threshold. Following the disjunctive cause criterion, variables were considered confounders if they conceptually were considered to have developed prior to the exposure and were associated with an exposure, an outcome or both (VanderWeele, 2019).
The quantity of missing data between M1 and MR differed considerably. Among M1 variables, missingness did not exceed 15%, but in MR missingness was considerably higher and affected up to 31% of observations (cf. Supplementary Material Table SM1). Participants were excluded if responses were missing for chronological age (n = 3) or if responses varied more than ±3 standard deviations from the overall distribution (felt age, n = 18; desired age, n = 16; women no longer middle age, n = 48; men no longer middle age, n = 68), which corresponds to previous research in this field of research (e.g., Stephan et al., 2021).
Multiple imputation for missing data was completed using the R package mice (van Buuren & Groothuis-Oudshoorn, 2011) with parallelized computations on ten cores for M1 and MR separately. The latter was applied since participant characteristics differ between survey cohorts with regard to means and proportions. Multiple imputation is a frequently used approach when dealing with missing data. Broadly speaking, multiple imputation replaces missing observations with multiple plausible values for each subject with missing values in a data element, resulting in several completed datasets. Subsequently, analyses are conducted across the imputed datasets, yielding a set of parameters which are pooled into one estimate (Austin et al., 2021; Hand, 2018). Further, due to the dependence of the outcome distribution on participants’ chronological age and in order to improve the fit between observed and imputed values, the imputation process was stratified by age groups ([18, 40), [40, 50), [50, 60), [60, 80]) using the R package miceadds (Robitzsch & Grund, 2022). The age stratification was only applied for the imputation process because subjective age data concentrated around decades of chronological age (cf. Supplementary Material Figure SM1). All variables used for weighting and analysis were part of the imputation model. After 30 burn-in iterations, 10 datasets with imputations were created.
Entropy-based weighting (EBW) was applied to balance participant characteristics in the two sampling waves. EBW can be thought of as an abstraction of the more commonly used propensity score weighting (Hainmueller, 2012). Based on specified target moments (e.g. mean, variance or skewness) of confounding covariates, EBW estimates a set of weights in order to achieve balanced covariates between groups. In contrast to propensity score-based methods, EBW allows for a direct estimation of weights, rather than iteratively modeling the propensity score and re-assessing its balancing diagnostics. EBW was chosen for its advantages over propensity score matching and because it led to better balancing when compared to propensity score matching (see Supplementary Figure SM2), which is in line with previous findings (Parish et al., 2018). EBW was applied within each data set comprising imputations of missing data using the R package ebal (Hainmueller, 2014). Unweighted and weighted differences between M1 and MR were evaluated using standardized mean differences (SMD) calculated with the R package cobalt (Greifer, 2022).
Weighted multiple linear regression models were used to examine associations between the three measures of subjective age and chronological age for each MIDUS cohort. Due to previously mentioned evidence in the literature of a potential non-linear relationship of chronological age with felt age or age threshold, we examined linear versus non-linear associations using for the latter natural spline functions (Perperoglou et al., 2019). All models were adjusted for cohort (M1 vs. MR), sex (male vs. female as designated by the MIDUS study), chronological age, and the interaction of cohort and chronological age. Model complexity in terms of degrees of freedom of the spline functions and whether to include the interaction term was chosen according to the Bayesian information criterion (cf. Supplementary Table SM2) (Burnham & Anderson, 2004).
When using non-linear terms in regression models, the common practice of pooling and presenting the results after multiple imputations as estimates with corresponding confidence intervals is not applicable. We used the model estimates of the fitted regression models to predict each outcome at 5-year increments of age across the range from 25 to 75 years and for both cohorts within each of the imputed data sets. In line with recommendations for obtaining model predictions after multiple imputations (Miles, 2015), a “predict and then combine” approach was used that is implemented in the R package ggeffects (Lüdecke, 2018). The contrasts in outcomes between M1 and MR were analyzed at each 5-year increment of age with Tukey-adjusted multiple pairwise comparisons using the R package emmeans (Lenth, 2024).
Graphical presentation of outcome distributions were created using R package ggplot (Wickham, 2016; cf. Supplementary Material Figure SM1). The association of all outcomes with chronological age was examined using the non-parametric local regression approach loess (Cleveland & Devlin, 1988). Additionally, given a strong univariate association between the three outcomes and self-rated physical health, a sensitivity analysis was performed by adding several measures of comorbidity (i.e., body mass index, high blood pressure, cancer and diabetes) to the balancing process (cf. Supplementary Material Table SM3).
Results
Descriptive Statistics
Table 1 illustrates key characteristics of M1 and MR participants before and after weighting procedures. At baseline (pre-weighting), MR participants were on average older, more racially diverse, more likely to have at least a college education, and more likely to view religion as not important to their life. MR participants also were more likely on average to report worse mental health and more health disparity within the cohort (i.e., more likely to report excellent or poor health on the extreme ends of the response spectrum). Application of EBW balanced for significant differences in the majority of demographic, health and psychosocial variables identified as potential confounders; that is, the corresponding SMDs after weighting were almost zero. Regarding racial composition (SMD pre/post weighting = 0.245/0.028) and importance of religion (SMD pre/post weighting = 0.273/0.023) the differences between sampling waves were considerably reduced, but the SMDs were still significantly different from zero (p = 0.01; p = 0.03).
Predicted Age Feel Like Proportional Discrepancy Scores by Chronological Age Group for MIDUS-1 and MIDUS-R Cohorts.
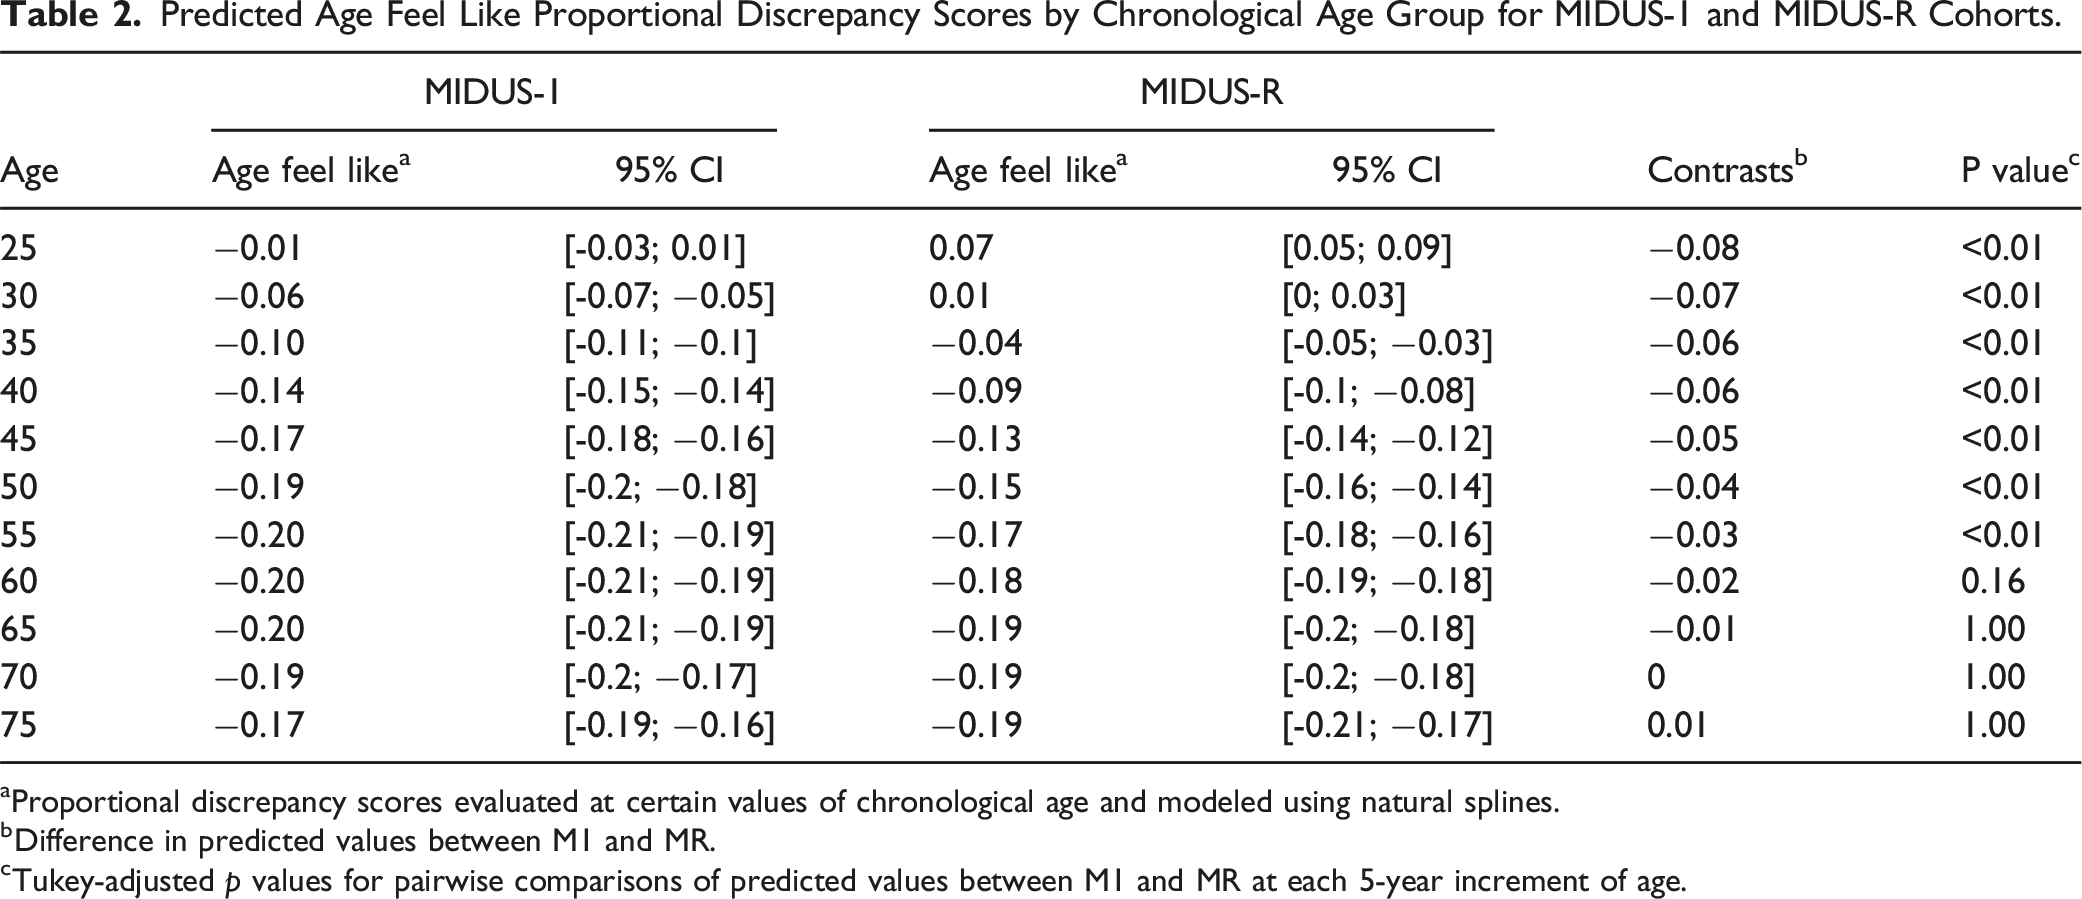
aProportional discrepancy scores evaluated at certain values of chronological age and modeled using natural splines.
bDifference in predicted values between M1 and MR.
cTukey-adjusted p values for pairwise comparisons of predicted values between M1 and MR at each 5-year increment of age.
Predicted Desired Age Proportional Discrepancy Scores by Chronological Age Group for MIDUS-1 and MIDUS-R Cohorts.
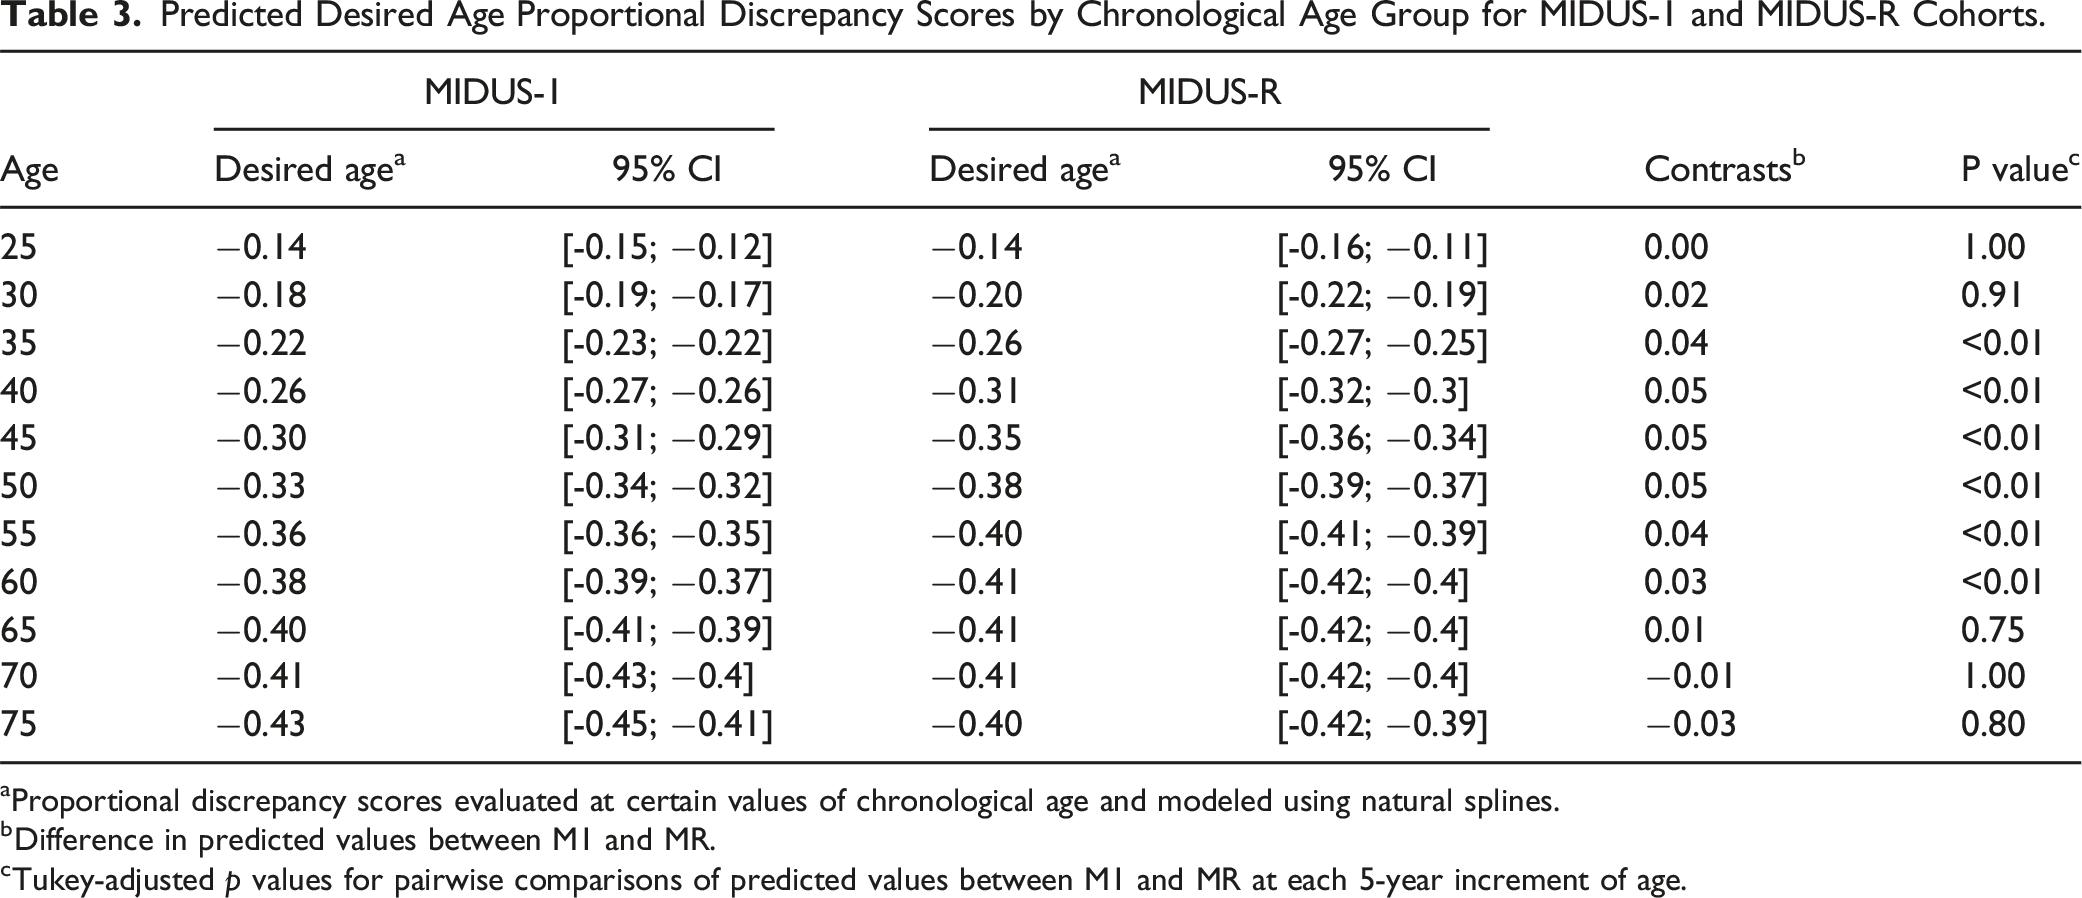
aProportional discrepancy scores evaluated at certain values of chronological age and modeled using natural splines.
bDifference in predicted values between M1 and MR.
cTukey-adjusted p values for pairwise comparisons of predicted values between M1 and MR at each 5-year increment of age.
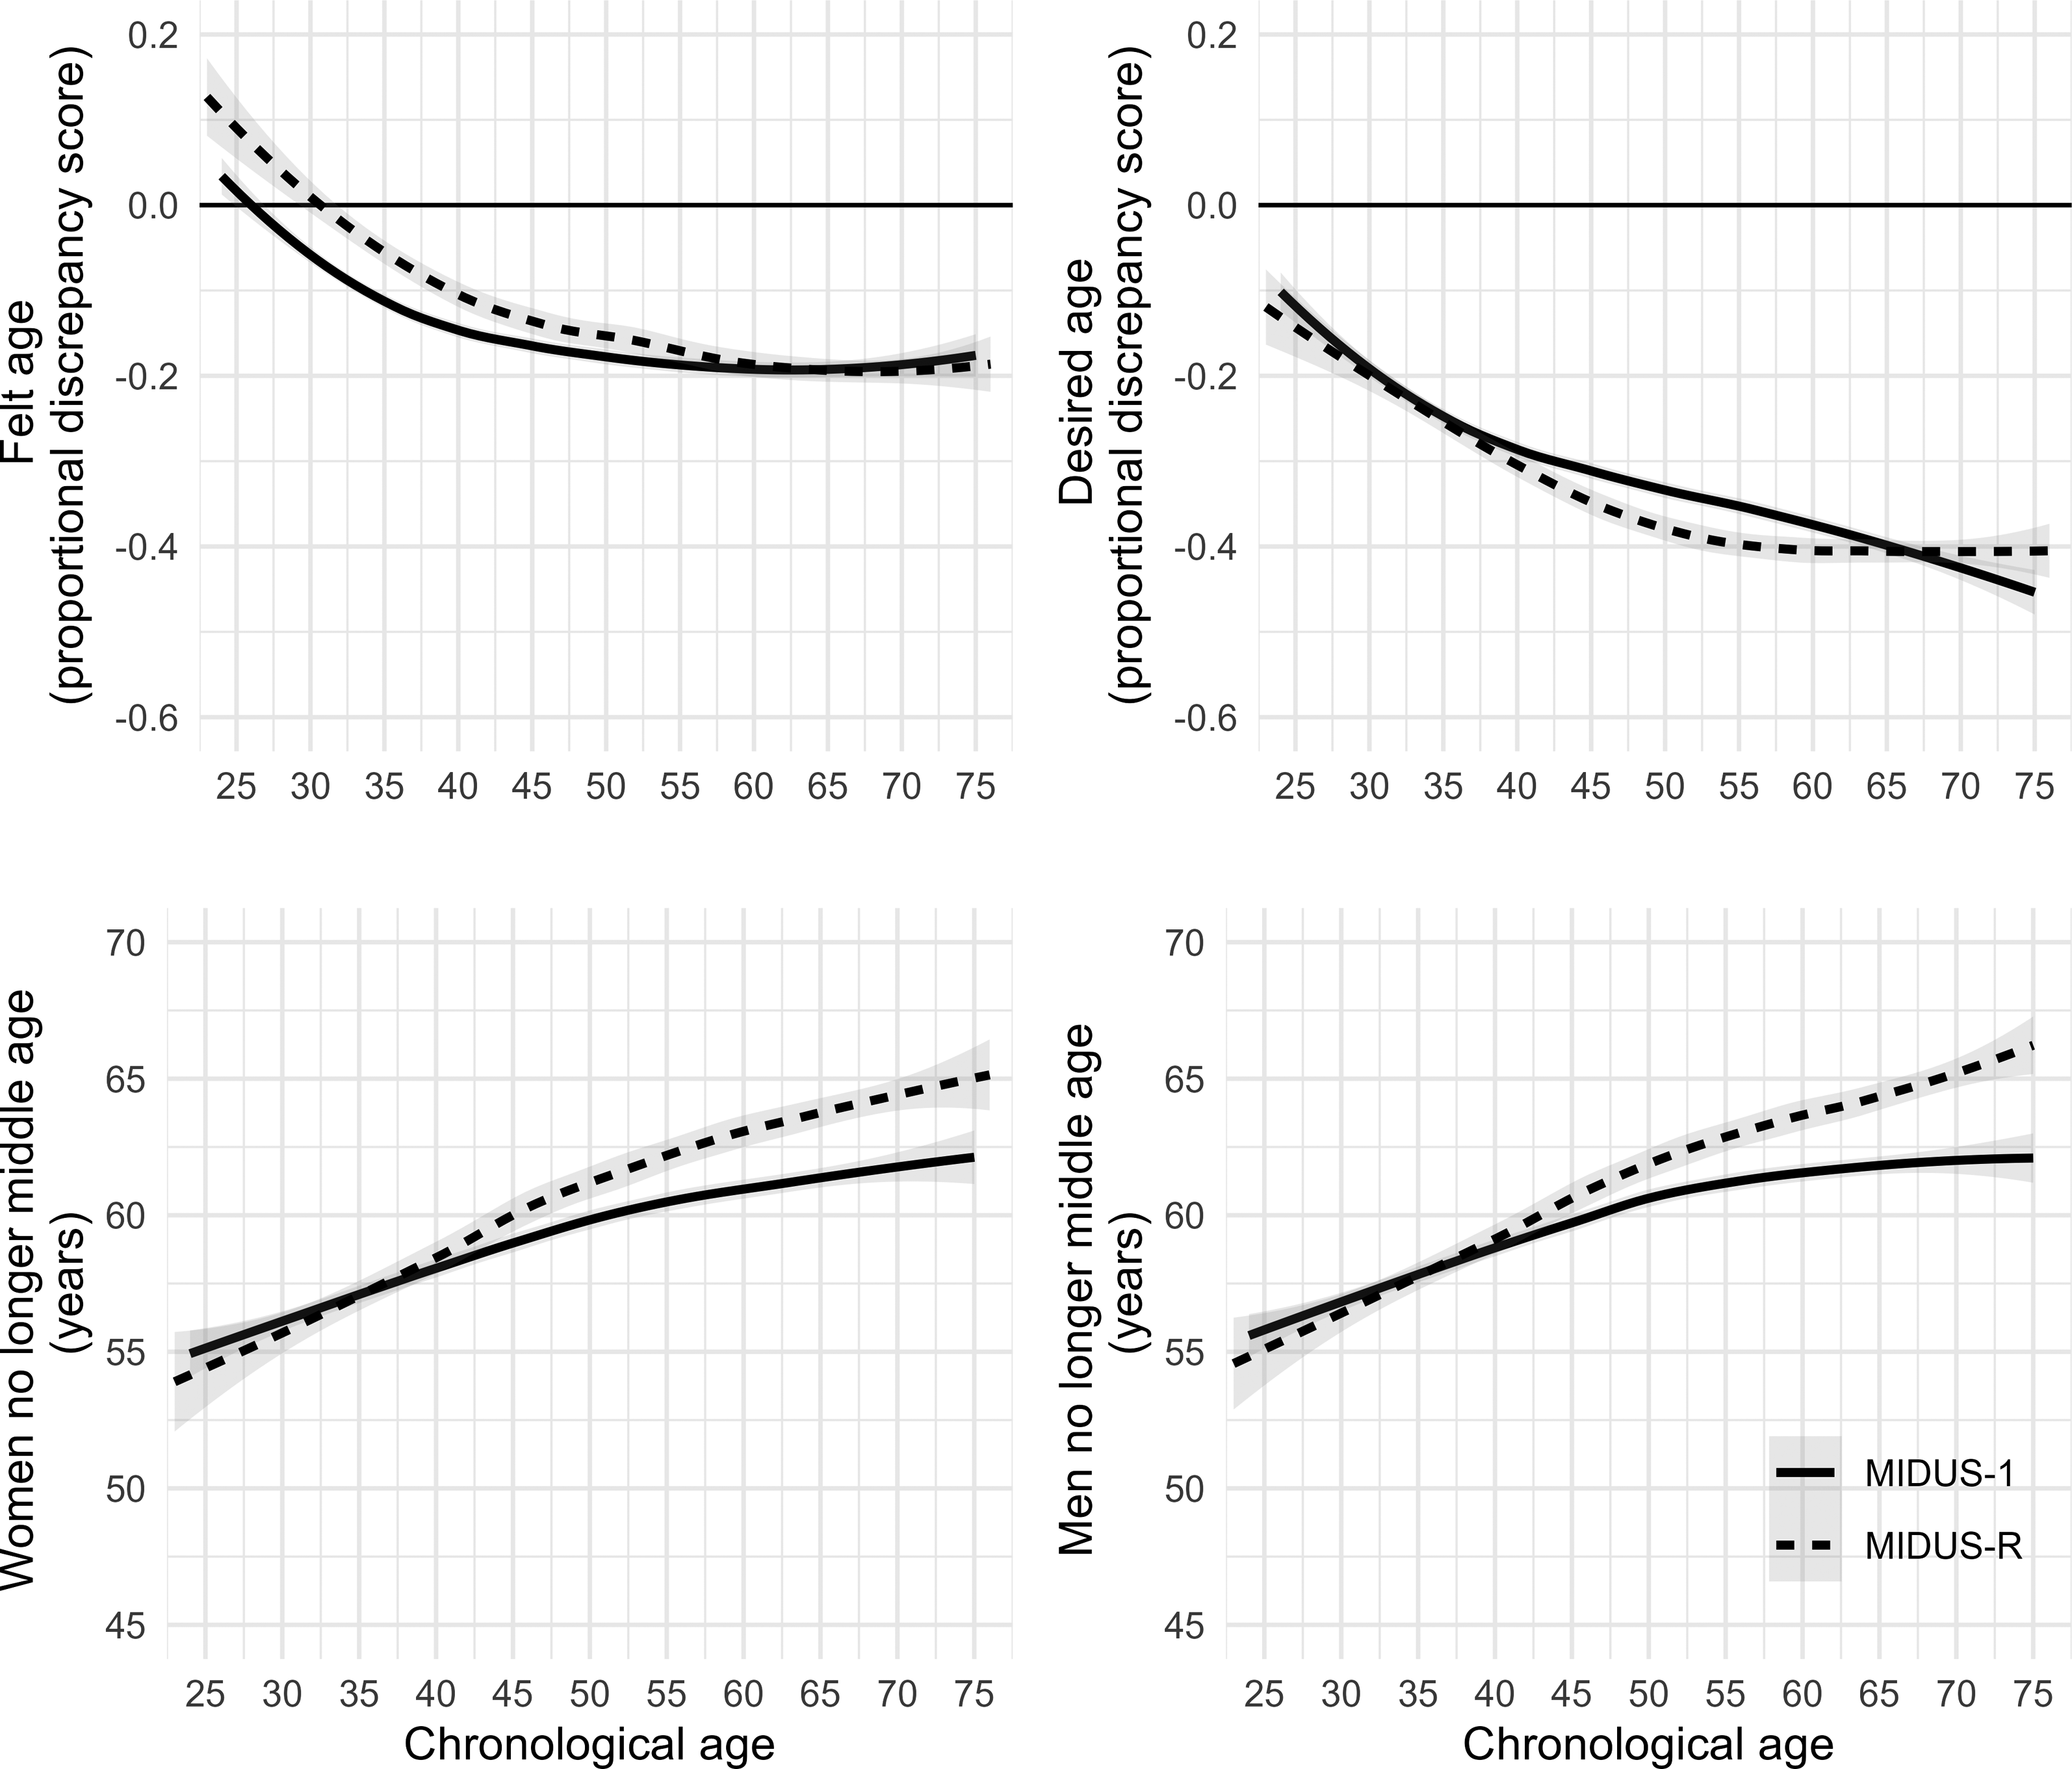
Baseline associations of subjective age outcomes and chronological age for MIDUS-1 (solid line) and MIDUS-R (dashed line) cohorts. Black horizontal lines in top panels define exact agreement between felt/desired age and chronological age.
Finally, differences in age threshold also were observed between cohorts, but only in older (50+) age groups, whereas no changes occurred in age groups below 50 years. That is, older MR participants (75 years) were more likely to report middle age ending at a higher age (range: 64.38 to 65.79 for women and 65.29 to 66.67 for men) compared to M1 participants (range: 61.51 to 62.78 for women and 61.78 to 63.02 for men) (cf. Table 3 and Figure 2). Predicted associations of subjective age outcomes and chronological age using weighted linear model for MIDUS-1 (solid line) and MIDUS-R (dashed line) cohorts. Shaded regions represent 95% confidence intervals of predicted conditional means.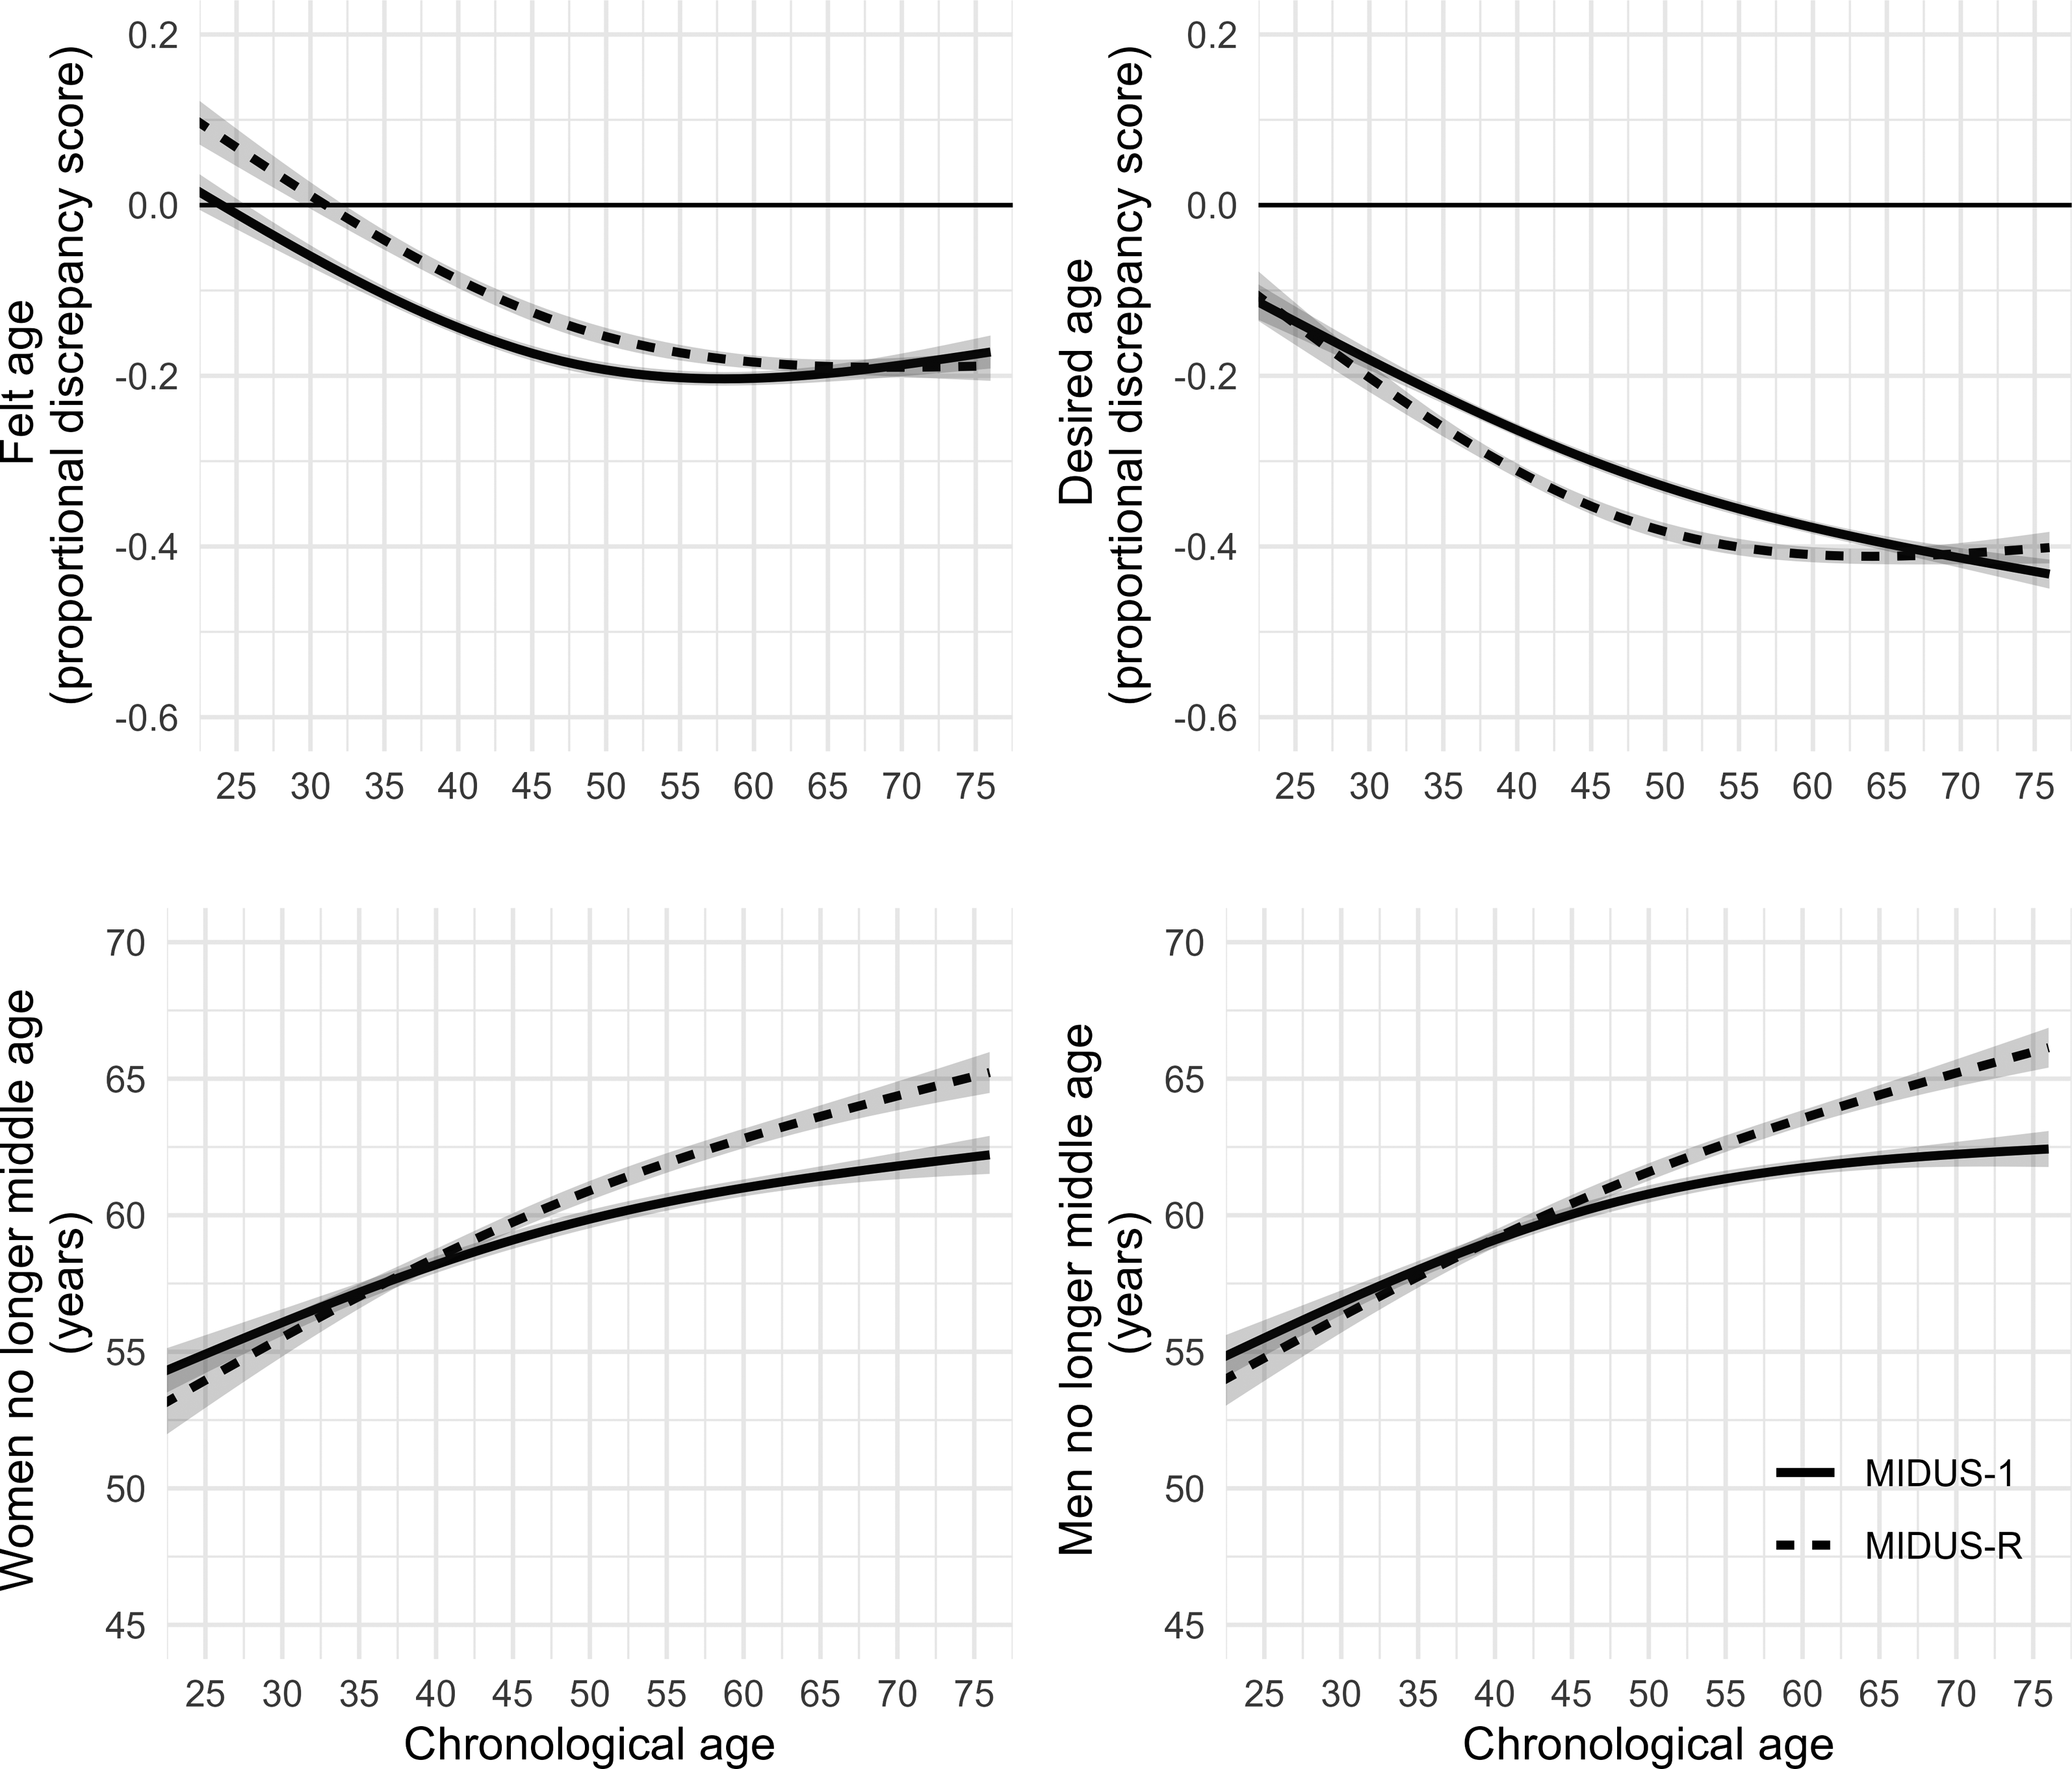
Discussion
Previous studies that examined historical changes in subjective age came to diverging results, partly pointing to no change or a decrease in subjective age in later cohorts of older adults (60+). Cohort changes in age threshold, however, have not been addressed in specific age groups so far. Comparing two cohorts of the Midlife in the United States study (MIDUS), the present study examined historical changes in felt age, desired age and age threshold within the last two decades considering a broad age range from 25 to 74 years. Later cohorts of young to middle-aged adults felt older, whereas middle-aged adults of the later cohort additionally showed a younger desired age, and no changes in felt or desired age were observable in age groups 65 and over. In contrast, only in the age group 65 and over, the later MIDUS cohort showed an older age threshold compared to the earlier cohort.
The finding of historical stability in subjective age (felt or desired age), which we found for older adults, is in line with a previous study that examined MIDUS data but excluded age groups below 60 (Wahl et al., 2022). As the present study uses a different balancing approach, it serves as a replication of previous findings on the historical stability in SA and desired age, while also examining age threshold and controlling for additional potentially confounding variables that were not included in other publications. For middle-aged adults, the present study suggests a historical change in subjective age by showing that later born cohorts feel older despite a desire to be younger. This finding underlines that it is worthwhile to consider cohort changes in younger age groups as well.
One explanation for this finding of feeling older is a confounding influence of a higher prevalence of chronic diseases in the later cohort. Hubley and Russell (2009) reported that of all the variables that might account for a discrepancy between chronological and subjective age, health factors explain the greatest proportion of variance, with poorer health being associated with feeling older. In fact, today a greater proportion of Americans are living with at least one chronic disease compared to several decades ago, which could result in part from increased detection, but likely reflects a higher disease prevalence and also an increase in behavioral risk factors (e.g., tobacco use, unhealthy diet, physical inactivity, opioid addiction) (Crimmins et al., 2021). The findings are consistent with the HIDECO theory that poor health can reduce internal resources for dealing with everyday challenges, and negatively affect subjective well-being (Drewelies 2019), which in turn may lead to feeling older.
In additional sensitivity analyses, we therefore added physical health variables (body mass index, high blood pressure, cancer and diabetes) to the balancing process, which indeed reduced differences in the associations between cohort and felt age within each cohort (cf. Supplementary Material Table SM3). Historical changes in health were observed not only in middle-aged but also in older adults (Crimmins et al., 2021), for whom the present findings showed no changes in subjective age. However, the prevalence of chronic diseases has always been much more common in old age (Crimmins et al., 2021), which is why cohort changes in disease prevalence might be less likely to affect felt age in older adults. In contrast, in age groups in which chronic diseases were less common historically (e.g., young or middle-aged), measures of felt age may be more affected.
Besides the relationship between health and felt age, other factors such as stress and control beliefs have changed historically between the 1990s and 2010s (Almeida et al., 2020; Drewelies et al., 2018), which may have also contributed to higher felt age. For example, Schafer and Shippee (2010) hypothesized that family adversity (e.g., chronic disease; financial problems; problems at school or work of a family member) might increase felt age by producing stress and showed in fact a longitudinal association of family adversity and higher felt age. Another study that assessed perceived stress showed a bidirectional longitudinal association between higher perceived stress and older felt age; yet the impact of perceived stress on felt age was weaker with advancing age (Wettstein et al., 2021). Taken together, this might provide another explanation why, in the present study, felt age only increased in younger and middle-aged, but not older adults. Based on the same data from the MIDUS study as the present study, Drewelies et al. (2019) showed that younger adults in the later-born cohort reported lower perceived control than those who reached the same age 18 years earlier. Because control beliefs can function as a moderator of the relationship between daily stressors and felt age (Lee & Neupert, 2024) this might provide another explanation why, in the present study, felt age only increased in younger, but not older adults.
Another explanation for the finding that later cohorts of young to middle-aged adults feel older could be that they have internalized the effect of ageism less compared to earlier cohorts. For them, feeling old may be more associated with life experience or wisdom instead of feelings of physical decline (Gendron et al., 2018). However, by additionally taking the findings on desired age and age threshold into account, the observed historical change in felt age does not necessarily point to less ageism or a reduced age-group dissociation when negative age stereotypes predominate (i.e., age dissociation; Weiss & Kornadt, 2018). Desired age was younger in the later cohort of middle-aged adults, which suggests that they feel older but wish to be younger than the cohort born earlier. Younger desired age is considered to be an indicator of low satisfaction with one’s own chronological age (Hubley & Hultsch, 1994), but desired age was shown to have near-zero correlations with health indicators (Hubley & Russell, 2009). Thus, an increase in chronic diseases could have affected felt age more than desired age, whereas the latter measure may better reflect the impact of ageism on age dissociation.
Interestingly, the age groups experiencing a historical increase in felt age did not also experience an increase in age threshold. The finding of a historical change towards a higher age threshold reported by older individuals is in line with the previously described study of Augustyński and Jurek (2021) based on data of the European Social Survey; however, the present study compared different age groups, while Augustyński and Jurek (2021) focused instead on country differences. Their findings combined with those of Jurek (Jurek, 2022) suggest that societal-level factors such as the retirement age, healthy life expectancy, and median age of the population may all influence age threshold. Thus, societal changes in the United States reported above — such as the higher percentage of older adults working full time and a higher population age — might explain the increased age threshold.
Strengths and Limitations
This study expanded on prior research by weighting confounders to ensure a balanced cohort comparison. Nonetheless, it is still possible that residual bias remains in the reported cohort differences in the three outcomes measures.
While the age range included in this study extended those of previous studies, the MIDUS cohorts did not provide sufficient data to compare age groups below 25 or older than 75. In prior studies, adolescents are the only group that report a subjective age older than one’s chronological age, with a crossover in this pattern occurring around age 20–25 (Galambos et al., 2005; Montepare & Lachman, 1989), suggesting this is a unique subgroup to be considered. On one hand, markers of psychosocial maturity (e.g., independent decision-making) have been shown to be more important indicators of the transition into adulthood than role changes (e.g., entering the workforce) (Galambos et al., 2005). On the other hand, worsening employment rates or a longer participation in the workforce compared to past cohorts could lead one to associate with a younger age group or delay the onset of old age threshold because of economic dependence (Gerstorf et al., 2020).
This study also missed age groups over age 75, which represent the fastest growing segment of the population. It is possible that the present findings from ages 70–74 years could be transferred to those 75+ as found in a previous study (Wahl et al., 2022). However, factors such as loss of function, reduced effectiveness of resources, or the increased salience of time to death may affect felt age uniquely among the very old (Gerstorf et al., 2020; Wettstein et al., 2021).
The present study also has methodological limitations which should be noted here. First, although felt age, desired age and age threshold were measured in a common way, questions that contain the notion “old age” may not be read as neutral but rather pejorative question and thus evoke ageist thoughts of old age as time of sickness, disability or frailty; thus, these measures may be a byproduct of ageism themselves, which questions their validity (Gendron et al., 2018). Therefore, a suggestion is to preface questions such as “how old do you feel?” by asking “what does old mean to you?”, a question that was not included in the MIDUS study.
Second, except for the degrees of freedom of the non-linear term of chronological age, all outcomes were modeled similarly in regression models. It is likely, that different outcomes of subjective age are associated with as well as confounded by different covariates. In this manner the balancing process and the model selection should consider the effects of different covariates for each outcome. However, in this descriptive study we were interested in difference between similar age groups of two different cohorts. Finding the best model for prediction of each of the different outcomes is beyond the scope of this study.
Furthermore, this secondary data analysis was confined to the measures available from the MIDUS survey instrument and cohort design. For instance, data regarding stereotypical attitudes toward aging were not available for the later cohort and therefore it was not possible to measure changes in age stereotypes between the sampling periods. Additionally, given that this study compared two cohorts sampled decades apart, we were not able to explore intra-individual changes in subjective age or age threshold that could be measured from a longitudinal study design (Wettstein et al., 2021).
Predicted Age Threshold by Chronological Age Group for MIDUS-1 and MIDUS-R Cohorts.
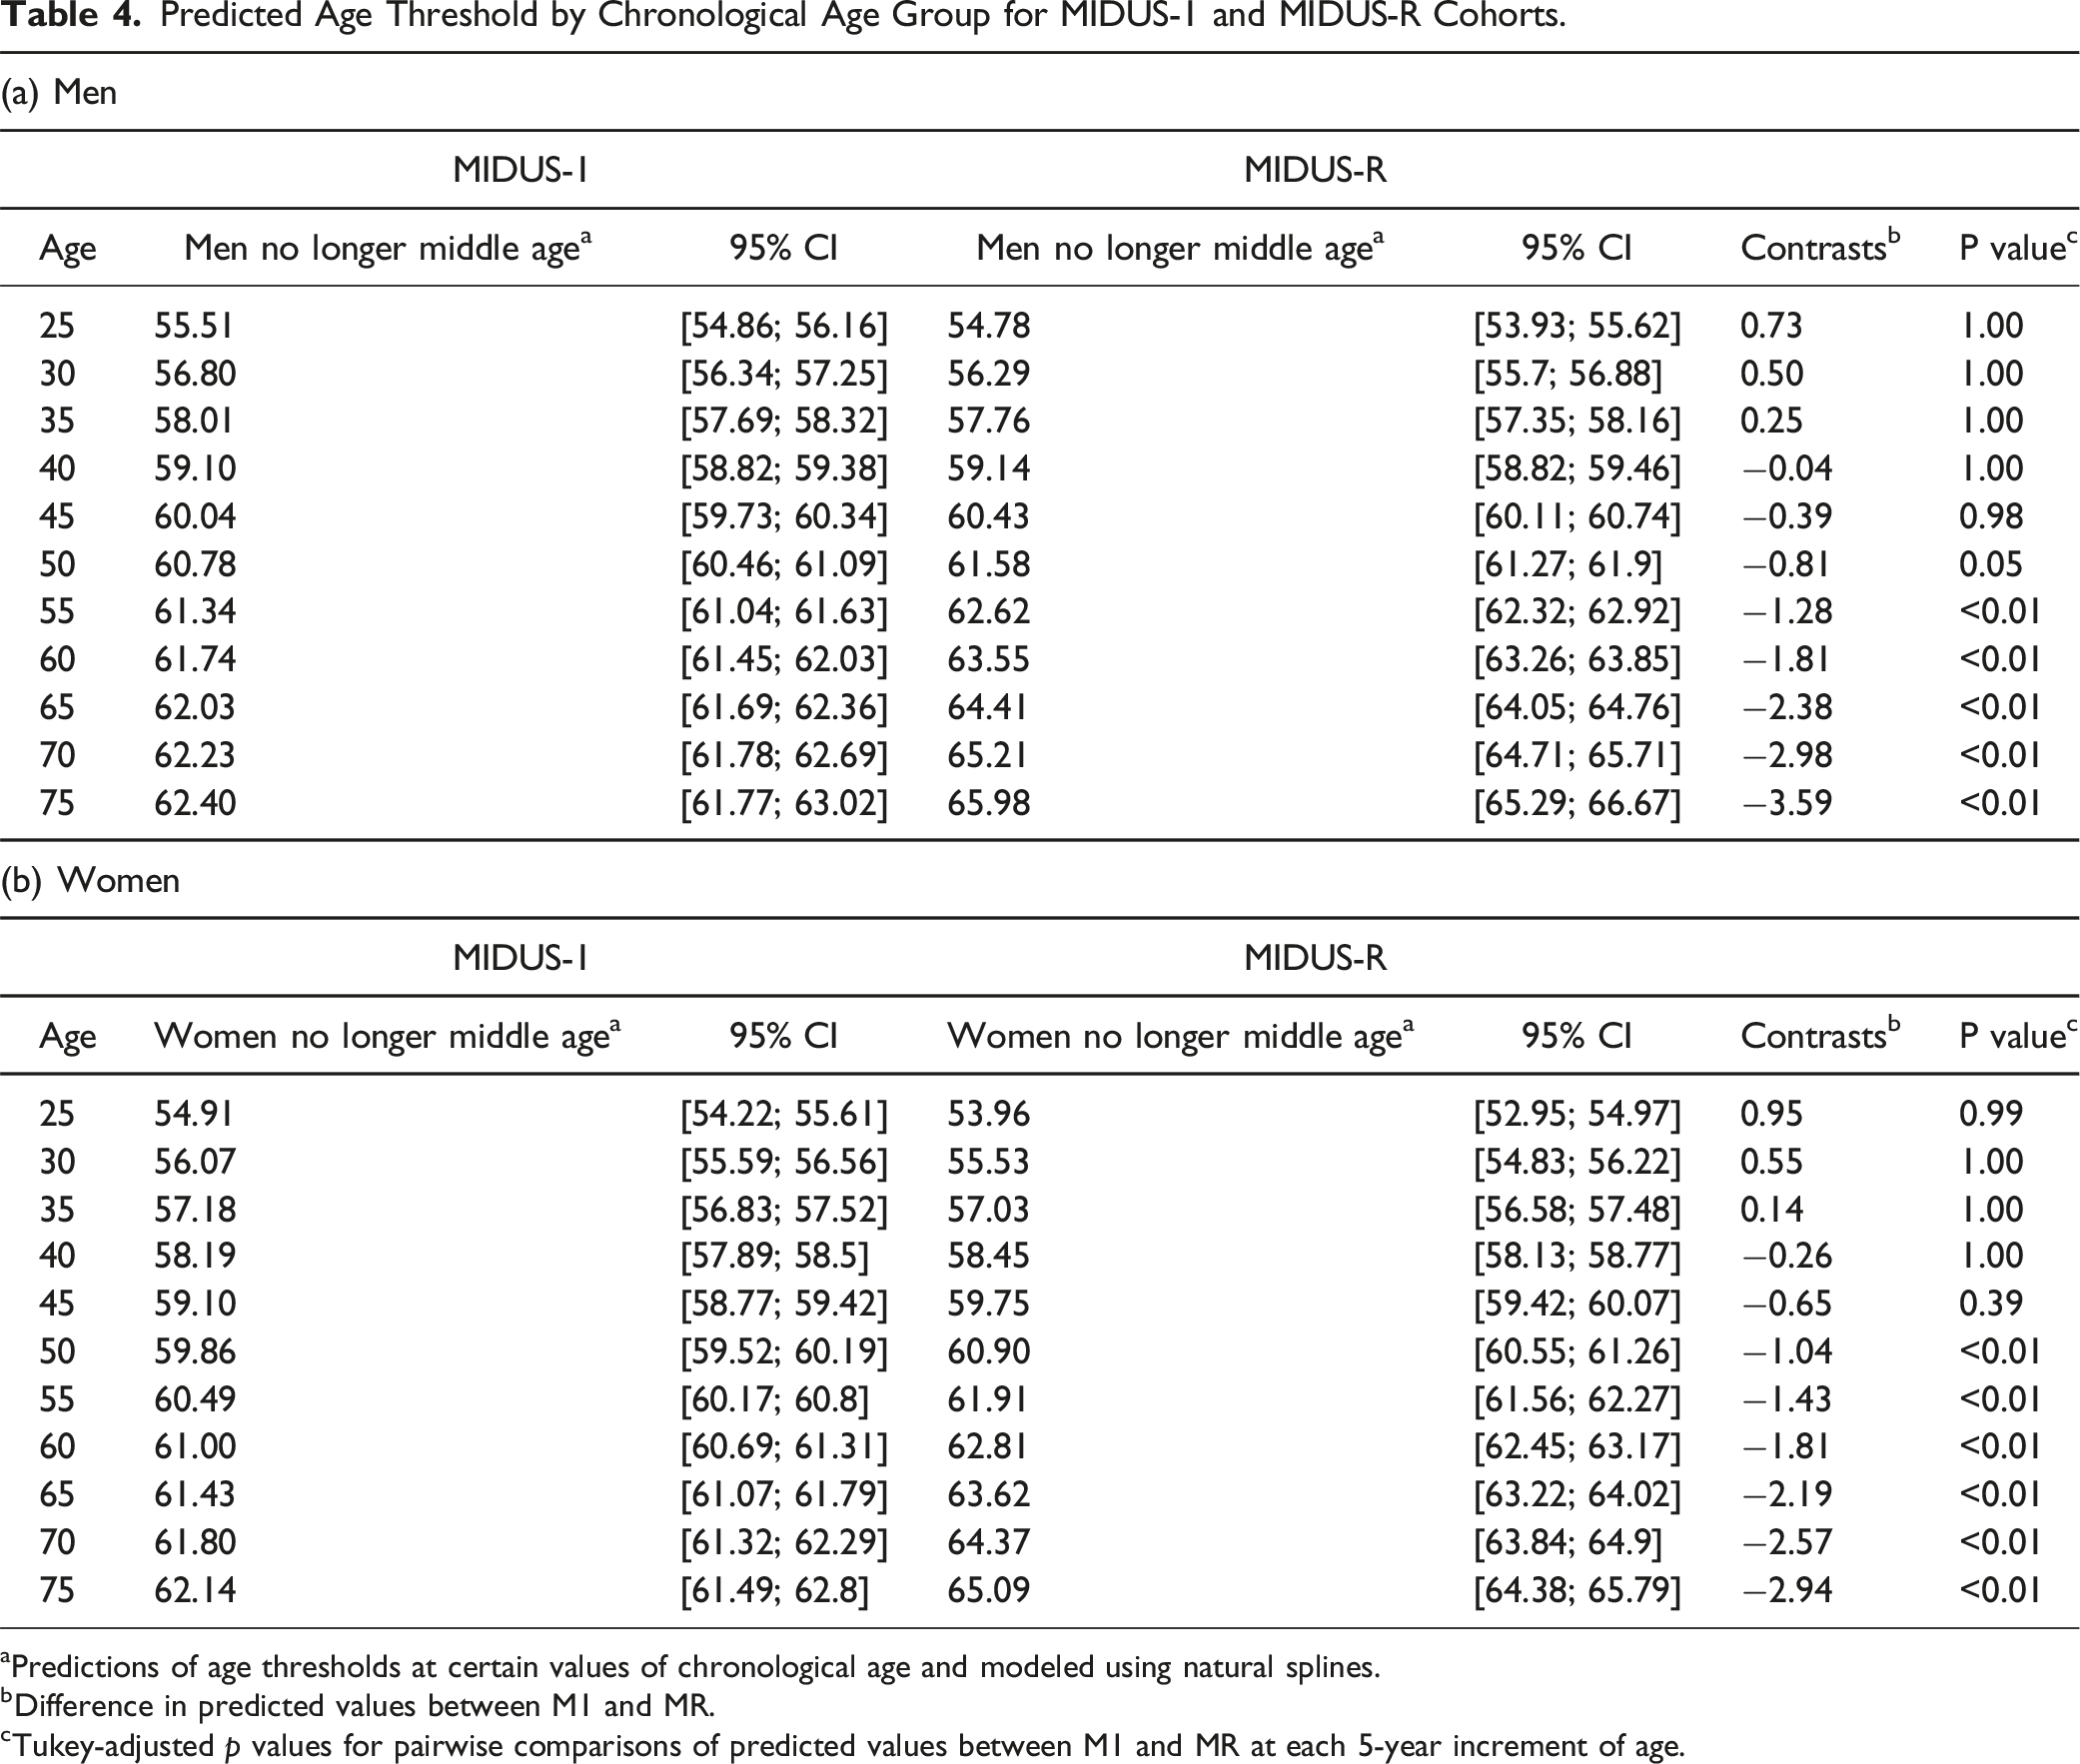
aPredictions of age thresholds at certain values of chronological age and modeled using natural splines.
bDifference in predicted values between M1 and MR.
cTukey-adjusted p values for pairwise comparisons of predicted values between M1 and MR at each 5-year increment of age.
Supplemental Material
Supplemental Material - Historical cohort differences in views on aging in the US: A trend toward longer midlife but older felt age
Supplemental Material for Historical cohort differences in views on aging in the US: A trend toward longer midlife but older felt age by Stephanie K. Ennis, Moritz Gehring, and Susanne Wurm in Research on Aging.
Footnotes
Acknowledgements
This study was not preregistered. Thanks to Adrian Richter for his work on the initial analysis code, which is available in a public GitLab project. The additional analysis code is available in a public OSF project provided by Moritz Gehring. MIDUS data and materials are publicly available through ICPSR of the University of Michigan (available online at ![]() ).
).
Declaration of Conflicting Interests
The author(s) declared no potential conflicts of interest with respect to the research, authorship, and/or publication of this article.
Funding
This work was supported by the John D. and Catherine T. MacArthur Foundation Research Network, National Institute on Aging (P01-AG020166), National institute on Aging (U19-AG051426), via its funding support of the MIDUS study, National Institute on Aging (P01-AG020166), National institute on Aging (U19-AG051426), via its funding support of the MIDUS study.
Supplemental Material
Supplemental material for this article is available online.
Author Biographies
References
Supplementary Material
Please find the following supplemental material available below.
For Open Access articles published under a Creative Commons License, all supplemental material carries the same license as the article it is associated with.
For non-Open Access articles published, all supplemental material carries a non-exclusive license, and permission requests for re-use of supplemental material or any part of supplemental material shall be sent directly to the copyright owner as specified in the copyright notice associated with the article.