
Abstract
In healthcare and related fields, there is often a gap between research and practice. Scholars have developed frameworks to support dissemination and implementation of best practices, such as the Interactive Systems Framework for Dissemination and Implementation, which shows how scientific innovations are conveyed to practitioners through tools, training, and technical assistance (TA). Underpinning those aspects of the model are evaluation and continuous quality improvement (CQI). However, a recent meta-analysis suggests that the approaches to and outcomes from CQI in healthcare vary considerably, and that more evaluative work is needed. Therefore, this paper describes an assessment of CQI processes within the Substance Abuse and Mental Health Services Administration’s (SAMHSA) Technology Transfer Center (TTC) Network, a large TA/TTC system in the United States comprised of 39 distinct centers. We conducted key informant interviews (n = 71 representing 28 centers in the Network) and three surveys (100% center response rates) focused on CQI, time/effort allocation, and Government Performance and Results Act (GPRA) measures. We used data from each of these study components to provide a robust picture of CQI within a TA/TTC system, identifying Network-specific concepts, concerns about conflation of the GPRA data with CQI, and principles that might be studied more generally.
Keywords
Introduction
Healthcare scholars and implementation scientists have identified a gap between the publication of research findings and their use in practice (e.g., Farquhar et al., 2002; Metz et al., 2019; Wandersman, 2003; Wandersman & Scheier, this issue), with some scholars estimating that a decade or more of time may pass between publication of a scientific discovery and its use in the “real world” (Green et al., 2009; Khan et al., 2021). Partly because of this concern, researchers have developed frameworks to account for the interrelationships of dissemination and implementation of best practices, such as the Interactive Systems Framework for Dissemination and Implementation (ISF) (Wandersman et al., 2008). In such models, scientific innovations are conveyed to practitioners through tools, training, and technical assistance (TA) (Katz & Wandersman, 2016; Wandersman et al., 2012).
Currently, one of the largest networks that transfers behavioral health innovations to the healthcare workforce in the United States (US) is the Substance Abuse and Mental Health Services Administration’s (SAMHSA) Technology Transfer Center (TTC) Network. The TTC Network consists of 39 centers in the US—10 regional centers and two national focus area centers in each of the practice domains of addiction treatment (ATTCs), mental health treatment (MHTTCs), and substance use prevention (PTTCs), plus one Network Coordinating Office (NCO) in each domain (SAMHSA, 2023). These centers represent one of the ways the US Department of Health and Human Services equips the behavioral health and primary healthcare workforces with the evidence-based and promising practices (EBPs), approaches to implementation of EBPs, and resources (e.g., training and capacity-building) needed to address prevention, treatment, and recovery for mental health and substance use (e.g., Allen, 2021; Gotham et al., 2022; Heitkamp et al., 2021). The ATTC network was established in 1993, then the entire TTC system was reconceptualized and expanded with the founding in 2018 of analogous MHTTC and PTTC Networks.
In 2019, Prevention Insights at Indiana University School of Public Health Bloomington was funded to conduct an independent, external evaluation of SAMHSA’s TTC Network. One of the evaluation goals was to thoroughly review how evaluation and quality improvement are operationalized in the Network. A helpful way to frame the importance of these activities within the Network is provided by the ISF (Wandersman et al., 2008), which presents a conceptual framework for understanding the dissemination and implementation of innovations that occur interactively between three systems: (1) Support, (2) Delivery, and (3) Synthesis and Translation. For this study, we reference a model derived from the ISF framework, called the ISF Evidence-Based System of Innovation Support Logic Model (EBSIS). The EBSIS further elucidates the dissemination bridge for innovation transfer that connects the Support System (i.e., TTC network) and the Delivery System (i.e., behavioral healthcare workforce) (Wandersman et al., 2012). Within the EBSIS model, evaluation and quality improvement underpin successful application of tools, training, and TA. When these components of the EBSIS model are performed on an ongoing basis to improve service delivery, it is sometimes called continuous quality improvement (CQI).
The specific nature of CQI activities can vary widely, and formal methodologies tend to vary by field and emphasis (e.g., Six Sigma, Plan-Do-Study-Act) (O'Donnell & Gupta, 2023). A recent systematic review of CQI (Loper et al., 2022) pointed to Riley et al. (2010, p. 6) for a baseline definition of CQI in public health: “use of a deliberate and defined improvement process… [referring to] continuous and ongoing effort [s] to achieve measurable improvements…” Because of the emphasis on measurable improvement, public health CQI is often based on information obtained through process and/or outcome evaluation (e.g., Ebener et al., 2017; Lesesne et al., 2016). Some research suggests that it is useful to document CQI processes and outcomes, and to make decisions based at least partially on this information (Chinman et al., 2005; Wandersman et al., 2012). However, a recent review of randomized trials of CQI in healthcare settings reported uncertainty about the effects of CQI (Hill et al., 2020). Across the 28 trials that were reviewed, there were disparate results, variability between interventions, and differences in selected settings and outcomes, and 26 of the trials had multiple elements at uncertain or high risk of bias. In their review, the authors conclude that “further mixed methods evaluations are needed…” (Hill et al., 2020, p. 2).
Prevention Insights’ evaluation of SAMHSA’s TTC Network contributes to the ongoing study of public health CQI in at least two ways. First, the work that the TTCs are funded to do is wide-ranging – the federal investment in the TTC Network for the most recent grant period exceeded $130 million USD (SAMHSA, 2018). Descriptive study of CQI within the Network is useful because such an examination articulates how a large, national TA/TTC infrastructure approaches CQI in practice. Second, lessons from Prevention Insights’ mixed methods evaluation may be used to inform the evolution of broader conceptualizations of CQI (i.e., the EBSIS model). Adding a layer of complexity, many federally funded programs, including TTCs, are mandated to collect certain types of data pursuant to the Government Performance and Results Act (GPRA) of 1993 and the subsequent GPRA Modernization Act of 2010 (Government Performance and Results Modernization Act, 2011; SAMHSA, 2022a). The GPRA tools are required for use by TTCs to collect data (1) on ‘events’ that are held by TTCs (e.g., a training session) and (2) from participants in TTCs’ events (SAMHSA, 2022b). Specifically, the participant-level tool captures sociodemographic/employment data along with responses to four closed-ended and two open-ended questions about TTC-related events (SAMHSA, 2022b). Since collection of these data is required, they often compose a de facto portion of CQI for federally funded projects, though they are not explicitly intended for that purpose. Among other functions, the utility of such data is that they can be cited in formal agency correspondence and budget requests (“To date, under the current cycle… the 13 ATTCs combined have delivered training and technical assistance for over 43,000 healthcare professionals and paraprofessionals…”) (U.S. Department of Health and Human Services, 2021, p. 231). While a public administration study found that the 2010 GPRA Modernization Act “was associated with the purposeful use of performance data” (Moynihan & Kroll, 2016, p. 320), controversy around the use and appropriateness of the GPRA within SAMHSA grants has been well documented (Knopf, 2021). Conceivably, much of the work being done by TTCs may not be captured by the prescribed GPRA measures, which primarily assess participants’ satisfaction with, and expected benefits from, TTC-related events. TTCs’ work outside this somewhat narrow spectrum may go unrecognized/unrewarded in cases where the GPRA is used as a primary approach to CQI.
Objectives
This article describes a multi-faceted, mixed-method study that describes how CQI has been operationalized within the national TTC Network and how the TTCs’ time and effort are distributed across activities (including evaluation/CQI). The research questions addressed are: (1) How do TTCs apply CQI methods to improve their programs? (2) What barriers do TTCs identify to conducting CQI? (3) What facilitators and/or resources do TTCs identify for conducting CQI? (4) What additional resources would support planning for and conducting CQI? (5) What proportions of time do TTCs allocate to different categories of organizational activities?
In empirically studying these research questions, we also discuss the state of CQI within the TTC Network (including implications around the GPRA) and contextualize the findings using the ISF and EBSIS.
Method
Evaluation Methodologies Used to Address CQI in TTCs
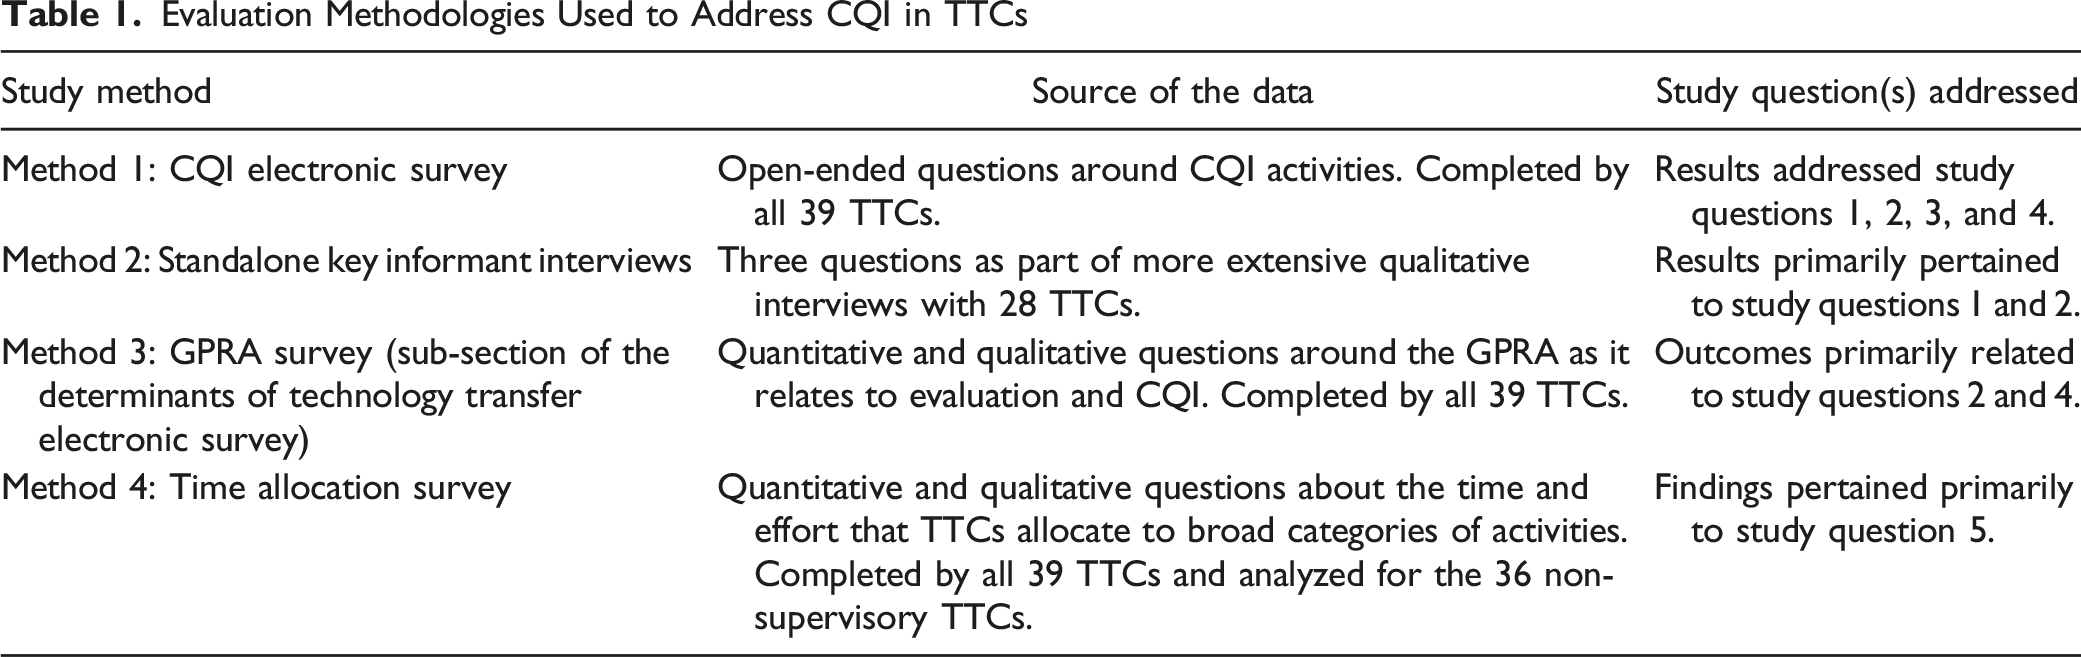
Method 1: CQI Survey
Based on information obtained through key informant interviews (Method 2) and document reviews (a separate part of the overall evaluation), as well as the comparative lack of a required CQI framework in the funding opportunity announcements for TTC grant proposals, we identified a need to collect targeted open-ended information about TTCs’ approach to CQI. Respondents were asked to think very broadly about CQI, conceptualized as any activities related to the questions “How are we doing?” and “How can we make it better?” (Gavin, 2012).
1
Additional framing around the question was also provided to ensure uniform understanding of terms (see Supplement 1). Two example questions from the survey are provided below (full list available in Supplement 6): 1) What influenced or prompted your decision to conduct CQI activities? [Open-ended] 2) Please list up to five (5) sources or types of data you planned to collect or use for CQI (e.g., how you planned to determine “how you are doing”). [Open-ended, each response carried forward to Question 4].
The survey instrument was hosted in QualtricsXM, an online survey platform. Invitations were sent out electronically to all 39 TTCs to complete the CQI Survey during June 2021, and all of the responses were recorded between June 2 and June 22. In each case, the project director or co-director for each TTC was asked to complete the survey. If the same group managed multiple TTCs, then the survey was completed separately for each TTC, even if it was completed by the same individual.
The analysis consisted of carefully reading the open-ended responses and creating categories that represented the emergent themes (i.e., thematic analysis; Braun & Clarke, 2012). This procedure was straightforward since most responses were provided as list-style content. Each TTC’s response was then systematically examined for content pertaining to each theme. The thematic categories were not held to be mutually exclusive (i.e., a given open-ended response could be associated with more than one category). However, the themes themselves represented separate content foci. In some cases, we report frequency data (percentages) derived from matrix-style items framed around the open-ended questions (e.g., what percentage of TTCs actually used the planned CQI data sources?). All data were coded and reviewed by two co-authors, KR and RG, who achieved full concordance in categorizing the data. This was followed by a general review by the other project evaluators for coherence (e.g., whether the themes make sense conceptually) and accuracy.
Method 2: Key Informant Interviews
In April and May 2020, the Evaluation Team conducted 21 virtual or telephone key informant interviews with TTC leaders and other staff members. The 21 TTC interviews reflected conversations with 28 TTCs because when a single grantee (e.g., university) held multiple TTC awards, the TTCs were interviewed at the same time (with one exception). Across the 21 TTC interviews, the number of participants ranged from two to nine (m = 3.4), and in total, 71 TTC leaders and staff members participated in this phase of the evaluation. We describe these interactions as interviews rather than focus groups, even though multiple participants were present in each session, because the intention of the process (in-depth exploration of a specific TTC) more closely resembled an interview than a focus group (e.g., Taylor & Blake, 2015). Our particular interest for this study was the discussion around evaluation activities and data use (Section 3 of the interview guides; see Supplement 2 for complete semi-structured interview guides).
Participating TTCs were purposively sampled based on feedback from the NCOs as well as the Network’s government project officer to obtain a wide breadth of experience, level of collaboration (including whether multiple TTCs within a region had the same organizational lead), and regional diversity. All selected entities agreed to participate, and participating TTCs represented all 10 national regions, both national focus areas, and a relatively even distribution of ATTCs, MHTTCs, and PTTCs (9, 9, 10 split). When an interview covered more than one TTC, responses were solicited on behalf of each TTC. The interviews were recorded and then transcribed prior to analysis.
The primary analyst for this study component (SKRH) developed a codebook (sometimes called a coding manual) for all analysts to use, which mapped the interview questions to the overall evaluation objectives and study questions. A team of three analysts (each familiar with SAMHSA and the TTC Network) used the codebook deductively to code the interview transcripts. Although descriptions of qualitative research methods can sometimes overlap (e.g., a thematic analysis might be both deductive and inductive), we classified this approach as deductive because it closely adhered to common elements of that method, particularly the development and use of a codebook as the primary means of framing the data (Pearse, 2019). Before the full dataset was coded, each of the three analysts independently coded two transcripts, and correlations between analysts for each individual code were compared. Since analysts achieved 80% or higher inter-coder correlation for each code, the full analysis involved a single analyst coding each transcript from the dataset. Ensuring adequate inter-coder correlations for a portion of the total number of transcriptions is a common approach to increasing confidence in the validity of qualitative results when available resources preclude using multiple coders for the entirety of a large corpus of text (Cheung & Tai, 2023). The team also met regularly to discuss coding and revise the codebook as necessary. Finally, findings were reviewed across multiple levels, including within Networks (e.g., considering ATTCs, PTTCs, and MHTTCs as groups) and across the Network (considering all three Networks together).
Method 3: GPRA Survey
Some TTCs, especially those without sufficient budget allocations for evaluation staff, used SAMHSA’s GPRA tools as a primary means of CQI. Therefore, assessing the GPRA’s utility for CQI was important to the goals of our study. The questionnaire we administered to participants about the GPRA was part of a larger survey that also focused on the determinants of technology transfer. Psychometric work related to survey development is fully described in Reho et al. (this issue). Supplement 3 contains copies material pertinent to the survey.
Each respondent was asked to respond to seven items using a matrix response grid and five response options ranging from 1 = “Not at all useful” to 5 = “Extremely useful,” using the stem “Please rate how useful the data generated by the GPRA are for each of the following purposes.” A sample item is “Evaluating your own TTC’s work” (see Supplement 6 for a complete list). Respondents were also asked a single open-ended item reading, “What changes to the GPRA instrument, if any, would make the questionnaire a better tool for generating useful feedback on your TTC’s efforts?”
Once obtained, quantitative data were compiled into a descriptive table, collapsing responses of 1 and 2 (“Not at all useful” and “Not very useful”) as well as 4 and 5 (“Very useful” and “Extremely useful”), and retaining responses of 3 (“Neither useless nor useful”) as the midpoint. Because these questions focused on whether the GPRA was generally perceived as useful (or not) for different purposes, this transformation fostered interpretability of the data. Responses to the single open-ended question used thematic analysis (Braun & Clarke, 2012) and iterative consensus meetings between two authors (KR and RG) to achieve complete coding correspondence (additional methodological details are available in Reho et al.).
Method 4: Time Allocation Study
Our pre-evaluation dialogue with the NCOs identified that TTCs’ use of the GPRA as a primary evaluation tool may result in substantive and important work being completed by TTCs but left unmeasured by the prescribed GPRA measures. However, there was no aggregated information showing how the TTCs’ effort and time was distributed among different types of activities, even though understanding these processes is important when completing CQI. In addition, the typical amount of effort spent on evaluation and CQI itself (e.g., as one such process) was unknown. To investigate the proportions of time TTCs allotted to different center activities, we used an organizational-level time allocation study. Time studies are often used in both individual- (Bauman et al., 2019; Eurostat, 2020) and organization-level evaluations (Cummings & Haas, 2011), and may be particularly useful in identifying uncompensated or unrecognized work (Hirway, 2000; Luna, 2016).
The time allocation questionnaire underwent substantial formative development prior to being fielded (see Supplement 6). Once the questionnaire was finalized, it was distributed to the full TTC Network in February 2021. Each TTC was asked to complete two copies of the survey, with one being filled out by the project director and the other by a project manager (or equivalent role). All TTCs responded to the survey between February 2 and February 23. A copy of the full survey instrument is included as Supplement 5.
Survey participants were asked to fill in numeric percentages for the effort allocated to different types of activities based on the following prompt: - Using the broad categories below, please estimate the percentage of time (0%–100%) that your TTC allocated to each category during the: Pre-COVID-19 (i.e., July 2019 through February 2020) time period. ○ Categories included (1) Grant Management, (2) Planning, (3) Communication and Consulting, (4) Technology Transfer Activities, and (5) Local Evaluation, Performance Assessment, and Quality Improvement (all of which are described in Supplement 5).
Respondents were also asked to answer three optional open-ended questions about the study: - Are there any categories of activities that were not included above? If so, please describe here. - Please describe the methods that you used to estimate the overall percentages in the previous questions (this will assist us with aggregating the data meaningfully). - If there is anything else that would help us understand these percentages, please share it here.
Each regional TTC received a time allocation percentage for each of the five categories, computed as the mean values reported by respondents within that TTC. If percentages provided by a participant did not sum to 100% across all categories, they were transformed proportionally to a centile scale. Then, to compute the overall time allocation percentage for each category for the entire TTC Network (excluding the three NCOs), a mean of the average allocation percentages was computed from scores from all TTCs for each category.
Open-ended responses were analyzed using a general inductive method (Thomas, 2006) to identify themes. An inductive approach (moving outward from the particulars) was selected for these responses as the predominant mode of analysis because there was little “theory” involved (Armat et al., 2018), since the open-ended questions were specifically designed to generate better understanding of how TTCs computed their time allocation data. Two study authors (KR and RG) analyzed all qualitative data and generated themes based on the data (i.e., themes did not exist a priori) through inductive coding. The process included iteratively developing and refining themes such that, over the analysis period, a set of categories was derived into which all the different open-ended responses clearly fit. Once the two coders had done so, the remainder of the study team reviewed the data and themes to verify that the open-ended responses fit the themes to which they were assigned, and that no additional themes were warranted (e.g., the analysis was coherent).
Results
CQI Survey
Thematic Categorization of TTCs’ Experiences with CQI
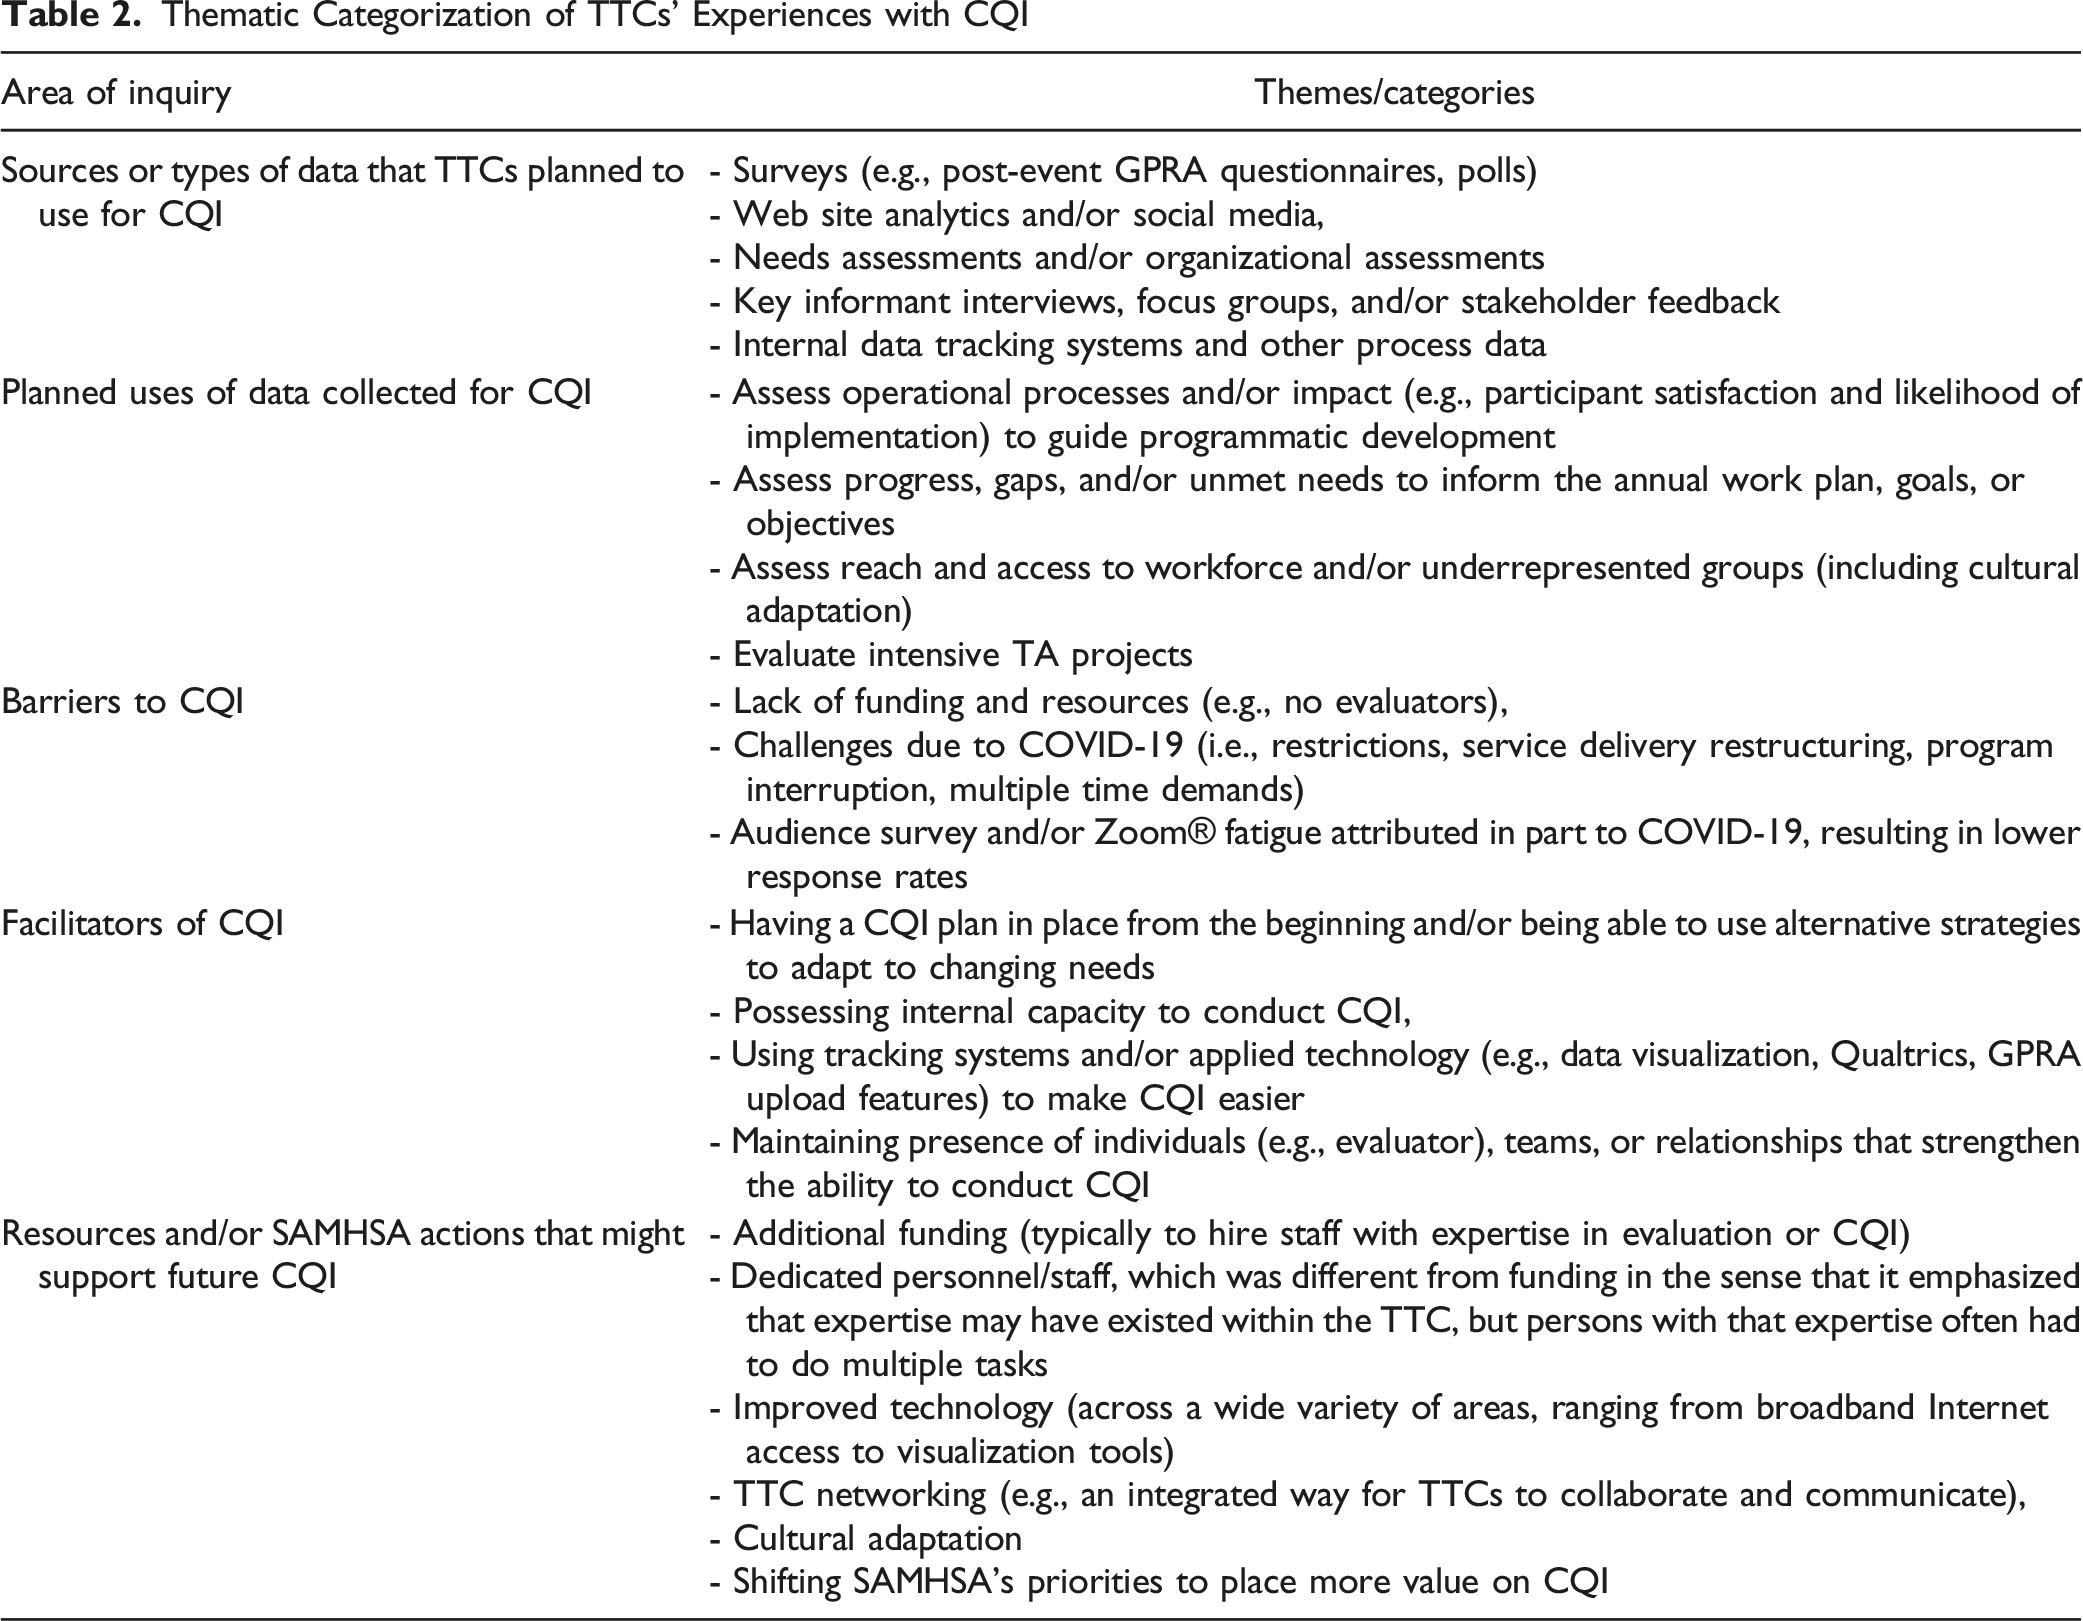
Then, centers that indicated having planned to conduct CQI were asked, “Please list up to five ways you planned to use the data you collected for CQI.” The broad categories of data use are shown in Table 2. Out of 137 reported plans to use collected data, all but five were reportedly used or initiated as planned (96.4% use rate). The same centers were also prompted to describe any other ways they used or began to use data that were collected for CQI during the current grant period. These responses differed from their planned use of data because they often referred to approaches taken to accommodate issues or challenges that arose during the grant period (e.g., the COVID-19 pandemic). The results showed extensive overlap among types of methods and data sources that TTCs planned for CQI.
The most frequently reported barriers to – and facilitators of – evaluation and CQI were categorized into three themes and four themes, respectively, which are shown in the corresponding rows (“Barriers to CQI” and “Facilitators of CQI”) in Table 2. Finally, all the participating centers were asked to list any resources that would support their planning for and conducting CQI activities, followed by a related item about whether there was anything that SAMHSA could do to support their ability to plan for and conduct CQI. The data for these two items were combined and analyzed together due to significant overlapping response content. The items that were listed tended to fall into six distinct categories (see Table 2).
Key Informant Interviews
Beyond the GPRA measures required to be collected as a condition of their awards, TTCs primarily reported collecting and tracking process data (e.g., program planning, performance monitoring, and quality improvement). In addition, a few TTCs noted that they tracked such measures specifically to facilitate data-informed operational decision making. Mechanisms used for process assessment included monitoring adherence to communications plans, using e-mail, Web site, and social media engagement and impression metrics (e.g., view counts of posts), and examining event participation rates. Some TTCs reported analyzing open-ended responses on GPRA forms to inform program planning and improvements, and a few MHTTCs and PTTCs described adding measures to GPRA forms to collect additional data on satisfaction. Several TTCs also collected data to assess outcomes, particularly changes in knowledge, attitudes, and behaviors of participants attending their events. For the most part, TTCs used pre-packaged measures associated with specific EBPs to measure outcomes.
Several ATTCs expressed frustration with the lack of funding for evaluation, noting that the GPRA measures did not capture meaningful data. At least one ATTC had applied for other sources of funding to collect provider-, patient-, and organization-level outcome data. These TTCs variously reported barriers such as: there was “no money” for research or outcome evaluation; it was difficult to do “good” measurement and evaluation without funding and dissemination mechanisms; and SAMHSA was perceived as “very restrictive” in allowing TTCs to allocate only a small portion of their grant awards to evaluation.
GPRA Survey
TTCs’ Perceived Usefulness of GPRA Data for Selected Purposes
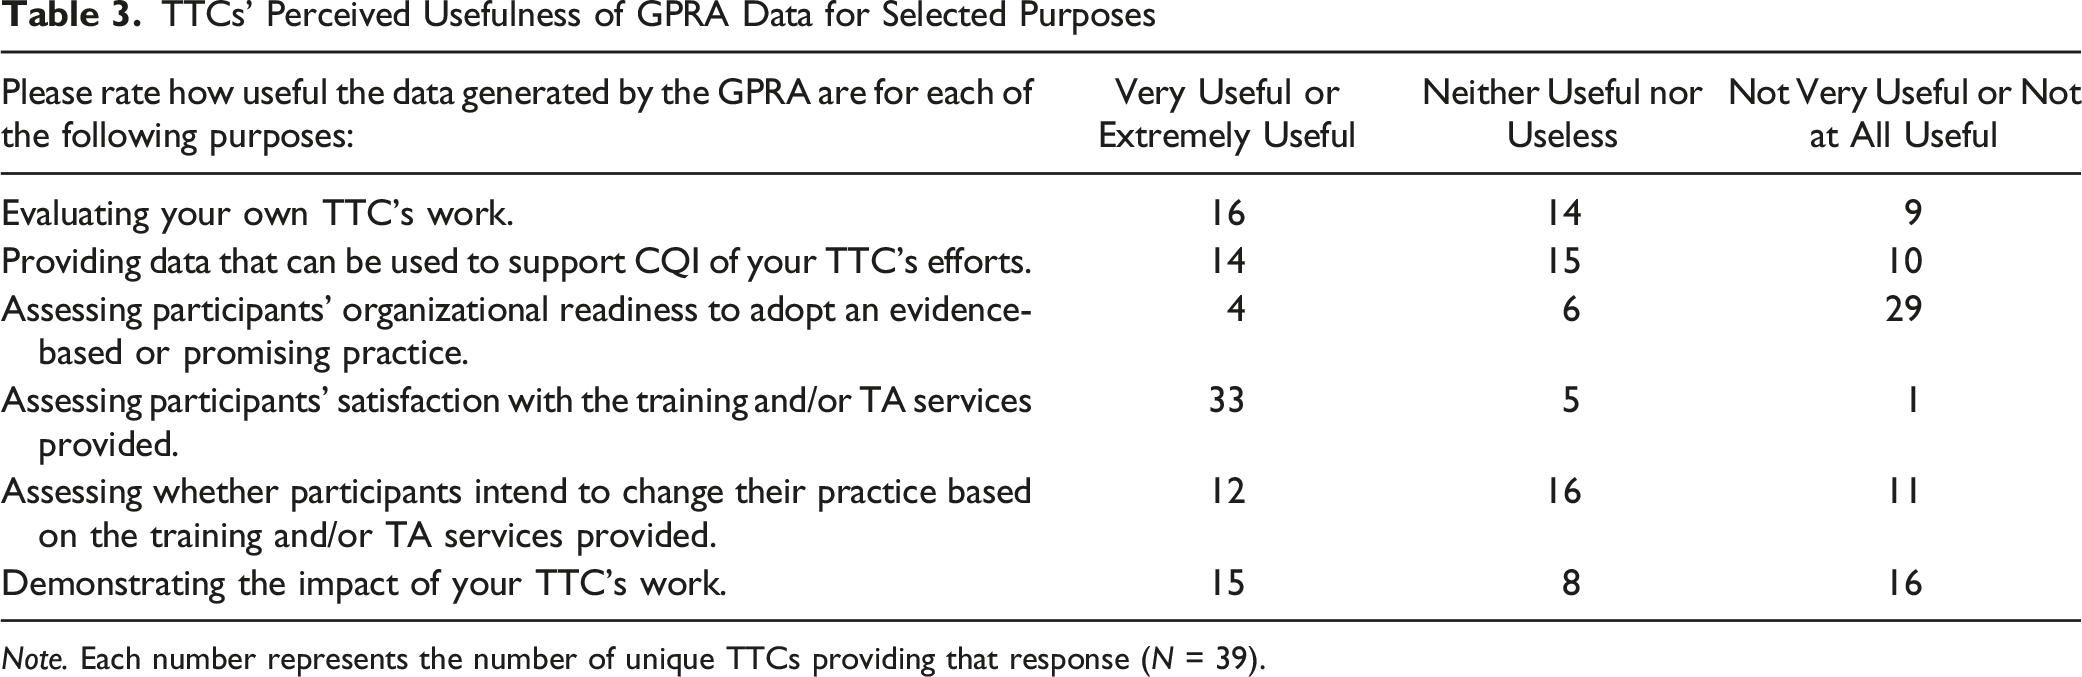
Note. Each number represents the number of unique TTCs providing that response (N = 39).
Qualitative recommendations regarding the changes that might make the GPRA a better tool for generating useful feedback fell into four general themes. (1) Improve the ability to assess the impact of TTCs’ training and TA services: As reflected in the quantitative data, TTCs reported that the GPRA was not especially useful for determining whether their work was accomplishing the intended goals (“…doesn’t assess our impact as a TTC”). (2) Improve the ability to assess [TA/training recipients’] organizational readiness and intention to adopt EBPs: Whether TA recipients are satisfied with the services they receive is important but conceptually different from whether they are ready to adopt the EBP on which they are receiving TA (“…I would like to add questions on readiness to adopt evidence-based practice”). (3) Add more open-ended questions on the Post-Event GPRA: TTCs felt that CQI could be bolstered through open-ended items, such as by obtaining suggestions for future topics or by determining ad hoc needs. It was reported that the previous version of the GPRA (prior to this evaluation) “…included an open-ended question that gave us more insight,” and several TTCs would have preferred that it was retained in the current GPRA tool. (4) Use an entirely different process for evaluation: Some TTCs more directly indicated that they did not feel that the GPRA was appropriate for CQI or evaluation of their work. For example, “…the potential to use the GPRA to gain more useful feedback is extremely minimal. We need an entirely new process.” And similarly, “I’m not sure that revising the current GPRA tool would be helpful. SAMHSA could allow TTCs to focus on more meaningful evaluation that may be specific to each Center.”
Time Allocation Survey
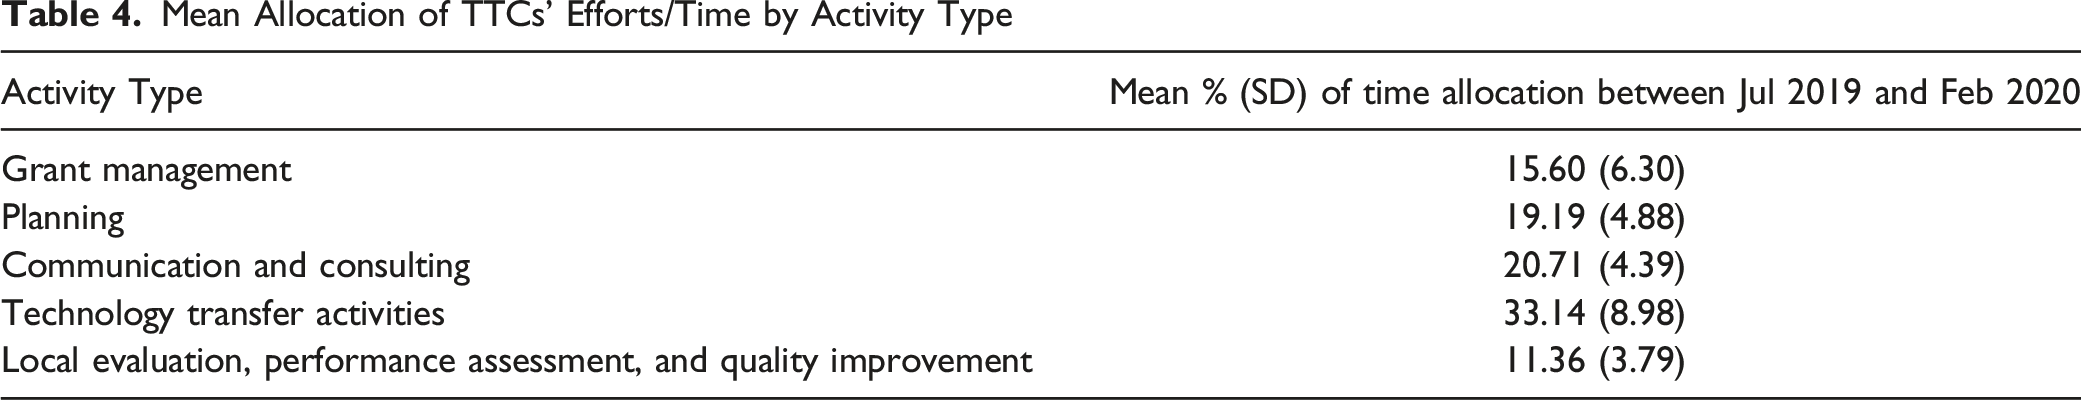
Mean Allocation of TTCs’ Efforts/Time by Activity Type
Most respondents indicated that the activity categories in the survey were sufficiently comprehensive. However, some TTCs indicated that it was difficult to fully separate out estimates of effort because the work is often interconnected across categories. When asked about how they computed their estimates, most TTCs reported that their final estimates were derived from a combination of triangulated approaches and data sources (e.g., time tracking systems, FTE allocation, and job duties). Additional information about how TTCs derived these estimates is available in Supplement 6.
Discussion
This study used a mixed-method, multi-part strategy to examine evaluation and CQI in an active TA/TTC Network with a national scope of practice (i.e., SAMHSA’s TTC Network). The operationalization of CQI in such centers is understudied, and a wide variety of methods or approaches have been used to evaluate TA/TT centers (Scott et al., 2022). We consider our work to be exploratory, both because of the current lack of research literature on CQI in TTCs, as well as the dearth of rigorous, well-established approaches for evaluating CQI in TA/TT centers. At the same time, our efforts are responsive to the recent call for additional mixed-methods study of CQI (Hill et al., 2020) and represent an extensive and diverse set of approaches to understanding CQI processes within the Network.
In the ISF, the EBSIS model accounts for the relations between the Support System and Delivery System and describes CQI as being the tail end of an ongoing, additive, cyclical process that also uses tools, training, and TA to foster improved outcomes (Wandersman et al., 2012). As a high-level concept, CQI reflects “…continuous and ongoing effort to achieve measurable improvements…” (Riley et al., 2010, p. 6). We observed the operationalization of these premises in our evaluation: the TTCs often discussed their intention to conduct CQI “to monitor and improve the quality of support (e.g., tools, training, TA)” (Wandersman et al., 2012, p. 453) being offered as part of the technology transfer process. Indeed, the majority of TTCs reported plans to conduct CQI, and they reported completing nearly all planned data collection activities even though explicit frameworks for CQI were not built into the grant requirements. There was a similarly high (>95%) rate of TTCs using the data they collected, and they often attempted to be responsive to emerging needs by collecting additional data. This information reinforces prior research examining substance use treatment facilities that identified relatively high staff enthusiasm for CQI (e.g., Hunter et al., 2017).
On the other hand, the proportion of effort allocated to CQI/evaluation within TTCs (11.36%) was lower than for other center operations. We were unable to locate any similar estimates for either the SAMHSA TTC Network or any other national TA/TTC system. Further, to our knowledge, there is no recommended or prescribed effort ratio of evaluation/CQI to other activities in a TA/TTC environment. Thus, these numbers exist in somewhat of a vacuum. Setting aside possible reasons for this differential (some of which we discuss subsequently), we don’t definitively know whether ∼11% effort allocation to CQI is sufficient for TTCs, nor is there a basis of comparison for effort allocation by Support Systems to any particular activity category. However, based on the totality of the study data, it seems that TTCs would have welcomed additional resources for CQI and that the current allocation percentage may reflect a pragmatic approach with limited resources rather than an approach using theoretically optimized effort allocation ratios. We believe it is important for future work to study sufficiency and optimization thresholds of time and effort allocation in Support Systems in general, and in TTCs in particular.
TTCs reported multiple barriers to conducting CQI, among which funding and, relatedly, interlinkages with the GPRA tool, were consistently expressed. Many TTCs reported needs for either dedicated evaluation staff members or contractors and discussed concerns about the “soft caps” on the amount of funding that could be allocated to evaluation. Even when TTCs described having ideas for conducting robust CQI, they sometimes found it difficult to execute those plans. At the same time, they generally reported being able to complete at least some of their planned evaluation activities and using the data they collected for CQI (e.g., it was not collected only to go unused). TTCs also perceived that there was an implicit expectation (e.g., through the nature of the funding requirements) that the GPRA tool would foster evaluation and CQI, but in practice, even when the tool was utilized for that purpose, its heuristic value had limited impact for most areas of CQI.
The GPRA items are focused on outputs (e.g., numbers of events and attendees) and selected proximal outcomes (e.g., attendee satisfaction) (SAMHSA, 2022b), which is likely why there was general uniformity in perceiving that it was useful for assessing participant satisfaction. It also may explain why only 10% of TTCs found the GPRA very or extremely useful in assessing organizational readiness to adopt an EBP. At the same time, the ISF emphasizes the importance of organizational readiness in the technology transfer process (Domlyn et al., 2021), suggesting at least one specific concern with relying predominantly on the GPRA for CQI. Without the ability to measure the spectrum of activities being conducted by the Support System, the EBSIS model may nominally be used to illustrate TA/TT processes (e.g., it may appear that CQI is occurring), but the utility of the CQI may be limited. Indeed, we know from this study that much of the effort allocated by TTCs was in categories that cannot be evaluated or measured using participant- and event-level GPRA data. For example, a meaningful percentage (∼16% allocation) of effort was spent on grant management alone (e.g., annual or semi-annual reports, managing contracts, participating in grantee calls), and the processes involved with planning and communicating with stakeholders, taken together, were likewise very effort-intensive (∼40% allocation).
Yet, since collecting GPRA data is a requirement (i.e., GPRA is mandated by federal law), and since resources for evaluation are often sparse within TTCs, use of the GPRA tool may become a de facto primary evaluation/CQI approach. This contrasts with the GPRA’s core role, and articulated intention, as a government-level performance management tool (Breul, 2007). The GPRA laws focus on enabling federal government-wide performance-based budgeting, including involvement by US Congress in funding appropriations (Bruel, 2007); such data tend to be very “high level” (e.g., number of people trained). In evaluation, we might be interested in whether a specific training approach (e.g., case-based learning) for a specific practice (e.g., motivational interviewing) is effective at fostering clinical competency. That question, and the resulting evaluation data, would be many times more granular than what would be included in a budget document. For example, in the fiscal year 2021 budget request from SAMHSA, which is a 363-page PDF, outputs and outcomes from the TTC Networks (ATTC, MHTTC, and PTTC) were allotted around one page each (U.S. Department of Health and Human Services, 2021). There is evidently a fundamental difference between (1) securing data needed to determine that funds have been utilized appropriately and reflect good stewardship (i.e., GPRA) and (2) collecting process and summative evaluation data for CQI to carefully study and improve service delivery. Both types of data collection are important but have very different conceptual orientations and uses. GPRA data are linked to assessment of the funder itself (e.g., SAMHSA) and, as we have noted, are a product of federal law. If limited funding is available to collect data (e.g., to conduct measurement), and if a certain type of data (e.g., GPRA) is required to be collected, then prioritizing the collection of GPRA data is a rational decision.
A seemingly simple solution would be to suggest appending questions to the GPRA (as some TTCs reported doing to greater or lesser degrees) to address concerns about the extent to which it produces information that facilitates TTCs’ CQI/evaluation needs. However, we are unsure whether embedding additional questions alongside the GPRA tool would be an effective solution. The GPRA data have significant implications for budgeting, and ensuring that a minimum percentage of TTC event participants completes GPRA questionnaires (e.g., 80%) is often a key performance indicator for SAMHSA grantees’ continued funding. Adding additional questions or steps to the GPRA procedures for the purposes of CQI may, for instance, reduce rates of participant completion of the GPRA (based on randomized studies of mailed questionnaire length, e.g., Sahlqvist et al., 2011). This would be at odds with grantees’ (and SAMHSA’s) interests in maximizing those rates. Grantees that want to engage in iterative use of CQI as modeled in the EBSIS (Wandersman et al., 2012) using the GPRA may be caught in a proverbial catch-22.
One alternative approach for consideration is for funders to formally and explicitly separate the GPRA and TTC evaluation/CQI, both within the TTC Network and potentially within other federally funded public health TA/TT programs. This could take the form of funding announcements or other documentation delineating the GPRA’s purposes and function, and separately, examples of how grantees might conduct evaluation and CQI. However, for this change to effectively facilitate robust evaluation and CQI, it is likely important that it not be an unfunded mandate (an “unfunded mandate” refers to a “mismatch” between responsibilities and resources [“when finance does not follow function”]) (e.g., Rodriguez-Pose & Vidal-Bover, 2022). Data from this study suggest that TTCs, in general, are already motivated to conduct evaluation and CQI. Further, the CQI activities they undertake, and how they do so, appear somewhat independent from any requirements in the funding opportunity announcements. So, simply adding an explicit, structured requirement for CQI would risk adding a technical “responsibility” without addressing the barriers to conducting CQI that TTCs have articulated. Instead, if SAMHSA were support CQI separately from the GPRA, TTC awards would likely need to incorporate additional funding and resources earmarked for evaluation/CQI to mitigate some of the barriers and resource deficits identified in this study.
Our evaluation also identified several processes or features of the TTC Network that appeared to facilitate TTCs’ CQI activities. Technological improvements and tools, whether generated by SAMHSA, contractors, or internal teams, were perceived as valuable in increasing the efficiency and viability of CQI, as were planning efforts. This is unsurprising, as the conceptual links between CQI and medical informatics have been discussed for decades (e.g., Werth & Connelly, 1992). The current modern computing environment allows for web-based applications to be rapidly developed and used to standardize data collection across a small number of variables with minimal impact on practice (see Agley et al., 2022 for a pilot study incorporating such an approach). This could allow a set of data elements to be agreed upon a priori by the TTC Network and then collected to provide ongoing systematic assessment of key features shared across the Network. For example, regardless of focus area (i.e., mental health, prevention, or addiction), some types of events would likely benefit from data on perceived organizational readiness for implementing change (Shea et al., 2014). While each individual TTC would still collect its own project-informed data for CQI, this would enable a more highly powered, synthesized assessment of Network impact. In other cases, features like “dashboards” were already being used to facilitate cross-TTC assessment that was independent from the GPRA, though dashboards, by their nature, tend to synthesize data after it has been collected. SAMHSA, or any funder of a TA/TT network, might benefit by more comprehensively facilitating the development of evaluation plans and cross-cutting tools, including harmonized data collection procedures and products, during the start-up period of each grant. The funding agency (e.g., SAMHSA) or a contractor could then facilitate connections, shared technology, and other mechanisms to expedite and increase the efficiency of CQI efforts. Such an approach would leverage elements that were perceived as facilitators of CQI while offering an attractive cost/benefit ratio, since the same system(s) could be used across the Network.
Finally, this study may have theoretical implications for the ISF/EBSIS. Potentially the most interesting intersection between our findings and the EBSIS relates to the area of “quality informational tools” (Wandersman et al., 2012, p. 448). Among other types of resources, evaluation data and reports are tools with which decisions can be made during CQI processes. However, the use of tools that are unaligned with the goals of CQI can introduce additional problems. Wandersman and colleagues (2012) describe multiple different ways in which tools might not contribute to CQI, including disorganization, lack of stakeholder input, and an insufficient evidence base. To this list we suggest adding “limited influence of the Support System on the selection of tools that are used for evaluation.” An analogue for this phenomenon exists in individual theories of behavior as the idea of controllability in the Theory of Planned Behavior (Ajzen, 2006). Stated differently, there are sometimes factors outside of the EBSIS (such as funding, at the top of the ISF’s largest circle) that might influence the tools that are used for CQI.
To comply with federal requirements, the GPRA tool is universally used by TTCs; it is not a “bad” tool per se, but it is narrow and does not comport with many of the TTCs’ proposed outcomes. However, its use stems from decisions made multiple levels above the TTCs (i.e., the direct funder, SAMHSA, also is required to adhere to the GPRA). In the introduction to this Special Issue, Wandersman and Scheier raise the “chicken and the egg challenge,” writing, “Generally, funders have not pushed for evidence-based or evidence-informed or even systematic, conceptual approaches to TA in their requests for proposals.” Sometimes, though, it seems that the elements in the periphery of the ISF (i.e., funding, climate, and macro-policy) can meaningfully influence the nature and structure of the bidirectional arrows from the Synthesis and Translation System, Support System, and Delivery System. In such cases, ongoing dialogue between the different Systems is likely important to design CQI strategies within externally-defined parameters or constraints.
Limitations
The current findings and recommendations are limited by the subjective quality of self-report and the potential for social desirability bias (Krumpal, 2013). A simple explanation of this bias is “a tendency for subjects to… overreport behaviors… that make them look good and underreport behaviors… that make them look bad” (Kwak et al., 2021, p. 1). While this evaluation did not ask about “sensitive topics,” per se, all participants were aware that a report would be issued to SAMHSA, their funder, so there was a potential risk of this bias. However, we are fairly confident that its impact on the findings was limited. First, for most components of this study, it is unclear what would be considered “desirable” versus “undesirable” behaviors. As we discussed, there are no established standards for elements like time allocation or the specific conceptualization of CQI used by a TTC (e.g., responses logically cannot be tailored to a standard that does not exist). As we also noted, the primary outcome metrics with which SAMHSA is concerned are the GPRA measures – SAMHSA already had access to these data in full, along with extensive qualitative information from regular meetings and reports from each TTC. We believe that this may have reduced the likelihood of certain socially desirable responses, since TTCs’ “cards were on the table.” Second, some researchers have suggested that a clear and transparent description of the goals of a study (e.g., shared prior to beginning an interview) may mitigate socially desirable responses in some circumstances (e.g., Bergen & Labonté, 2019). Our team used such a procedure not only prior to interviews, but also in an introductory slideshow for all TTCs during which we described our planned work. Third, examination of results using multiple methodologies across five evaluation questions demonstrates a high degree of conceptual convergence for the study conclusions and recommendations. Finally, one way in which we were initially concerned about this bias was the TTCs potentially avoiding offering a balanced take (e.g., pros and cons) on the overall TTC Network program to avoid any perceived critique of their sponsor (i.e., SAMHSA). However, the data here and elsewhere in our evaluation offered both plaudits and critiques of various aspects of TTC Network design and funding structures.
For the CQI survey, review of the open-ended data did not use a formal intercoder reliability analysis because the responses were typically provided as lists or as brief, clear descriptors (e.g., responses to a request to “list or describe” other sources of data). Thus, the two coders were able to achieve full agreement on thematic categorization prior to sharing the results with other evaluators for assessment of face validity. For the time allocation data, one important limitation is the interconnectedness of the activity types about which we inquired. Identifying true effort allocation for these categories is difficult, though we attempted to mitigate this concern by iteratively and carefully generating our categories, collecting data from multiple sources within each TTC, and qualitatively assessing our data from several angles to assess its likely validity.
Our Discussion addresses descriptive and inferential findings from the evaluation and attempts to frame these ideas in a reasonable way, but the process of “thinking out loud” about our findings and deriving implications is inherently subjective. Thus, as with all single studies, all results and recommendations herein should be interpreted cautiously while the evidence base continues to grow.
Conclusion
In our evaluation of a large, national TA/TT network, we observed substantial buy-in for iterative CQI procedures but found that multiple factors, many of which were structural (i.e., outside the purview of a given TTC) limited the degree to which TTCs could fully recognize the potential of CQI to support movement of innovations from the Support System to the Delivery System. While the concepts of the ISF and EBSIS were borne out in theory, the real-world details of CQI often introduced extensive variability. Because they are some of the top-line stakeholders, funders of TA/TT systems might want to consider additional investment in research and evaluation of how CQI functions, such as “holding all else constant” types of randomized trials of specific elements of CQI. In addition, targeted outcomes of future cross-site evaluations could reasonably extend beyond TTCs to directly study Delivery Systems (e.g., TA recipients). While such evidence is being developed, SAMHSA and TTCs will likely benefit from collaboratively discussing the ideas we present herein in constructing evaluation strategies, funding announcements, and other plans.
Footnotes
Acknowledgments
We would like to thank all other members of the TTC evaluation team for their support of this project.
Author Contributions
Conceptualization: JA, RG, KR, JR, SKRH; Methodology: JA, RG, KR, SKRH, GC; Validation: LGA; Formal Analysis (Quantitative): JA; Formal Analysis (Qualitative): KR, RG, SKRH, GC; Investigation: KR, RG, JA, JR, SKRH, GC; Data Curation: JA, KR; Writing – Original Draft: JA, RG; Writing – Review and Editing: JA, RG, KR, JR, SKRH, GC; Supervision: RG, SKRH; Project Administration: KR; Funding Acquisition: JA, RG.
Declaration of Conflicting Interests
The author(s) declared the following potential conflicts of interest with respect to the research, authorship, and/or publication of this article: JA, KR, RG, and SKRH have, at various times, received funding from the Substance Abuse and Mental Health Services Administration (SAMHSA) through their workplaces to conduct public health projects. Though the overall evaluation was participatory in nature, SAMHSA did not review or exert any control over the content of this paper. Portions of this paper were submitted to SAMHSA’s leadership team in 2022 in unredacted form as part of a much larger document that comprised the final grant deliverable for TI082543, though that report will not be published or made public. None of the authors received feedback on that report that would influence this publication.
Funding
The author(s) disclosed receipt of the following financial support for the research, authorship, and/or publication of this article: This project was supported by a grant from SAMHSA TI082543 awarded to authors JA and RG.