
Abstract
The current study aimed at investigating the two sources of construct-relevant psychometric multidimensionality of the Nomophobia Questionnaire (NMP-Q), applying the newly developed bifactor exploratory structural equation modeling (B-ESEM) approach. We first contrasted several CFA and ESEM models to test the psychometric multidimensionality due to the fallibility of indicators. Then, we compared the first-order structures with those specifying both global and specific factors to test the coexistence of hierarchically ordered factors. Results from 469 participants to the 20-item questionnaire showed the superiority of a B-ESEM representation with a well-defined G-factor and four weaker S-factors. On a methodological level, our findings provide additional support for the utility of using B-ESEM’s integrative perspective to better capture the complexity of multidimensional constructs.
Keywords
Nomophobia (no-mobile-phone phobia) is a relatively new term and it refers to a sense of discomfort, anxiety, and nervousness stemming from being without a smartphone, becoming unable to communicate through a mobile device, being unable to obtain information through the Internet, and giving up the convenience that smartphones provide (Yildirim & Correia, 2015). People with severe nomophobia show an irrational fear of being without their smartphones; they become extremely anxious in the absence of their own smartphones or when the battery dies. Nomophobia has been classified as a form of situational phobia, and several calls have been made for its inclusion in the fifth edition of the Diagnostic and Statistical Manual of Mental Disorders (Bragazzi & Del Puente, 2014). Indeed, these authors highlighted the relevance of examining this modern disorder more in depth, considering its consequences on individuals’ daily lives and well-being, as well as its comorbidities with other psychiatric diseases, such as anxiety and panic disorder, depression, obsessive-compulsive disorder, and substance and behavioral addictions. Nomophobia has been linked to smartphone and Internet addiction (Forgays et al., 2014), due to the prevalent use of smartphones to access the Internet (such as for social media, watching videos, and searching for information on the web). From this perspective, some studies have shown that these disorders often coexist (Gezgin, et al., 2018). In addition, the recent and ongoing literature on nomophobia has also reported associations with other external variables, such as difficulty in emotion regulation (Santl et al., 2022; Valenti et al., 2022), loneliness (Arpaci, 2022; Gezgin, Cakir, & Yildirim, 2018; Valenti et al., 2022), social interaction anxiety (Bulut & Sengul, 2023; Valenti et al., 2022), and other physical and mental health problems (Rodríguez-García et al., 2020), evidencing linkages between this emerging construct and several aspects of poor psychological well-being. For these reasons, the evaluation of nomophobia in health professions is relevant in clinical settings and it represents a significant topic of investigation in this era.
Given that the interest in this novel construct is ever-increasing, it is necessary to rely on robust psychometric measures for its assessment. The Nomophobia Questionnaire (NMP-Q) (Yildirim & Correia, 2015) is undoubtedly the most widely used scale to measure nomophobia and numerous studies have demonstrated its adequate psychometric properties. However, several issues can be mentioned that make the underlying structure of the questionnaire somewhat unclear and not perfectly stable. The following sections provide an overview of these concerns, together with a proposal for a new perspective to examine the latent factor dimensionality of the scale. Relying on strong and powerful analytic strategies is not merely linked to a methodological perspective; it may rather be useful for a deeper comprehension of psychological phenomena (Faraci et al., 2013; Triscari et al., 2011). This is particularly true for nomophobia, a novel construct whose conceptualization is under development.
The Nomophobia Questionnaire (NMP-Q): Findings From Previous Factor Analysis Studies, Issues, and New Perspectives
Yildirim and Correia (2015) made the first attempt to evaluate nomophobia using a self-reported measure with the development of the Nomophobia Questionnaire (NMP-Q). These authors qualitatively explored the dimensions of nomophobia using a mixed-method research design, suggesting that it should be conceptualized as a multidimensional concept comprising four different facets: (a) not being able to communicate, (b) losing connectedness, (c) not being able to access information, and (d) giving up convenience. The application of Principal Component Analysis (PCA) on the 20 items of the questionnaire supported the four-factor oblique model, and each item reported factor loadings greater than .45 on its target factor (see Table 3 in Yildirim & Correia, 2015). The NMP-Q was later translated into other languages, adapted, and validated in several countries, showing a relatively stable factor structure. However, some studies provided evidence of slightly different factor solutions or the existence of a higher factor model with four first-order factors (for a detailed review, please see Table S1 in the Supplemental Materials).
Overall, even if previous studies on NMP-Q evidenced reasonable support for the theorized four-factor model and the hierarchical model with four first-order factors, this support is not consistent and robust enough. Thus, additional research is needed and highly desirable in this area to better understand the factor structure of the questionnaire. Particularly, we argue that a common issue in the existing factor analytic studies on the NMP-Q was the application of traditional analytic strategies, such as Exploratory Factor Analysis (EFA), Principal Component Analysis (PCA), and Confirmatory Factor Analysis (CFA), underestimating their drawbacks. Indeed, in EFA and PCA, whose approaches are data-driven, the interpretation of factors may be difficult through labels; in addition, it is not viable to compare competing models or different samples (Mai et al., 2018). On the other hand, CFA posits that all items have zero factor loadings on all factors other than the one they are designed to measure. Such a restriction is considered highly constraining (Marsh et al., 2009, 2014), as items are seldom pure indicators of a single subscale; rather, they can overlap and associate with other conceptually related constructs (as in the present case). The “pure factors” are idealistic and artificially unrealistic in psychological research. Therefore, it is likely that items tend to have small residual associations with other related factors (Asparouhov & Muthén, 2009; Morin, Arens, Tran, et al., 2016), suggesting the need to consider cross-loadings. In relation to the NMP-Q, in the initial scale development and validation study, except for items 1, 2, 8, and 19, which showed two significant cross-loadings, all items reported cross-loadings on all the other non-target factors ranging from .100 to .425 (see Table 3 in Yildirim & Correia, 2015). Small to medium cross-loadings were also found in the other NMP-Q validation studies (Adawi et al., 2018; Al-Balhan et al., 2018; Coenen & Görlich, 2022; da Silva et al., 2020; Ma & Liu, 2021), and Gonzáles-Cabrera et al. (2017) even indicated saturations on the non-designed factors greater than .700 (see Table 3 in Gonzáles-Cabrera et al., 2017). Taken together, these findings seem to highlight that earlier NMP-Q study validations neglected to consider the fallible nature of the items, as they included some degree of relevant associations with constructs other than the main construct they were intended to measure. When cross-loadings are constrained to be zero in CFA, the only way for them to be expressed is through the inflation of factor correlations, which, consequently, produce inadequateness in factor distinctiveness (Marsh et al., 2009, 2014). Indeed, some previous studies reported correlations between the NMP-Q factors ranging from .58 to .82 (Al-Balhan et al., 2018; da Silva et al., 2020; González-Cabrera et al., 2017; Ma & Liu, 2021), thus evidencing that earlier NMP-Q models cannot discriminate between factors adequately. These findings seem to suggest that an Exploratory Structural Equation Modeling (ESEM) approach to examine the latent structure of the NMP-Q may be appropriate. The key component of the ESEM framework (Marsh et al., 2009, 2014) consists in integrating the ability to evaluate cross-loadings (typical of EFA) with a theory-based approach (typical of CFA), and there is a growing literature (Morin, Arens, & Marsh, 2016) evidencing its promising and fruitful advantages in assessing the psychometric properties of several multidimensional scales over the traditional analytic procedures (i.e., EFA and CFA). Given the fallible nature of items as pure indicators of constructs (Asparouhov & Muthén, 2009), the ESEM approach seems to be a suitable analytic strategy in psychological measurement because it combines the best features of EFA and CFA in terms of flexibility and methodological robustness, while providing more realistic and less biased results (Marsh et al., 2009, 2014).
The coexistence of a general factor along with specific factors is a further issue in nomophobia assessment. Indeed, some scholars showed that a hierarchical model with one second-order factor explaining the four first-order nomophobia factors best fitted to their data (Caba-Machado, Díaz-López, et al., 2023; Coenen & Görlich, 2022; Galhardo et al., 2020; Galhardo et al., 2022; Gnardellis et al., 2023; León-Mejía et al., 2021). Nevertheless, some authors argued against the application of higher-order models in construct-relevant psychometric multidimensionality because in such models the associations between each indicator and the higher-order factor(s) are not direct but rather mediated by the first-order factors, a stringent assumption that is almost never empirically verified (Gignac, 2016; Howard et al., 2018; Tóth-Király et al., 2018). On the other hand, in bifactor models, the associations between general and specific factors are direct, meaning that all indicators load on one general factor (G-factor) and one specific factor (S-factor), and items’ variance is partitioned into three sources: (a) the specific factor, (b) the general factor, and (c) the measurement error. For these reasons, they suggested that, unless there is a strong theoretical justification for a higher-order representation, bifactor models should be preferred.
Regarding the Italian context, Adawi et al. (2018) partially replicated the scale’s original factor structure. Indeed, their findings suggested a three-factor structure, and items belonging to the factors of losing connectedness and giving up convenience were combined into a unique single factor. Moreover, they did not perform Confirmatory Factor Analyses (CFA), indicating that the structural validity study remains incomplete.
The Exploration of the Two Sources of Construct-Relevant Psychometric Multidimensionality of the NMP-Q: The Integrated Framework of Bifactor ESEM
As described in the previous section, past NMP-Q validation studies have evidenced that both sources of construct-relevant psychometric multidimensionality may exist. Thus, a comprehensive evaluation of the NMP-Q factor structure should not neglect either the issue of the indicator fallibility or the coexistence of global and specific factors. With the inclusion of cross-loading evaluation, the ESEM models can account for psychometric multidimensionality due to item fallibility. Nevertheless, they ignore the presence of hierarchically superior constructs, which may be expressed through inflated cross-loadings. On the other hand, bifactor (or hierarchical) models, which consider the existence of both general (G) and specific (S) factors, overlook item cross-loadings, which, in turn, may be expressed through the inflation of the variance attributed to the G-factor.
Some authors (Morin, Arens, & Marsh, 2016; Morin, Arens, Tran, et al., 2016) have recently suggested an integrative framework that accounts for the two sources of construct-relevant psychometric multidimensionality simultaneously: the Bifactor ESEM approach (B-ESEM). As a result, B-ESEM models may be useful for describing complex constructs due to their ability to fully capture the hierarchical and multidimensional nature of the scales, also providing an added value over the alternative CFA, ESEM, and bifactor CFA models. In summary: (a) unmodeled cross-loadings lead to inflated factor correlations in CFA or inflated G-factor loadings in bifactor CFA; (b) unmodeled G-factor leads to inflated factor correlations in CFA or inflated cross-loadings in ESEM (Tóth-Király et al., 2018).
The Current Study
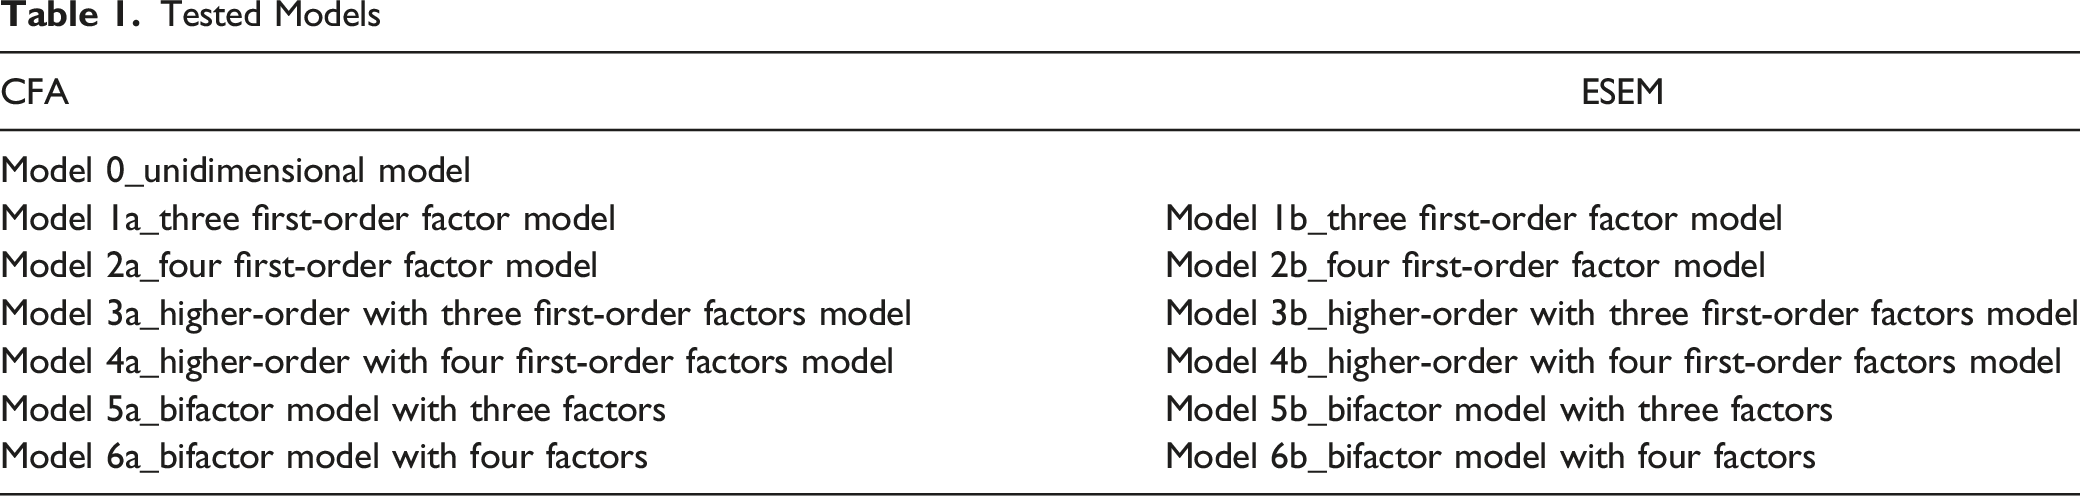
Tested Models
Method
Participants and Procedure
We administered surveys online through Amazon Mechanical Turk. We asked participants to provide information about several demographic variables and answer a set of questionnaires. We included the following inclusion criteria: (a) being >18 years old; (b) Italy as a location; and (c) a HIT approval rate > .90. The Internal Review in Psychology of XXX (UKE-IRBPSY-11.21.01) approved this research project. We informed participants that we would use the collected data for research purposes and analyze them collectively, and we also guaranteed the responses’ anonymity. The sample was composed of 469 participants (53.6% men), whose ages ranged from 18 to 76 (M = 32.2; SD = 11.5). We retained the entire sample for subsequent analyses because participants provided <.5% of missing data for the investigated variables. We handled missing data with the mean-imputation technique, an adequate procedure to be applied when the percentage of missing data is low and when data are missing completely at random (Cook, 2021). To estimate the sample size’s adequacy for conducting a confirmatory factor analysis, we followed several general recommendations. For instance, some authors have suggested that a minimum sample size of 300 is required for a measure with up to 20 items (DeVellis & Thorpe, 2021). We followed another recommendation regarding the ratio of the number of people (N) to the number of observed variables (p), with the recommended ratio of 10 cases per indicator variable (Wang & Wang, 2019). Therefore, with 469 participants and a 20-item measure, we achieved the minimum required sample size. Further, also taking into account the N/p, the suggested ratio was satisfied. We calculated the minimum required sample size for ESEM estimation a priori (Christopher Westland, 2010; Cohen, 2013; Soper, 2022): For a medium effect size (i.e., .3), a desired statistical power level of 80%, a confidence interval of 95%, and the most extensive model among those provided (i.e., 20 observed variables and five latent factors; it refers to bifactor models with four first-order factors), the recommended minimum sample size was 150.
Instruments
Nomophobia Questionnaire
The Nomophobia Questionnaire (NMP-Q; Yildirim & Correia, 2015) is a 20-item measure including four subscales: (a) Not Being Able to Communicate, which describes feelings of worry or anxiety related to the inability to communicate with other people (e.g., “If I did not have my smartphone with me, I would feel anxious because I could not instantly communicate with my family and/or friends”); (b) Losing Connectedness, which refers to feelings of nervousness, anxiety, or awkwardness from being disconnected from one’s online identity (e.g., “If I did not have my smartphone with me, I would be uncomfortable because I could not stay up-to-date with social media and online networks”); (c) Not Being Able to Access Information, which involves feelings of discomfort, annoyance, or tenseness when searching for information on Internet is not possible (e.g., “If I did not have my smartphone with me, I would be annoyed if I could not look information up on my smartphone when I wanted to do so”); (d) Giving up Convenience, which includes items concerning feelings of anxiety, panic, or fear related to the loss of the benefits that smartphones provide (e.g., “If I could not use my smartphone, I would be afraid of getting stranded somewhere”). Items are scored on a 7-point Likert scale (from 1 = strongly disagree to 7 = strongly agree), and higher scores denote greater levels of nomophobia. NMP-Q scores are interpreted as follows: A score of 20 reflects the absence of nomophobia; NMP-Q scores between 20 and 59 indicate mild nomophobia; NMP-Q scores between 60 and 99 indicate moderate nomophobia; and NMP-Q scores higher than 100 correspond to severe nomophobia. The NMP-Q displayed good levels of internal reliability in the original study (α > .82; Yildirim & Correia, 2015). In the current study, we used the Italian version adapted by Adawi et al. (2018).
Depression, Anxiety, and Stress
The Italian adapted version of the Depression Anxiety and Stress-21 was used to assess symptoms of depression, anxiety, and stress (Bottesi et al., 2015). It is a 4-point Likert scale (from zero = did not apply to me at all to 3 = applied to me very much, or most of the time), composed of 21 items distributed into three subscales: Depression, Anxiety, and Stress. The level of internal consistency was excellent in each subscale (Depression: α = .91, ω = .91; Anxiety: α = .90, ω = .91; Stress: α = .89, ω = .89).
Social Interaction Anxiety Scale
The Italian version of the Social Interaction Anxiety Scale (Sica et al., 2007) was used to assess the levels of anxiety when individuals engage in social interactions. It is composed of 19 items and uses a 5-point Likert-type scale (from zero = not at all to 4 = extremely). Higher scores indicate greater levels of social interaction anxiety. The level of internal consistency for the current study sample was excellent (α = .92, ω = .93).
Data Analyses
Alternative Models
As a preliminary step, we checked items’ distribution by inspecting skewness and kurtosis statistics, which were regarded as indicative of a violation of the assumption of normality if >|1| and |3|, respectively. All analyses were conducted using Mplus 7 (Muthén & Muthén, 1998) and estimated using the robust maximum likelihood estimator (MLR), which provides standard errors and tests of model fit that are robust to the non-normality of the data and to the reliance on a five-point Likert scale.
First, we evaluated and contrasted a series of CFA and ESEM models: (a) one factor CFA (Model 0); three first-order CFA (Model 1a); four first-order CFA (Model 2a); higher-order CFA with three first-order factors (Model 3a); higher-order CFA with four first-order factors (Model 4a); bi-factor CFA with three first-order factors (Model 5a); bi-factor CFA with four first-order factors (Model 6a). For the unidimensional model (Model 0), all items were specified to load on a single nomophobia factor. For Model 1a and Model 2a, each item was specified to load on the factor it was intended to measure, with factor correlations freely estimated. For Model 3a and Model 4a, the first-order factors were specified as being related to a single higher-order CFA factor, with no correlations between the first-order factors. For Model 5a and Model 6a, all items were allowed to load on one G-factor as well as on one of the S-factors simultaneously, with no correlations between the G-factor and the S-factors. The same pattern of item-factor loading was then specified for ESEM models (Model 1b, Model 2b, Model 3b, Model 4b, Model 5b, and Model 6b). ESEM and B-ESEM solutions were rotated using target and bifactor target rotation, respectively, with all cross-loadings targeted to be as close to zero as possible (Asparouhov & Muthén, 2009). This rotational procedure allows us to rely on a fully “confirmatory” approach when estimating ESEM factors, providing a stronger a priori model, greater control in specifying the model, and an easier interpretation of the results (Marsh et al., 2014). Target rotation was used as there is a priori knowledge of the factor structure of the scale. For higher-order ESEM models (Model 3b and Model 4b), the ESEM-within-CFA approach was used.
Model Evaluation
Given the known oversensitivity of the chi-square test of exact fit, we relied on common goodness-of-fit indices and information criteria: the comparative fit index (CFI), the Tucker-Lewis Index (TLI), and the root mean square error of approximation (RMSEA). Following the typical interpretation guidelines (Hu & Bentler, 1999; Marsh et al., 2004, 2005), values greater than .90 and .95 for the CFI and TLI are indicative of adequate and excellent fit to the data, respectively, whereas values smaller than .08 or .05 for the RMSEA support acceptable and excellent model fit, respectively. In addition, although the information criteria (AIC, BIC, and aBIC) do not describe the fit of a model, lower values indicate a better fit. It is noticeable to remember that, although these conventional criteria have been widely used in previous ESEM applications (Morin, Arens, & Marsh, 2016; Tóth-Király et al., 2018), these descriptive guidelines have been established for CFA. However, because ESEM models include more parameters than CFA models, some authors (Marsh et al., 2009; Marsh et al., 2010; Marsh et al., 2014; Morin, Arens, & Marsh, 2016; Morin, Arens, Tran, et al., 2016) suggested that indicators incorporating a correction of parsimony (i.e., TLI, RMSEA, AIC, BIC, aBIC) are fundamental for the assessment of model fit in an ESEM context. Further, some authors suggested that the examination of goodness-of-fit and information criteria is not sufficient to choose the best representation of the data because these indices often provide similar levels of model fit (Marsh et al., 2011; Morin, Arens, & Marsh, 2016; Morin, Arens, Tran, et al., 2016). They highlighted that goodness-of-fit indices should be considered as rough rules for descriptive model evaluation, and comparisons should also take into account additional information derived from parameter estimation, statistical conformity, and theoretical meaningfulness (Marsh et al., 2004, 2005). These authors indicated that the first step in model evaluation should begin with a comparison between the CFA and ESEM measurement models. In this comparison, as long as the factors are well defined by strong target factor loadings, the inspection of factor correlations represents the key issue. However, based on statistical evidence showing that ESEM provides a better representation of the true correlations between factors (Asparouhov & Muthén, 2009), ESEM solutions should be retained whenever the estimated interfactor correlations are substantially reduced compared to their contrasting CFA models. Otherwise, the CFA models should be chosen based on parsimony (Marsh et al., 2009). The second stage consists in contrasting the retained ESEM or CFA solution with its hierarchical and bifactor counterpart. The crucial element of this second comparison is the inspection of how the G-factor and S-factors are well-defined: (a) A bifactor model should be chosen when a G-factor is well defined by strong factor loadings, along with some well-defined S-factors; (b) A B-ESEM should be favored if the G-factor is well defined by strong factor loadings and with reduced cross-loading compared to ESEM. The hierarchical solution should be chosen over the bi-factor model only if it provides a better representation of the data. If not, the bi-factor solution is to be preferred (Gignac, 2016).
After the best-fitting model was selected, we tested the level of reliability by evaluating McDonald’s omega (ω), and values greater than .70 were indicative of a good level of reliability (Hayes & Coutts, 2020). McDonald’s ω is to be preferred to the well-known and widely used Cronbach’s alpha (α) because this latter is based on assumptions that are hardly ever met in empirical research, such as tau-equivalence (i.e., equivalence of factor loadings), continuous items with normal distribution, uncorrelated errors, and unidimensionality (Hayes & Coutts, 2020; McNeish, 2018). Notably, if a bi-factor model is retained, additional indicators of reliability are required: (a) the four Ω coefficients; (b) the explained common variance (ECV); (c) the item-level ECV (IECV); and (d) the percentage of uncontaminated correlations (PUC). The omega (ω) and omega subscale (ωs) provide information about the reliability of the total scale and subscales, respectively; the omega hierarchical (ωH) and omega hierarchical subscale (ωHS) assess the reliability of the G-factor and S-factors, respectively, after adjusting and portioning out the G-factor (Rodriguez et al., 2016). High values of ωH (e.g., >.80) along with low values of ωHS (i.e., <.50) provide support for the higher level of reliability of G-factor than the S-factors. ECV values greater than .80 on the G-factor (and smaller S-factor ECVs), as well as PUCs greater than .70, suggest that the measure is sufficiently unidimensional (Schmitt et al., 2018; Stucky & Edelen, 2014). The bi-factor reliability indices were computed with Dueber’s calculator (2017). In the second phase of analyses, in order to investigate the validity of test scores interpretations, we specified a latent variable model (LVM) and assessed the relations of the NMP-Q scores, based on the retained measurement solution, with some related constructs (i.e., depression, anxiety, stress, and social interaction anxiety). Each external variable was specified as unidimensional and included in the multivariate model.
Results
Preliminary Analyses
The inspection of item descriptives showed that the values of skewness and kurtosis fell within the recommended cutoff criteria (−.44 < S <.69; −.1.14 < K < −.53), indicating that the univariate distribution was accomplished (see Table S2 in the Supplemental Materials). Then, we estimated the multivariate normality by calculating the Mahalanobis’s distance, which showed the presence of several multivariate outliers (n = 21).
Model Estimation and Comparisons Between Models
Estimated Models
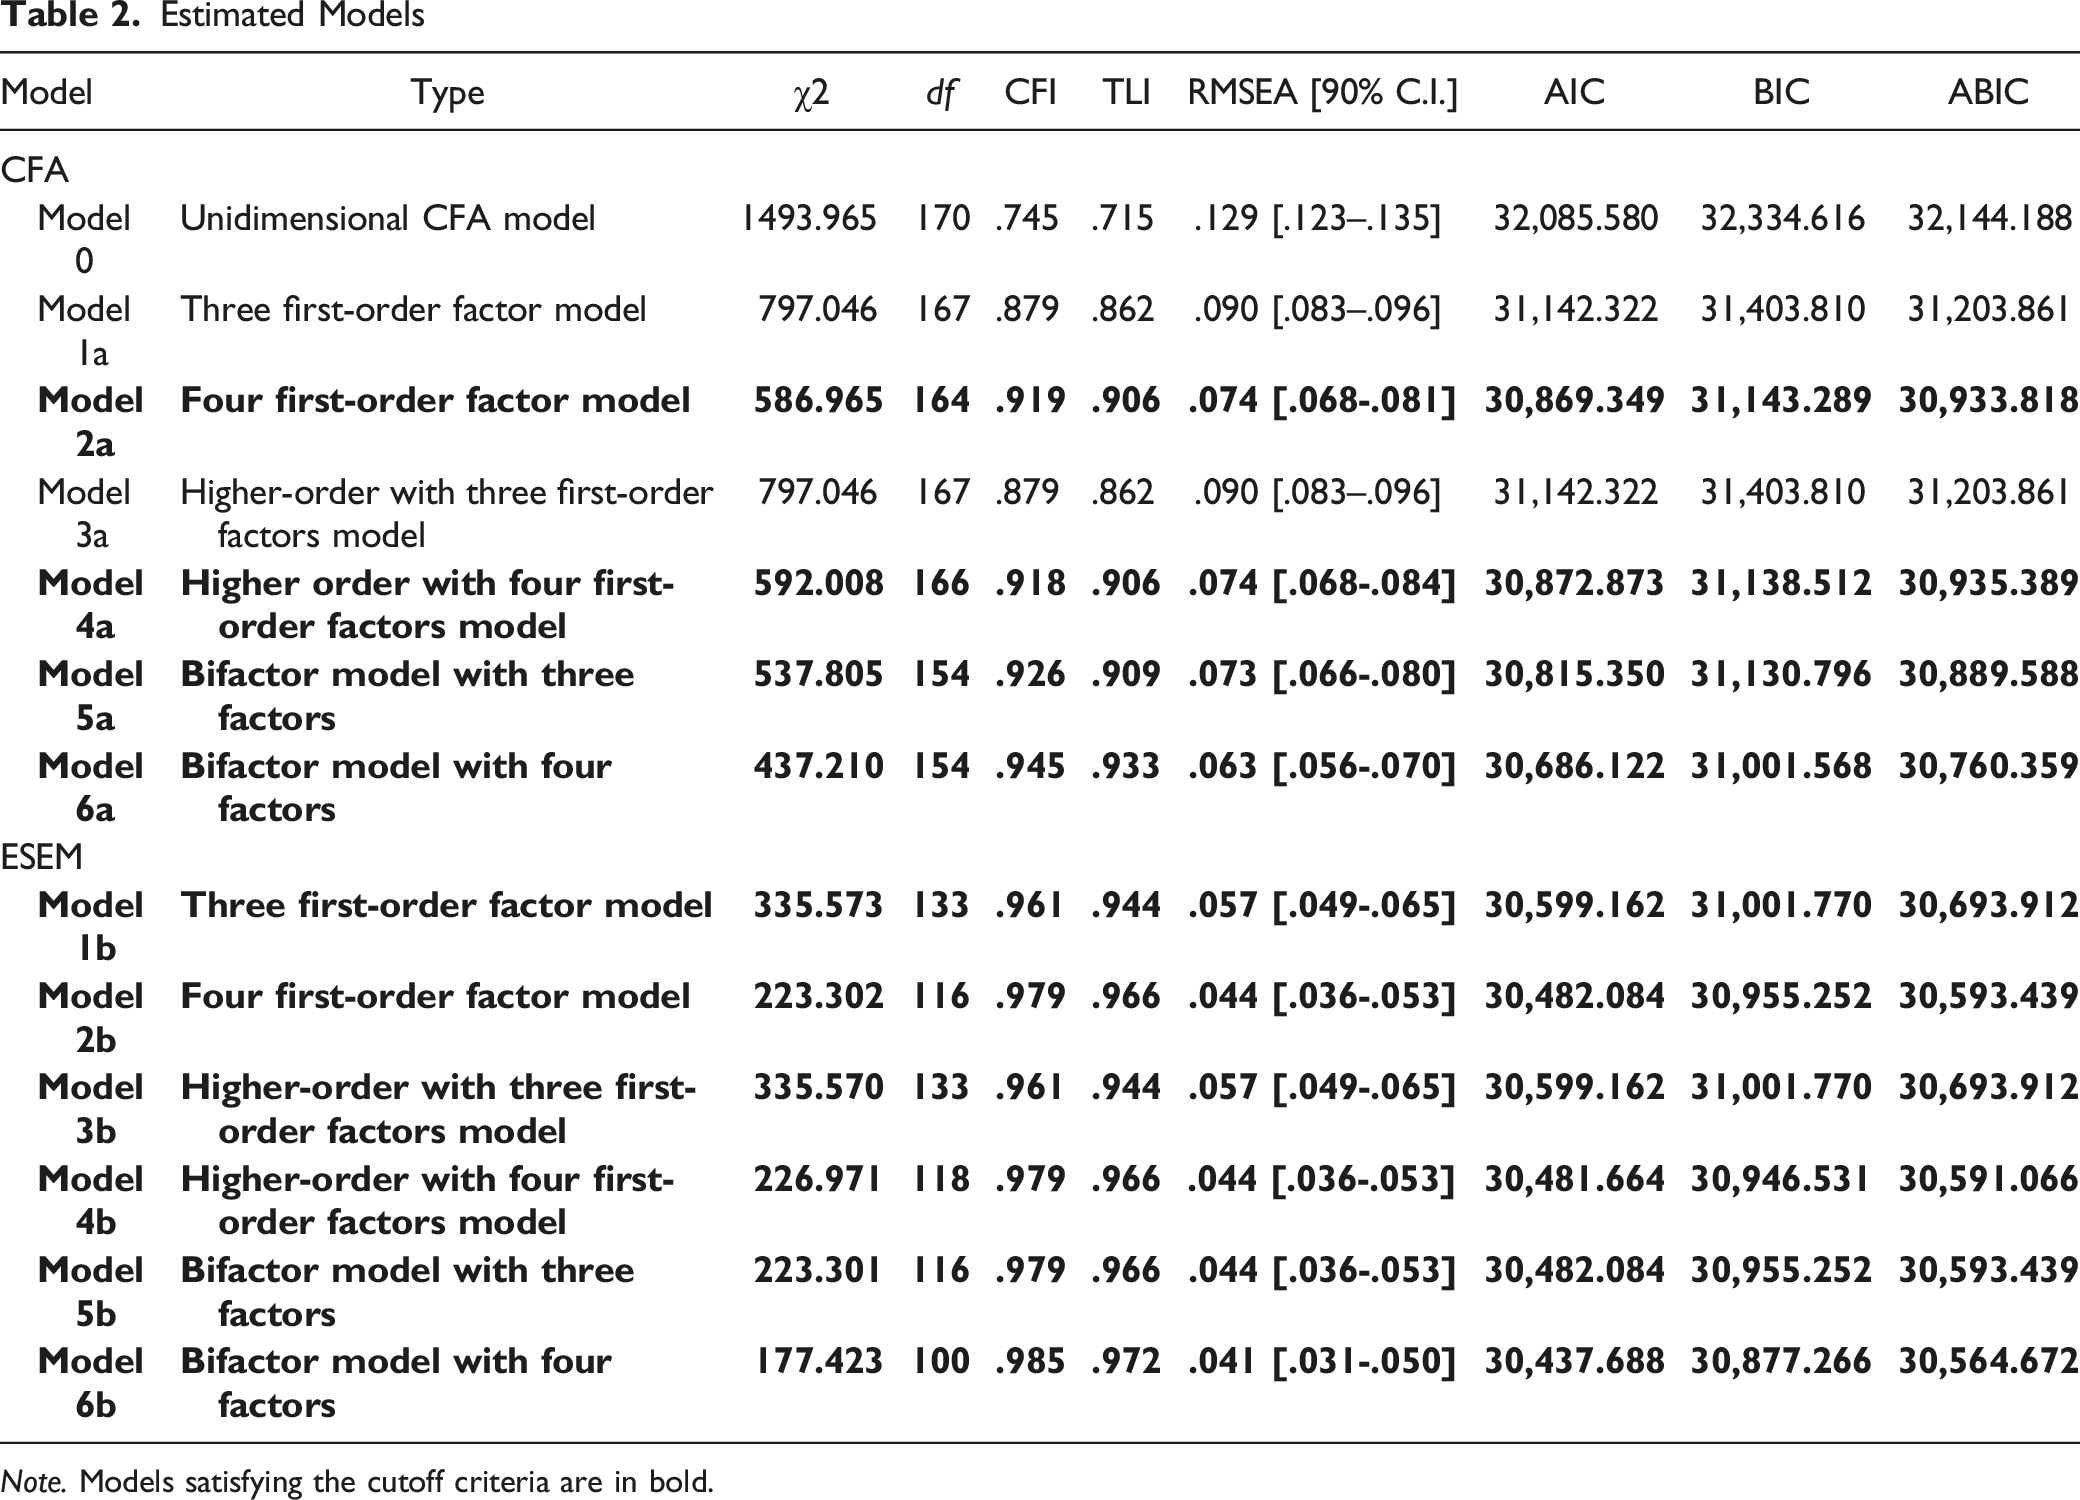
Note. Models satisfying the cutoff criteria are in bold.
Examining the First Source of Construct-Relevant Psychometric Multidimensionality: The Fallible Nature of Items as Pure Indicators
Standardized Factor Correlations for the CFA and ESEM Solutions (Four Factors)
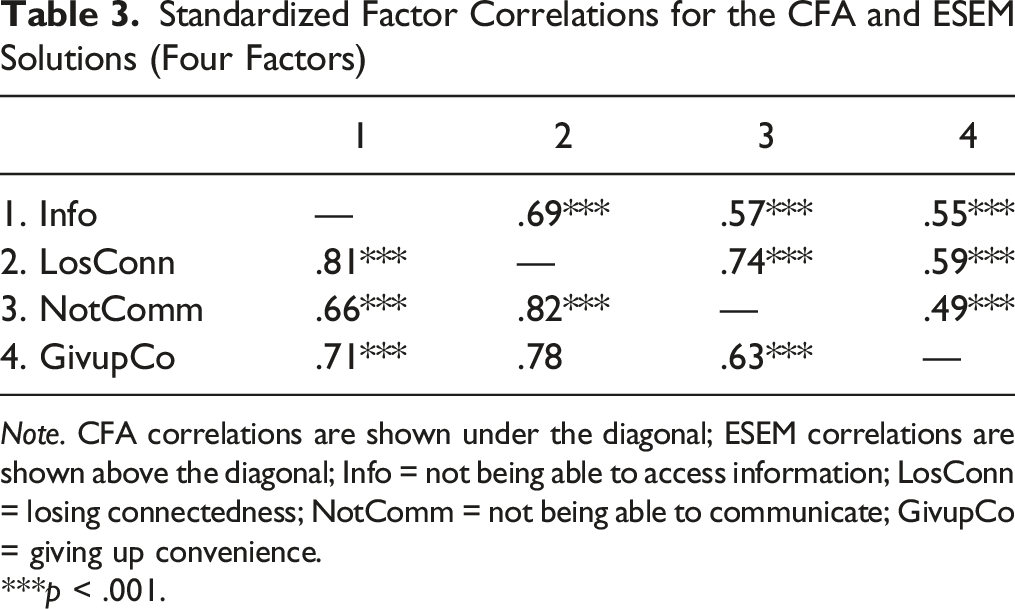
Note. CFA correlations are shown under the diagonal; ESEM correlations are shown above the diagonal; Info = not being able to access information; LosConn = losing connectedness; NotComm = not being able to communicate; GivupCo = giving up convenience.
***p < .001.
Measurement Quality Indicators for the Four-First Order Factor CFA and ESEM Models (Model 2a and Model 2b)
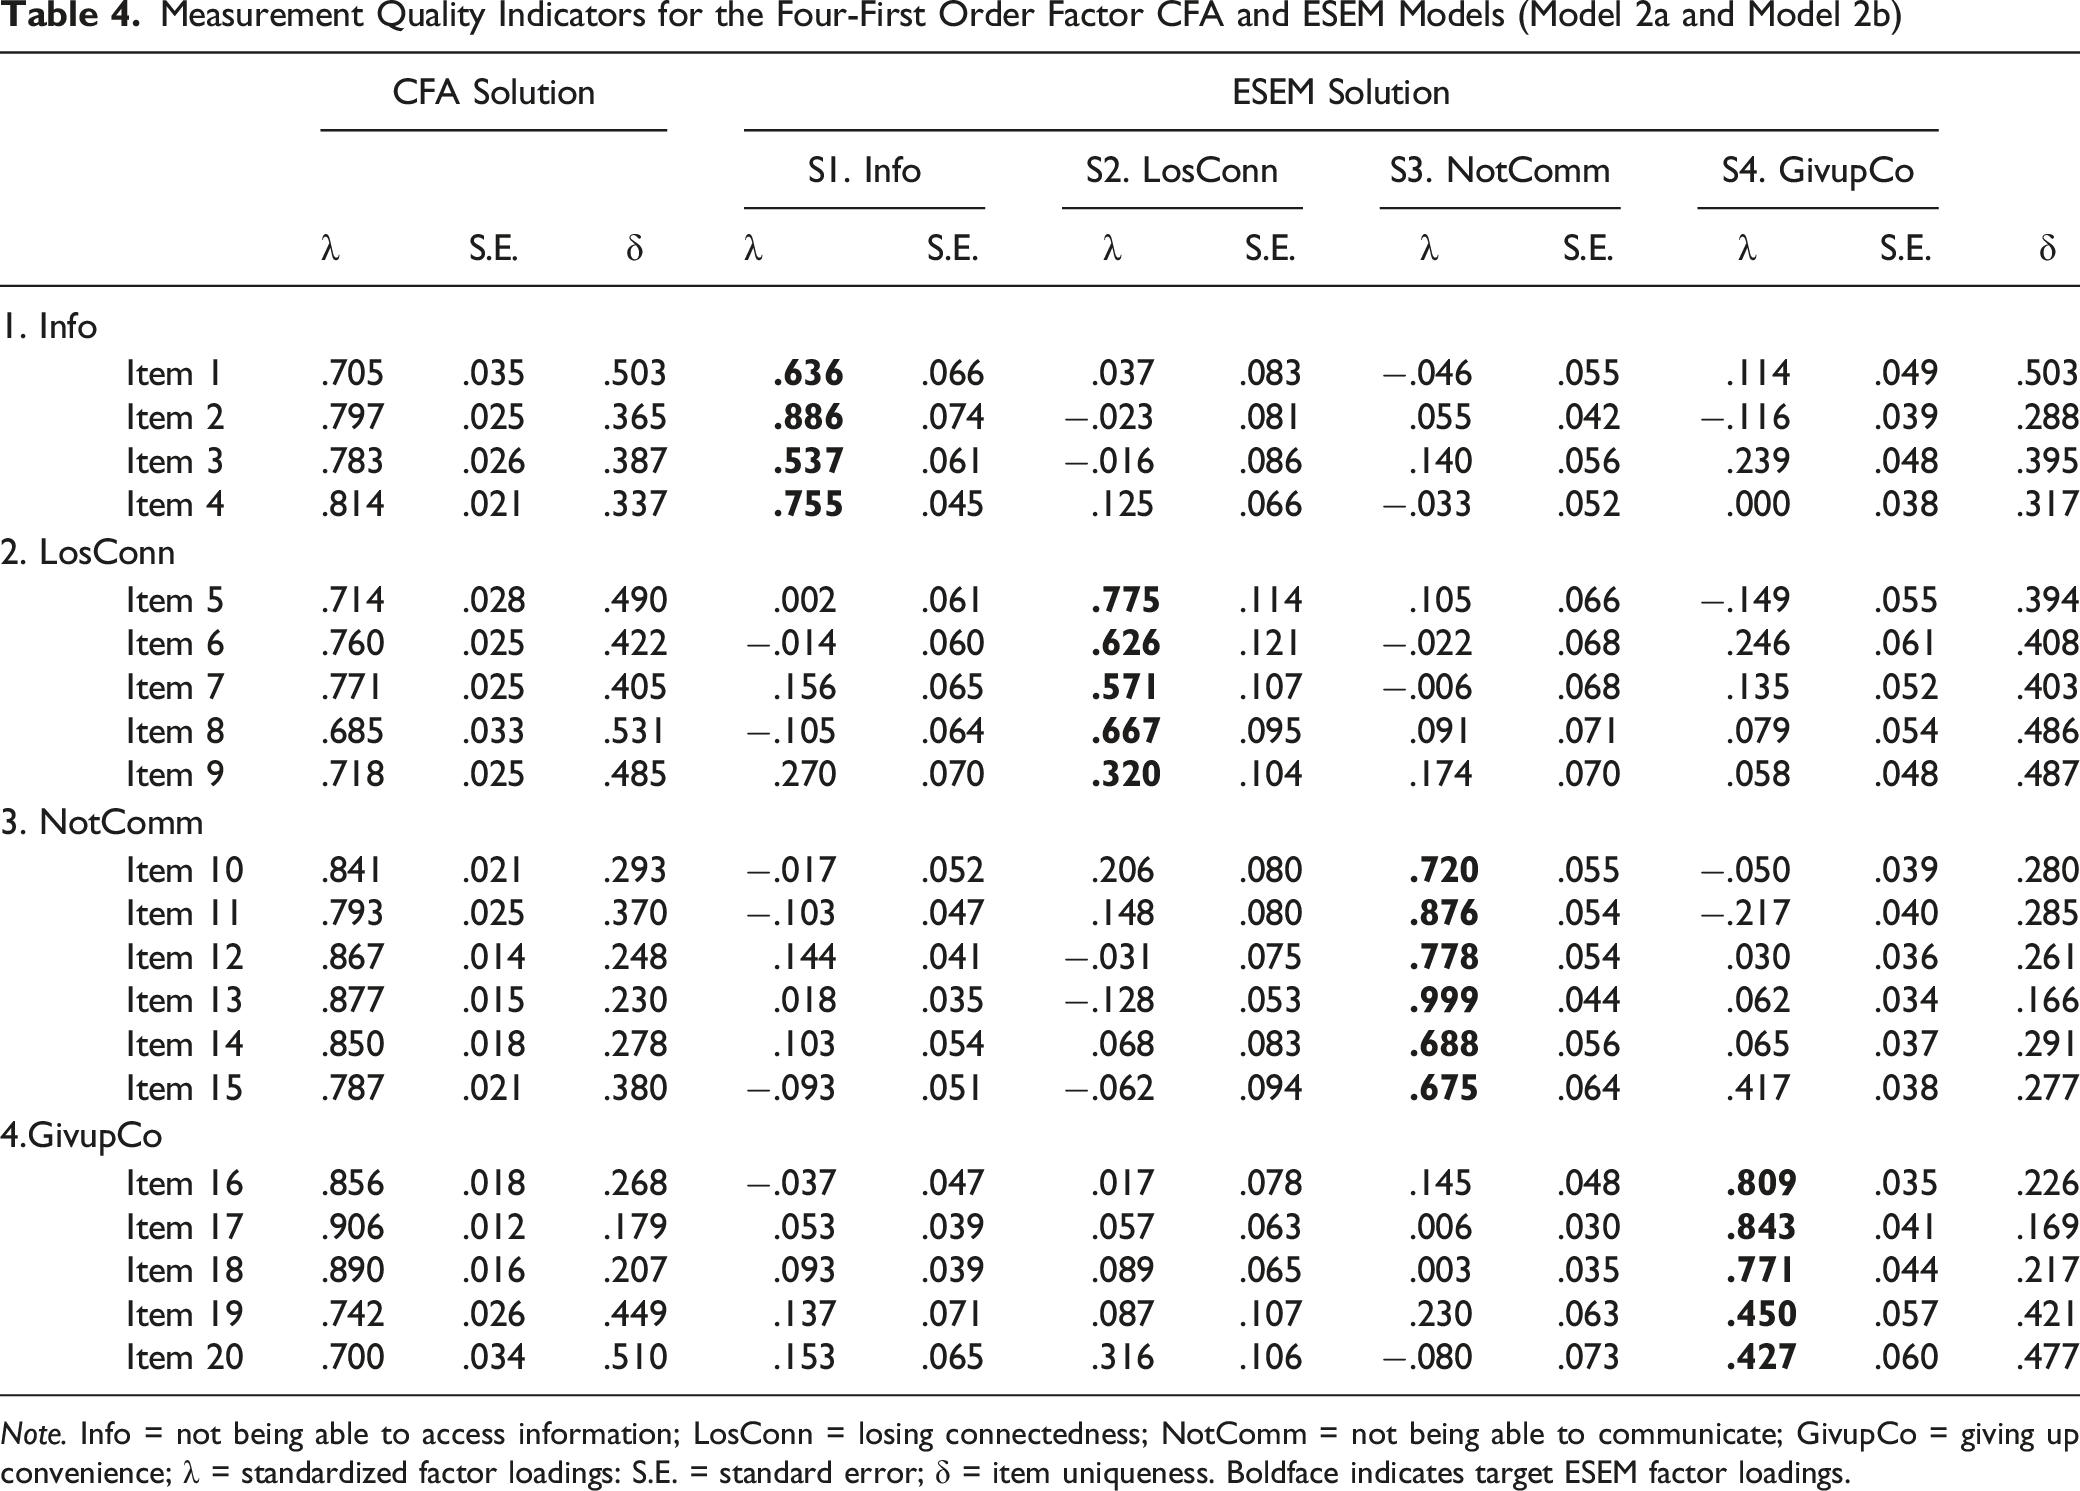
Note. Info = not being able to access information; LosConn = losing connectedness; NotComm = not being able to communicate; GivupCo = giving up convenience; λ = standardized factor loadings: S.E. = standard error; δ = item uniqueness. Boldface indicates target ESEM factor loadings.
Examining the Second Source of Construct-Relevant Psychometric Multidimensionality: The Coexistence of Global and Specific Factors
As mentioned in the previous section, inflated cross-loadings may emerge when some general construct underlying all items is unmodeled. Indeed, both Model 4b and Model 6b provided evidence of the coexistence of a G-factor and S-factors capturing the multidimensionality of nomophobia. Notwithstanding the plausibility and stability of Model 4b, which can be evaluated through the high factor loadings of each first-order factor on the higher-order factor (λ > .657), multiple significant cross-loadings were estimated (>.220), suggesting some kind of redundancy between items (see Table S3 in Supplemental Materials). In addition, there is not a strong theoretical reason to support the need to model the relations between the items and the G-factor as indirect and the presence of an implicit proportionality constraint (Gignac, 2016; Morin, Arens, & Marsh, 2016). Thus, it was disregarded for further analyses.
Measurement Quality Indicators for the B-ESEM Model (Model 6b)
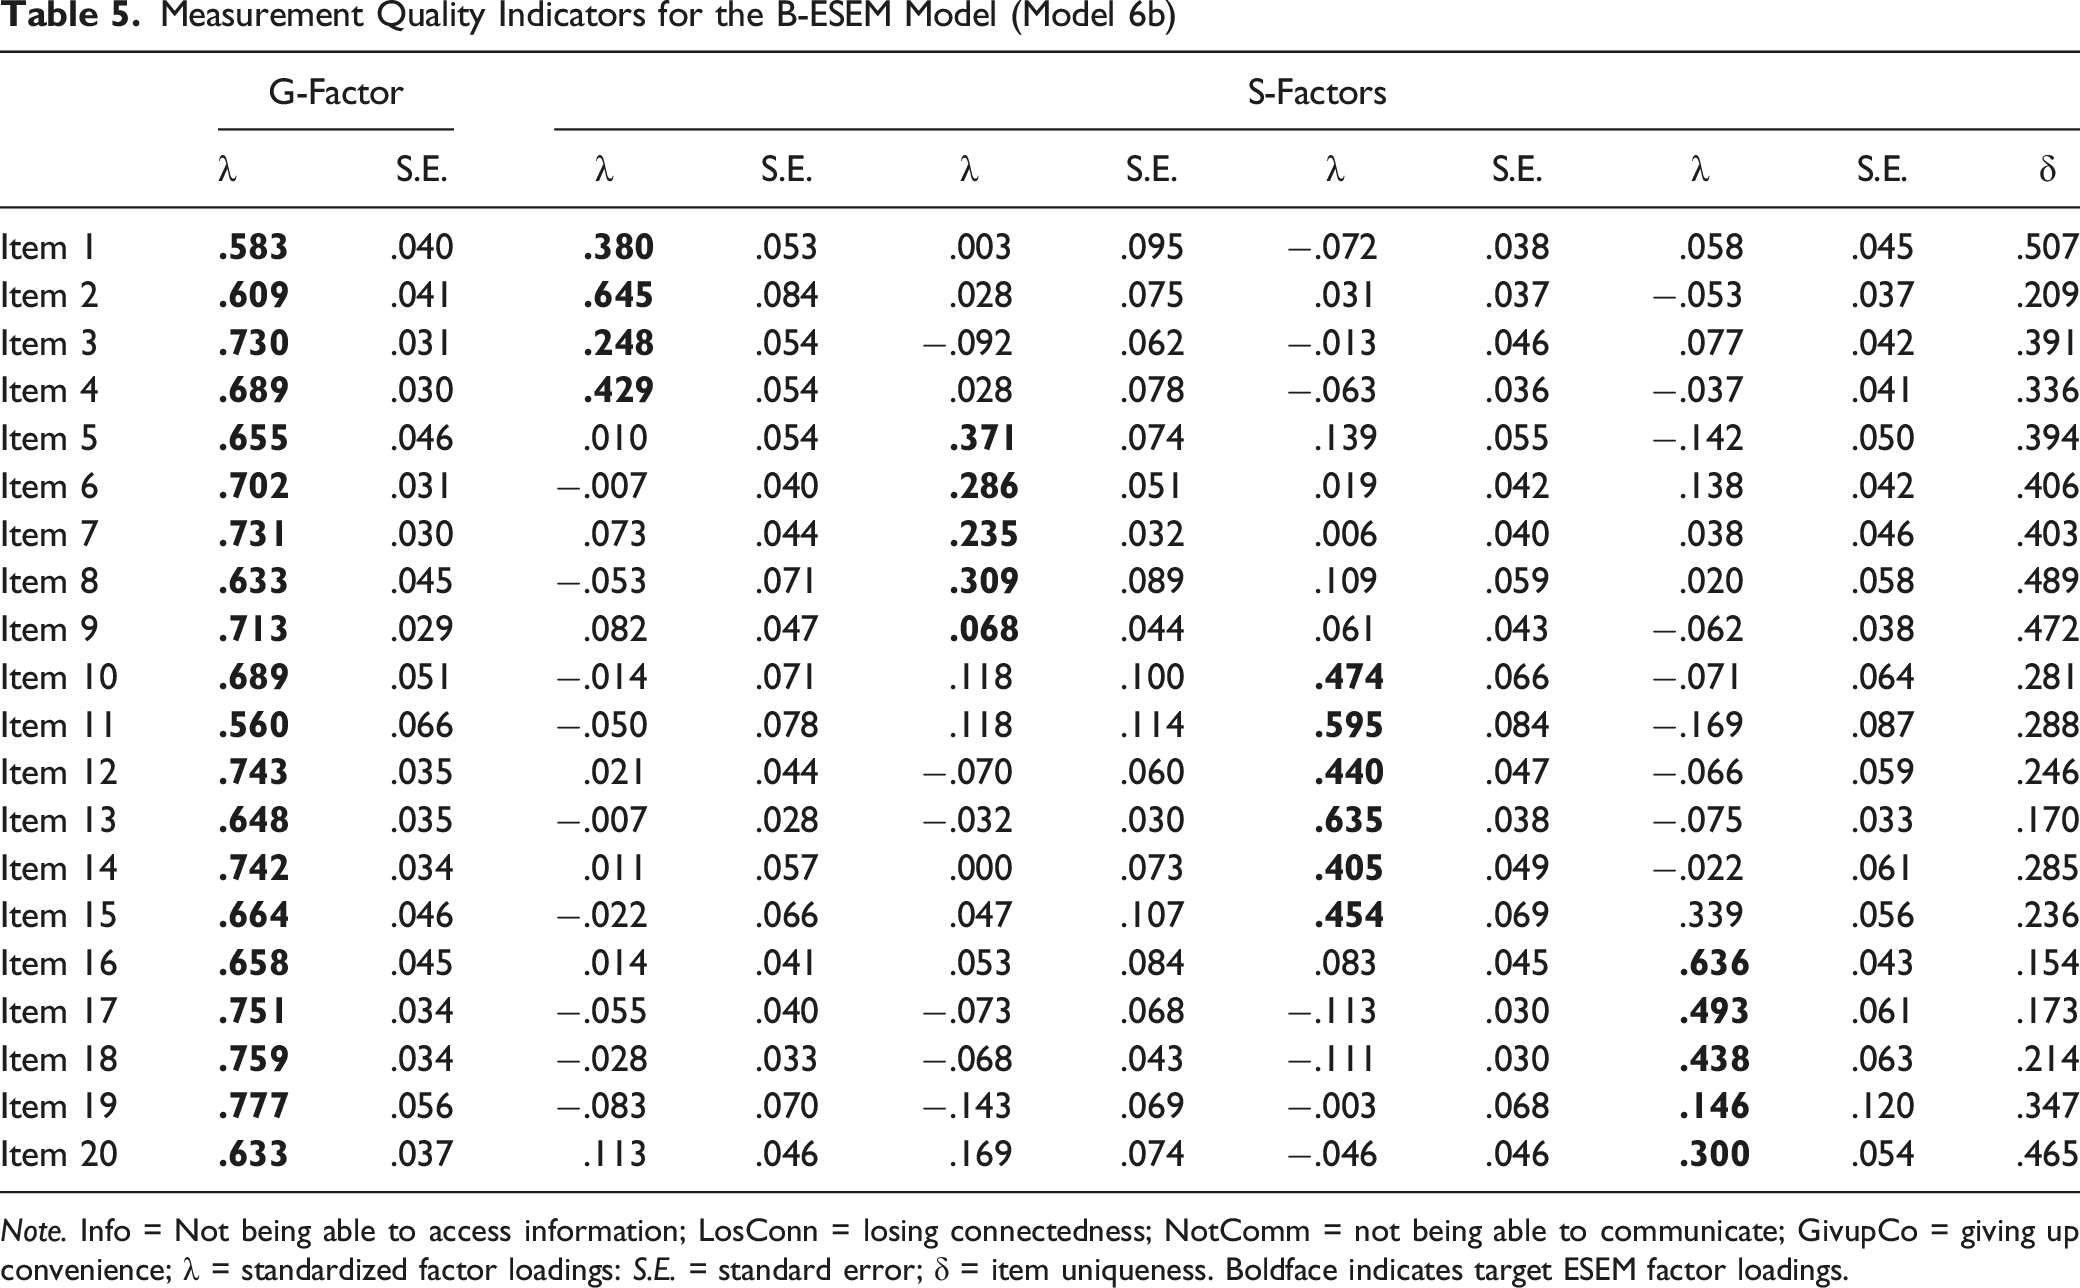
Note. Info = Not being able to access information; LosConn = losing connectedness; NotComm = not being able to communicate; GivupCo = giving up convenience; λ = standardized factor loadings: S.E. = standard error; δ = item uniqueness. Boldface indicates target ESEM factor loadings.
However, the S-factors also retain some degree of meaningful specificity over and above the G-factor: The presence of non-zero loadings for each S-factor, together with at least one loading on each factor greater than .300 indicates a minimum level of residual specificity that needs to be considered. A further essential element consists in comparing cross-loadings between ESEM and B-ESEM solutions (Model 2b vs. Model 6b). With the exception of item 15 (“I would feel anxious because my constant connection to my family and friends would be broken”), which had a factor loading higher than .300 on its non-target factor, our findings showed that cross-loadings in Model 2b (ǀ.103ǀ < λ < .417) were systematically higher than in Model 6b (ǀ.103ǀ < λ < .339), suggesting that construct-relevant multidimensionality due to the presence of hierarchically superior constructs was expressed through inflated cross-loadings in Model 2b and re-expressed via the G-factor in Model 6b. We retained Model 6b as the final best factor solution to better describe the construct-relevant psychometric multidimensionality of the NMP-Q, with a well-defined G-factor and four weaker S-factors.
Reliability
Reliability Estimates of the ESEM Bifactor Model
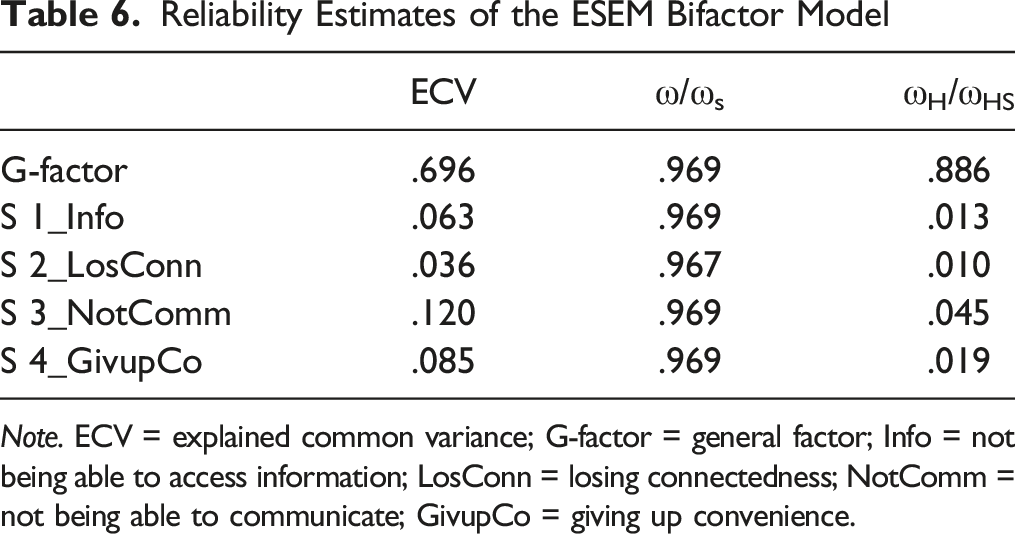
Note. ECV = explained common variance; G-factor = general factor; Info = not being able to access information; LosConn = losing connectedness; NotComm = not being able to communicate; GivupCo = giving up convenience.
Moreover, the inspection of the explained common variance (ECV) provided evidence that the G-factor explained a large proportion of the total variance (70%), whereas the S-factors reported an ECV ≤.12, indicating their relatively poor ability to explain the global construct. As suggested by Reise et al. (2013), ECV values greater than .85 on the G-factor and smaller ECVs on the S-factors indicate that the measure is sufficiently unidimensional. In addition, some items (Item 3, “Being unable to get the news (e.g., happenings, weather, etc.,) on my smartphone would make me nervous”; Item 6, “If I were to run out of credits or hit my monthly data limit, I would panic”; Item 7, “If I did not have a data signal or could not connect to Wi-Fi, then I would constantly check to see if I had a signal or could find a Wi-Fi network”; Item 9, “If I could not check my smartphone for a while, I would feel a desire to check it”; Item 19, “I would feel anxious because I could not check my email messages”) reported an IECV higher than .80, along with high factor loadings on the G-factor (λ > .703), providing further support for a unidimensional measure (Schmitt et al., 2018; Stucky & Edelen, 2014). The computation of PUC was not performed due to the presence of some items loading onto multiple S-factors (e.g., Item 5, “Running out of battery in my smartphone would scare me”; Item 10, “I would feel anxious because I could not instantly communicate with my family and/or friends”; Item 11, “I would be worried because my family and/or friends could not reach me”).
Relations With Other Constructs
We specified a LVM to examine the relationships between the retained B-ESEM structure and some related variables by implementing ESEM within CFA (EwC). We freely estimated the correlations between the G-factor as well as the S-factors with depression, anxiety, stress, and social interaction anxiety. The test of this model resulted in an acceptable fit to the data, χ2(1614) = 2864.557, p < .001, CFI = .924, TLI = .917, RMSEA = .041 [.039–.043], AIC = 74,751.276, BIC = 75,892.094, aBIC = 75,016.146. The G-factor had positive associations with all the external variables: depression (r = .274, p < .001), anxiety (r = .319, p < .001), stress (r = .246, p < .001), and social interaction anxiety (r = .379, p < .001). When examining the S-factors, only Losing Connectedness showed significant associations with all the external variables (depression: r = .306, p < .001; anxiety: r = .342, p < .001; stress: r = .305, p < .001; social interaction anxiety: r = .204, p < .05). Contrariwise, Giving up the Convenience was significantly associated with anxiety (r = .227, p < .001) and social interaction anxiety (r = .213, p < .001); Not being able to access information was significantly related to social interaction anxiety only (r = .146, p < .05), whereas Not being able to communicate did not report any significant associations with any of the external variables.
Discussion
Previous literature on nomophobia assessment suggested that two sources of construct-relevant psychometric multidimensionality might be expected: The former refers to the fallible nature of items, which tend to report at least some degree of association with constructs others than the main construct they are meant to assess, whereas the latter is related to the coexistence of a G-factor along with S-factors. Following the suggestions provided by previous research (Morin, Arens, Tran, et al., 2016; Tóth-Király et al., 2018), when both sources of construct-relevant psychometric multidimensionality are present, the ESEM framework together with the bifactor perspective should be taken into account simultaneously. This study represents the first attempt to evaluate the internal structure of the NMP-Q using this integrated approach. Specifically, in line with the recommendations indicated by previous authors (Morin, Arens, & Marsh, 2016; Morin, Arens, Tran, et al., 2016; Tóth-Király et al., 2018), we followed a stepwise procedure: We first tested and contrasted several competing measurement models (i.e., CFA vs. ESEM) to evaluate the presence of psychometric multidimensionality due to the fallibility of indicators and, as a next step, we compared the first-order structures with those specifying the presence of a G-factor and S-factors to investigate the construct-relevant multidimensionality due to the coexistence of hierarchically ordered factors. Generally speaking, in line with previous studies (see Marsh et al., 2014 for a review), our findings support the superiority of ESEM models over their competing CFA models, providing better fit indices, as well as better parameter estimates. Further, although the four-correlated factor ESEM model (Model 2b) showed excellent qualities in terms of fit indices and information criteria, we obtained proof of construct-relevant multidimensionality attributable to the coexistence of a G-factor together with S-factors, through the inspection of the inflated cross-loadings. Results from our study indicate that the B-ESEM integrated approach offers the best representation of the complexity of the construct, reporting excellent fit indices and better measurement quality indicators than the alternative models. Particularly, our results evidence a well-defined G-factor and four weaker S-factors. Giving up Convenience (S3) was the weakest S-factor, and only two items had saturations higher than the recommended threshold of .300 (item 5, “Running out of battery in my smartphone would scare me”, λ = .371; item 8, “If I could not use my smartphone, I would be afraid of getting stranded somewhere”, λ = .309). However, these two items were still not highly defined (λ on their primary factor did not reach .400), providing further support for the weakness of the S3-factor. These findings raise a crucial question about the controversial issue of retaining less defined S-factors in B-ESEM models for statistical purposes. Actually, Reise et al. (2007) stated that bifactor models should not be used only to account for residual covariance, but should be applied when meaningful content specificities exist in well-defined S-factors. Here, as also reported by Perera and Ganguly (2018), “it is possible that residual specificities are construct-relevant but not necessarily well-defined” (p. 201). The residual specificity shared by the S3 item subset, even if not sufficient to form a well-defined factor, is construct relevant given that these items do not seem to reflect methodological artifacts that are construct irrelevant (e.g., item wording). This means that S3 is useful to account for residual specificities shared among the items, though its ability to be interpreted as substantively meaningful is really limited.
Notwithstanding that the other three S-factors were better defined than S3, our study indicate an unbalanced partition of items’ variance explained by the G-factor and S-factors, respectively: Given that more than half (70%) of the total variability was explained by the G-factor, the S-factors were too weak, not adding a strong theoretical contribution for an explanation of the construct of nomophobia. In other words, our findings suggest that the measure is substantially unidimensional, as also supported by the bifactor indices of reliability. However, although the well-defined G-factor compared to the weaker loadings on S-factors may lead researchers to justify the computation of a total nomophobia score, such an approach would confound and blur the variance associated with the G-factor and the S-factors. Relying on a total score may drive to misleading results when “strict” unidimensionality is violated (Perera & Ganguly, 2018); indeed, our study suggests that the measure is rather “substantially” unidimensional. From this perspective, a viable option to handle the construct-relevant multidimensionality of nomophobia consists in working within a latent variable modeling framework where the B-ESEM structure can be properly modeled.
Notably, even if in the B-ESEM model (Model 6B) cross-loadings were systematically lower than in its competing ESEM counterpart (Model 2b), these secondary loadings still remained statistically significant, suggesting that S-factors share theoretical meanings. These cross-loadings serve to improve construct estimation by allowing latent variables to be evaluated using all available indicator-level information (Morin, Arens, Tran, et al., 2016). After all, when examining the ESEM solution (Model 2b), inter-factor correlations were lower than the contrasting CFA model (Model 2a), but still fairly high (.49 < r < .74, p < .001), indicating a relatively low degree of factors’ distinctiveness. This may suggest that the four factors commonly used in literature to describe nomophobia do not offer high specificity in describing the general construct. Moreover, although not relevant for the current study because the final model we retained was a B-ESEM, these correlations estimated could lead to multicollinearity issues if these latent factors were used in predictive regressions on SEM models; this may explain why previous research on nomophobia mostly relied on a unique total nomophobia score instead of taking into account the four subscales.
When examining the associations between NMP-Q scores and external variables, we found that, over and above the G-factor, the S-factors (with the exception of Not being able to communicate) also reported associations with depression, anxiety, stress, and social interaction anxiety, suggesting that, although reduced, these S-factors still maintained a small amount of their own specificity. Particularly, the S-factor Losing Connectdeness was significantly associated with all the external variables. However, a careful inspection of the items’ content of this subscale seems to suggest a somewhat overlap with the global construct of nomophobia (e.g., Item 5 “Running out of battery in my smartphone would scare me”; Item 9 “If I could not check my smartphone for a while, I would feel a desire to check it”). Indeed, their content is broad and it involves individuals’ anxious symptoms or worries of not being with their own smartphone, regardless of the specific reason of their use (e.g., individuals may be scared when the battery is flat both because they cannot access information and communicate with family and friends, as well as because they are not allowed to benefit from other advantages provided by the use of their smartphones; in the same vein, people may desire to check their own smartphones in order to get news on the web, to keep in touch with their own contacts, as well as for other purposes). Thus, from a practical perspective, it may be sufficient, and in the meantime justifiable, to take into account the global score of the NMP-Q. Generally speaking, these results are consistent with previous theorethical and empirical studies on nomophobia as a phenomenon associated with poor psychological well-being (Caba-Machado, Machimbarrena, et al., 2023; Santl et al., 2022; Valenti et al., 2022). Taken together, the current research contributes to the advancement of measurement and theory on nomophobia, while also providing further support for the broad methodological literature on approaches to account for construct-relevant psychometric multidimensionality of complex constructs.
Practical Implications for Health Professions
Beyond the support for a new methodological perspective in nomophobia evaluation, the current study points out the relevance for health professions in including this novel construct in psychological assessment, given its associations with several indicators of psychological impairment (as reported in the previous section). These findings suggest that health professions should pay attention to this modern disorder and help individuals who suffer from nomophobic symptoms to handle negative emotions (i.e., anxiety, fear, discomfort) associated with the absence (or the thought of) of their own smartphone. Educational and awareness campaigns are recommended, along with the use of applications that promote the reduction of screen time on smartphones. Furthermore, therapies such as the cognitive-behavioral approach or other strategies focused on reducing screen time (Bychkov & Young, 2018), as well as mindfulness or coping strategies (Arpaci et al., 2017, 2019), may be useful in dealing with the problem. Experimental designs are desirable in order to evaluate and support the efficacy of these intervention programs.
Limitations and Future Directions
Despite the fact that the current study offers prominent advances on the methodological issues related to nomophobia assessment, there are several shortcomings that should be mentioned. First of all, we did not test measurement invariance, thus limiting the possibility of extending the measurement properties of the instrument across multiple groups, situations, or occasions. Tests of measurement invariance are really important for the evaluation of construct validity and are a key element for any valid form of group-based comparisons (Marsh et al., 2014). A further limitation is related to the criteria used for model fit evaluation, selection, and comparison. Indeed, although we followed the suggestions provided by Morin et al. (2016; 2016), it is noticeable that these criteria have so far been established for CFA, and their adequacy for ESEM should be further investigated. From this perspective, additional simulational and empirical work is needed in order to evaluate the extent to which these criteria can be adequately and efficiently used within the ESEM framework. However, current literature on this topic relies on these recommended guidelines (Howard et al., 2018; Perera & Ganguly, 2018; Pommier et al., 2020; Tóth-Király et al., 2018). An additional shortcoming is related to participants’ selection through MTurk which does not guarantee the representativeness of our sample. Future research may involve other samples recruited with probabilistic procedures. In addition, further scholars may also investigate associations between NMP-Q scores and other indicators of poor psychological well-being, such as deficiencies in emotion regulation, choice overload, pessimism, predetermination and powerlessness (Faraci & Tirrito, 2013; Misuraca et al., 2016; Valenti & Faraci, 2021), as well as other psychiatric diseases and substance and behavioral addictions. Finally, we did not investigate the temporal stability of the scale; it is suggested that future studies be conducted to evaluate test-retest reliability of the NMP-Q scores by relying on longitudinal studies.
Conclusions
This paper provides support for the usefulness of the overarching B-ESEM framework in properly disentangling the two sources of construct-relevant psychometric multidimensionality of nomophobia due to (a) the fallibility of items as pure indicators of the constructs they are purported to measure and (b) the coexistence of a G-factor and S-factors underlying the data. Specifically, our findings suggest the presence of a well-defined G-factor together with four weaker S-factors, which were retained in the final model to control for limited residual specificity. On a methodological level, this study demonstrates the application of the newly developed bifactor ESEM integrated analytic approach (Morin, Arens, & Marsh, 2016; Morin, Arens, Tran, et al., 2016) as a valuable tool to evaluate the underlying structure of multidimensional constructs.
Supplemental Material
Supplemental Material - Assessing the Two Sources of Construct-Relevant Psychometric Multidimensionality of the Nomophobia Questionnaire: The Integrated Framework of Bifactor Exploratory Structural Equation Modeling
Supplemental Material for Assessing the Two Sources of Construct-Relevant Psychometric Multidimensionality of the Nomophobia Questionnaire: The Integrated Framework of Bifactor Exploratory Structural Equation Modeling by Giusy D. Valenti, Rossella Bottaro, and Palmira Faraci in Evaluation & the Health Professions.
Footnotes
Declaration of Conflicting Interests
The author(s) declared no potential conflicts of interest with respect to the research, authorship, and/or publication of this article.
Funding
The author(s) received no financial support for the research, authorship, and/or publication of this article.
Data Availability Statement
The data used to support the findings of this study are available at OSF repository. DOI 10.17605/OSF.IO/6WB8G. ![]() .
.
Supplemental Material
Supplemental material for this article is available online.
Note
References
Supplementary Material
Please find the following supplemental material available below.
For Open Access articles published under a Creative Commons License, all supplemental material carries the same license as the article it is associated with.
For non-Open Access articles published, all supplemental material carries a non-exclusive license, and permission requests for re-use of supplemental material or any part of supplemental material shall be sent directly to the copyright owner as specified in the copyright notice associated with the article.