
Abstract
Implementation fidelity has been an important issue in the service provision and associated outcomes of Wraparound, an intensive, individualized care planning process that uses a team-based approach to integrate youth into the community to minimize the need for intensive, institutional services. In response to the growing need to monitor fidelity to the Wraparound process, a variety of instruments have been created and tested. In this study, the authors present the results of several analyses designed to better understand the measurement characteristics of the Wraparound Fidelity Index Short Form (WFI-EZ), a multi-informant fidelity instrument. The results from our analysis of 1027 WFI-EZ responses indicate that the internal consistency of the instrument is very good, although the negatively worded items did not appear to function as well as positively worded items. Results from two confirmatory factor analyses were unable to validate the original domains identified by the instrument developers, but for certain outcomes the WFI-EZ demonstrated deseriable predictive validity. Preliminary evidence is also provided that WFI-EZ responses likely differ by respondent type. We conclude by discussing the implications of using the WFI-EZ in programming, policy, and practice considering the findings of our study.
Keywords
Introduction
Mental health conditions among youth with serious emotional disturbances (SED) are expensive as many require institutional care for treatment or their behavior challenges result in other out-of-home or out-of-community placements (i.e. child welfare or juvenile justice) (Olson et al., 2021). Wraparound is a promising practice that supports youth transitioning to or remaining in community-based care (National Wraparound Initiative, 2022; Burchard et al., 2002). Since the term was first coined in the 1980s, Wraparound has been described in various ways, including as a philosophy, an approach, and a service. In general, Wraparound is an intensive, individualized care planning and management process that uses a team-based approach to integrate youth into the community and build a family’s social support network to minimize the need for intensive, institutional services and restrictive out-of-community placements (Bruns et al., 2010). Key characteristics of the process are that individualized, strength-based, culturally competent plans are developed by a family-centered team driven by the preferences and needs of the youth and family. Through the team-based planning and implementation process, Wraparound aims to develop problem-solving skills, coping skills, and self-efficacy of the youth and family members that support integrating the youth into the community and building the family’s social support network (Chitiyo, 2014). According to the most recent national survey, all states in the U.S. have implemented some type of Wraparound program, with services reaching an estimated 75,000 children and families (Sather & Bruns, 2016).
Despite research indicating that Wraparound is a cost saving behavioral health intervention for youth with SED (Snyder et al., 2017), the evidence indicating other positive outcomes at the youth and family level is mixed. Several longitudinal studies indicate that youth receiving Wraparound services improve across a variety of domains including lessened functional impairment, reduced recidivism to the juvenile justice system, decreased utilization of emergency room and inpatient psychiatric services, and improvements in overall mental health (Coldiron et al., 2017; Grimes et al., 2011; Jeong et al., 2014; Pullmann et al., 2006). However, other studies have shown no statistically significant improvement over time in youth functioning, family functioning, life satisfaction, and placements in residential settings (Bickman et al., 2003; Bruns et al., 2015; Mears et al., 2009). Additionally, two meta analyses of experimental studies comparing Wraparound services to various control groups or conventional services found that Wraparound youth had only marginally better mental health outcomes compared to youth receiving traditional services (Olson et al., 2021; Suter & Bruns, 2009).
One possible explanation for the differences in the effectiveness of Wraparound across these studies is the extent to which the program was implemented to fidelity in each setting or context (Larson, 2021). Defined broadly, fidelity refers to the extent to which interventions are implemented to an intended model or protocol shown to produce effective results (Mowbray et al., 2003). Implementation fidelity is critical in the service provision and associated outcomes of Wraparound, with several studies indicating that as Wraparound fidelity increases, a variety of youth level outcomes improve, including emotional and behavioral functioning, satisfaction with services, and goals being met upon program completion (Bruns et al., 2005; Cox et al., 2010; Effland et al., 2011). Moreover, Bruns (2015) argues that at least three studies have shown that poor fidelity to Wraparound is associated with a lack of effective results often seen in other studies (see Bickman et al., 2003; Browne et al., 2016; Bruns et al., 2015). For example, results from one randomized controlled trial of Wraparound in Nevada found that after 1 year of services, there were no group differences in emotional and behavioral outcomes between those receiving Wraparound and those receiving traditional intensive case management (Bruns et al., 2015). The authors of this study concluded that the neutral outcomes were likely due to a lack of fidelity to the Wraparound model, finding that scores on a Wraparound fidelity instrument were lower than 80% of sites nationally (Bruns et al., 2015).
Given the documented relationship between implementation fidelity and Wraparound outcomes, measuring fidelity to the Wraparound process has indeed been a major concern of researchers and evaluators. One systematic review of more than 200 studies from the Wraparound evidence base found that 18% of articles about Wraparound were focused on delineating or measuring fidelity (Coldiron et al., 2017). Additionally, 30% of the empirical studies reviewed included at least one assessment tool designed to measure fidelity to Wraparound philosophies or processes (Coldiron et al., 2017). The most commonly used of these instruments has been the Wraparound Fidelity Index (WFI), a multi-informant instrument designed to measure fidelity to specific Wraparound activities (Pullmann et al., 2013). The WFI was originally piloted and implemented in 2000 and has since undergone four revisions to improve the scale’s psychometric properties. The most current version of the instrument, the WFI-4, exhibited desirable internal consistency, discriminant validity, and construct validity (Pullmann et al., 2013; Sather et al., 2013).
While the WFI-4 demonstrated desirable psychometric properties, at least two drawbacks have been noted by those using the instrument. As pointed about by Sather et al. (2013), the high number of items in the WFI-4 typically resulted in an undesirable response burden for participants. Additionally, the WFI-4 was designed to be administered and scored either in person or telephonically by a trained interviewer, resulting in a considerable amount of resources needed to employ the instrument in research and practice (Pullmann et al., 2013). For these reasons, the WFI-4 underwent major revision to reduce the number of items in the instrument and transform the instrument to a self-administered modality (Sather et al., 2013). The results of the revision to the WFI-4 was a new instrument termed the Wraparound Fidelity Index Short Form (WFI-EZ).
Abbreviated Item Content and Item-Level Descriptive Statistics.
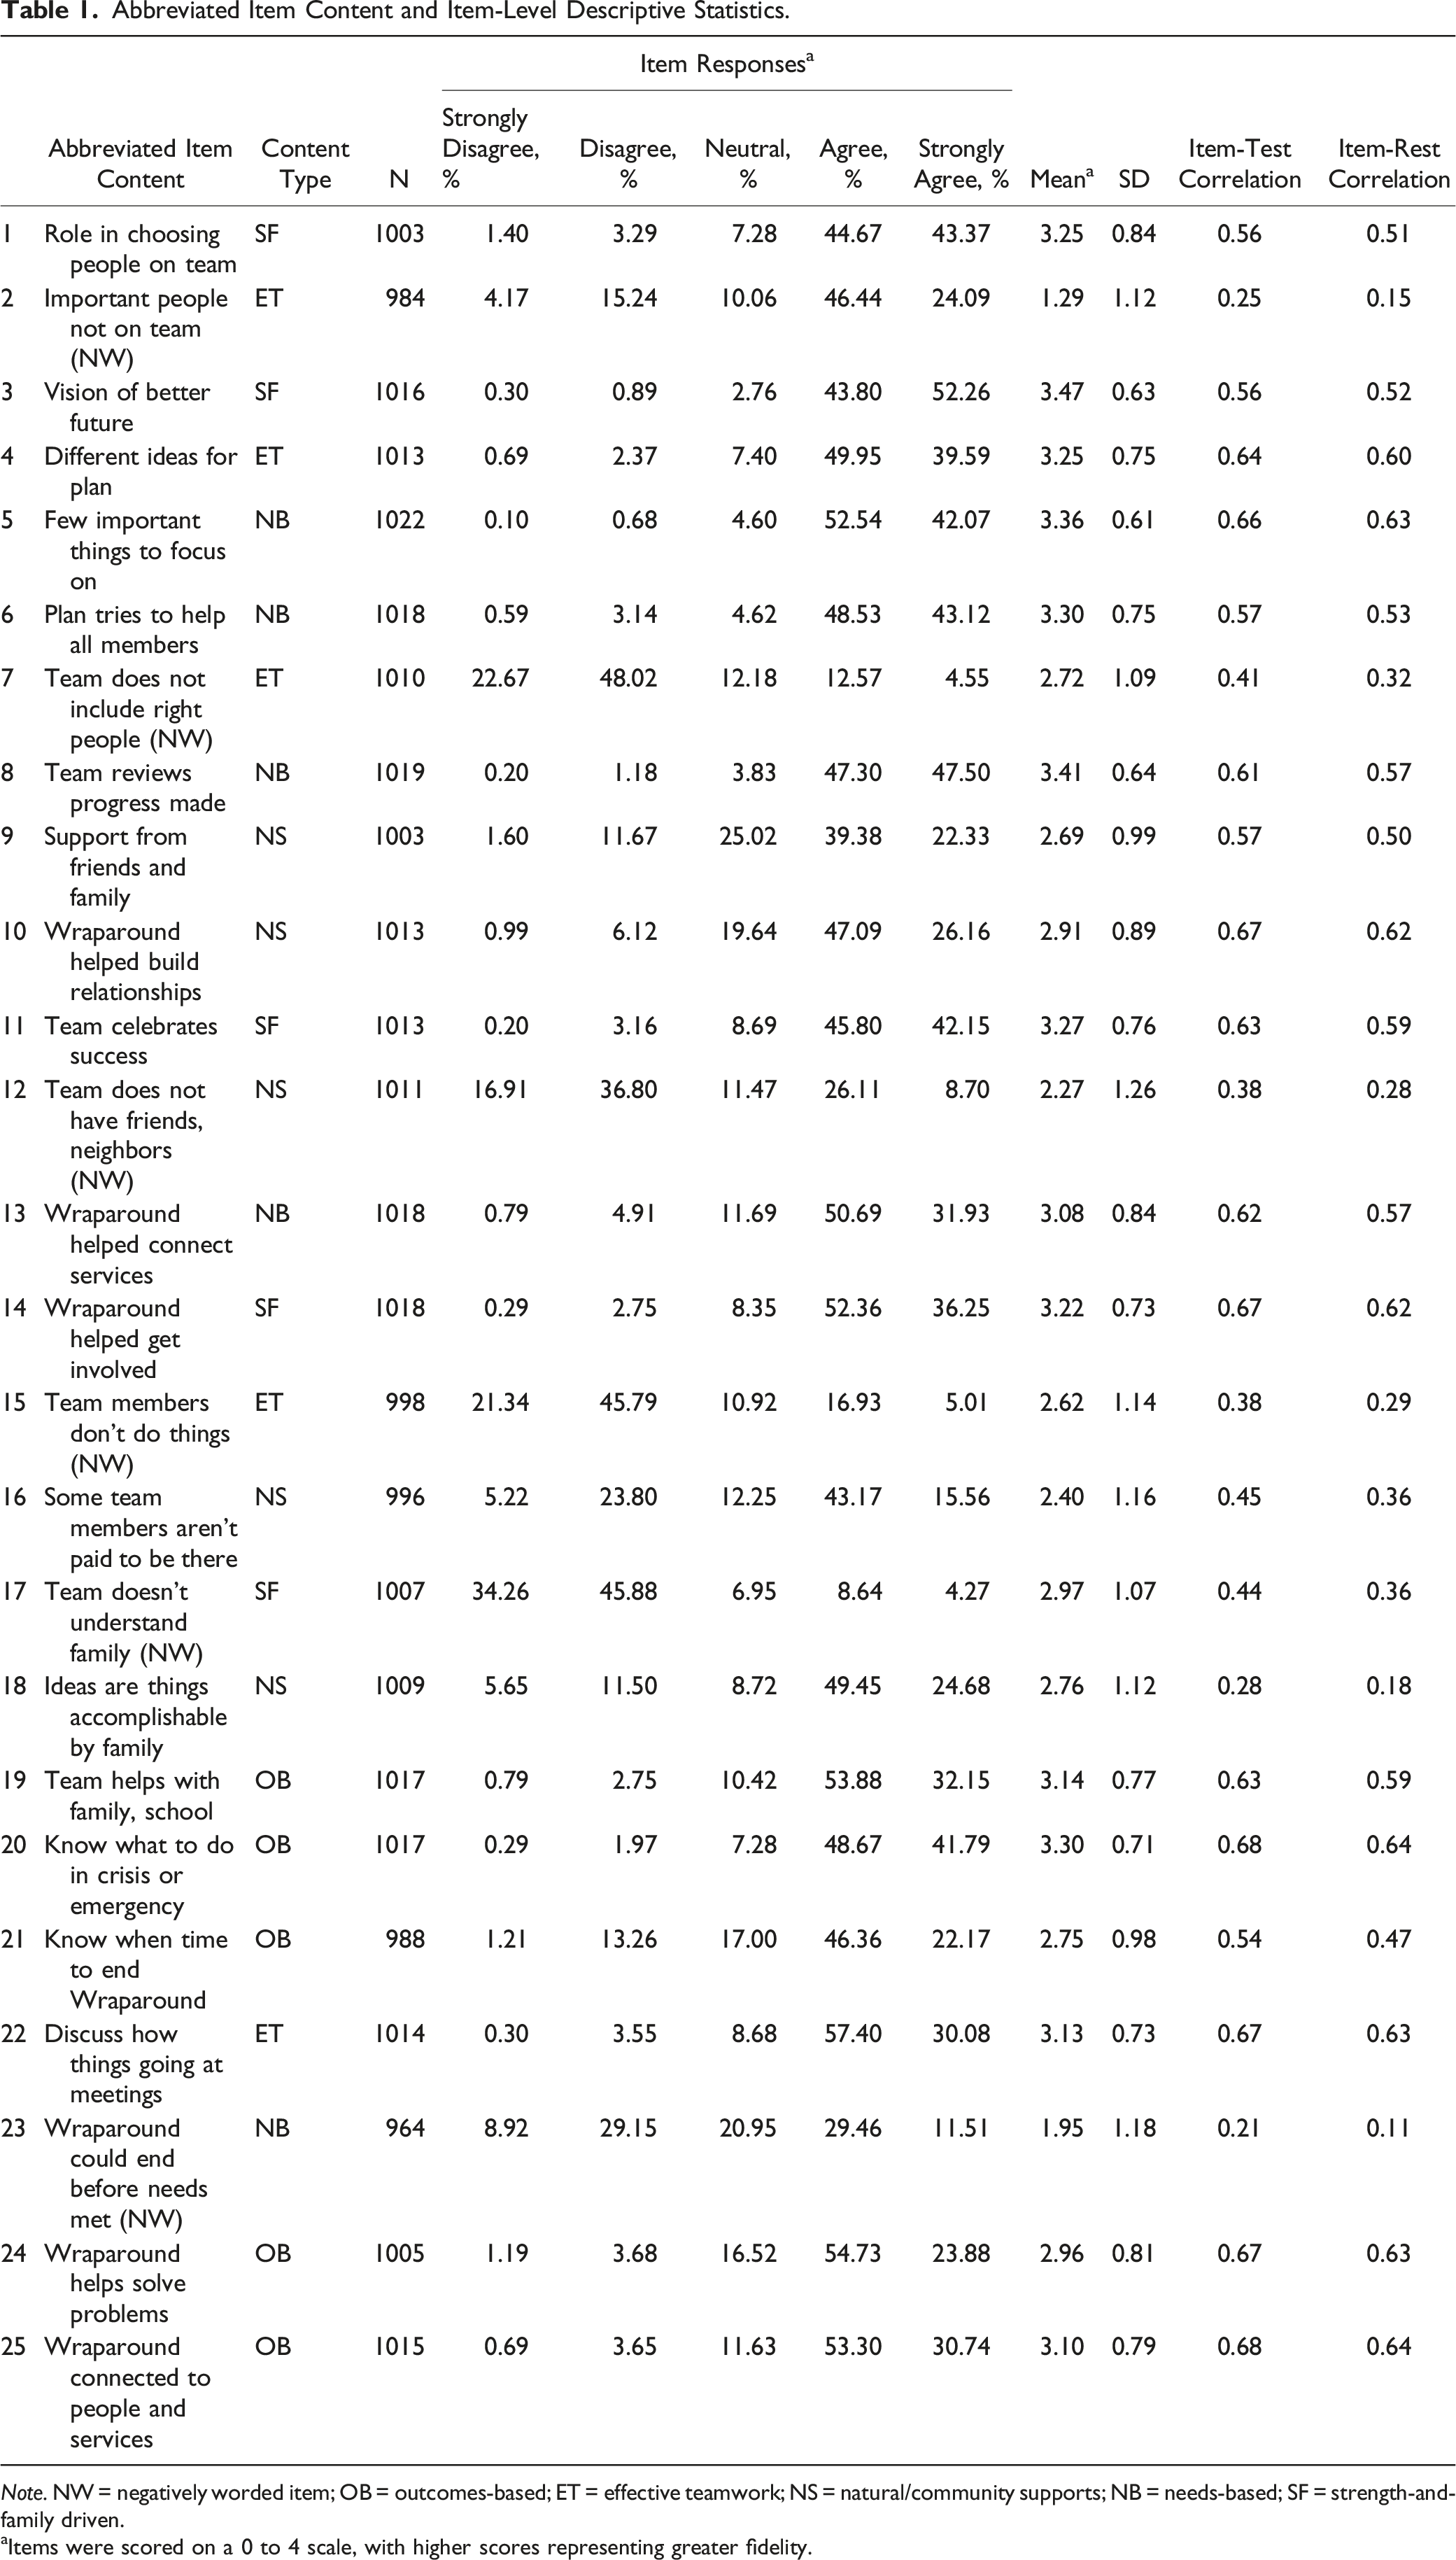
Note. NW = negatively worded item; OB = outcomes-based; ET = effective teamwork; NS = natural/community supports; NB = needs-based; SF = strength-and-family driven.
aItems were scored on a 0 to 4 scale, with higher scores representing greater fidelity.
Since its creation, the WFI-EZ has been used in a variety of ways, including monitoring model fidelity for practice improvement (Bartlett & Freeze, 2021), assignment of study subjects into treatment and control groups in comparative effectiveness research (Connell et al., 2022), and to contextualize study findings in clinical trial research (Coldiron et al., 2019). However, following a decade of its existence, the measurement characteristics of the WFI-EZ have largely been unexplored. To the best of our knowledge, the only published properties of the instrument come from a 2012 pilot study of the WFI-EZ at 19 sites across the U.S. with a total sample size of 224 individuals (Sather et al., 2013). Primarily two main properties were reported from the pilot test. First, the developers found that in the pilot sample, overall reliability of the instrument was high as demonstrated by a Cronbach’s alpha of 0.94 (Sather et al., 2013). Second, the developers indicated that principal axis factoring provided preliminary evidence that the WFI-EZ was unidimensional. Indeed, in their study all but two items had meaningful loadings onto the first factor of their factor analysis (Sather et al., 2013). Results from the pilot testing were not used to evaluate whether the five domains created during the scale development process aligned with the data from the sample. However, following the results of their pilot testing, the scale developers recommend scoring the WFI-EZ in two ways: first, as a “total score” using all 25 items related to Wraparound fidelity; and second, by creating five domain-level scores (five items in each domain) aligned to the five key Wraparound principles described above. These two scoring mechanisms, aligning to a one-factor and five-factor measurement model, are frequently used in practice (for example, see Bartlett & Freeze, 2021) but to date have not been validated. Nor has the instrument’s predictive validity been examined.
Given that the existing published literature on the psychometric properties of the WFI-EZ consists of only one pilot study with limited findings, more information is needed regarding the measurement characteristics of the instrument from a sample implemented in real world service delivery. In this study, we address this need by examining the item-level response patterns and factor structure of the WFI-EZ from a statewide implementation of the instrument. We specifically evaluate whether the two potential factor structures identified by the scale developers can be confirmed using a sample independent from the pilot study. For each factor structure, we also descriptively explore if fidelity scores differ by respondent type, and if fidelity scores indicate desirable predictive validity across several outcomes. Such an analysis is useful for at least three reasons. First, examining the distribution of item-level responses will indicate whether a balance of easy or difficult to achieve fidelity items exist in the instrument. Second, examining the factor structure of the instrument will indicate whether the WFI-EZ is measuring the intended constructs of fidelity as hypothesized by the scale developers. It may be the case that the instrument measures a unidimensional construct, or the instrument may be better measuring a five-factor construct as discussed above. Third, better understanding the measurement properties of the WFI-EZ will likely aid those who may be using the instrument in real-world settings like state Title IV-E program administrators under the Family First Prevention Services Act to make appropriate adjustments to policy, programs, and practice as it relates to Wraparound fidelity.
Methods
Participants and Sampling Procedures
The data for this analysis come from an ongoing evaluation of Wraparound services in Georgia. Consistent with the limitations of the WFI-4 pointed out by Sather et al. (2013), Georgia switched to utilizing the WFI-EZ in July 2015 in an effort to decrease the respondent burden and increase response rates among the survey participants. One goal of collecting the WFI-EZ data was to inform an ongoing Wraparound quality improvement initiative in Georgia, where results of the survey would be incorporated into regular meetings with staff from the two Wraparound provider agencies called care management entities (CMEs) in the state and leadership from Georgia’s state mental health authority, the Department of Behavioral Health and Developmental Disabilities (DBHDD). In consultation with the national Wraparound Evaluation and Research Team (WERT) and DBHDD, we employed a quarterly sampling strategy to collect WFI-EZ data.
Four times throughout the year, we accessed the CMEs’ electronic health records to draw a quarterly census of youth receiving Wraparound services. To meet inclusion in the census, youth had to be enrolled in Wraparound 3 months prior to the census month and receive state-funded services (those with Medicaid managed care, private insurance, or other coverage were excluded from participation since they were not in population of individuals served by the state-funded behavioral health agency from which the broader program evaluation drew) 1 . For example, in the April census month, the research team conducted a census of all state-funded youth enrolled during the month of January. The 3-month lag between enrollment in Wraparound and invitation to complete the WFI-EZ ensured each participant had enough time to experience the program to best inform their responses to the fidelity instrument. Youth were eligible for inclusion in the census month regardless of whether their enrollment into the program represented their first episode of care, or re-enollment into the program.
Once the inclusion list was created for each quarterly census, we generated online survey links for youth and their associated caregivers, facilitators, and team members to complete the WFI-EZ using the WrapTrack system (an online database that houses WFI-EZ data from across the country). For each youth in the census month, a grouping of four WFI-EZ surveys were eligible for completion, all of which related to Wraparound fidelity for the same target youth. Respondents were given a 3-month window to complete the survey based on their enrollment date for Wraparound services. Youth and their caregivers evaluated their own experiences in Wraparound, while facilitators and team members were instructed to focus their responses to the WFI-EZ as it related to the target youth of interest. Facilitators in the sample could respond to the WFI-EZ for multiple youth depending on their case-load assignments. The final sample size for this analysis was 1027 WFI-EZ responses (195 from youth, 252 from caregivers, 334 from facilitators, and 246 from team members). Collectively, these survey responses were representative of 336 youth enrolled in Wraparound. Almost all the youth in this study (N = 319, 95%) were included at their first episode of care, while 5% of the youth (N = 17) were included during a re-enrollment into the program.
Descriptive Statistics and Reliabity
Our analysis of the WFI-EZ began by describing the percentage of affirmative responses (both overall and by respondent type) to the four items in section A of the WFI-EZ related to basic components of Wraparound. Next, we analyzed item-level descriptive statistics and the reliability of the 25 fidelity related items from section B of the scale. Specific attention was given to the response patterns of each item by examining the percentage of responses that fell into each response category and the distribution of responses across the positively and negatively worded items. Regarding the reliability, we examined internal consistency using Cronbach’s alpha and McDonald’s omega coefficient (McDonald, 2013) for all 25 items. We also examined item-test and item-rest correlations for each item. The item-test correlation coefficient examines the degree to which an item correlates with the scale as a whole. The item-rest correlation examines the degree to which an item correlates with the total scale score calculated from all other items, excluding the item under analysis. Descriptive statistics, Cronbach’s alpha, item-test, and item-rest correlations were calculated using Stata MP version 17 (StataCorp, 2021). McDonald’s omega was calculated using the psych package (Revelle, 2015) in R version 4.1.2 (R Core Team, 2022).
Confirmatory Factor Analyses
Because the major goal of this study was to test the two a priori factor structures identified during the pilot testing of the WFI-EZ, confirmatory factor analysis (CFA) was utilized. We first estimated a unidimensional model where all 25 items were considered to load onto one unidimensional latent fidelity factor. In addition to the unidimensional model, we also estimated a five-factor CFA to test the plausibility of the sub-domains as hypothesized by the developers of the instrument (see Sather et al., 2013). We specified the following factors: outcomes-based (items 19, 20, 21, 24, 25); effective teamwork (items 2, 4, 7, 15, 22); natural/community supports (items 9, 10, 12, 16, 18); needs-based (items 5, 6, 8, 13, 23); and strength-and-family driven (items 1, 3, 11, 14, 17). Following model estimation, we examined factor loadings and model fit indices to examine the extent to which each model accurately represented the observed data. We considered factor loadings of at least 0.30 or higher to be indicative of a meaningful relationship between the latent factor and the item. The following indices guided our analysis of model-data fit, as suggested by Kline (2015) and Schreiber et al. (2006): the
Both measurement models were conducted using MPlus version 7.3 (Muthen & Muthen, 2014). The CFAs were fit to the data using a weighted least squares estimator to account for the categorical response options (Finney & DiStefano, 2006). Robust standard errors were utilized to account for the clustered nature of the multi-informant responses. To obtain factor loadings for all items in the one-factor and five-factor CFAs, all latent factors were set to have a mean of zero and variance of one, rather than identifying the model by constraining the first factor loading of each latent variable to one, the default MPlus setting. Although some missing data were present across the items, all 1027 responses were retained in the CFAs using data imputation through the MPlus full information maximum likelihood algorithm. All items were coded using the original coding scheme as put forth by the scale developers. However, prior to all analyses, the negatively worded items were reverse coded to be aligned in the same conceptual direction of the positively worded items (Kline, 2015).
Differences by Respondent Type
We examined whether fidelity scores differed by respondent type. Using scores on the items as they aligned to the one-factor and five-factor measurement models, kernel density plots were used to visually assess the distribution of scores. Separate kernel densities were produced for the total fidelity score (one-factor model) and domain specific scores (five-factor model) by the four respondent types: youth, caregiver, facilitator, and team member. Respondent-specific densities were then placed onto the same plot for visual comparison.
Predictive Validity Analysis
We also aimed to better understand the predictive validity of the fidelity items. To that end, we utilized logistic regression to analyze the association between the total fidelity score (one-factor model) and domain specific scores (five-factor model) for four binary-coded outcomes. Outcome 1 captured whether the youth had experienced an out-of-home institutional placement since beginning Wraparound (for example, placement in a group home or psychiatric hospital, coded as yes = 1/no = 0). Outcome 2 captured whether the youth had been treated in an emergency room for a mental health problem since starting Wraparound (coded as yes = 1/no = 0). Outcomes 3 and 4 captured the likelihood of agreeing or strongly agreeing to the family’s needs being met (outcome 3) and home life improving (outcome 4) since starting Wraparound. Originally, outcomes 3 and 4 were coded as a five-option Likert agreement statement, but for the purposes of the logistic regressions responses were collapsed such that agree or strongly agree = 1 and all other responses = 0. In all logistic regression models, robust standard errors were utilized to account for clustering of responses. Odds ratios were used from each model to assess the association between the total fidelity score and domain-specific scores and each outcome. The models for outcomes 1 and 2 were limited to 499 responses from caregivers and facilitators who answered all fidelity items, while the models for outcomes 3 and 4 were limited to 341 responses from youth and caregivers who answered all fidelity items. In all models, respondents were included simultaneously (i.e., their own scores were used to predict their own outcome ratings). Models were estimated using the glm function in R (R Core Team, 2022)
Ability of the WFI-EZ to accurately classify respondents into experiencing the outcome of interest was evaluated using receiver operating characteristic (ROC) curves, which were plotted for each outcome by the total fidelity score and by domain-specific scores. Area under the curve (AUC) values were calculated for each model to quantify the goodness of fit, where higher values represent better discriminatory properties of the instrument. The following AUC ranges were utilized to interpret the results: 0.5 = no value; 0.51 – 0.69 = poor; 0.70 – 0.79 = fair; 0.80 – 0.89 = good; 0.90 – 0.99 = excellent; 1 = perfect (Carter et al., 2016). AUC values close to 0.5 indicate that the model performs no better than random chance at accurately classifying respondents into experiencing the outcome of interest. ROC curves and AUC values were created using the pROC package (Robin et al., 2011).
Results
Descriptive Statistics and Reliability
Responses to the four items from Section A of the WFI-EZ indicated very high levels of positive endorsement that basic components of the Wraparound process were achieved. Regarding team creation, 95% of responses indicated that the family was part of a Wraparound team (99% for youth, 91% for caregivers, 96% for facilitators, and 93% for team members). Similarly, 96% of responses indicated that the team worked together to create a written Wraparound plan (97% for youth, 91% for caregivers, 98% for facilitators, and 99% for team members). A majority of responses (95% overall, 98% for youth, 91% for caregivers, 95% for facilitators, and 99% for team members) showed that the team met regularly, defined as meeting approximately once a month. Finally, 95% of responses revealed that the team’s decisions were informed by input from the family (90% for youth, 91% for caregivers, 99% for facilitators, and 100% for team members).
Item-level descriptive statistics for the 25 fidelity items are displayed in Table 1. Apart from the six negatively worded items, almost all the respondents endorsed the fidelity items positively, with most responses falling in the strongly agree or agree categories. This trend is most prominent with item eight (“team reviews progress made”) where 48% of respondents strongly agree and 47% of respondents agree and item three (“vision of better future”) where 52% of respondents strongly agree and 44% of respondents agree. Related to the overall positive endorsement of the WFI-EZ, there are 13 positively worded items where 1% or less of responses fell into the strongly disagree category (items 3, 4, 5, 6, 8, 10, 11, 13, 14, 19, 20, 22, and 25). The overall WFI-EZ demonstrated very good internal reliability, with a Cronbach’s alpha of 0.88 and McDonald’s omega of 0.92 (DeVellis, 2012). Despite the high overall internal reliability of the WFI-EZ, there are several items that demonstrate poor item-test correlations. Most notably, all the negatively worded items do not correlate well with the overall test score, with item-test correlations ranging from 0.21 to 0.44. Additionally, positively worded item 18 (“ideas are things accomplishable by family”) also demonstrates a poor item-test correlation of 0.28. With the exception of item 16, the remaining positively worded items all exhibit item-test correlations above 0.50, ranging from 0.54 to 0.68. The same general pattern was found regarding item-rest correlations, with the negatively worded items and item 18 exhibiting very low correlations and most of the remaining positively worded items exhibiting correlations above 0.50.
Confirmatory Factor Analyses
Factor Loadings from Confirmatory Factor Analyses.
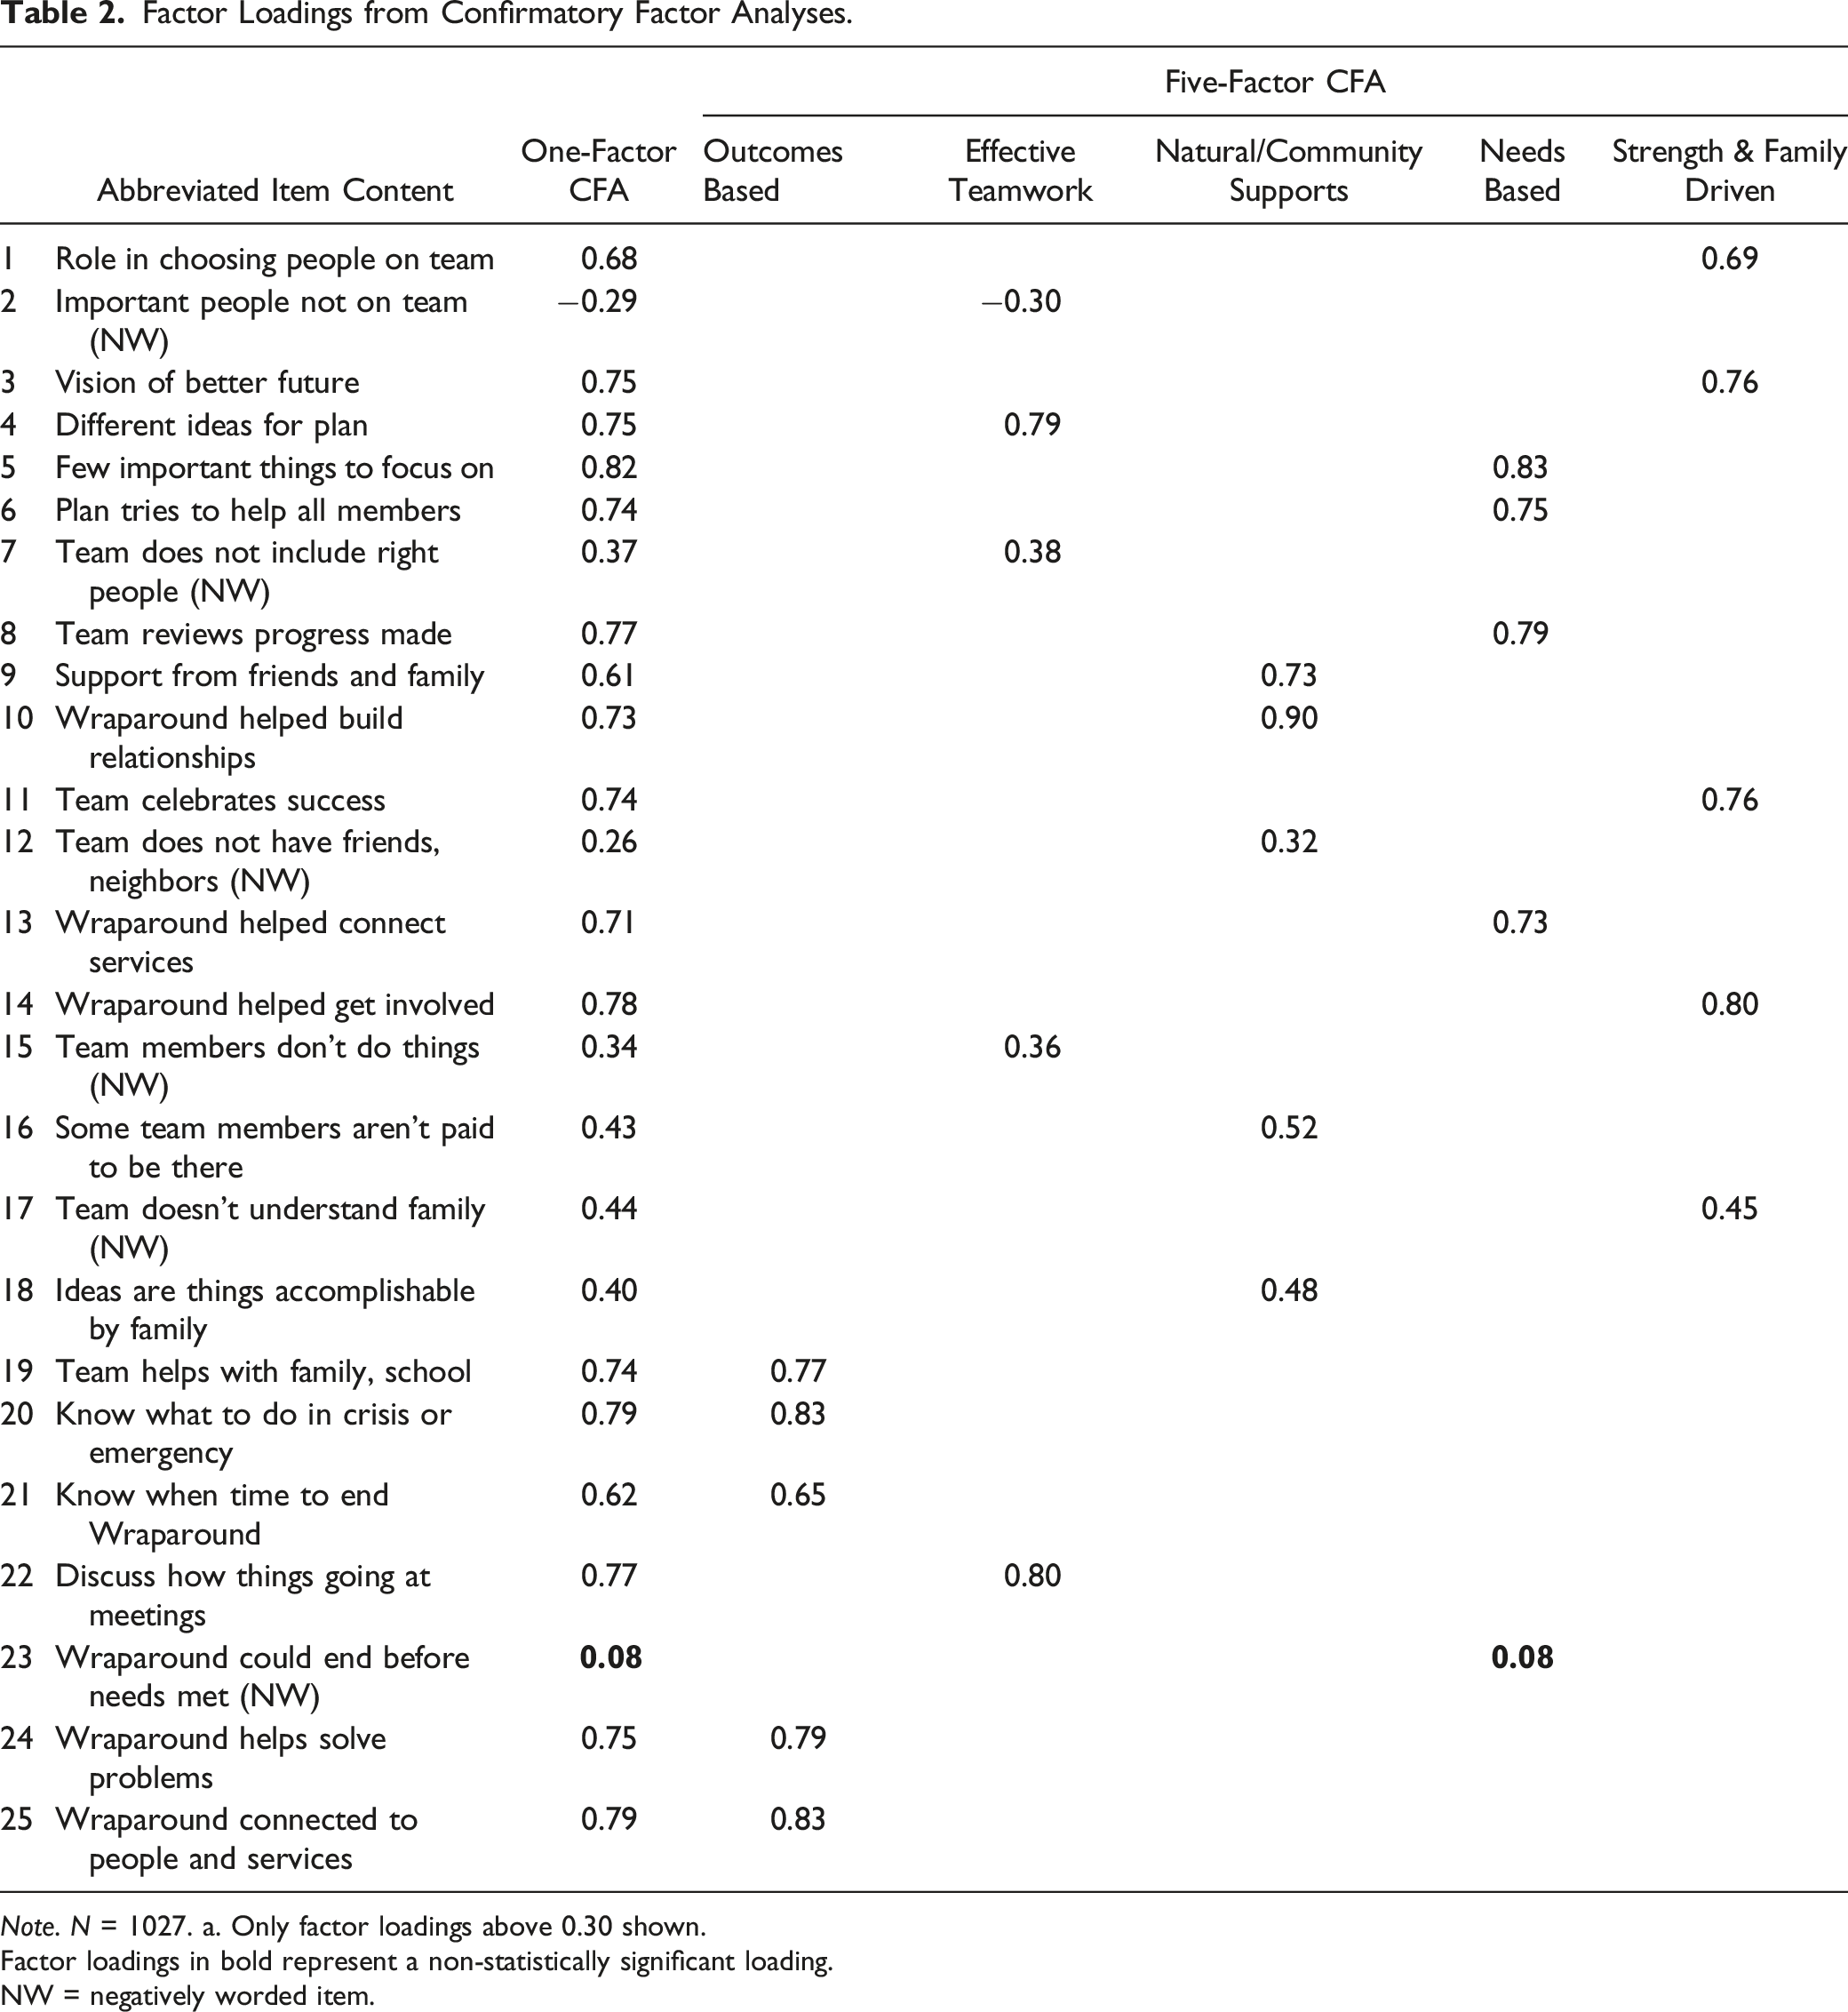
Note. N = 1027. a. Only factor loadings above 0.30 shown.
Factor loadings in bold represent a non-statistically significant loading.
NW = negatively worded item.
The five-factor model as hypothesized by the instrument developers demonstrated only incrementally better model-data fit (M
Differences by Respondent Type
Kernel density plots showing the distribution of scores by respondent type are displayed in Figure 1. For the one-factor model (Figure 1(a)), the distribution of the total score was relatively the same for facilitators and team members, while the density plot for youth and caregivers indicated a lower level of higher fidelity scores compared to the facilitators and team members, particularly around the score of 80. Examination of density plots by the five sub-domains (Figure 1(b)) provided some evidence as to what may be driving these differences. The density plots for the outcomes-based and natural/community supports domains appeared relatively similar across all respondent types. However, in the needs-based services and strength-and-family driven domains, facilitators and team members tended to provide a greater proportion of high scores on the fidelity items. Additionally, in the effective teamwork domain youth tended to provide a slightly greater amount of lower scores. Across all domains, the density plots indicate that in general, youth tend to provide a greater proportion of lower scores. Kernel Density Plots from Analysis of WFI-EZ Data.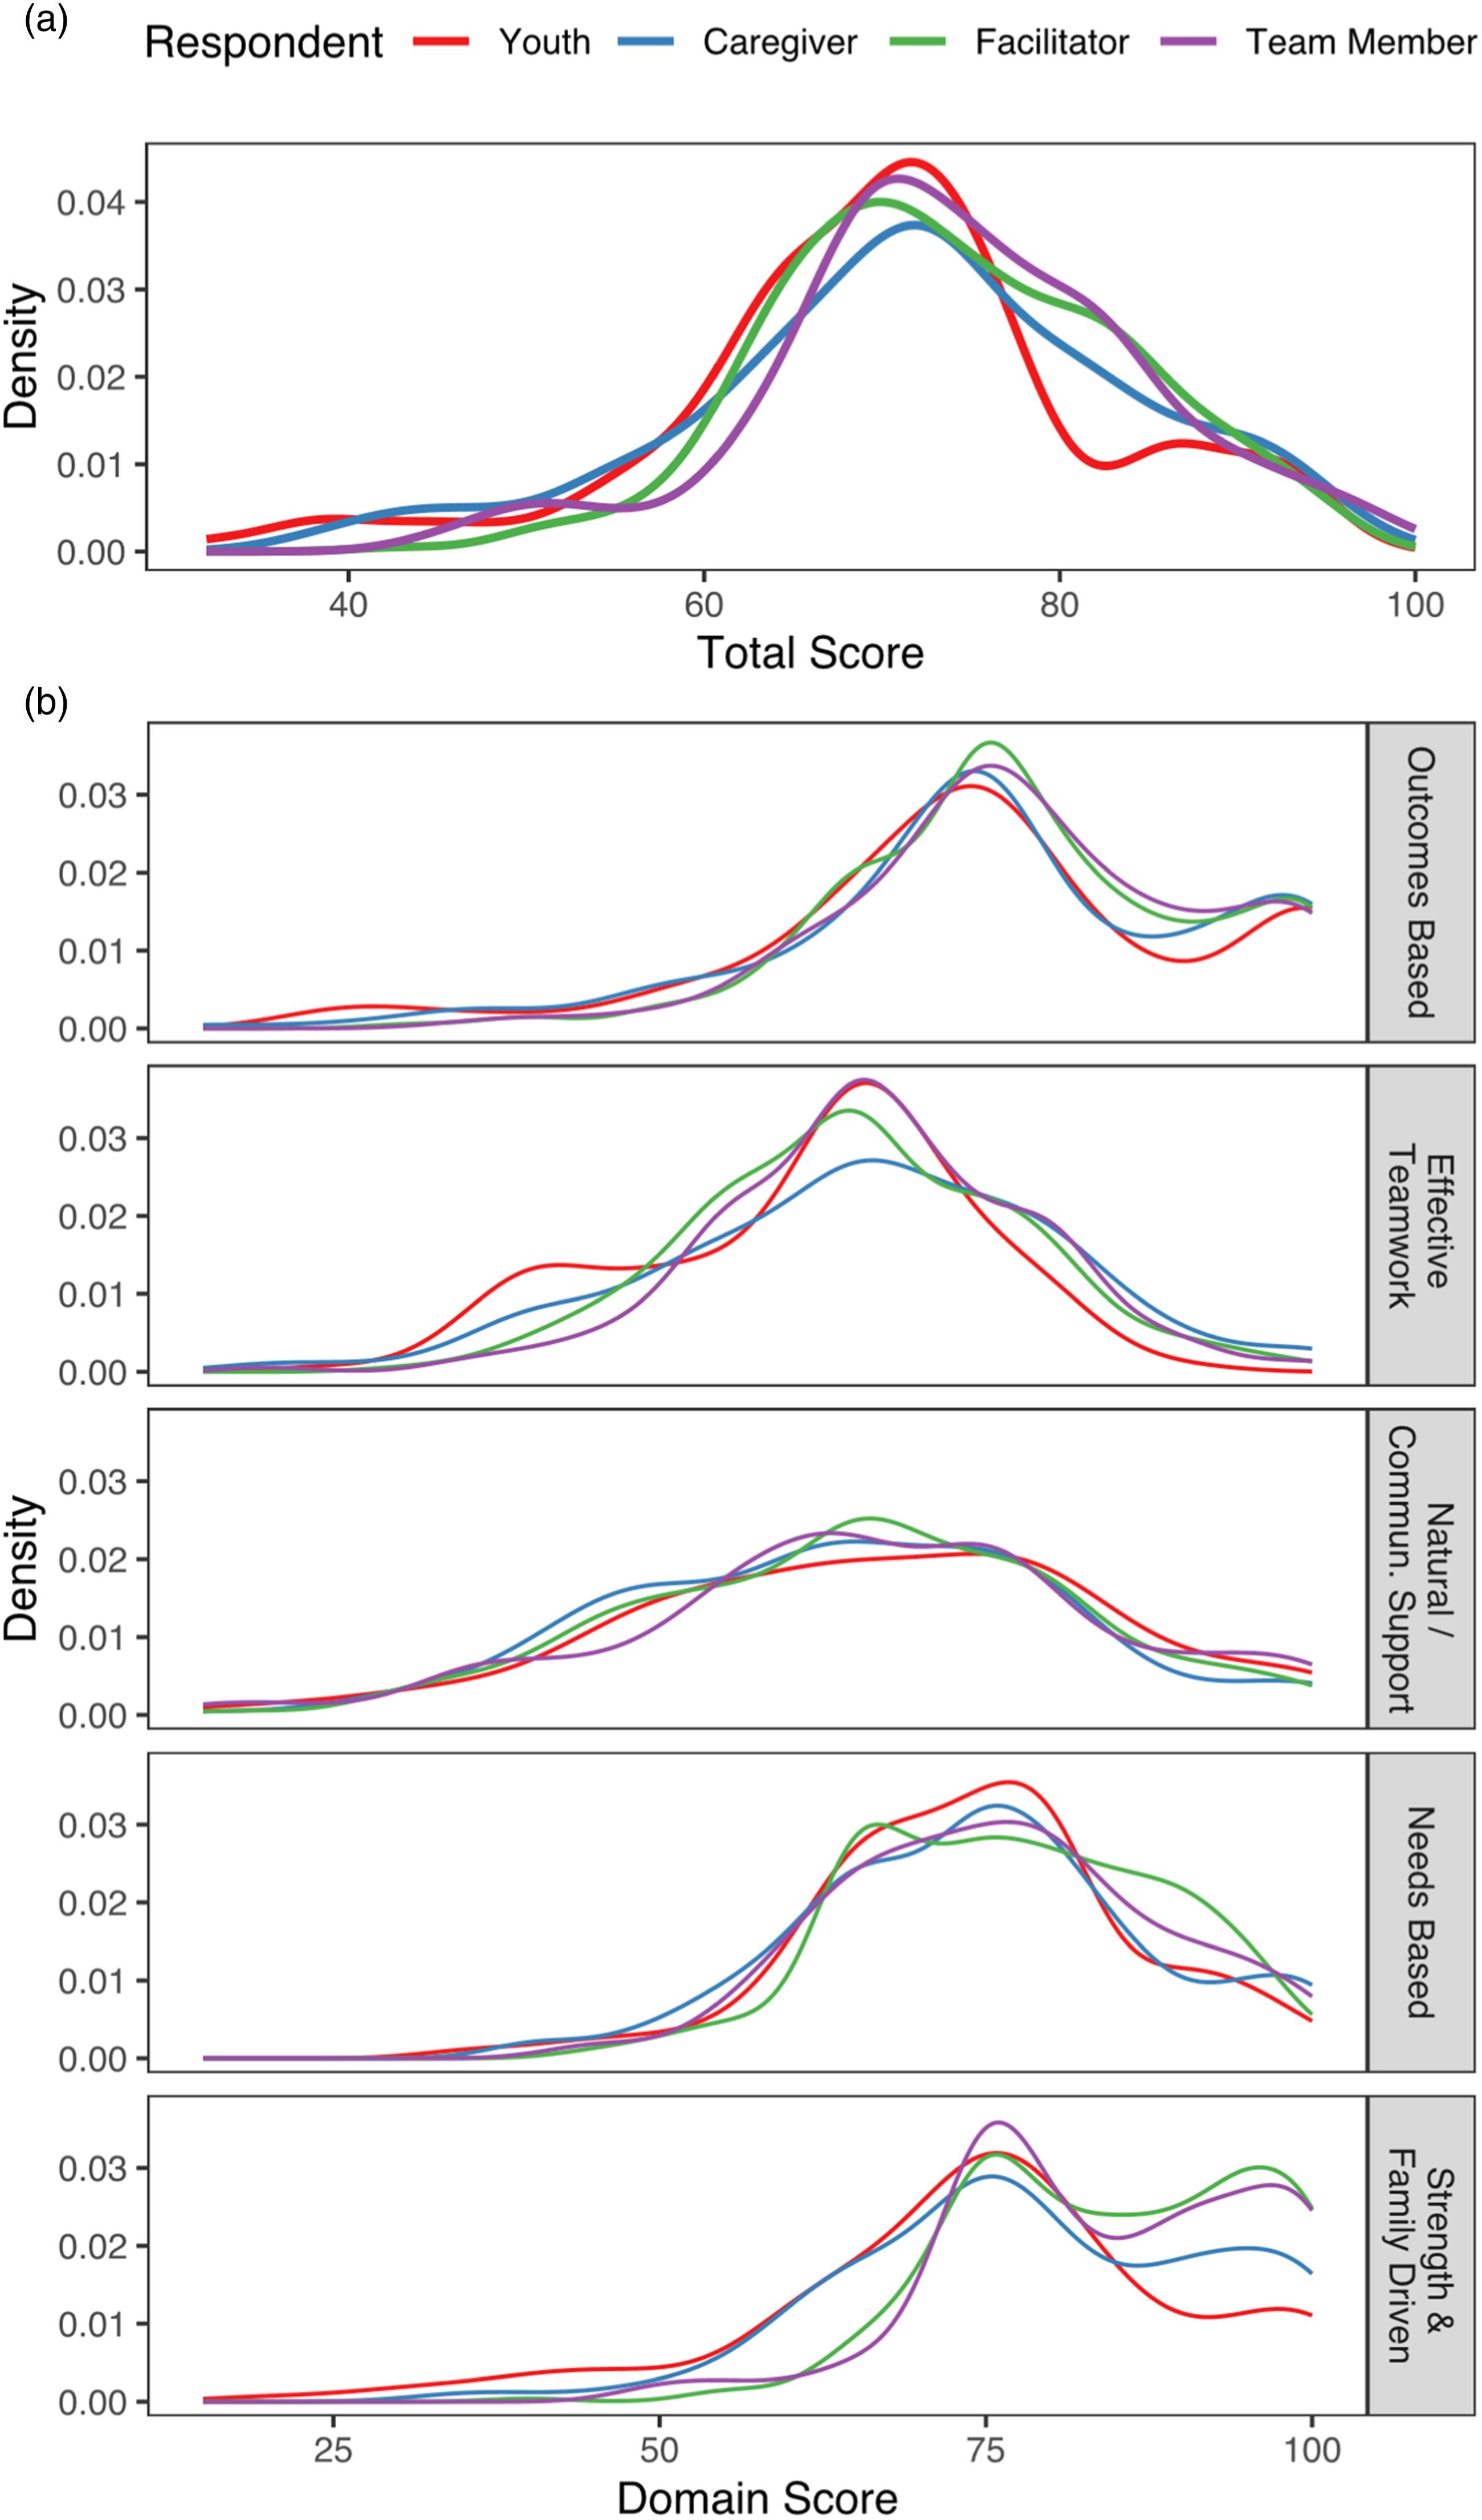
Predictive Validity Analysis
Results of the predictive validity analysis are displayed in Figure 2. For items aligned to the one-factor model (see Figure 2, panels A1 and A2), as total fidelity scores increased, the odds of experiencing an out-of-home institutional placement (OR = .98 p = .03) and ER visit for mental health (OR = 0.97, p < .001) significantly decreased. As total fidelity scores increased, so too did the odds of reporting that needs were being met (OR = 1.13, p < .001) and that home life had improved (OR = 1.15, p < .001). Accuracy of these model predictions were in the range of “no value” for the institutional placement and ER visit outcomes, and in the range of “good” for the needs met and home life improved outcomes. Predicted probabilities and receiver operating characteristic (ROC) curves.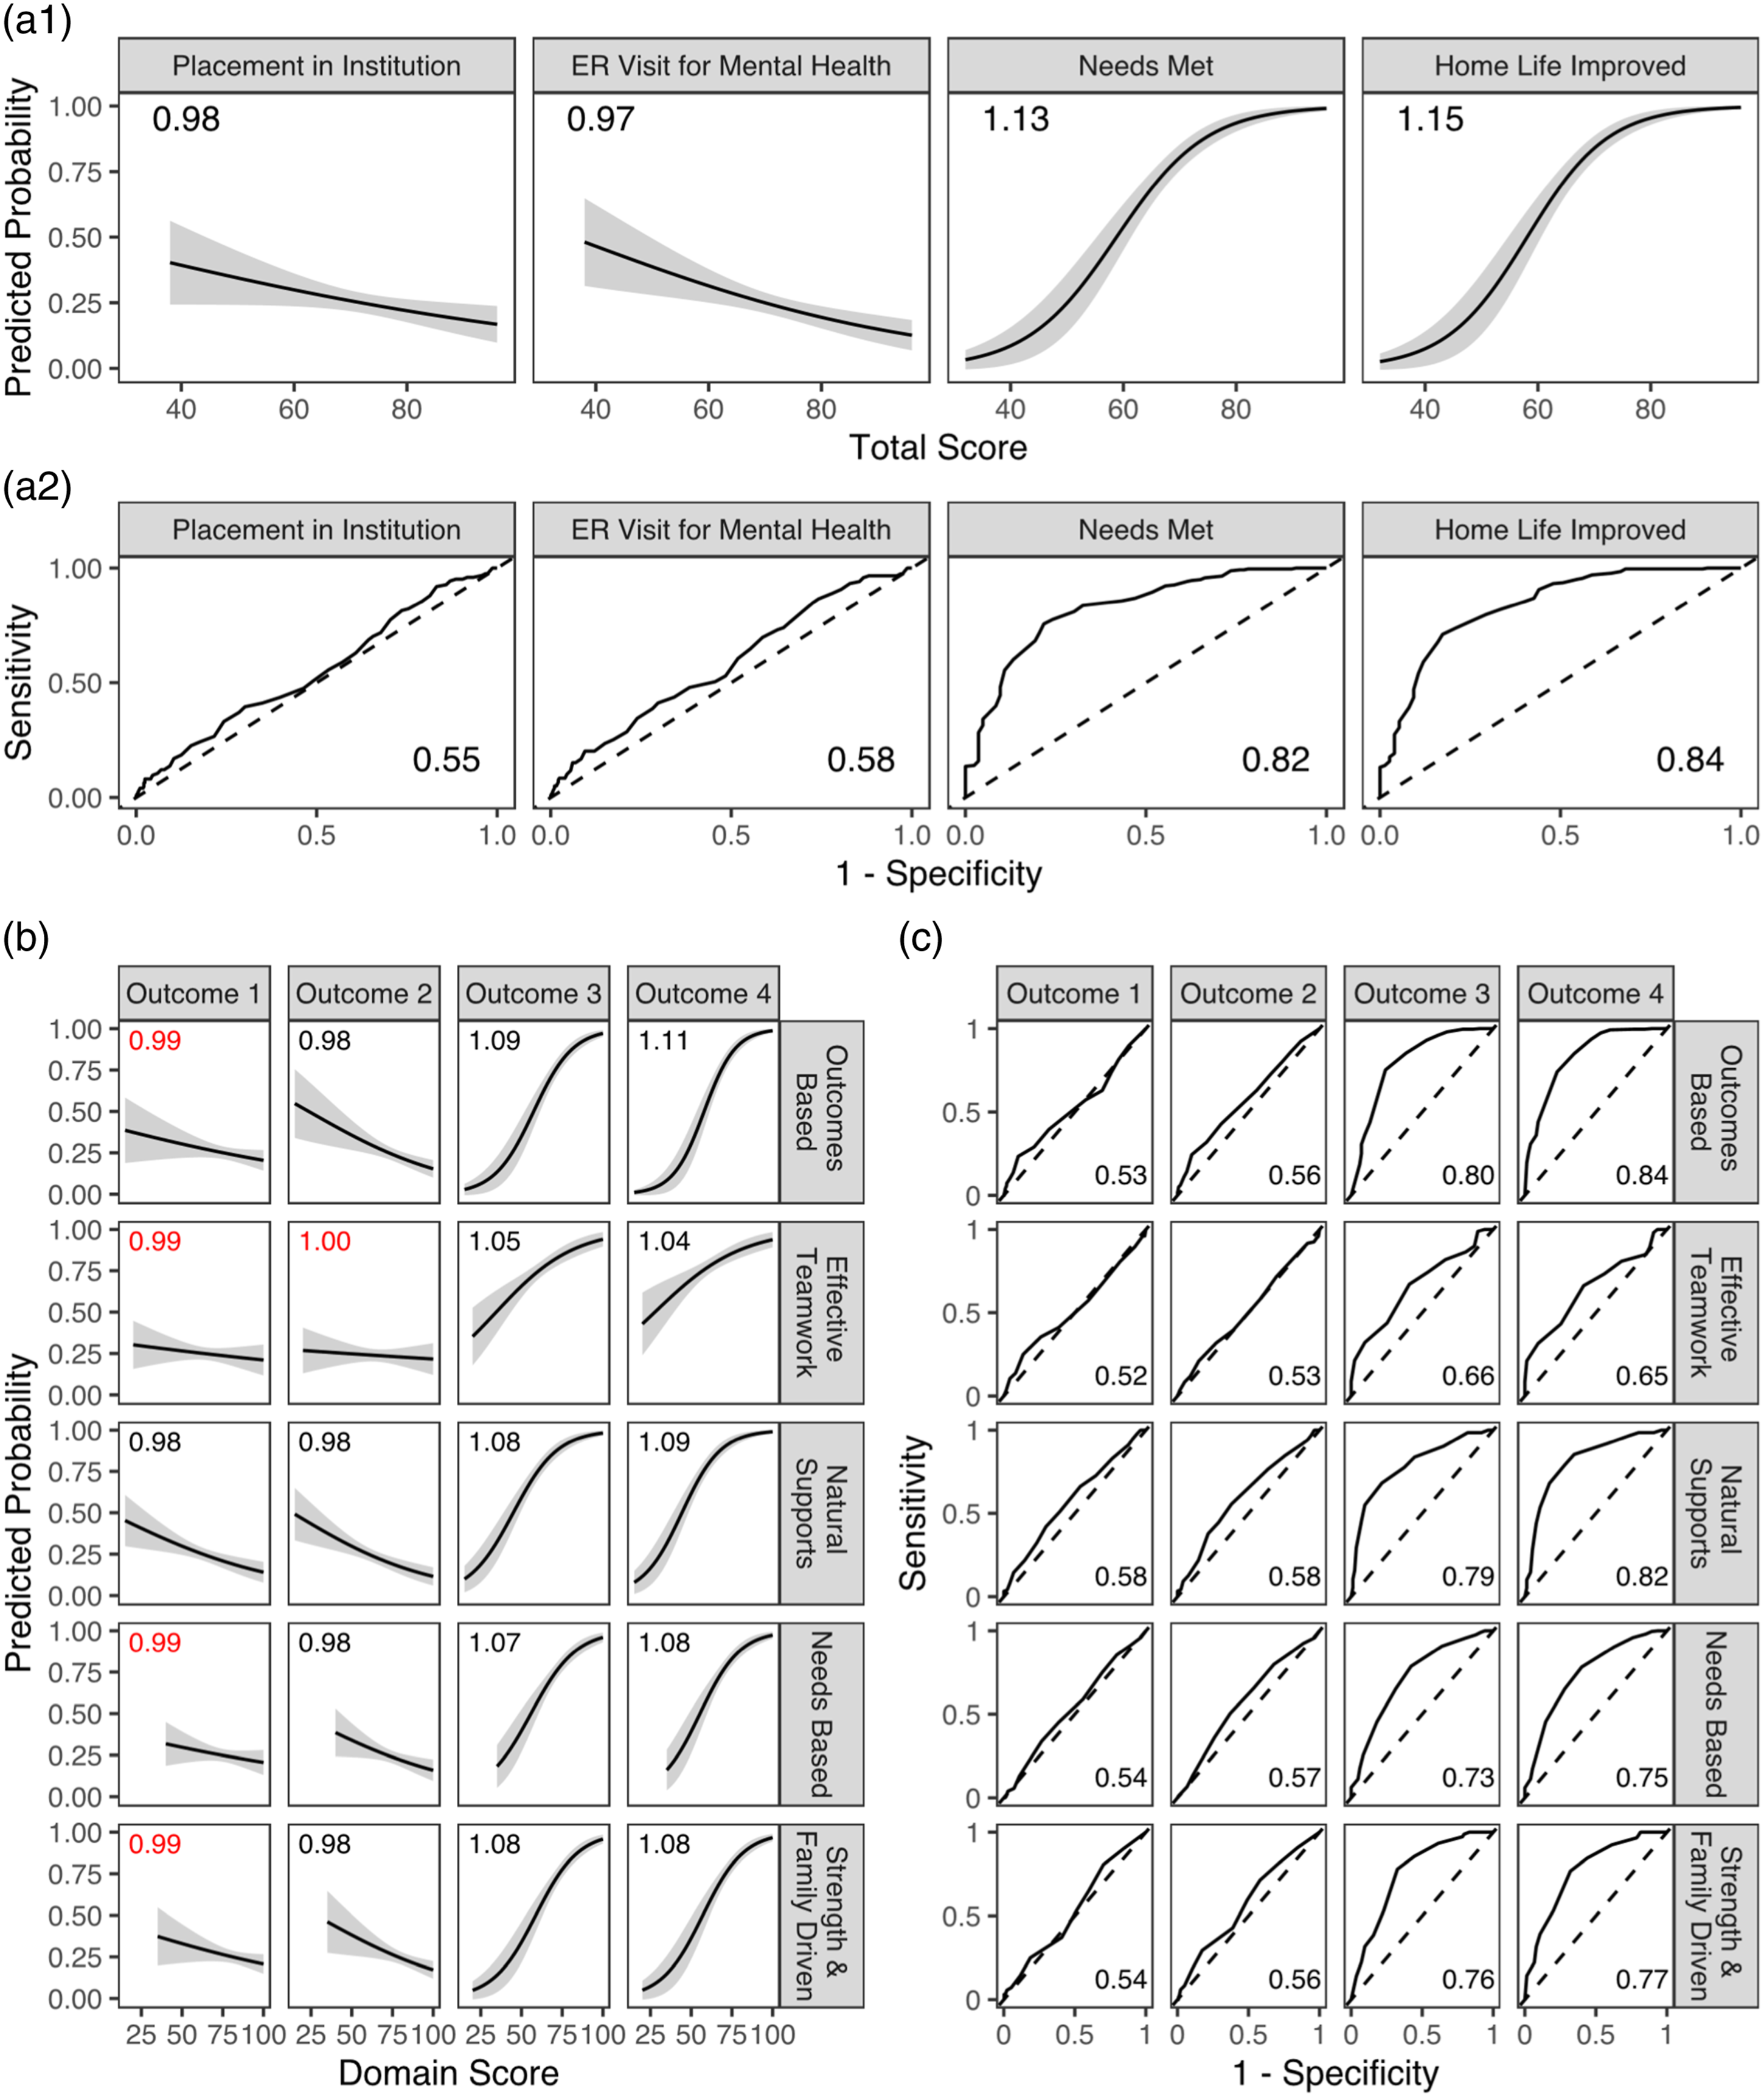
A similar pattern was found when examining the predictive validity of the five sub-domains (see Figure 2, panels B and C). Generally, as sub-domain scores increased, the odds of experiencing an out-of-home institutional placement and ER visit for mental health decreased, though several of these associations were not statistically significant. As sub-domain scores increased, the odds of reporting that needs were being met and that home life improved also increased. While the odds ratios for these two latter outcomes were all statistically significant, they were somewhat weaker compared to the odds ratios from the one-factor model. AUC values were also consistently weaker across the sub-domain scoring approach. For the institutional placement and ER visit outcomes, AUC values were in the range of “no value”. For the remaining outcomes, AUC values were generally in the range of “fair” or “good”.
Discussion
The purpose of this study was to examine the measurement characteristics of the Wraparound Fidelity Index Short Form (WFI-EZ) beyond the initial pilot testing carried out by the developers of the instrument. Utilizing a sample of 1027 WFI-EZ responses associated with Wraparound services from two care management entities in Georgia, we analyzed several properties of the scale, including item level response patterns, overall reliability, the factor structure of the instrument, differences in scores by respondent, and predictive validity of the instrument.
Regarding item-level characteristics of the WFI-EZ, several important conclusions can be drawn. Unfortunately, item-test and item-rest correlations indicated that the negatively worded items exhibited low associations with other items in the instrument as well as the total instrument score. Additionally, many of the items in the WFI-EZ exhibited ceiling effects, where the overall response patterns indicated that most individuals positively endorsed the items, either agreeing or strongly agreeing with the statements. Ideally, the response patterns in our sample would have more closely resembled a normal distribution, with a greater number of participants negatively endorsing at least some of the items. As pointed out by (Clark & Watson, 2016), most constructs measured by scales should occur on a theoretical continuum, where responses occur along any point of the positive/negative or high/low spectrum. Ceiling effects limit the amount of information provided by the scale by lowering its ability to discriminate, in this case, between high and low fidelity to Wraparound given that most participants highly endorsed the items (Clark & Watson, 2016). Despite the poor performance of the negatively worded items and these ceiling effects, the WFI-EZ exhibited good internal reliability, with a Cronbach’s alpha of 0.88 and McDonald’s omega of 0.92. This finding was similar to the WFI-EZ pilot study sample reliability coefficient of 0.94 (Sather et al., 2013).
The results of the confirmatory factor analyses indicated that the two a priori factor structures identified from the WFI-EZ developers did not fit the data well in the current sample. While the model fit indices were incrementally better in the five-factor model compared to the one-factor model, both models did not reach generally agreed upon thresholds for desirable model-data fit. Additionally, factor loadings between both models were generally the same, and negatively worded items consistently exhibited weaker loadings compared to the positively worded items. The results of the kernel density plots provided preliminary evidence of differential fidelity scores by respondent type. Generally, youth and their caregivers tended to provide lower assessements of Wraparound fidelity compared to facilitators and team members, which was especially apparent in the strength-and-family driven domain. A similar pattern was found for caregivers related to the four Section A items, where they consistently provided lower ratings across all four items compared to the other respondents. Regarding predictive validity, the WFI-EZ exhibited desirable discriminatory properties for two outcomes related to perceptions of needs being met and home life improving. However, for the outcomes related to experiencing a placement in an institution, or experiencing an ER visit for mental health, the WFI-EZ performed no better than random chance at classifying respondents.
Taken together, the findings of this study regarding the measurement characteristics of the WFI-EZ are mixed, but nonetheless have several important implications for evaluators and the health professions. One implication is the use of the WFI-EZ in ongoing fidelity monitoring and practice improvement. In January 2022, the Administration for Children and Families announced that intensive care coordination using a high-fidelity Wraparound process was added as a Title IV-E prevention program eligible for reimbursement under the Social Security Act as amended by the Family First Prevention Services Act (FFPSA). The inclusion of Wraparound to the list of Title IV-E prevention programs with a “promising” designation will require states who include it within the FFPSA plans to engage in rigorous evaluation that includes measuring program fidelity and continuous quality improvement (National Wraparound Initiative, 2022). As more state Medicaid and child welfare programs incorporate Wraparound as a reimbursable service, utilization of valid and reliable instruments to assess program fidelity become increasingly important to monitoring the quality of services provided and supporting workforce training and coaching opportunities. For example, Kernan (2014) describes how domain-level scores of the WFI-4 were used over a 3-year period in Erie County, New York to improve practice fidelity by targeting resources and attention to address low performing WFI domains. Such use of an instrument is predicated on the assumption that the domains are well established and that items are meaningfully loading onto specific factors.
The results of our study encourage careful consideration of how the WFI-EZ is to be used in practice to monitor Wraparound fidelity. Our study results did not indicate a preferential factor structure for the WFI-EZ and was unable to confirm the structures hypothesized by the WFI-EZ developers. Therefore, in addition to calculating total fidelity scores and fidelity scores by sub-domain, evaluators and those implementing Wraparound may wish to use the instrument at the item level to target specific conversations and gather input for process improvements (for example, in direct training and supervision of facilitators). Recently, the Wraparound Evaluation and Research Team released benchmark cutoff values that transform WFI-EZ scores into several fidelity groupings (inadequate, borderline, adequate, and high fidelity) (WERT, 2021). The statistical techniques and psychometric procedures used to derive these benchmarks were not well-reported and to the best of our knowledge have not undergone peer-review at the time of our writing. Considering the mixed findings of the current study, interpretations of such discrete categories should be carefully considered prior to implementation.
Of particular interest is the level at which the WFI-EZ is used to determine model fidelity. It remains unclear if the total score, sub-domain scores, or recently established thresholds should be used to determine overall fidelity for an entire program or site, or should instead be used at the youth and family level to help improve fidelity at a smaller scale. Given the mixed findings of the current study and until clearer characteristics of the instrument can be identified following additional research, the WFI-EZ may be better suited for lower stakes evaluation purposes. Additionally, the WFI-EZ should be considered as one of several complementary tools available in the Wraparound Fidelity Assessment System (WFAS) to broadly understand Wraparound fidelity. For example, Bartlett and Freeze utilized scores from the WFI-EZ in combination with the Team Observation Measure (TOM-2) to gain a comprehensive assessment of Wraparound fidelity at one Canadian urban community health center (2021). The WFI-EZ is likely ideal for regular pulse checks to understand the perceptions and experiences of those in Wraparound programs and may provide powerful insights when paired with additional tools, such as ongoing chart reviews of enrolled youth and collection of additional fidelity assessments from WFAS.
Additionally, the findings of our study contribute to a broader ongoing debate among scale developers regarding the utility of negatively worded items in instruments. Two main arguments exist among psychometricians. Some argue that negatively worded items bring value to instruments by serving as a check against careless responses, where participants may be ignoring item content to quickly complete a survey (Meade & Craig, 2012). Conversely, others contend that negatively worded items detract from a scale by causing difficulties in cognitive interpretation of the item due to shifting between positive and negative item wording (Dalal & Carter, 2014; Roszkowski & Soven, 2010). The results of both the item response patterns and factor analyses in this study indicated that the negatively worded items in the WFI-EZ did not function well with the positively worded items, lending support to the notion that negatively worded items detract from otherwise well performing instruments.
Development and validation of new instruments is not always a straightforward, linear process. The WFI-EZ itself was developed to provide a shorter and less-resource intensive version of the original Wraparound Fidelity Index (WFI), but to date the measurement characteristics of the instrument have been largely unexplored despite a decade of existence. Unlike the original WFI instrument, which underwent four revisions over time, no updates have been made to the WFI-EZ, perhaps under the assumption that the instrument was performing as intended from a measurement perspective. Given the results of our study, the WFI-EZ developers may wish to consider at least two important issues in any revisions to the instrument. First, the instrument may function better if the negatively worded items were changed to be written in the “positive” direction, or replaced with alternative positively worded items. Second, WFI-EZ developers should consider how to account for the potentially higher item responses that may come from facilitators and team members, who may be more likely to positively endorse their own performance compared to youth and their caregivers. To that end, future research could perform measurement invariance modeling to more robustly examine the factor structure of the WFI-EZ by respondent type. The impact of the respondent type could also be further explored by stratifying the types of predictive validity analyses we performed in the current study by respondent type, or by examining validity using fidelity scores from youth to predict the outcome measures in Sections C and D that are reported by caregivers and facilitators.
As with any study, our findings have limitations that must be considered. One limitation of our study is that the respondents in our sample were only involved in Wraparound services for a minimum of three to 6 months when the survey was completed. The ceiling effects exhibited in our analysis could have been a result of respondents being initially pleased with Wraparound services and they may have responded differently to the items further into the program. The duration of youth and family participation in Wraparound is expected to require approximately 10–18 months on average for successful outcomes (Miles et al., 2019). However, families’ decisions to opt out of services early or payors’ decisions to discontinue authorization of services prior to the average duration period or completion of services may also influence how participants respond to items. Accordingly, future research should examine the properties of the WFI-EZ among respondents with a greater length of enrollment and at different time points within that enrollment period while also exploring any external factors that may influence Wraparound implementation and program fidelity. Our sample was also limited to a portion of youth and families receiving state-funded Wraparound services in one state, and the results may have differed by including individuals receiving services through Medicaid managed care, private insurance, or other funding mechanisms. As such, future research should attempt to include more diverse samples in psychometric analyses of the WFI-EZ, which could include varied funding streams, data from additional states, or nationally representative data.
Conclusion
Our analysis of the WFI-EZ resulted in mixed findings regarding the measurement characteristics of the instrument. At the item level, much of the positively worded content of the WFI-EZ exhibited ceiling effects and the negatively worded content did not function well with the other items. Regarding the factor structure of the WFI-EZ, this study was unable to confirm the two a priori structures identified by the scale developers. However, the overall reliability of the instrument was found to be very good and for certain outcomes, the WFI-EZ exhibited desirable predictive validity. These findings are indicative of the challenging, iterative process of creating, validating, and refining new instruments. Importantly, we contend that the WFI-EZ remains a useful instrument deserving of continued implementation, psychometric testing, and refinement. Many opportunities exist to replicate and extend our analysis using data from other sites, as well as with national data.
Footnotes
Declaration of Conflicting Interests
The author(s) declared no potential conflicts of interest with respect to the research, authorship, and/or publication of this article.
Funding
The author(s) disclosed receipt of the following financial support for the research, authorship, and/or publication of this article: The collection of the data used in this analysis was supported by funding from the Georgia Department of Behavioral Health and Developmental Disabilities (DBHDD), Division of Behavioral Health, Office of Children, Young Adults, and Families.
Authors Note
The content of this manuscript is solely the responsibility of the authors and does not represent the official views of DBHDD.