
Abstract
There is a growing body of research that suggests that video-based interventions, such as video modeling and video prompting, are effective tools for teaching academic skills to struggling learners. This study used a single subject, multiple-baseline-across-subjects design to evaluate whether a video-prompting intervention could effectively assist five second grade students who had been identified by their teachers as “struggling” in mathematics to better solve multiplication story problems. Five second grade students (one female and four males) ages 7 to 8 viewed the intervention videos on an iPad that modeled how to solve multiplication word problems. To evaluate the effectiveness of the videos, a rubric was used as the primary measure to assess the domains of problem-solving, communicating, and representing with numbers. Based on visual analysis between baseline and intervention, there was a functional relationship between the introduction of the intervention and the performance on the mathematic problems. In addition, a visual analysis between intervention and maintenance appeared stable for all participants. Lastly, the social validity data had overall positive results. These results indicate that technology can be used to implement interventions for struggling learners and may be utilized in regular classrooms. Results also demonstrate that video modeling can be a useful instructional tool for helping many individuals, not just those with an identified disability, to learn complex tasks. Implementing video models in a classroom setting could enable teachers to consistently provide interventions to students that work more independently, allowing teachers to work on a more one-on-one or small group basis with their students.
Keywords
Introduction
Many students struggle with mathematics (Witzel & Riccomini, 2007). In the 2022 National Assessment of Education Progress (NAEP; National Center for Education Statistics, 2022), only 40% of students without disabilities in 4th grade and only 30% in 8th grade were at or above NAEP proficient. Whereas only 16% of students with disabilities in 4th grade and 7% in 8th grade were at or above NAEP proficient in 2022. Both percentages for 8th graders are the lowest they have been since 2003 and 2005 respectively. For students with disabilities in 4th grade, the scores lowered 1% from 2019, but is within 2% of the same score for since 2005. Whereas students without disabilities are at the lowest percentage they have had since 2005 at 39%, with the highest percentage being in 2019 at 45% proficiency. The unchanging and slightly lower status of mathematics proficiency is a problem because it means that the changes made to curriculum, or attempts to change instruction, have had little to no effect. Witzel and Riccomini (2007) further stated that there is an even greater need to improve mathematic instructional procedures for low-achieving students with and without disabilities. Although educators are implementing instruction that focuses on developing early mathematical thinking, the current scale at which this instruction is being utilized is too inadequate to affect a significant impact on students’ poor mathematical performance. Effective use of instructional technology and manipulatives could increase the effectiveness and scale of instruction implementation could result in a positive change in K-12 mathematical outcomes. Within the National Council of Teachers of Mathematics Research Brief Clips (2007), researchers identified several strategies that have been found in currently available research to be consistently effective in teaching students who experience difficulties in mathematics. These strategies encompass the following activities: (a) structured learning activities that engage student peers in the learning process, (b) visual representations used to make instructions more systemic and explicit, (c) collecting data from formative, student assessments (such as in-class discussions, quizzes, and other activities) which is then used to modify instructional directions, (d) giving students the chance to think through their work aloud, and (e) formative assessments given directly to students. These strategies focus on utilizing students, in-class data, and more formative communications to assist the learning process. This study will focus on the visual representations aspect to improve students’ academic success in mathematics. Despite knowing the potential effectiveness of this, collectively utilizing the strategies has been elusive to manage (National Council of Teachers of Mathematics, 2014).
Although various teaching strategies have been implemented that incorporate a number of these strategies, discrepancies continue to persist between student academic needs and the supports or interventions available to help struggling students (Council of the Great City Schools, 2009). The Council of the Great City Schools report (2009) stated that, based on estimates provided by the districts, slightly more than 50% of all incoming 9th grade students performed below grade level in math, but only 31% of the students received support in the form of remedial mathematic instruction or interventions. Without that instructional support or intervention, it is almost guaranteed that these students will not be prepared to succeed in mathematics as they progress through the school system.
In addition, Berkeley et al. (2008) stated that many students who struggle with mathematics may not meet eligibility requirements for special education, which limits their access to guaranteed tiered support. If a student does not meet the criteria for special education as defined by the Individuals with Disabilities Education Improvement Act (2004) classification, then they will not be able to receive individualized services in mathematics and will rely solely on the fidelity of optional interventions from their classroom teacher (Berkeley et al., 2008). The high percentage of students who are below proficiency and who also do not qualify for additional support are defined as struggling learners. The term struggling learners captures the difficulty that many students experience, and includes both students whose struggle may be temporary, as well as those students who experience persistent conceptual difficulties that make mathematics more difficult to learn (Allsopp et al., 2007).
In an effort to help these struggling learners, video modeling has been put forward as a potential educational solution. Video modeling is an evidence-based practice that educators are currently using with students as a means of teaching and differentiating instruction (Bellini & Akullian, 2007). With video modeling, a video of a desired task is shown in its entirety to a student. After watching a video of a desired skill or behavior being performed successfully, the student is then expected to perform the target behavior from start to finish (Mason et al., 2013). This type of intervention has had positive results in teaching critical skills in areas such as academics, language, social skills, and self-care to students (Cihak et al., 2012a). Instructional implications of video modeling include less demand on teacher instructional time, which in turn provides more time for teachers to provide targeted instruction to specific students (Blood et al., 2011). The visual aspect of video modeling has also been found to (a) be more conducive to improving learning of students with autism (Cihak et al., 2012b), and (b) require less time to acquire a new skill (Blood et al., 2011). Most importantly, visual modeling has the potential to lead to a greater generalization of the learned skill (Buggey & Ogle, 2012).
Video modeling, augmented reality, and other types of technology to teach mathematics is a growing field of research. One study looked at teaching students with learning disabilities geometry word problems using video modeling (Satsangi et al., 2020). Using a single subject multiple baseline design, they found that all three of their students improved in their problem-solving performance across all domains (Satsangi et al., 2020). Video modeling has also been used to teach Autistic students how to solve fraction computations (Yakubova et al., 2020). Yakubova and colleagues (2020) found video modeling to be effective and their students had 100% accuracy by the end of the study. Mathematics was also taught using video modeling, augmented reality, and explicit instruction combined to students with disabilities (Morris et al., 2021). They found that their students performed very well after the intervention and demonstrated continual high levels of maintenance.
A specific type of video modeling is video prompting. Video prompting involves having a student view a video in separate clips, with the expectation that the student will perform the task depicted in the recently finished clip before moving on to the next clip in the series (Cannella-Malone et al., 2011). Functional relationships have been established between video modeling and video prompting and with attaining behavior skills, social skills, transition skills, reading skills, vocational skills, and mathematic skills (Kellems & Edwards, 2015).
The purpose of this study is to investigate what effects iPad video prompting may have on the ability of struggling elementary school students to acquire new mathematical skills. This study will investigate the following experimental questions: 1. Based on a rubric that measures problem solving, communication, and the representation of numbers, what is the effectiveness of video prompting (independent variable) on the total points earned, based on a rubric (dependent variable) of students who struggle with mathematics? 2. What is the social validity of using video-based instruction to teach mathematics to elementary school students who struggle with mathematics? 3. How effective is video prompting over time after the intervention has been removed?
Method
Setting
This study was conducted in a suburban elementary school located in the Western United States with a total school population of 407. This school was chosen because of its existing relationship with the university. Forty-two percent of the students were considered economically disadvantaged. The participants were students found in 2nd grade who were in general education classes. Prior to the intervention, mathematic instruction for these students consisted of teachers delivering mathematic content to an entire class at once or within small groups. The interventions performed for this research project occurred two to three days per week in a vacant satellite classroom (trailer) at the elementary school. The interventions took place during science or social studies instruction or during weekly free time periods.
Participants
In order to find students with the necessary characteristics for this study, teachers from the designated school who agreed to work with the study were found. Once a teacher agreed to participate, they directed me towards specific students that fit the criteria for the purposes of this study.
Participating students were selected based on whether they
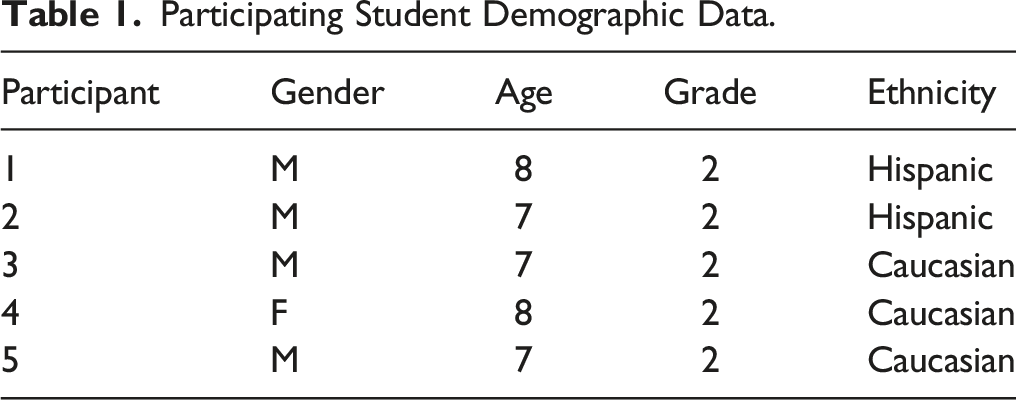
• were enrolled in the elementary school, • were between 6-12 years old, • had the ability to follow and respond to directions in English, • had not been receiving any special education services, and • had been identified by teachers or administrators as being at-risk for failure in mathematics as defined by repeated failure on mathematic curriculum-based assessments, unrelated to multiplication, for three consecutive months.
Participating Student Demographic Data.
Data Analysis
Data comparing baseline and intervention phases were visually analyzed for changes in level, trend, and variability. The objective of the research was to show a functional relationship between the dependent variable (total points earned based on a rubric) and the independent variable (video prompting intervention) by observing changes in the independent variable.
Materials and Videos
Target word problems were printed on task cards and then read to the participants to solve. The format of the problems was vetted by an expert with an EdD in curriculum and instructional science. Along with the card, participants were given scratch paper, pencils, and single unit counting cubes to aid participants in solving the target problems. The video obtained of the students was recorded using a digital video camera (JVC Kenwood Holdings Inc, n.d.). The male model in the video was a similar age to the students viewing the video. The video was uploaded to the VideoTote mobile application (Prevention Group, 2012) on the iPad, which allowed for the videos to be cut into individual segments that were then used as video prompting instructions aimed at solving the target problems.
The video was presented using an iPad (Apple Inc., 2011). The target problems followed the same format as the questions from the intervention video, “There are 2 cars. Each car has 4 wheels. How many wheels are there in all?” The 25 target questions were designed by a research assistant using different equations with factors ranging from two-six. Different descriptors and numbers were also used to increase variability of the questions. The 25 questions were based on the 3rd grade common core standards established by the Common Core State Standards Initiative (2010, 2020). 3rds grade standards were selected as a method of making sure the selected standards would not be taught in the classroom during the study and potentially interfering with the intervention. The standards include the requirement that 3rd grade students should be able to “interpret products of whole numbers, e.g., interpret 5 × 7 as the total number of objects in 5 groups of 7 objects each. For example, describe a context in which a total number of objects can be expressed as 5 × 7.” The questions were randomized for each session using a number sequence randomizer from Random.org (2020). Each participant had his or her own randomized sequence. A table was created that used a row to display session numbers which were then aligned with the unique card numbers.
Dependent Measure and Data Collection
Scoring Rubric.
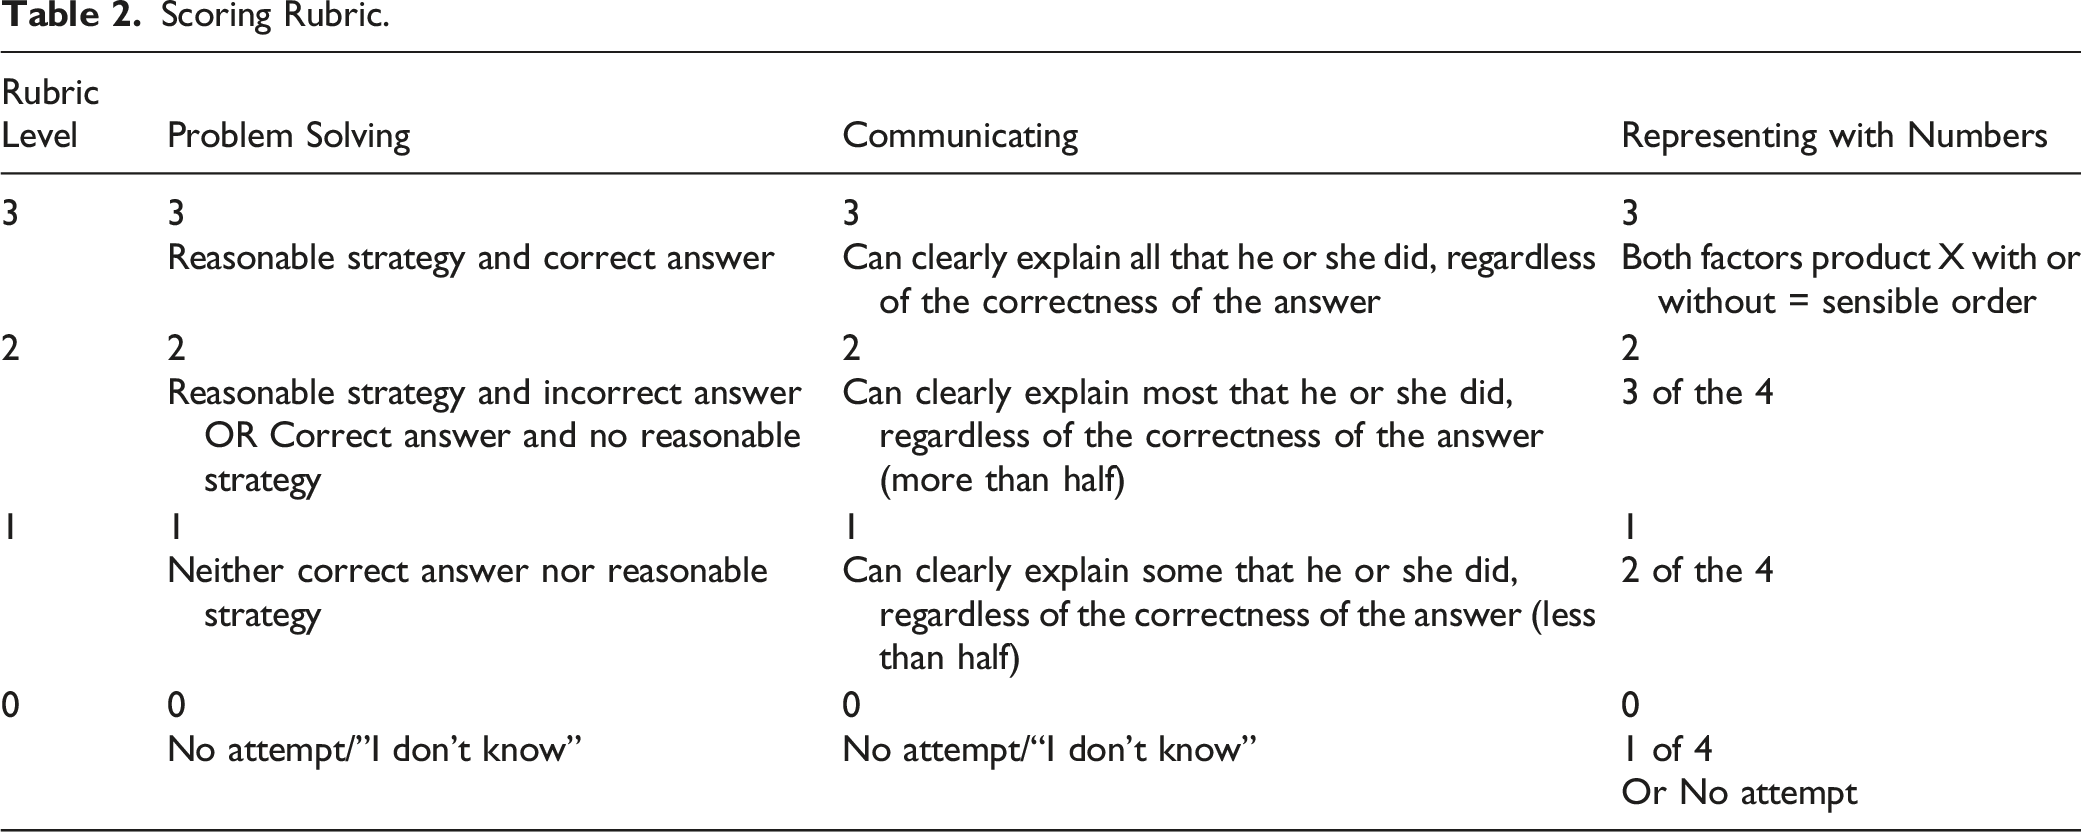
The problem-solving portion of the rubric was based on how well the student demonstrated a reasonable strategy for solving the target problem. A reasonable strategy is a strategy that makes sense mathematically, that is, a strategy that is mathematically sound. A score of three was given to students that demonstrated a reasonable strategy and who correctly solved the question. A score of two was given to students who demonstrated a reasonable strategy but got an incorrect answer or got a correct answer but did not use a reasonable strategy to reach the correct answer. A score of one was given to participants that did not display either a reasonable strategy or a correct answer. A score of zero was given when a participant did not attempt a question, or they gave the response “I don’t know.”
The communication portion of the rubric was based on how clearly explaining the steps taken to solve a problem, regardless of the correctness of the answer. A score of three was given for those that could clearly describe the steps they took to solve the problem. A score of two was given to those participants that could clearly explain most (more than half) of the steps taken to solve the problem. A score of one was given for clearly explaining some (less than half) of the steps taken to solve the problem. And a score of zero was given when a participant did not attempt to solve the problem, or they gave the response “I don’t know.”
The number representation portion of the rubric was based on a participant’s ability to write a numerical representation of the given story problem. The correct representations consisted of factors, the product, and the multiplication sign, and could be written with or without the equal sign. A score of three was given when a participant was able to use all the required parts in a correct, sensible order. A score of two was given when a participant used three of the four required parts. A score of one was given when a participant used two of the four required parts. And a score of zero was given when a participant used only one of the four of the required parts, made no attempt to represent the problem numerically, or gave the response “I don’t know.” The same, 9-point rubric was used during each student’s session to record scores based on how a participant solved each question presented in the session.
Procedures
Preassessment
Before participants started attempting to solve baseline problems, each was required to complete a 10-question, multiplication test. Five questions were multiplication story problems, and five questions were multiplication equations, based on the 3rd grade Common Core standards. For example, the following story problem was included: “There are 6 elephants. Each elephant has 4 legs. How many legs are there in all?” The other four questions were similar but used different numbers and descriptors. The preassessment questions were sufficiently spaced on the page, allowing students to work through the problems. The five equations were presented in a typical number sentence, (i.e., 3 X 5 = ). Again, the questions were sufficiently spaced, allowing the students to work through the problems.
Baseline
At the beginning of each session, the student received a randomized, multiplication story problem with different numbers and descriptors, similar to the word problem that was solved in the intervention video. Twenty-five word problems were developed, and the order of the questions was randomized for all participants. They were also provided with a pencil, paper, and single unit counting cubes.
Intervention
Pretraining
Students who participated in the study completed a pretraining session where they learned how to operate the iPad, as well as how to play the video in the VideoTote app (Prevention Group, 2012). During these sessions, how to open the app, find the video, play the video until it stopped, follow a prompt, complete the task demonstrated in the prompt, and press play again and continue was demonstrated for each student. The specific tasks modeled to the student were the steps of brushing one’s teeth. After the pretraining session were finished, participants were asked to access an unrelated video to confirm that they were able to independently navigate the iPad, based on a checklist of skills used to confirm they could continue through the rest of the study. All of the participants were able to pass the pretraining and could access the videos independently.
Intervention Sessions
Participating students viewed the videos using an iPad (Apple Inc., 2011) with a video demonstrating how to solve the equations and/or word problems. Intervention sessions took place approximately 3-5 times a week. No additional prompts were given on how to complete the tasks. All questions from the participants received a redirect to the videos.
Any spoken words were also visible, on screen, in text form. The model student was provided with place value blocks, paper, and a pencil that he could choose to use. The video model shows the following steps for solving the target problem: 1. An adult reads the following word problem to the model student (student of similar age) in the video: “I have two cars. Each car has four wheels. How many wheels are there in all?” 2. At this point, the video has a voiceover that says, “There are two cars. That means there are two groups. Each car has four wheels. That means there are four in each group. Think about your problem. How many groups are there? How many are in each group? 3. The model student then creates a visual representation (two groups with four in each group) of the word problem using the counting cubes. The voiceover narrator and says, “That is his first group. There are only four in that group. That is his second group. There are only four in that group. Do you see his two groups, with four in each group? 4. The voiceover narrator continues, “Now he is going to do it a different way by drawing a picture.” The model student then draws two larger circles (the groups) with four smaller circles in each group, making the picture resemble the aerial view of two cars. The voiceover narrator then says, “Do you see his picture of one car with four wheels and a second car with four wheels? Think about your problem. Show it with blocks, draw a picture, or do both.” 5. The app stops the video at this point, and the student follows the following prompt: “Think about your problem. Show it with blocks, draw a picture, or both.” 6. The student then presses play in the app and the adult in the video asks: “Tell me how you did it.” The model student proceeds to explain, “So for the blocks, I did two groups of four blocks in them because of the four wheels in each car. And then for the picture, I did one box with four wheels on the outside, and then for the other car, I did four wheels on the outside of that car and I got eight wheels.” 7. The voiceover narrator then says, “Your turn. Tell me how you did it.” 8. The video then pauses at this point so that the student can follow the prompt to tell the attending adult how they did it. 9. The student then presses play to resume the video. The adult in the video then asks, “Can you show me your thinking with some numbers?” As the model student writes, 2 X 4 = 8, the voiceover narrator says, “He is writing two times four. Two, because he has two groups. Times, and then four, because he has four in each group. Two groups of four is eight.” 10. The model student then says, “I did two multiplied by four because the two is for the two cars and the four is for the four tires on each car. And then, all the tires on each car equals eight tires.” 11. The video pauses with the equation displayed and the voiceover narrator says, “We call this a number sentence or equation. We read it like this: two times four equals eight. There are two groups. That ‘X’ means times or multiply. That means we are working with equal and fair groups. That four means there are four in each group. That eight is the total of all things in the groups. Remember, multiplying means you are working with equal and fair groups. Your turn. Show me your thinking with some numbers.”
The video, which was four minutes and thirty-three seconds, was edited using iMovie (Apple Inc., 2019) and viewed on an iPad in the Video Tote app (Apple Inc., 2011; Prevention Group, 2012). In the VideoTote app, the video was edited into short clips of each step of solving a multiplication story problem.
Maintenance
The students were asked to complete the tasks the same way they were asked during the baseline data collection exercise that did not provide access to the iPad (Apple Inc., 2011) or intervention video. Participants were asked to complete story problems from the same set of questions they were asked to complete during baseline and intervention phases. The data collector read the questions to the student, and the student was given a pencil, piece of paper, and place value blocks. Maintenance data was collected between 1 to 20 days after the last intervention session and was collected for 2–6 weeks, depending on the participant.
Post Assessment
A month after a participant reached the predetermined criterion in the intervention phase, he or she was given a posttest. All participants received an intervention probe with the video prompting intervention the day prior to taking the posttest. This assessment was identical to the pretest and had the same procedures. The posttest data was used to compare answers with the results from the pretest to determine if the video prompting intervention had effectively taught the participants how to independently obtain the correct answer for multiplication story problems.
The post assessment results were analyzed to determine if either (a) “Yes, the student can do the skill,” or (b) “No, the student cannot do the skill.” The participants will still be scored according to the rubric to determine if the steps were maintained over time.
Interobserver Reliability
To determine interrater reliability, the primary observer trained the reliability coder, who then viewed and scored randomly selected session recordings using the rubric. The interrater reliability is as follows: baseline, 86.4%; intervention, 86.3%; and maintenance, 87.1%.
Experimental Design
A multiple baseline design was used to determine whether or not a functional relation between the independent variable and the dependent variable existed (Kennedy, 2005). The independent variable was systematically introduced to different participants across different baselines. Once one participant received a 77% score based on the rubric across three consecutive sessions, the intervention was introduced to the next randomized participant. Baseline and intervention probes were conducted on participants as they started each intervention. The quality indicators of single-subject design were followed. Specifically, the What Works Clearinghouse (2010) Single-Case Design Technical Documentation was followed.
Results
In this study, a multiple baseline across five participants design was used to evaluate what effects video prompting intervention might have on elementary school children and their ability to solve multiplication story problems. Data analysis was performed for all five participants, ultimately showing a functional relationship between video prompting and each child’s learning of the steps required to solve the target story problems. Visual analysis was used based on previous research of single subject designs (Kennedy, 2005) All of the problems were outside their grade range, guaranteeing that they had not be introduced to the same material beforehand. It also helps show the efficacy of the video prompting for developing a student’s conceptual understanding versus procedural ability. Despite being outside the grade level students were able to complete the problems.
During the baseline phase, the average score was 38%. After the interventions were introduced, the average score increased to 87% across five to seven sessions for each participant. During the maintenance phase, the average was 93% across five to six sessions per participant.
Participant Results
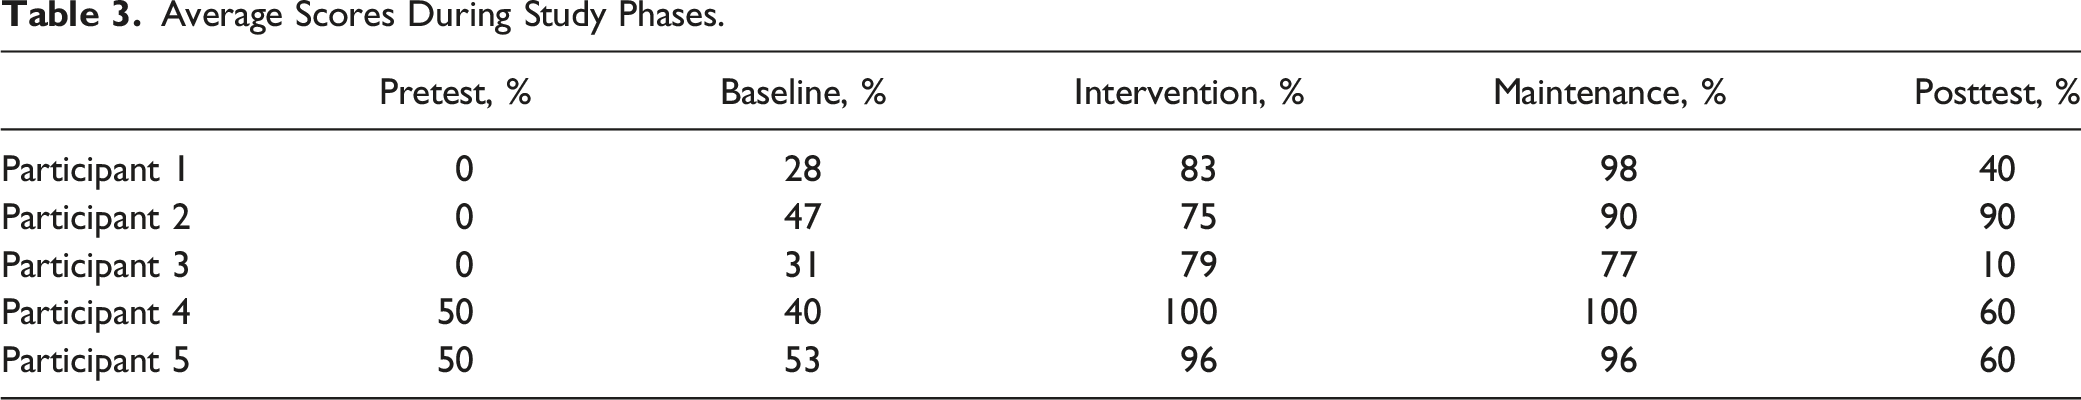
Average Scores During Study Phases.
Baseline
During the baseline phase, the averages for participants 1-5 across 51 trials on a 9-point rubric, respectively, were as follows: 28%, 47%, 31%, 40%, and 53%, for an overall baseline average of 40%. As shown in Figure 1, the range of scores varied from 22 to 66, for an average of a 35-point range. Before the introduction of the intervention, all participants had stable baseline scores. Participants 1, 2, and 3 were stable at 22%–33%, while participants 4 and 5 were stable at 44%; however, participants 4 and 5 had averages of 47% and 55% during their later baseline probes as they received the intervention toward the end of the study, taking maturation into account. Multiplication Skill Acquisition: Session Breakdown.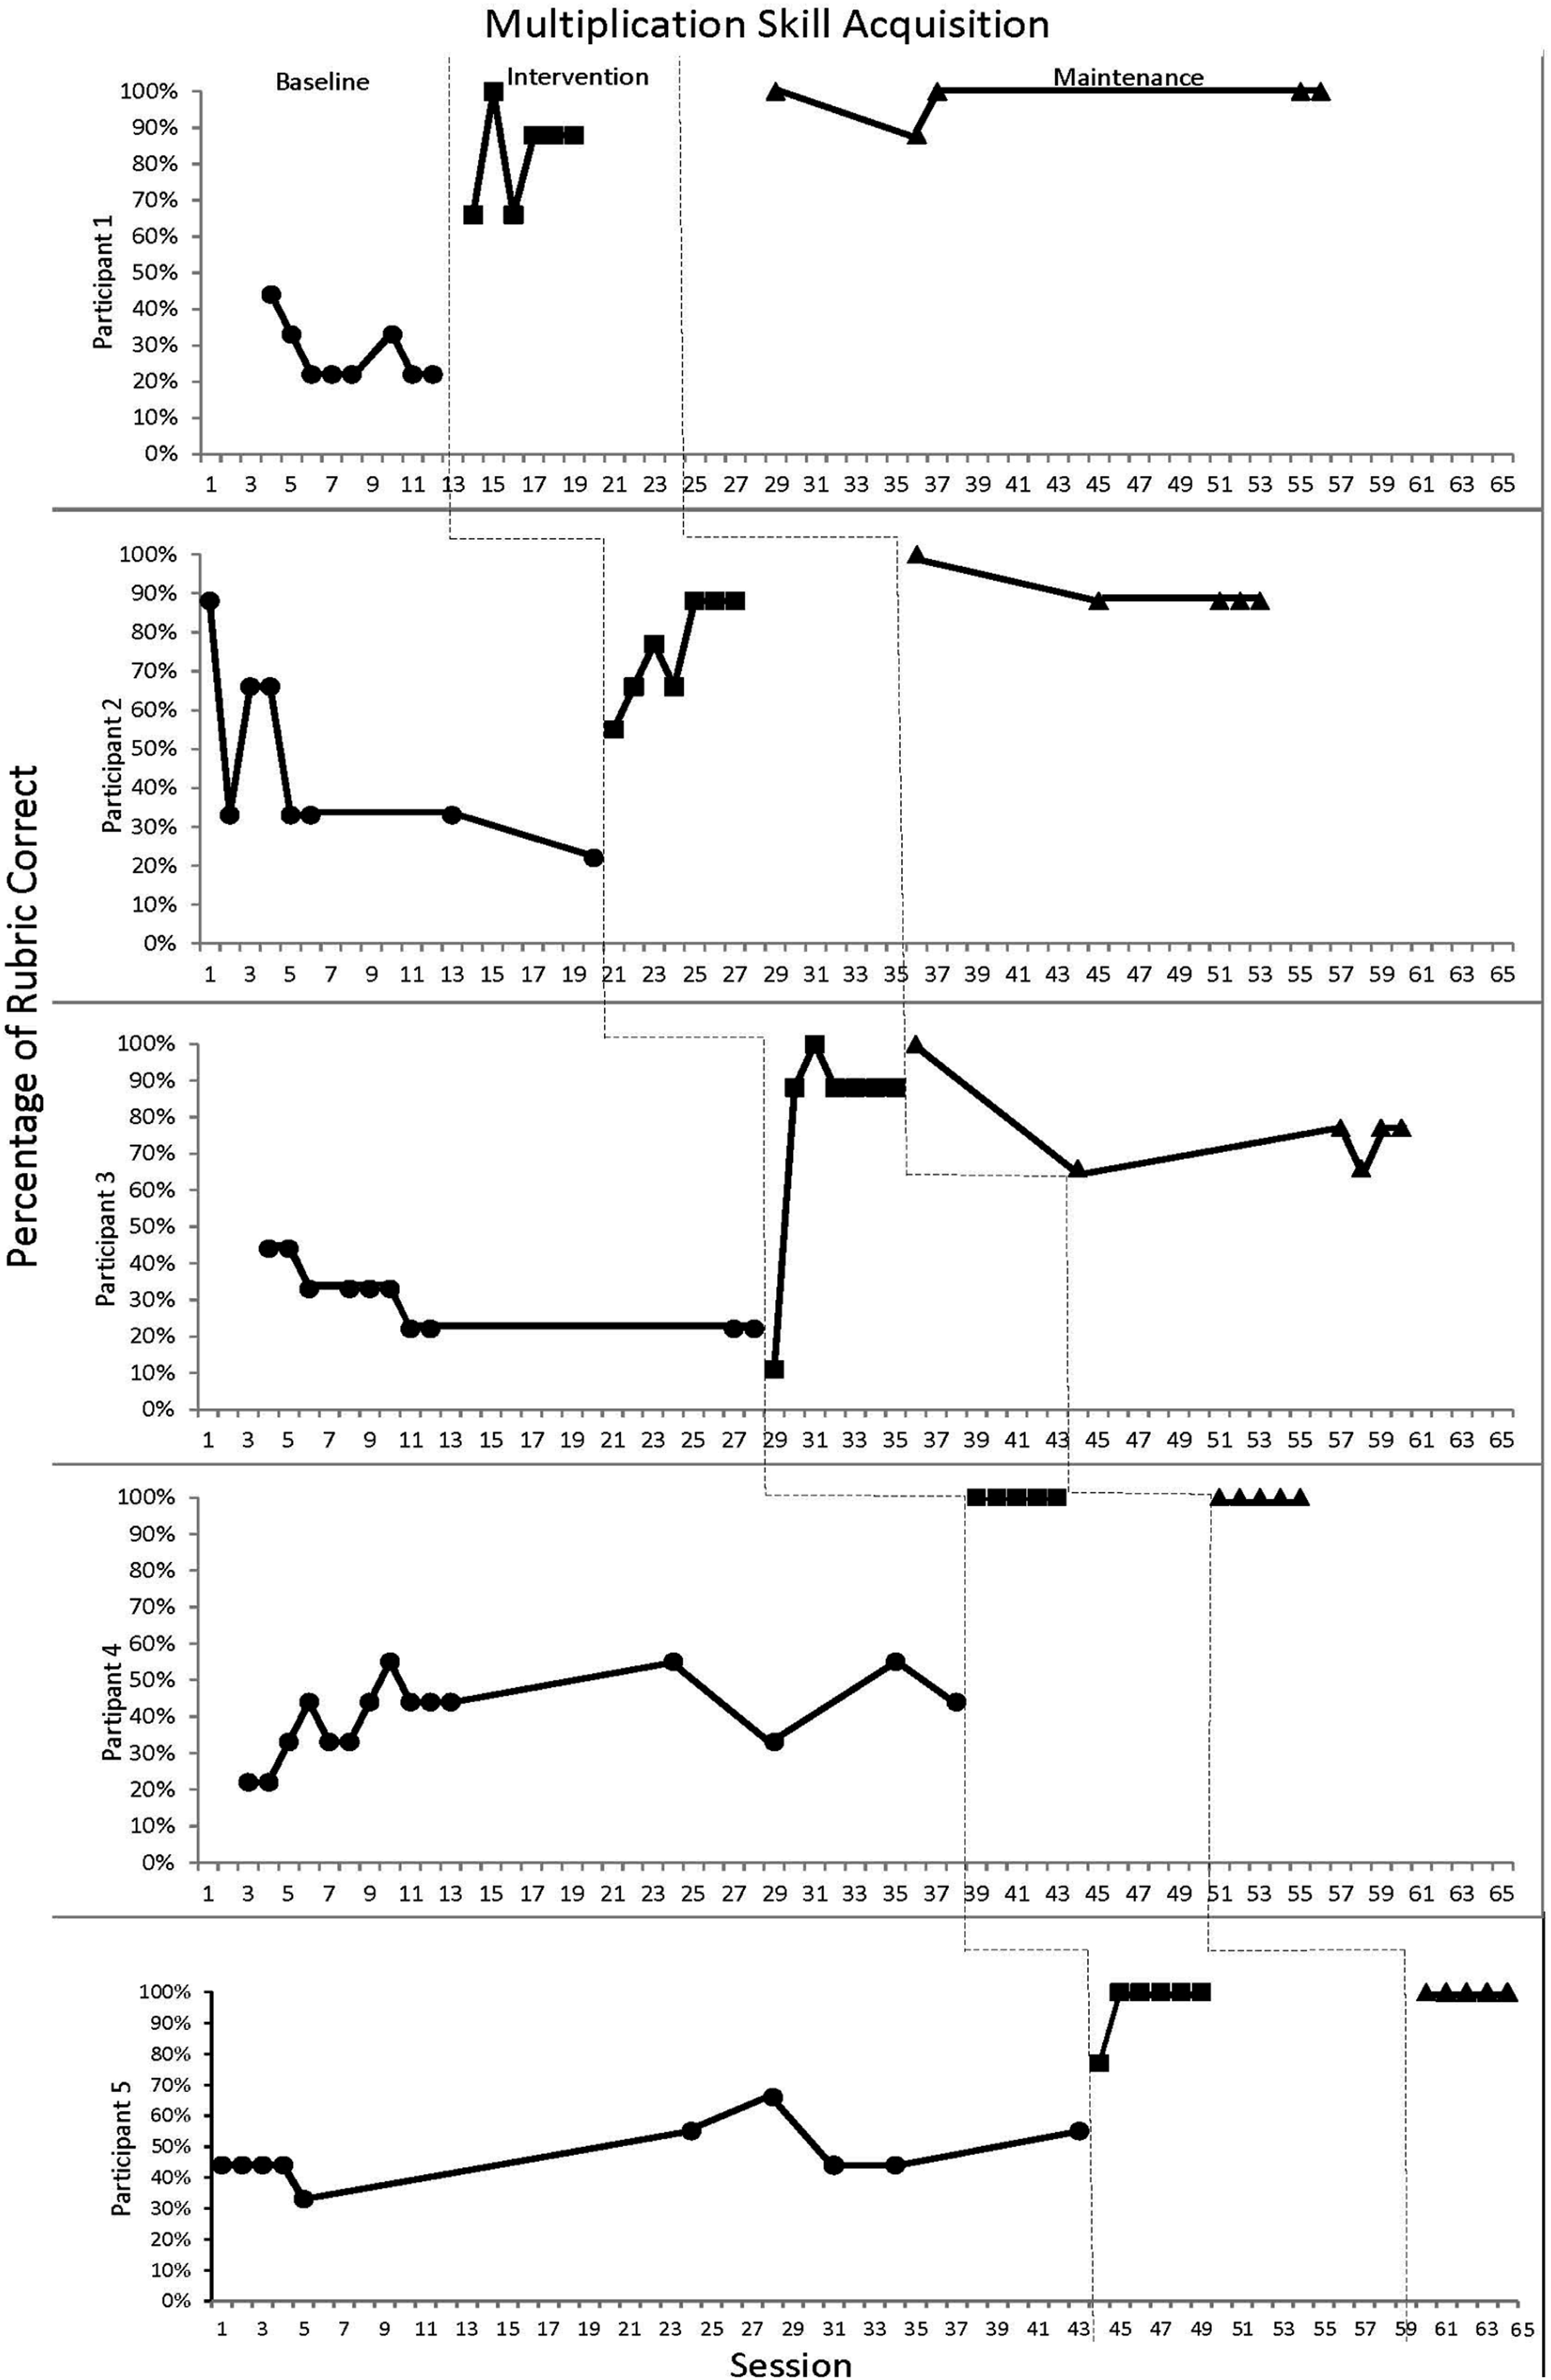
Intervention
During the intervention phase, as seen in Figure 1, all five participants acquired the skill with 30 demonstrations of a positive effect with an overall average of 87%. When compared with the baseline average of 40%, the steep upward trend observed in all five participants indicates the effectiveness of video prompting as a teaching tool. Individually, participants 1-5 scored, on average, 83%, 75%, 79%, 100%, and 96%, respectively. Standard procedures, according to the scripts, were followed, with the exception of one non-standard session for two participants. The first intervention session of participant 3 yielded a negative effect score of 11%. At this point, additional teaching occurred, in the form of further explaining to him that he is to copy what the boy does in the video but use the numbers he is given in the story problem. During the second through the seventh intervention sessions, participant 3 scored an average of 90%.
Participant 3 was not the only student that needed further instruction on how to solve the problems. During the first intervention session participant 5 scored 77%. After this, the research assistant noted that she “told him to use the numbers in his questions after writing [the] equation wrong.” Across the next five intervention sessions participant 5’s score was stable at 100%. No other instructions were given to any of the participants during their individual intervention phases. Participants 1 and 2 had a range of 35 and 33 points, while participant 3 had a range of 12 points. Participants 4 and 5 had a range of 0 points even after the initial clarification to participant 5 where he received further direction from the research assistant.
Maintenance
During the maintenance phase, all five participants demonstrated an average of 93% across 26 sessions, which is a 6% increase from the intervention phase (see Table 3). Participant 1 increased 11 points after intervention and achieved a stable average of 98% with an overall range of 12. Participant 2 increased 15 points after intervention and achieved a stable average of 90%, resulting in a maintenance range of 12. Participant 3 decreased 2 points after intervention yet achieved a stable average of 77% during the maintenance phase with a range of 34. Participants 4 and 5 achieved stable maintenance scores at 100%, comparable to their intervention scores of 100% and 96%, respectively. When an increase from intervention to maintenance was observed, it appears that when intervention sessions stabilized, the results are comparable to the average maintenance sessions. For example, though participant 2 increased 15 points from intervention to maintenance, the participant’s last three intervention and four maintenance session scores were 88%.
Pretest/Posttest
In addition to the single subject, multiple-baseline-across-subjects study, separate pretests and posttests were given to each participant. The tests assessed the students’ abilities to find the correct answer for five multiplication equations and five multiplication story problems. The same format of test was used for both assessments. The tests were given before and after collecting baseline, intervention, and maintenance data, ensuring that the scores would be valuable data to show the difference in ability for each student from before and after the study. The average pretest score for the five participants was 22%. The average post test score for the five participants was 52%. In addition, the posttests were given to each participant 6–15 days after the final maintenance probe was collected.
Social Validity
A subjective measure of social validity was collected from the stakeholders to determine how well-received the intervention process was. The participants’ and their teachers’ answers to the open response questionnaire were analyzed and evaluated to understand the effects the intervention process had on the participating students. When asked, “What did you think about watching the videos on the iPad?” four out of the five participants indicated that they had a positive impression saying, “It was really fun,” “It was good,” “It showed me examples how to do it,” and “I just started to learn more.” The one participant that did not indicate a positive impression of the videos stated, “I don’t like the videos. They made no sense to me.”
The second question was, “What did you think about watching the videos at school?” Four out of five participants indicated a positive impression giving the following responses: “It was great,” “I think it was more so I can get smarter in math,” “It was fun,” and “I liked watching them at school.” The student indicating a negative response said, “I don’t watch it at my house,” which may indicate he misunderstood the question.
For the third and fourth questions, there were more limited responses. All five participants responded positively to the third question, which was “Would you like watching more videos at school showing you how to do things?” The fourth question was “Who have you told about using the iPad at school?” Four out of five participants responded with “Nobody,” And the last participant responded, “Maybe my friends and my family.”
Of the three teachers, only two returned their social validity questionnaires. The third was not returned due to the teacher’s maternity leave. But despite that, both of the other teachers indicated that they believed the students enjoyed watching the videos at school. When the teachers were asked, “What impact did watching the videos have on the performance at school?” They responded that they believed it helped [the students] understand what multiplication means and that their confidence in their ability increased. Both teachers indicated that watching videos on iPads (Apple Inc., 2011) is something they can see students doing in the future. They mentioned that it could be beneficial and that “we should be using more technology in the classroom.” Both teachers believed the intervention was socially acceptable. See Appendix H to see blank versions of both the student and teacher social validity questionnaires.
Discussion
The purpose of the research was to investigate the effects iPad (Apple Inc., 2011) video prompting intervention has on struggling elementary students’ ability to acquire and maintain mathematics skills. Once evaluated, data from the study indicated that there was a functional relationship between the independent variable, the effectiveness of the video prompting, and the dependent variable, percent correct based on a scoring rubric. This functional relationship was observed because the dependent variable changed for each participating student when the intervention was introduced to them.
The results of this study were similar to the results found by other video prompting intervention studies that had been successful for participants with an identified disability (Burton et al., 2013; Cihak, 2009; Kellems & Edwards, 2015). Additionally, this study was similar to Schunk and Hanson’s (1989) study in that the only qualification for inclusion in the study was for a student to be displaying below grade level ability in mathematics, which was unique from the other studies because they focused on participants with identified disabilities who were receiving special education services. A functional relationship identified in this study is reinforced by other video modeling research specific to students receiving mathematics interventions (Kellems et al., 2016). In addition, the use of iPads (Apple Inc., 2011) in delivering the mathematical intervention supports the existing research (Burton et al., 2013). Lastly, the use of rubrics in determining the dependent variable, or percentage correct, supports existing research focused on understanding the depth of student understanding, rather than only recording correct or incorrect responses (Bahr, 2007).
This study also attempted to answer the question of whether or not the intervention was successful in helping students solve multiplication story problems. To that end, the data shows that all participants made significant gains in their ability to correctly solve, communicate, and numerically represent multiplication story problems. The average range from baseline to maintenance was a growth of 53%: baseline average was 40%, intervention average was 87% and maintenance average was 93%. Regarding the separate assessment given prior to, and upon completion of the study, the average pretest score was 24%, while the average posttest score was 48%. This study is significant because it demonstrates the effectiveness of video modeling for general education students. Furthermore, it teaches and reinforces the importance of demonstrating understanding, rather than providing a rote answer. This study is also significant because it demonstrates the ability to teach students core content that is considered above their grade level as was demonstrated when the 2nd graders showed gains in 3rd grade content.
In addition, this study attempted to determine the social validity of using video-based instruction to teach mathematics to elementary school students who struggle with mathematics. Social validity is important to determine how well-received the intervention is by the stakeholders. In this case, the elementary school participants and their classroom teachers. To establish the potential social validity of video-based instruction, open response questionnaires were given to the participating students and their teachers. Each participant’s answers were analyzed and evaluated to establish the overall perceived effects of the intervention. Overall, the video prompting used in the study was received positively, especially the use of iPads (Apple Inc., 2011) because they make including such video instruction fairly simple for teachers and also easy for students. Given the overwhelming presence of smart devices in the world today, utilizing these devices will require almost not effort for most students. If the focus remains on struggling students, the social validity of video-based instruction for elementary students will be further established, making potential future integration of such methods far more likely.
This study, and especially the results of this study, are beneficial to the overall literature because it extends the current literature related to video modeling and video prompting in three major ways. First, in the current literature landscape, this is the first study to evaluate the effects of a mathematics video prompting intervention on elementary students identified by teachers to be struggling academically rather than focusing on students with identified disabilities. This is important because there are students who struggle with mathematics who do not have a diagnosed disability and it is important to support all students to succeed in their academic goals. Second, this research utilized and added to the current literature related to using video modeling for the purposes of mathematics-related interventions. And third, this study shows the effectiveness of using a rubric to evaluate the depth of student understanding instead of their ability to only answer questions correctly. The core purpose of the rubric was to allow students and researchers to look beyond the traditional, rote memorization nature of mathematics instruction and delve further into how a student is communicating, representing, and problem solving when tasked with a multiplication story problem. This is a key shift when looking at video-based instruction because it will help establish students on a foundation of conceptual understanding in mathematics that those students can then apply to later classes and skills.
Once the main phases of the study were finished, the students were able to maintain their performance without access to the video-model intervention, which further demonstrates that the intervention helped establish conceptual understanding rather than procedural understanding in the participating students. These students came into the study with a very low ability to solve the multiplication story problems, and after the substantial growth observed during the baseline and intervention phase, that growth continued to be significant during the maintenance phase. Procedural learning often fails to produce similar learning outcomes, so given the positive results found in this study, it stands to logic that in some ways video-based interventions overcome traditional aspects to mathematics instruction, such as rote memorization, that continue to fail in producing positive learning outcomes. While traditional methods will never completely vanish from the teaching landscapes, if those methods can be paired along with new instruction, the efficacy of our mathematics programs would drastically improve.
Limitations
The study was limited in five main ways. First, the method of coding could have been more uniform. The reliability coder used only the video recordings of the sessions to establish their coding, while the primary observer established codes while watching the participants live, in session. Because of this, the reliability coder would sometimes experience issues understanding a participant’s response, which could have been clarified had they been viewing the live session.
The second limitation is that this is the first time this rubric has been used to evaluate the depth of understanding in students. While the primary observer trained the reliability coder, clear instances of different interpretations of the rubric arose (e.g., what qualified as a “reasonable strategy”). For example, instances arose where the rubric should have allowed for repeated addition (5 + 5+5 = 15) to be considered just as reasonable a strategy as the standard multiplication equation response of 5X3 = 15, but instead, the rubric failed to allow for a comparable score as the standard response. More explicit explanations for scoring could be adjusted to make the rubric more effective and adaptable to student strategies. Along with this, students were not assessed for fidelity of video modeling use. For example, if all parts of the video were watched, and if it was paused in the proper places.
The third limitation relates to the size of the participant pool. Because this study is meant to determine the efficacy of video prompting in mathematics instruction, it inevitably calls into question how these new methods would work with traditional instruction methods. With only five participants and three teachers (one of which was unable to respond to the after study questionnaire) it is possible that these results only tell us the efficacy of the study on these children who are with these teachers. A much more robust, and if possible national, subset of struggling students could help give a more generalized view of the efficacy of video prompting intervention as an instructional method.
The fourth limitation was that the story problem equations only went as high as 6x6 = 36. The study did not determine if the same intervention could help solve a story problem and/or equation with multiplication factors beyond two, three, four, five, or six. While it may seem logical to assume that such would be the case, it will be up to future research to determine if video intervention works for other mathematics skills and problems.
The fifth limitation is particular to this study. When using a multiple baseline design, the order in which participants receive the intervention is determined by the baseline averages. Based on the design, the student with the lowest baseline percentage should receive the intervention first, and so on. But in this study, the order that participants should have received the intervention was missed. Participant 3 should have received the intervention second, Participant 4 should have received the intervention third and Participant 2 should have received the intervention fourth.
Suggestions for Future Research
Replication of this study would help to validate and strengthen the current research questions, especially if a broader sample of struggling students is used. Additionally, this study could form a foundation to test how effective video modeling/video prompting instruction helps students who do not struggle with the traditional forms of instruction, furthering our ability to teach students a conceptual understanding rather than simply rewarding a student’s ability to perform procedural steps.
Also, this study could be used to compare the effectiveness of a video modeling/video prompting intervention in reteaching the concept of multiplication to older children, especially older children that have a proven record of struggling in mathematics. While this study was designed for students ages 6-12 who are not receiving special education services, a study could be conducted to determine the effectiveness of video prompting for an older student population, potentially with updated video models to match the participant population.
Lastly, because a peer model was used for the intervention video, the voiceover work done by the research assistant could have been provided by the model or a similar-aged peer. Perhaps hearing a peer’s voice describing the steps needed to solve the problems at hand could have helped participating students to further access the intervention.
Implications for Practice
This research shows that the iPad (Apple Inc., 2011) technology can be used to implement interventions for struggling learners and may be utilized in regular classrooms. Results also demonstrate that video modeling is a useful instructional tool for helping many individuals learn, not just those with an identified disability. Implementing video models in a classroom setting could enable teachers to consistently provide interventions to students as they work more independently, allowing teachers to work on a more one-on-one or small group basis with their students.
Additionally, this research study shows the development of a more conceptual understanding in students identified as struggling in mathematics. The effect of video prompting on students with passable or even accelerated performance is unknown, but because this research provides data showing that this method of instruction works for students other than just those receiving special education services, it is possible it could be extended to classroom use in general rather than only as a method of reteaching or improvement.
Conclusion
With the high number of students who struggle with mathematics, newly identified, evidence-based strategies for teaching and learning math, along with an increase of in-depth of understanding of mathematical concepts, this research is particularly relevant to field of education. The use of video modeling and video prompting in instruction can be both academically and socially valid. The inclusion of a rubric that provides an operational definition of specific criteria relevant to the assessment of deep understanding of mathematical concepts makes the viability of using video prompting as a method of instruction easier to approach by current teachers. Because rubrics are part of many traditional learning methods, combining the traditional with the new, especially with technology added as well, makes for a better step forward towards teaching students in an ever-evolving world.
Footnotes
Declaration of Conflicting Interests
The author(s) declared no potential conflicts of interest with respect to the research, authorship, and/or publication of this article.
Funding
The author(s) received no financial support for the research, authorship, and/or publication of this article.