
Abstract
This study analyzes information accumulated in WoS databases on special education and technology with bibliometric methods. Bibliometric analyses, seen as an alternative to systematic literature reviews, meta-analysis, and meta-synthesis, contribute to determining essential actors in the field by analyzing the publication and citation trends, the stage of the research topic, and trends in the volume of publications. Furthermore, bibliometric analysis can reveal the collaboration structure between institutions and authors and identify the most frequently studied topics, top-producing authors, institutions, and journals in a field. In the study, we analyzed 4493 articles published in Social Sciences Citation Index (SSCI), Emerging Sources Citation Index (ESCI), Social Sciences Index Expanded (SCI-Expanded), and Arts & Humanities Citation Index (AHCI) databases using the co-authorship and co-occurrence analysis method. Also, we used frequency analysis in publications and citations related to special education and technology research to determine the situation. The main findings of the research are that the literature on the use of technology in special education: (a) has grown steadily over the years, particularly since 2003; (b) research topic foci have changed over the years; (c) articles are published in different journals, particularly special education journals; (d) produced by authors from a wide variety of countries; and (e) published by research groups with limited contact with other research groups.
Introduction
People have always made great efforts to adapt to and control the environment in which they live (Edyburn, 2013). Throughout this effort, all the tools and methods they have developed to find solutions to their problems and improve their quality of life are called technology (Bölte et al., 2010). Technology is rapidly advancing, affecting every aspect of our lives. For example, education, a vital aspect of life, changes due to technological advancements (Lin & Chang, 2015). Technology integration is increasingly emphasized in modern educational environments as it helps transform students from passive listeners to active participants in the learning process (Gallud et al., 2021). Also, studies show that technology-supported learning environments help students learn better by appealing to more than one sense, letting students interact with each other, making learning environments more interesting, and increasing equal opportunity for everyone (Yılmaz et al., 2021). These advantages are valuable, particularly in enabling the creation of learning environments that can meet the learning needs of individuals who, due to individual differences, have different learning needs than their peers (Anderson & Putman, 2020; Chaidi et al., 2021; Odluyurt & Çattık, 2018).
The literature has repeatedly emphasized that using technology in teaching individuals with special needs yields significant benefits (Cheng & Lai, 2020; Dogan & Delialioğlu, 2020; Qahmash, 2018). Over time, the number of empirical studies supporting this perception has increased (Bartoli et al., 2013; Chaibi et al., 2021; Fletcher-Watson, 2014; Grynszpan et al., 2014; Qahmash, 2018). As the research volume has expanded, numerous literature reviews have been conducted to synthesize meaningful information and provide a broader perspective on the field (Hernández-Torrano et al., 2022). Cinquin et al. (2019), for example, looked at 29 studies about using e-learning in the education of people with disabilities. Dogan and Delialioğlu (2020) analyzed 55 articles on the use of technology in the education of students with learning disabilities. In a meta-analysis, Păsărelu et al. (2020) explored using mobile apps to educate students with attention-deficit/hyperactivity disorder. Denizli-Gulboy et al. (2021) conducted a meta-analysis of 8 single-subject studies examining the effects of augmented reality as an evidence-based practice for individuals with an autism spectrum disorder.
As it can be understood, the subject has been examined in many aspects, such as teaching tools and materials, teaching methods and strategies, participant demographics, learning outcomes, and teaching environments (Cheng & Lai, 2020; Dogan & Delialioğlu, 2020; Zhang et al., 2021). Even though these studies provide helpful information for a more in-depth understanding of specific issues in the field, they have only focused on a specific type of disability, the use of a specific technology, or a specific research design. Besides such reviews, some studies have been conducted to determine the field’s advancements and research trends (Edyburn, 1999; 2001; 2002; 2003; 2004). Edyburn (2004), for example, utilized the “comprehensive one-year research synthesis” method to examine the 2003 literature trends in special education technology. In the study, a total of 224 articles published in 31 journals were reviewed by content analysis. Among the study’s most important findings were identifying the most prominent research topics and influential journals in 2003s publications on special education technologies. In recent years, in addition to reviews, meta-analyses, and comprehensive synthesis, bibliometric analyses have revealed trends in various research fields (Roemer & Borchardt, 2015). Bibliometric analysis of field trends, influential authors, influential institutions, the collaboration between authors and institutions, or emerging issues in the field may provide a more holistic view of the large volume of research in the field. Also, a bibliometric analysis of information flow may facilitate finding new thematic areas and needs in the field (Hernández-Torrano et al., 2022). This study aims to examine the literature in WoS databases on using technology to educate individuals with special needs with a bibliometric approach.
Bibliometric Analysis
While research volumes reach a certain level, it becomes difficult to follow the advancements in a field. This situation has led researchers to use bibliometric analysis methods that use statistical methods to deal with large data sets (Zupic & Cater, 2015). Considered an alternative to systematic literature reviews, meta-analysis, and meta-synthesis, bibliometric analysis is, in fact, a kind of systematic literature review (Block & Fisch, 2020). Bibliometric studies, unlike other reviews, do not examine critical research findings. Instead, it helps uncover the mass trends that define databases’ landscape, composition, and intellectual structure (Zupic & Cater, 2015). Bibliometry is an objective approach that uses mathematical and statistical techniques to examine the metadata of publications (articles, books, and book chapters, among others) to organize information and evaluate bibliographic content (Taddeo et al., 2019). From the findings of a bibliometric study, (a) explain the development of scientific disciplines by tracing the historical movements that emerge from research findings, (b) analyze the scientific literature in the field of interest over a broad period to get a general idea of the structure of the scientific community and its structure in a given society, as well as the motivations and networks of researchers, (c) provide indicators to measure productivity and scientific quality, and thus provide a basis for evaluating and guiding R&D, they can make a scientific policy interpretation from the findings of the bibliometric study and even make science policies accordingly in their future work (Guo et al., 2020; Traynor et al., 2001; Ullah et al., 2019; Virani et al., 2020; Xu et al., 2021). Researchers and readers interested in the field can get an idea of the most influential authors and clusters of authors and journals through bibliometric research. They can expand their knowledge of the study topics by following influential authors and journals. In addition, they can see frequently studied or under-studied topics in the field and can direct their own research. Consequently, scientific mapping with bibliometric approaches provides a novel viewpoint in a field compared to conventional methodologies (Mulet-Forteza et al., 2019).
Materials and Methods
Data Collection
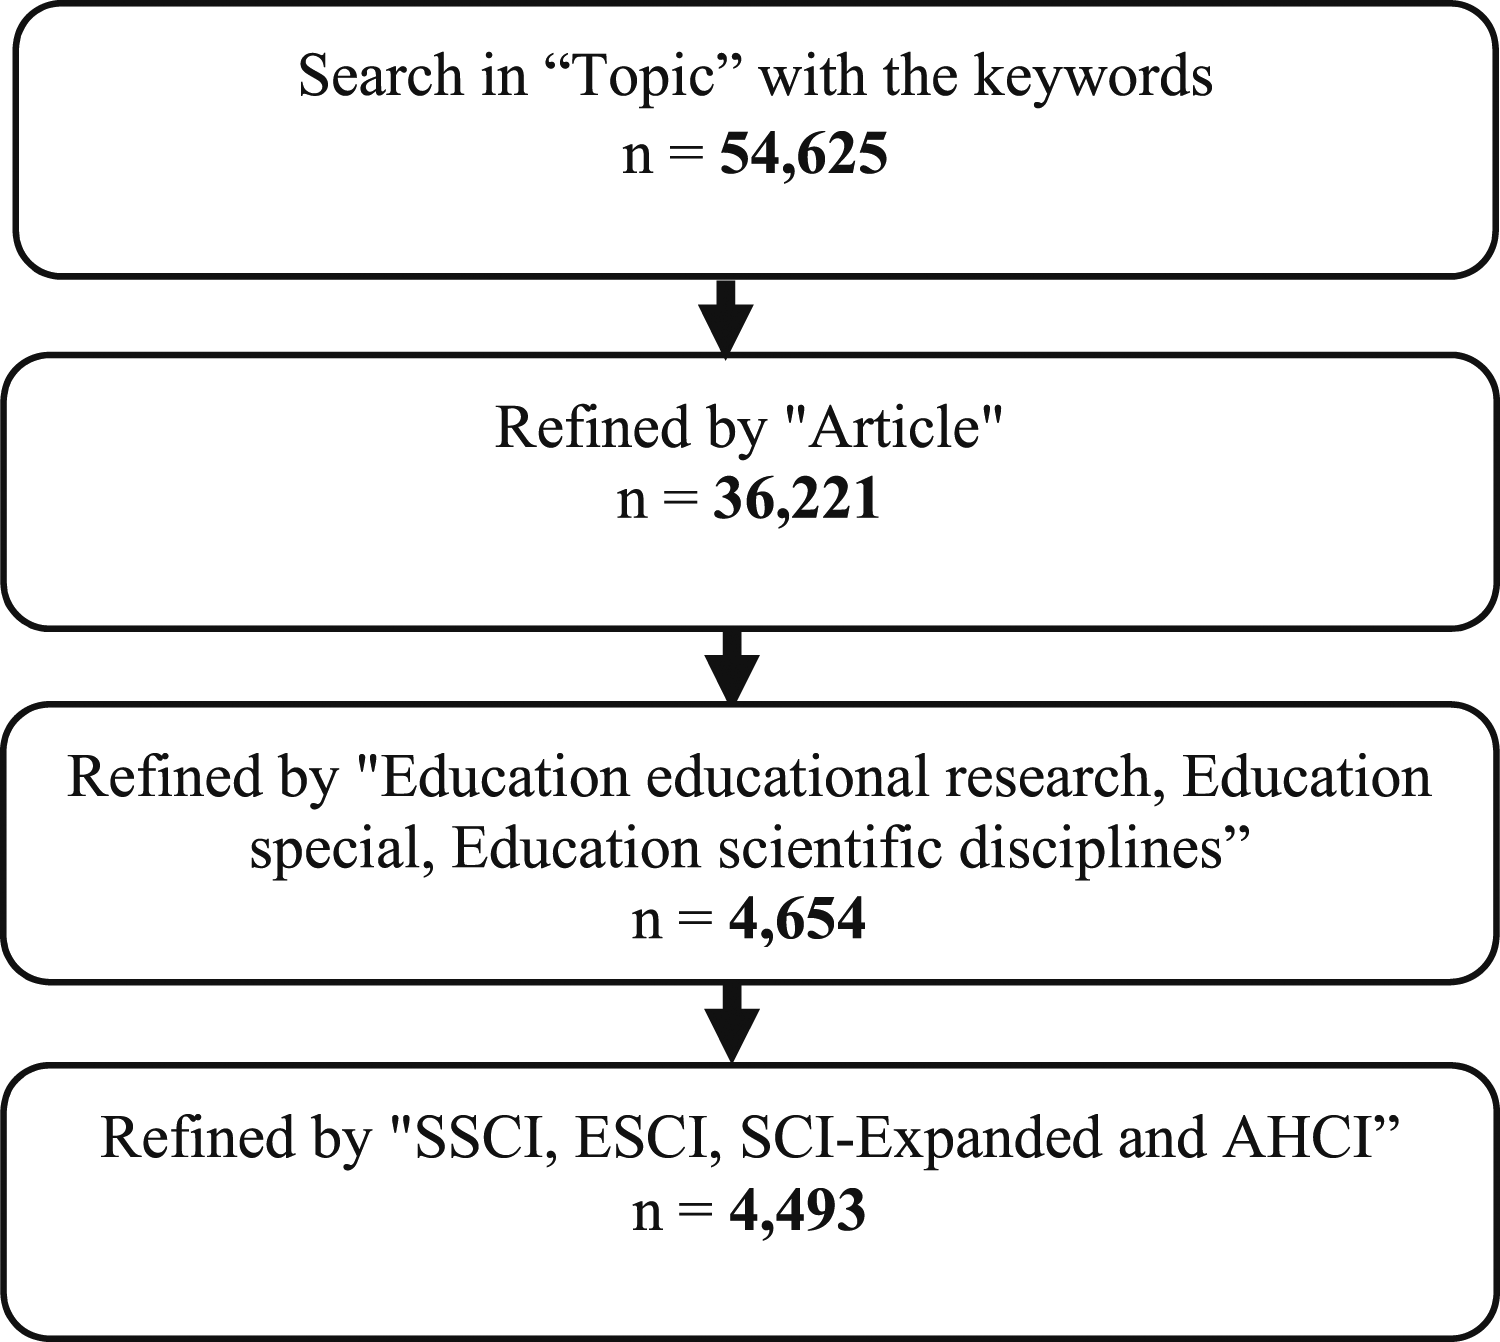
In bibliometric research, there are two stages: (1) determination of the data set and (2) bibliometric analysis of the data set. At the stage of determining the data set, data is collected directly from specific databases through keywords. Then, the search results are filtered by the research question, and inclusion criteria are applied. During data collection, researcher bias is avoided in selecting the studies to be examined to ensure objectivity (Mulet-Forteza et al., 2019). In many bibliometric studies, filtered data has been directly analyzed, bypassing the researcher’s subjective judgment (Gülmez et al., 2021; Hernández-Torrano et al., 2022; Lu et al., 2021; Sezgin et al., 2022; Zhang et al., 2021).
In the current study, we searched the WoS database for data collection. There are reasons to prefer the WoS database. WoS, just like Scopus, is one of the most frequently used databases in bibliometric mapping studies (Pranckutė, 2021). Scopus has recorded citation information in complete since 1996 (Hernández-Torrano et al., 2022). The WoS database, which contains information on publications and citations since 1975, was preferred to reveal better the historical evolution of technology use in special education. Another reason to use WoS is that it can give bibliometric analysis software all the necessary information (Zhang et al., 2021). In addition, most researchers accept the articles published in WoS databases as high-quality studies, as these databases are regarded as one of the most reliable sources (Sezgin et al., 2022). Therefore, they are frequently preferred for bibliometric analyses (Pranckut, 2021).
Keywords Used in the Search.
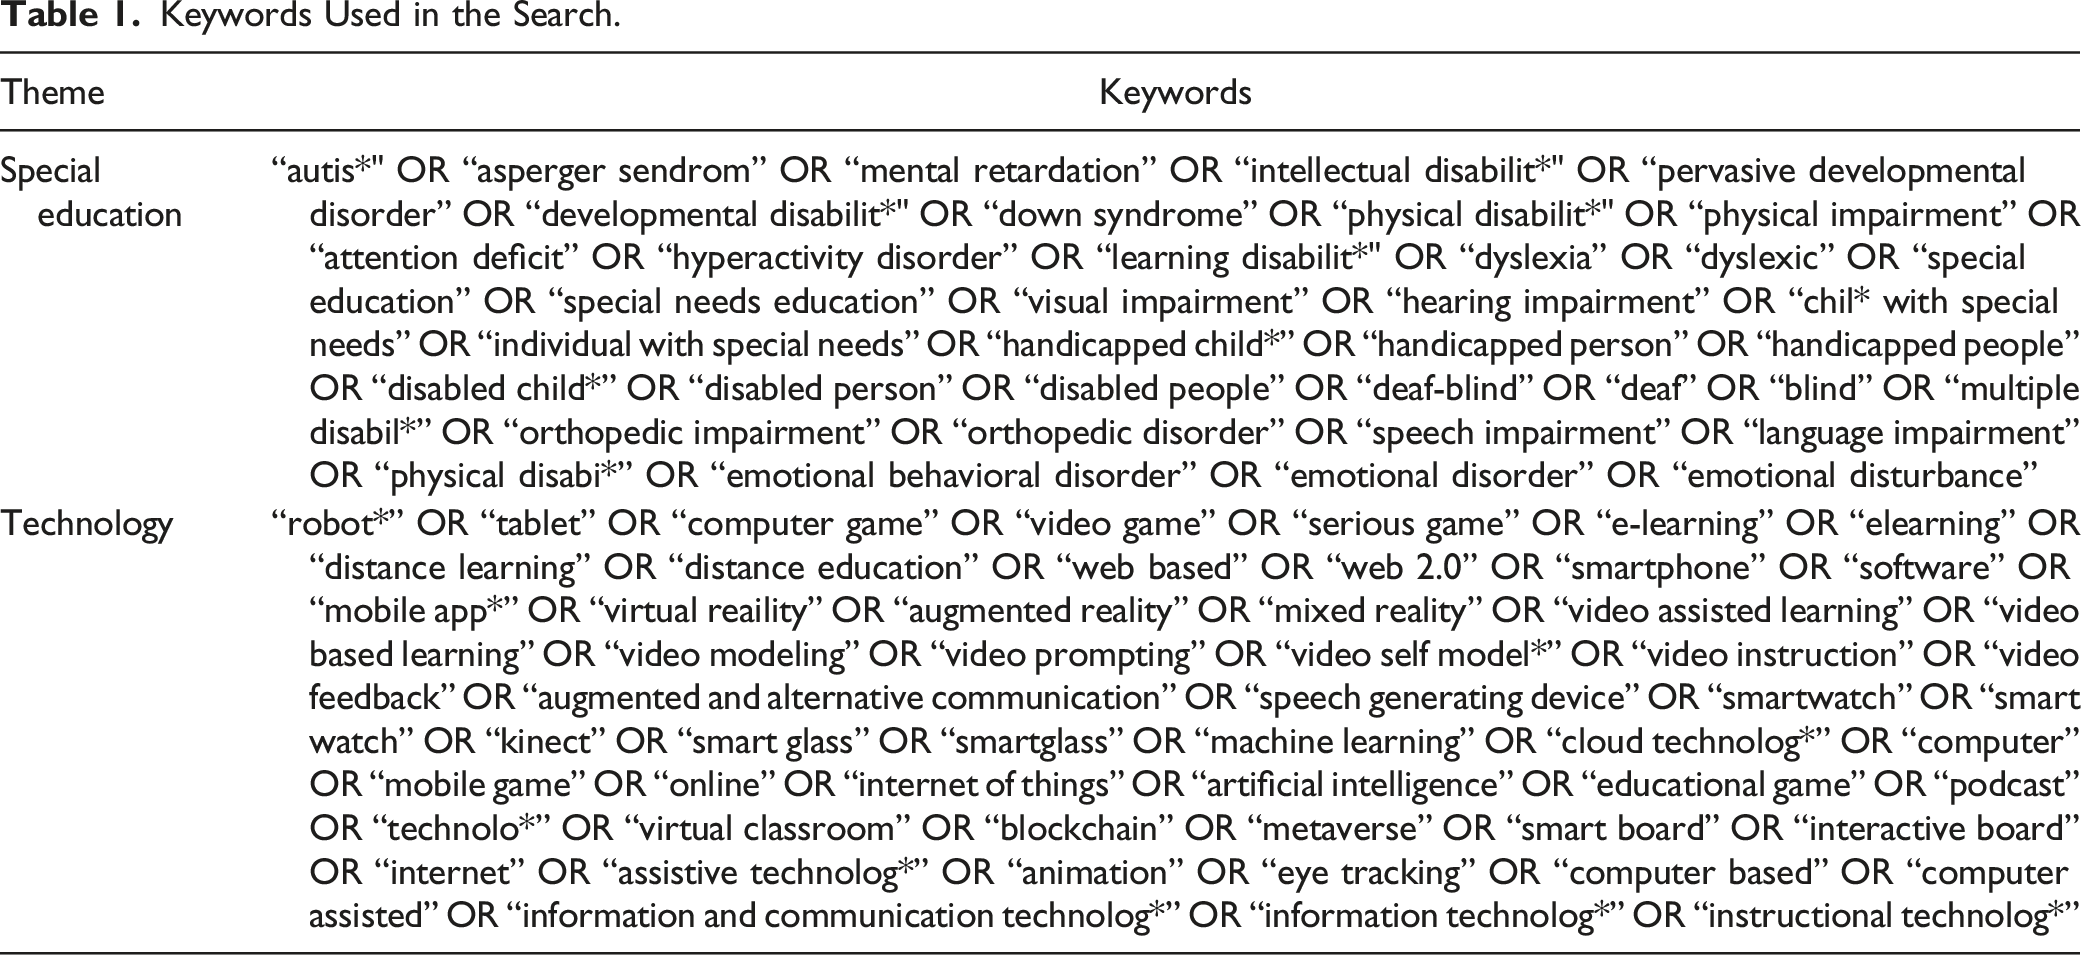
Search strategy.
Data Analysis
Using the publication frequencies and citation statistics obtained from the WoS database, we conducted frequency analysis in publications and citations related to special education and technology research to determine the situation. With this analysis, we rated the journals, authors, and countries in the field based on the number of publications and citations and tabulated the results. Then, we added to these tables the “Total link strength” statistics generated by the Vosviewer software. In addition, in this study, we utilized bibliometric methods (co-authorship analysis and co-occurrence analysis) to determine the current state of scientific studies published in WoS databases on special education and technology.
We used VOSviewer version 1.6.11 for bibliometric analysis and mapping. This software uses text-mining techniques to network and map from specified datasets (Van Eck & Waltman, 2014). In the analysis procedure, first, we imported the WoS database-downloaded bibliometric data files into VOSviewer. According to the purpose of the study, we utilized co-authorship and co-occurrence analysis. Co-authorship analysis examines the social network researchers have created by collaborating on scientific articles (Acedo et al., 2006). It can also examine collaboration at the level of institutions and countries based on the authors’ institutional knowledge and geographical location. Co-authorship analysis answers the following questions (Zupic & Cater, 2015): What is the impact of collaboration on the field? Are co-authored articles more cited? Do more prolific authors collaborate more often? What is the field’s social structure?
We use the co-authorship analysis method to map the cooperation between institutions, countries, and authors. The number of publications in the relevant field by the author institution or country is shown by the size of the nodes revealed in these analyses, in which the relationship in the field of special education and technology is mapped. The line connecting the nodes represents the cooperation between the mentioned items (author, institution, and country). The thickness of the line connecting the clusters represents the strength of the relationship. In addition, a close relationship between clusters that are close to each other and of the same color is mentioned.
Co-authorship analyses of networks represent a valuable tool for better understanding network structure and dynamics between researchers/groups. With the help of bibliometric analyses, Readers can understand how researchers and fields of knowledge interact to gain insight into the structures and dynamics of a scientific discipline (Sonnenwald, 2018). The information provided by co-authorship analysis can increase special attention to evaluating and promoting science and technology (Razzaq et al., 2022). Because nowadays, instead of focusing only on the lists of scientific publications and their quality indicators (e.g., citation, h-index), scientific studies on the existing structure with co-authorship analyses can provide new insights to readers and academics working in the field (Biscaro & Giupponi, 2014).
Co-occurrence analysis is a method in which the words used in the documents are analyzed to reveal the theoretical structure in the relevant literature (Callon et al., 1983; Zupic & Cater, 2015). Unlike co-authorship analysis, units of analysis are not authors, countries, or institutes. The unit of analysis is the concepts in the studied documents (Hernández-Torrano et al., 2022; Zupic & Cater, 2015). By applying content analysis to documents, words used together frequently are mapped out. The more frequently they appear together in a document, the stronger the relationship between the two terms. The reoccurring combination of words in published works indicates recurring research themes. Research focuses in a field are reached by examining themes’ networks and relationships. This way, it informs researchers about current trends and potential future research topics. Co-occurrence analysis also helps us comprehend a field’s cognitive and conceptual structure (Börner et al., 2003; Coulter et al., 1998; Zupic & Cater, 2015). In this study, we mapped the data from co-occurrence analysis based on years. In addition, we tabulated these data to show the change in the subject focuses frequently studied over time.
Results
Growth Trajectory: Evolution of Publications and Citations in the Field
The search for special education and technology studies in WoS databases yielded 4493 articles. Figure 2 demonstrates the number of publications and citations of the articles by year. Number of publications and citations by year.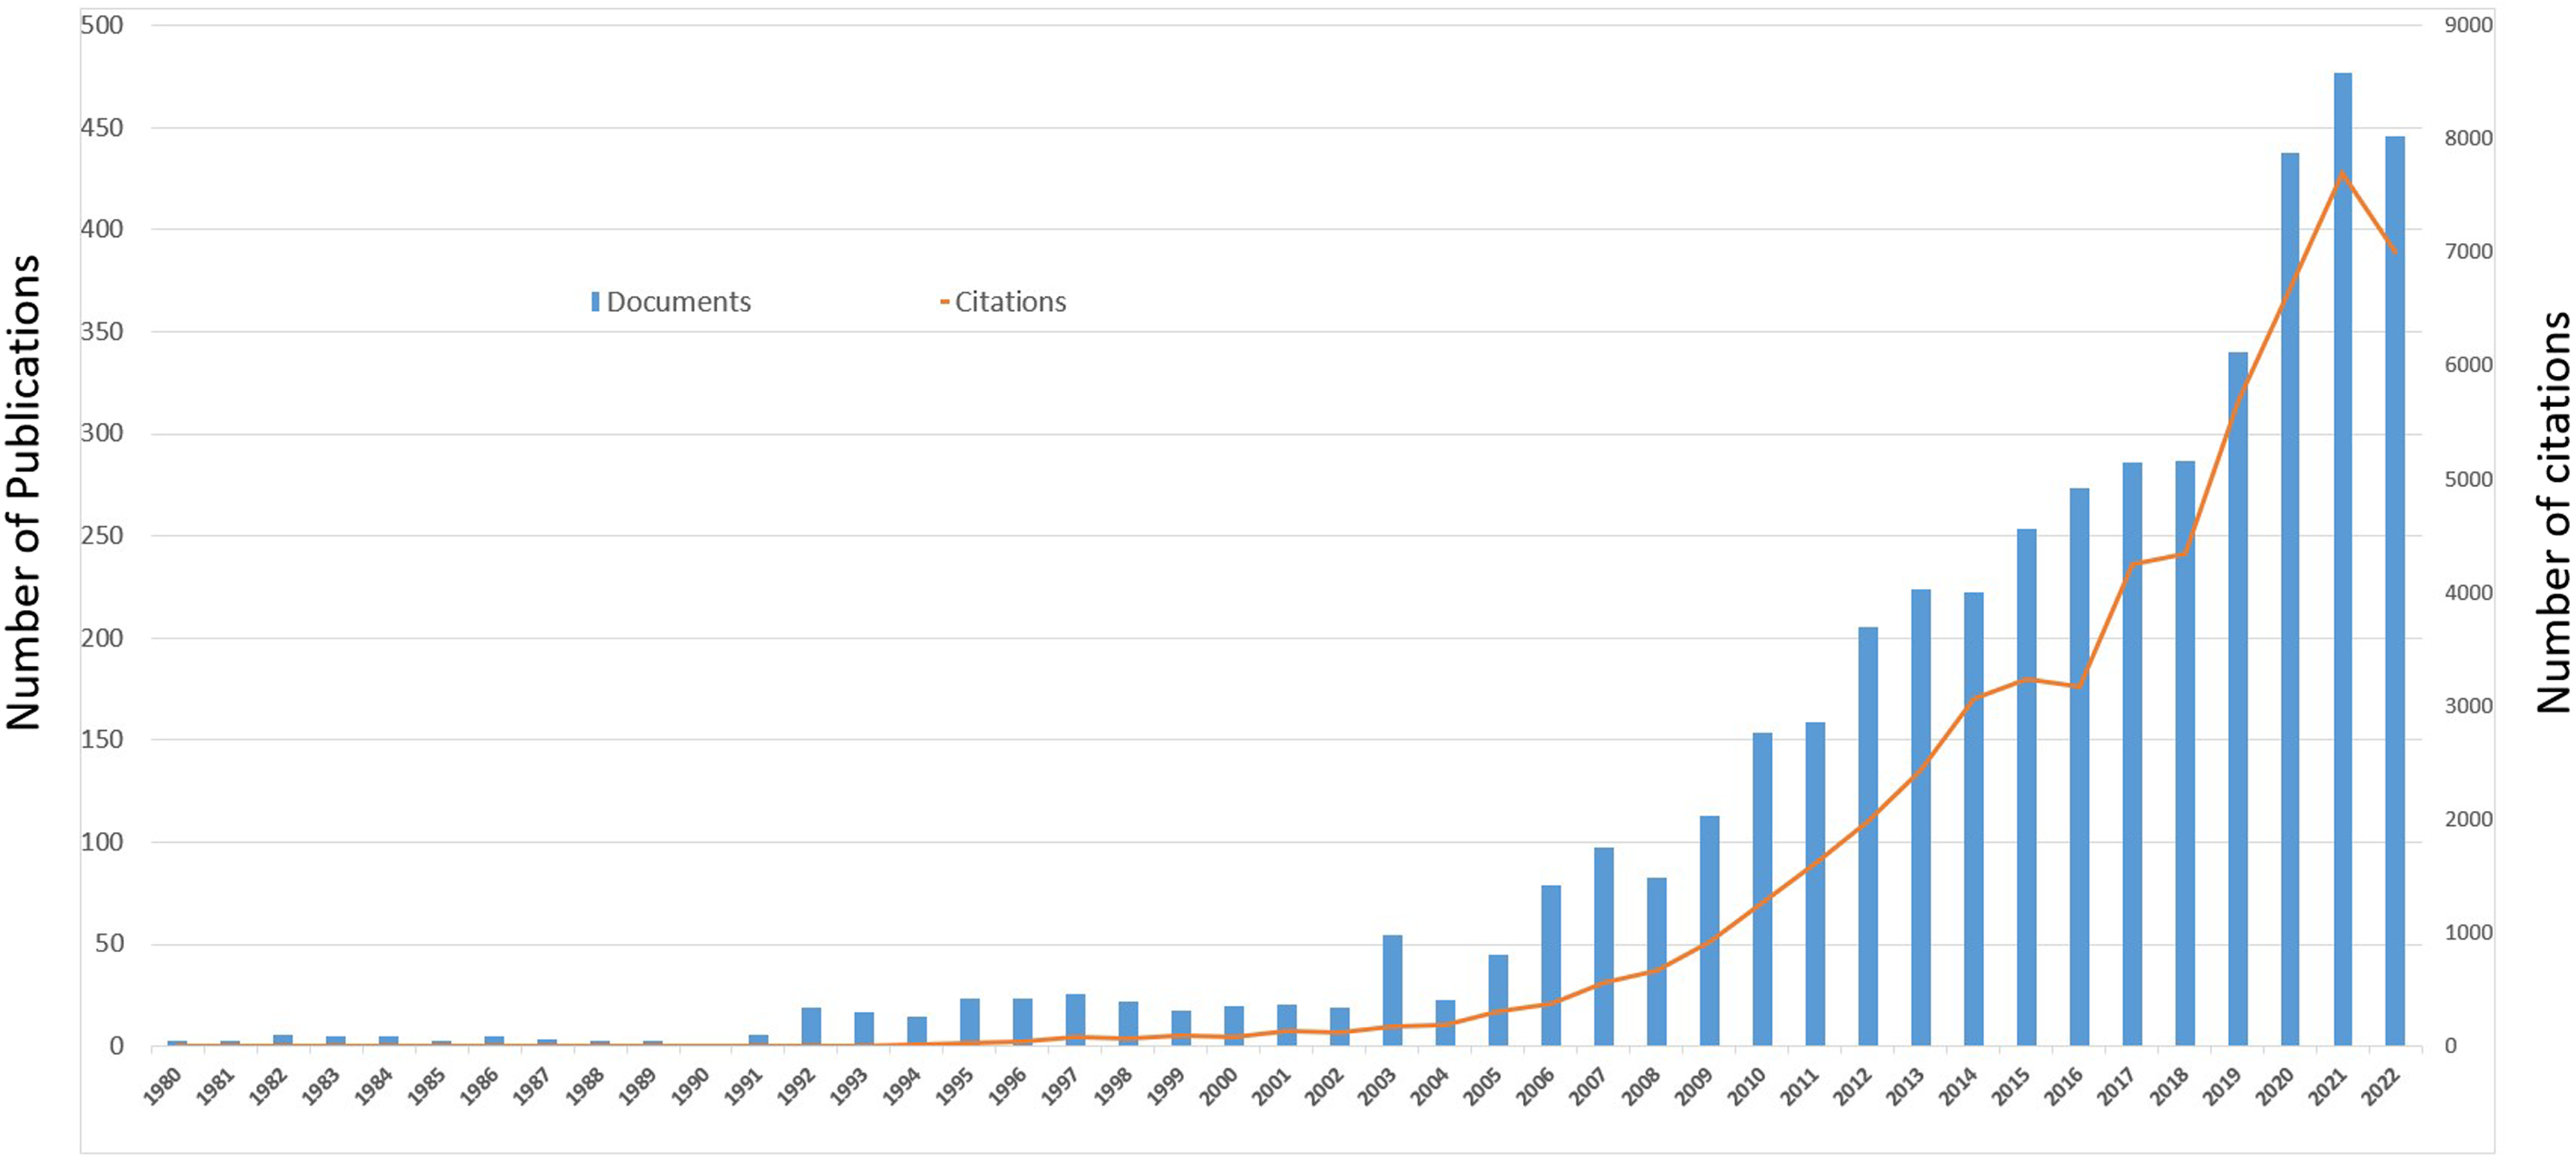
As a result of the search covering the period 1975 to 2022, it was understood that all articles on special education technologies were published after 1980. From 1980, when the first publication on special education and technology was made in WoS databases, to December 2022, according to Figure 2, the number of scientific studies on these topics has increased exponentially. There were 56,478 citations to 4493 articles published during these 42 years. The average number of citations per article is approximately 12.57. With 54 articles, the number of publications and citations in technology research in special education increased significantly in 2003. With 476 articles, 2021 saw the most significant number of publications. Once again, 2021 has the highest number of citations, with 7694.
Productivity: Core Journal, Leading Authors and Countries
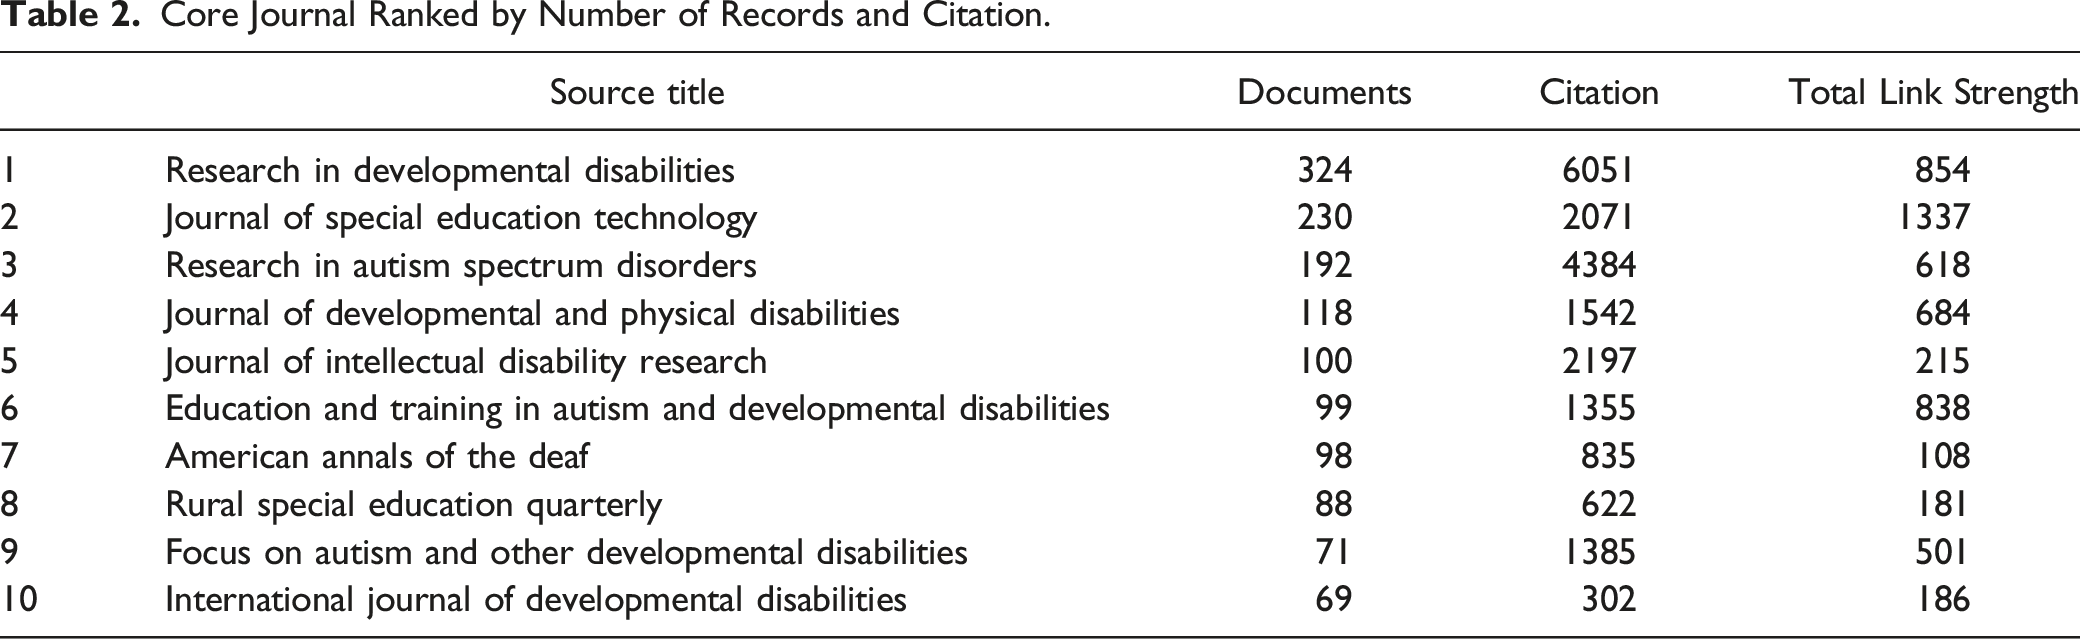
Core Journal Ranked by Number of Records and Citation.
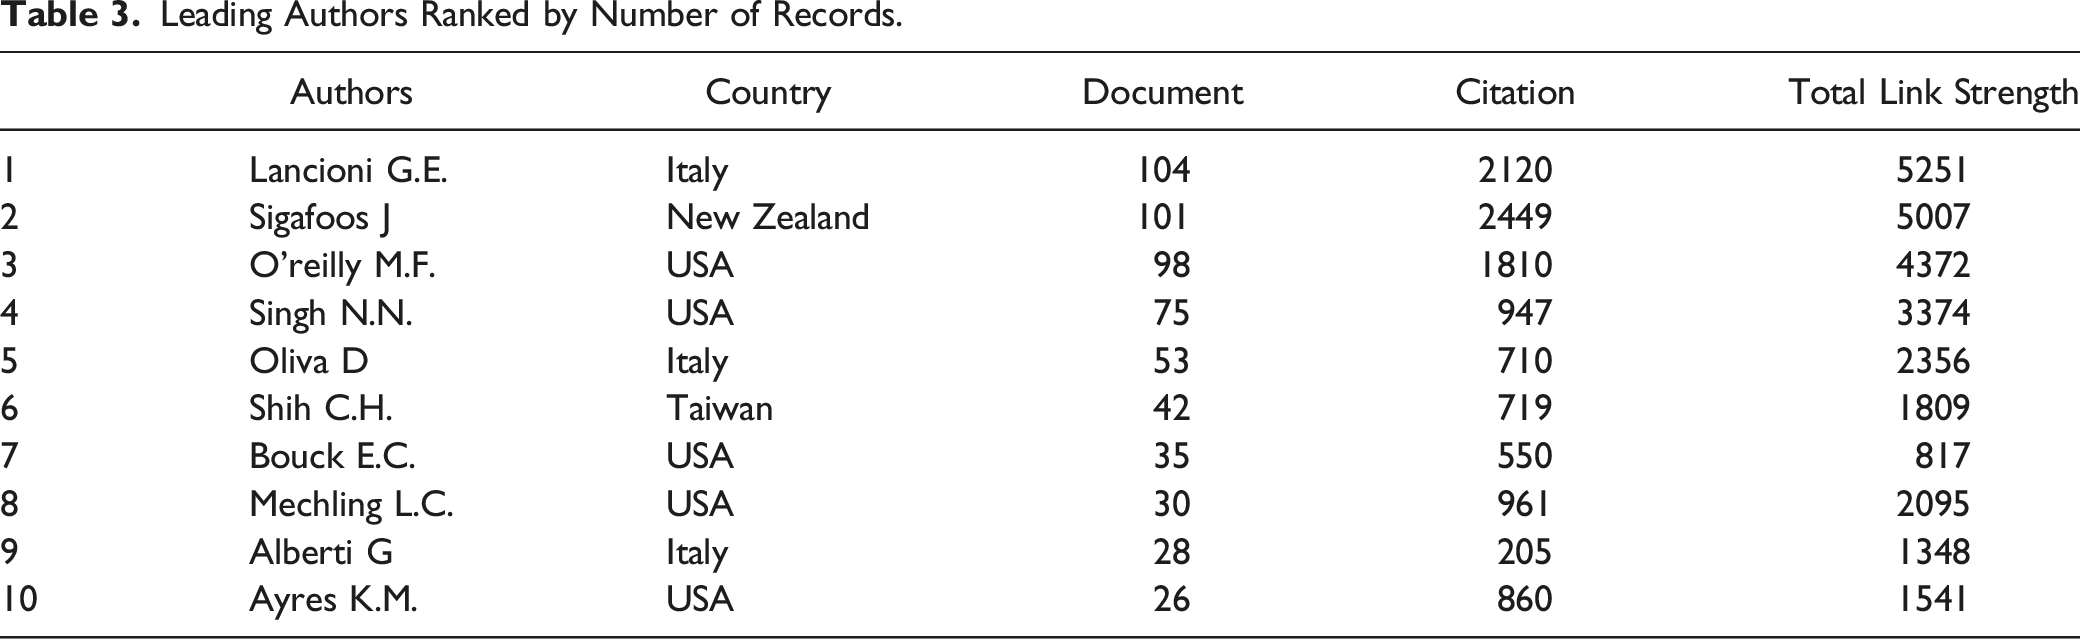
Leading Authors Ranked by Number of Records.
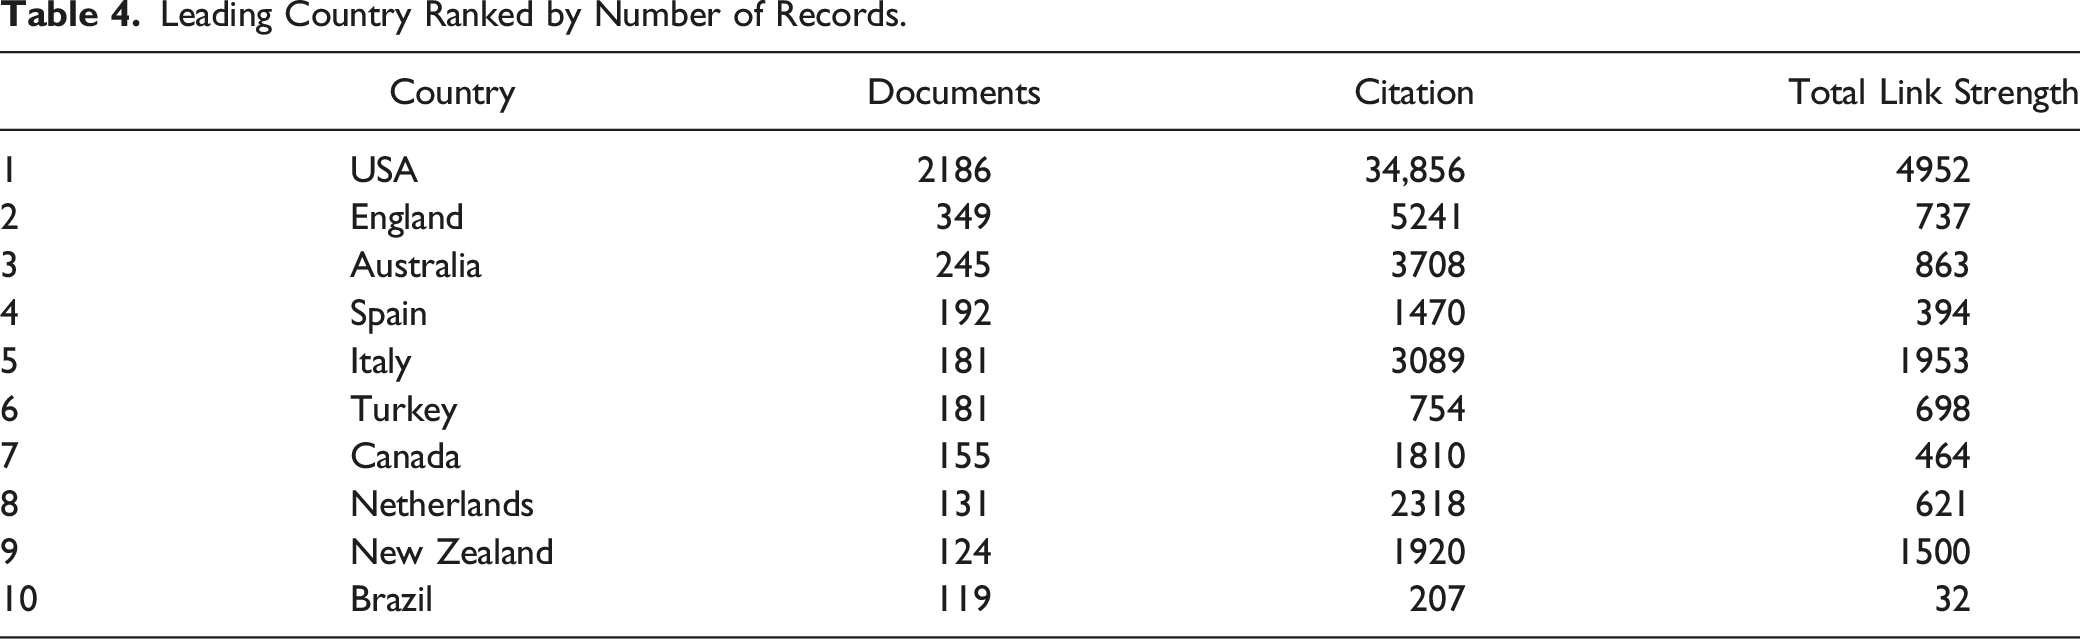
Leading Country Ranked by Number of Records.
Social Structure: Networks of Scientific Collaboration
This section presents the results of mapping the special education and technology-related research collaborations. We conducted co-authorship analyses to reveal the collaboration between special education and technology institutions, authors, and countries. Figure 3 represents co-authorship analysis for inter-institutional collaboration. It demonstrates the collaboration network between institutions with at least five articles. These findings show a robust and diverse network of collaboration between institutions. According to the co-authorship analysis between institutions, the map contains 15 distinct clusters. These clusters, each containing a different number of institutions, reveal the social structure of the field. The institutions in the cluster, shown in red and located in the horizontal center of the map, comprise the largest collaborative network. There are 14 different institutions in total in the red cluster. Another essential cooperation network between institutions is in the blue cluster. The green clusters follow the blue clusters. Collaborative research networks between organizations.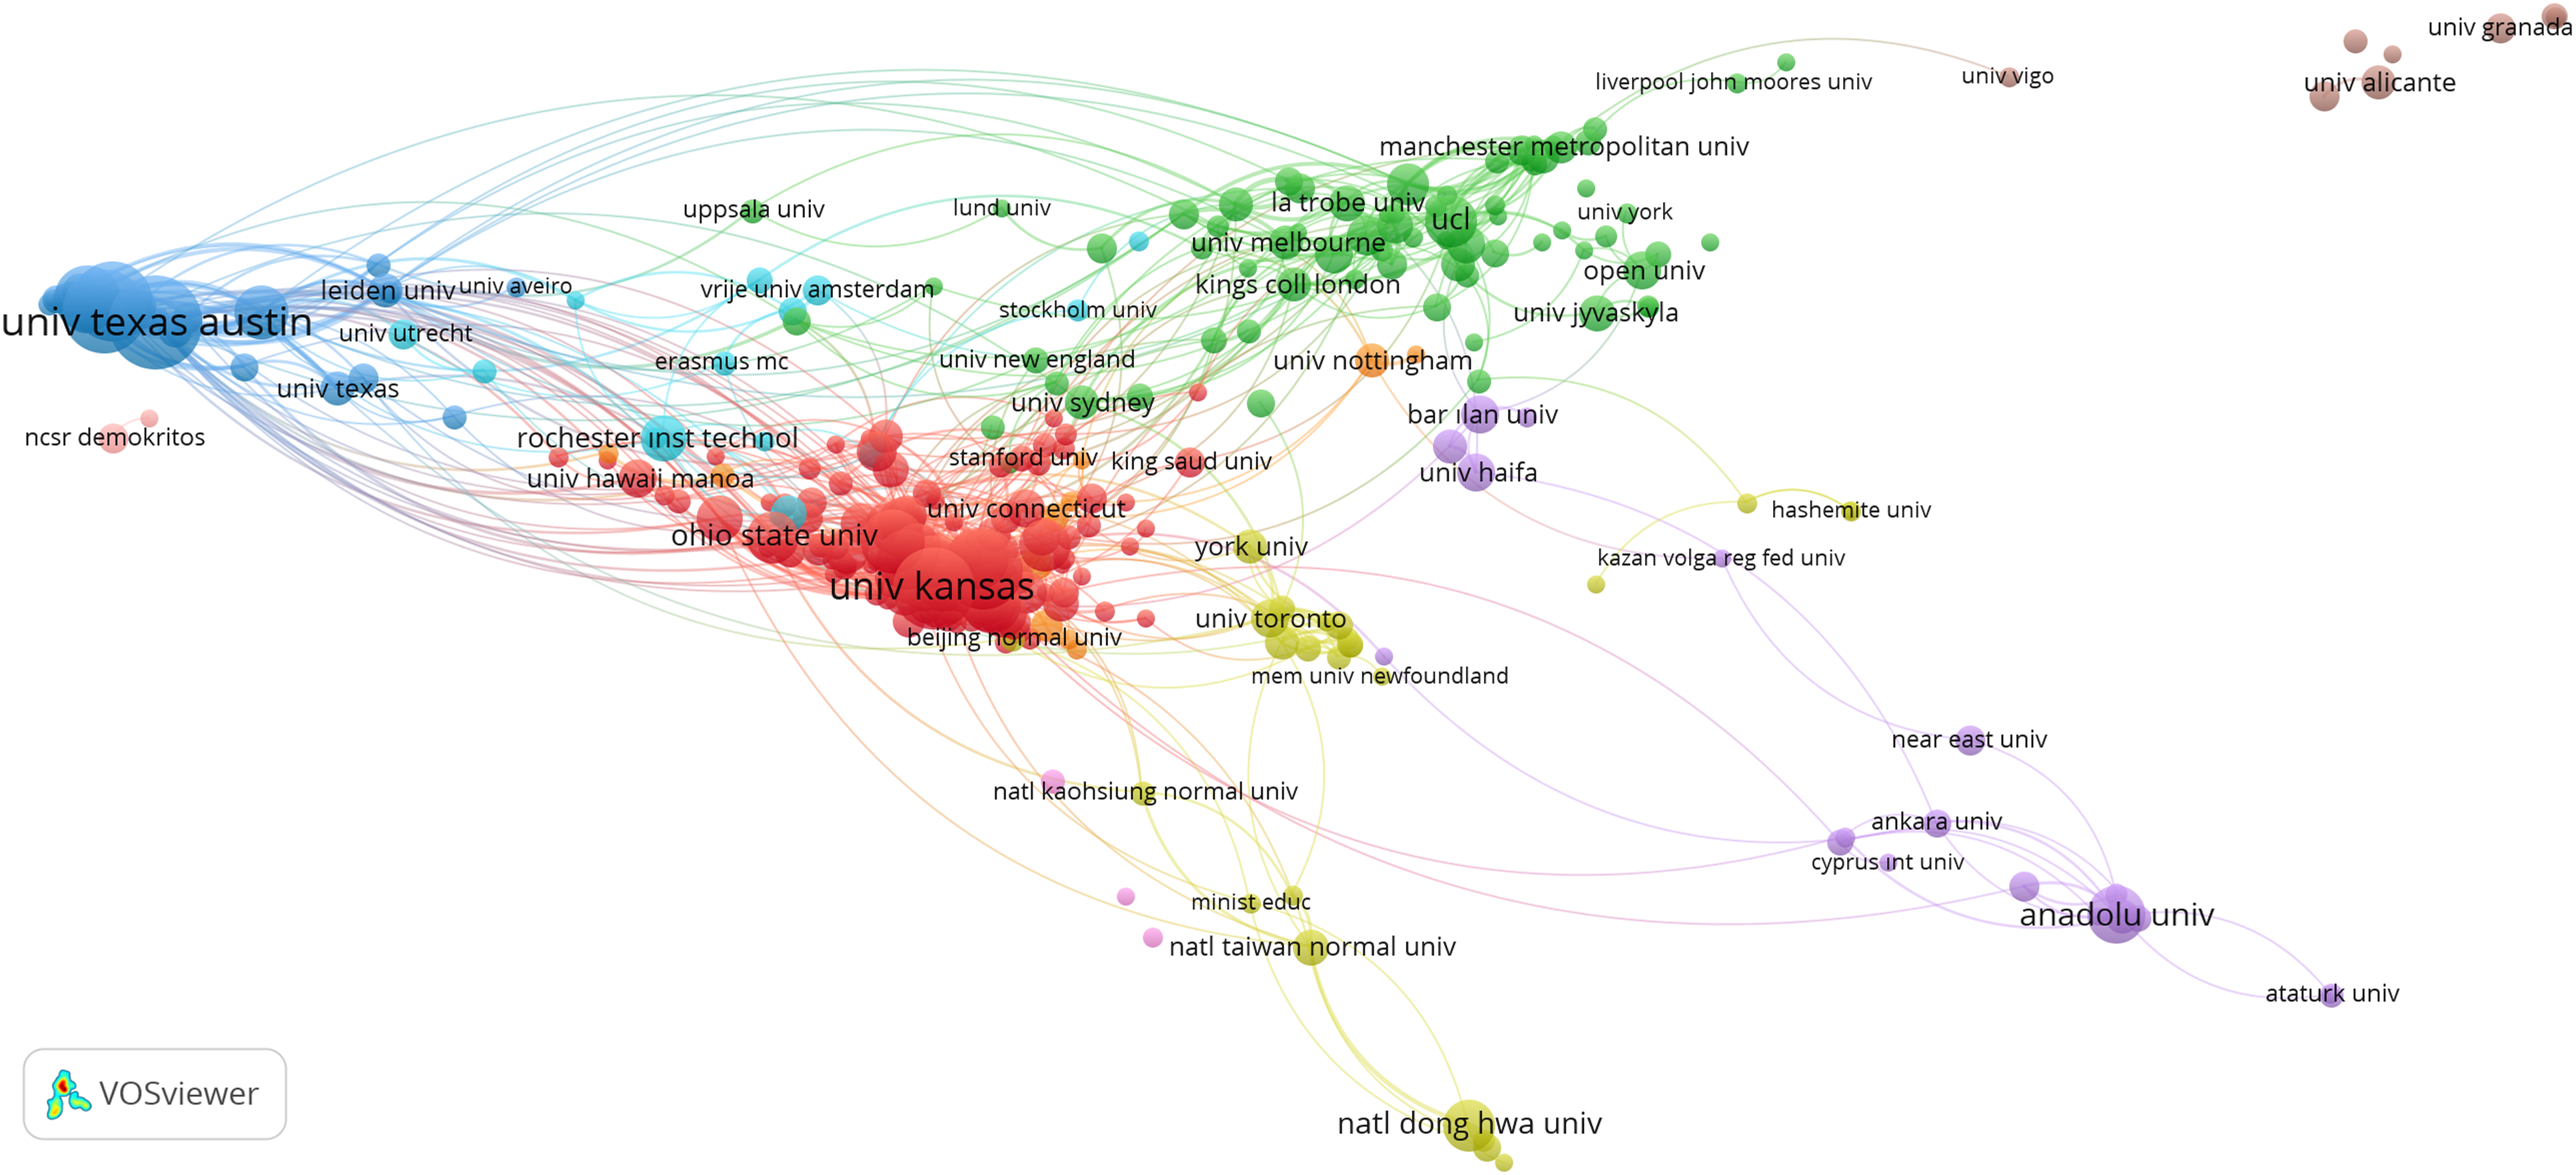
Figure 4 shows the collaboration network between countries in special education and technology research. This analysis examines the collaboration between countries with at least five joint publications. Accordingly, 61 countries were identified, and their cooperation network was mapped. As a result of the analysis, ten clusters with a different number of countries in each cluster formed. The pink cluster represents the highest level of cooperation. The United States, located in this cluster and denoted by the most extensive ring, is centered on the map. Clearly, the pink cluster, which includes Italy, the United States, New Zealand, and South Korea, has cooperation networks with all other clusters. Also, the countries in the red and green clusters have robust cooperation networks. It is evident on the map that England, located in the green cluster, contributed significantly to the field. Considering the entire map, it becomes clear that special education and technical studies facilitate international collaboration. Collaborative research networks between countries.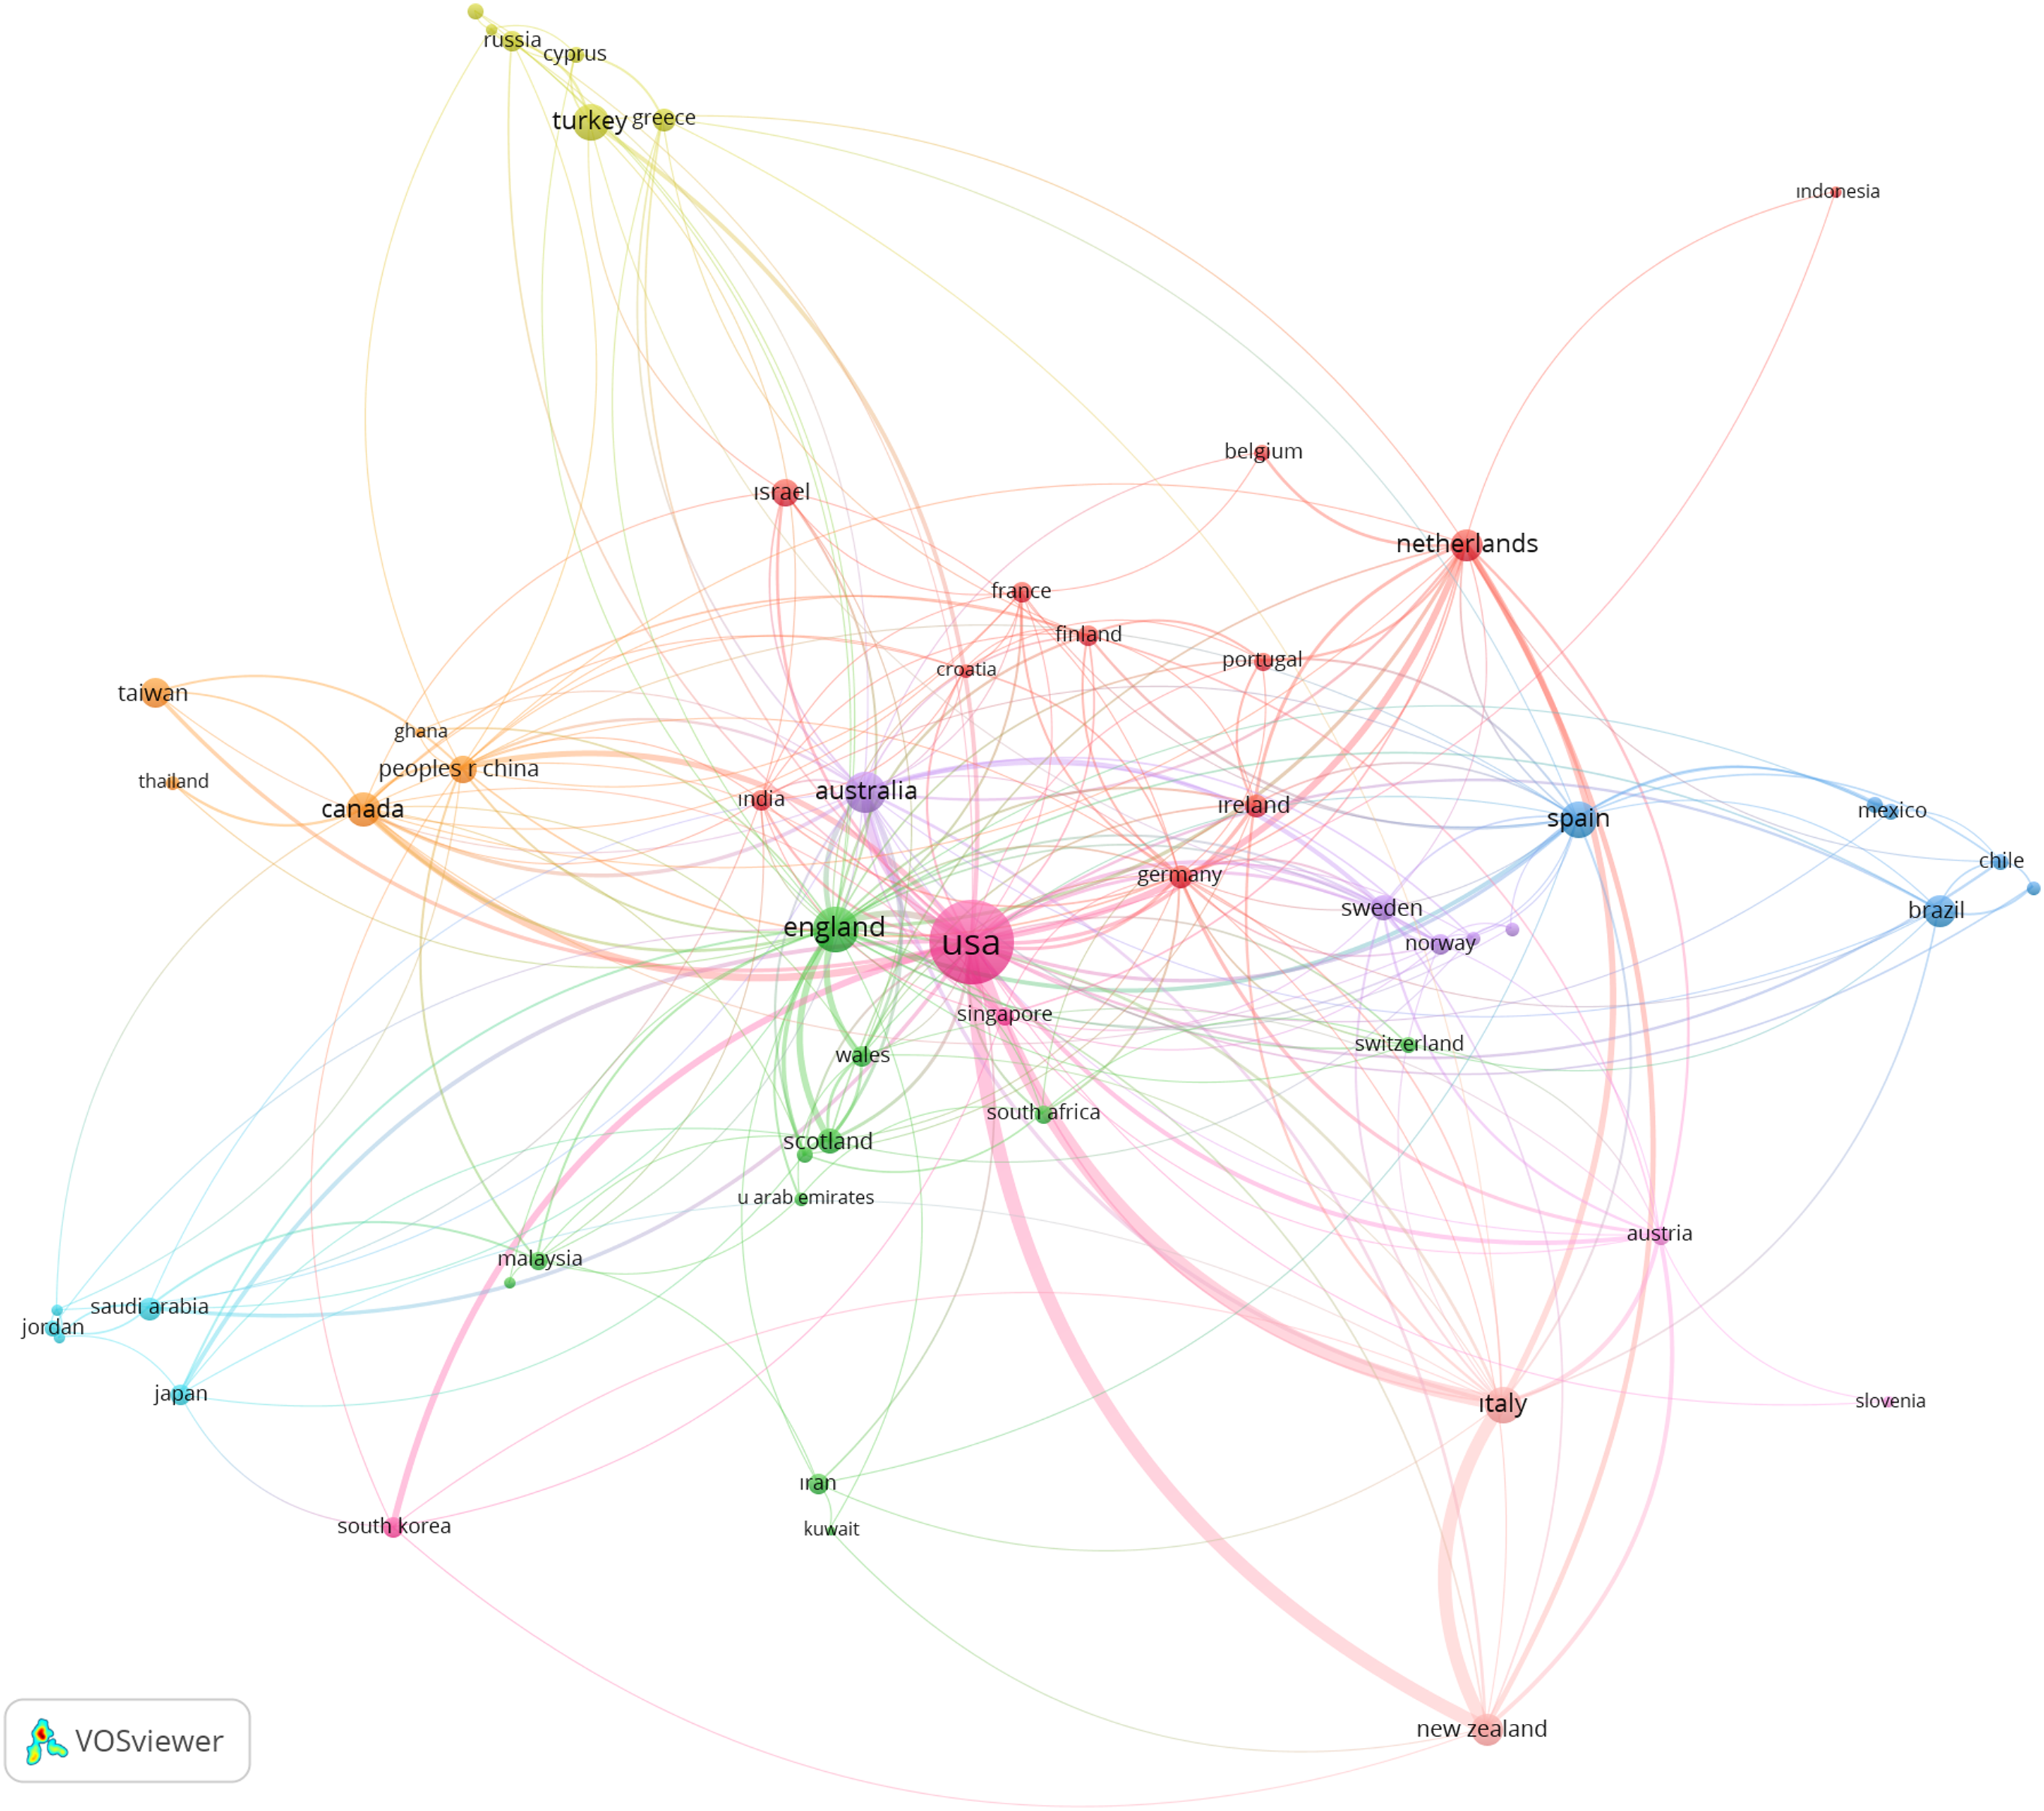
Figure 5 is a map of the co-authorship analysis among authors with at least five publications. According to this analysis, a total of 199 authors are on the map. The network of cooperation between the authors on the map has produced 13 clusters. Each cluster represents an international research group. The results show various networks of scientific collaboration among researchers in technology studies in special education. Authors in the orange, pink, purple, and turquoise clusters formed the strongest collaboration network. This image indicates that authors within these clusters cooperated more often, both within the cluster and with authors from other groups. Orange represents the cluster where the most prominent nodes are located. This cluster also comprised the most cited authors in the field, as is evident. Although more authors are in the blue, green, and red clusters, their cooperation network is lower. Collaborative research networks between authors.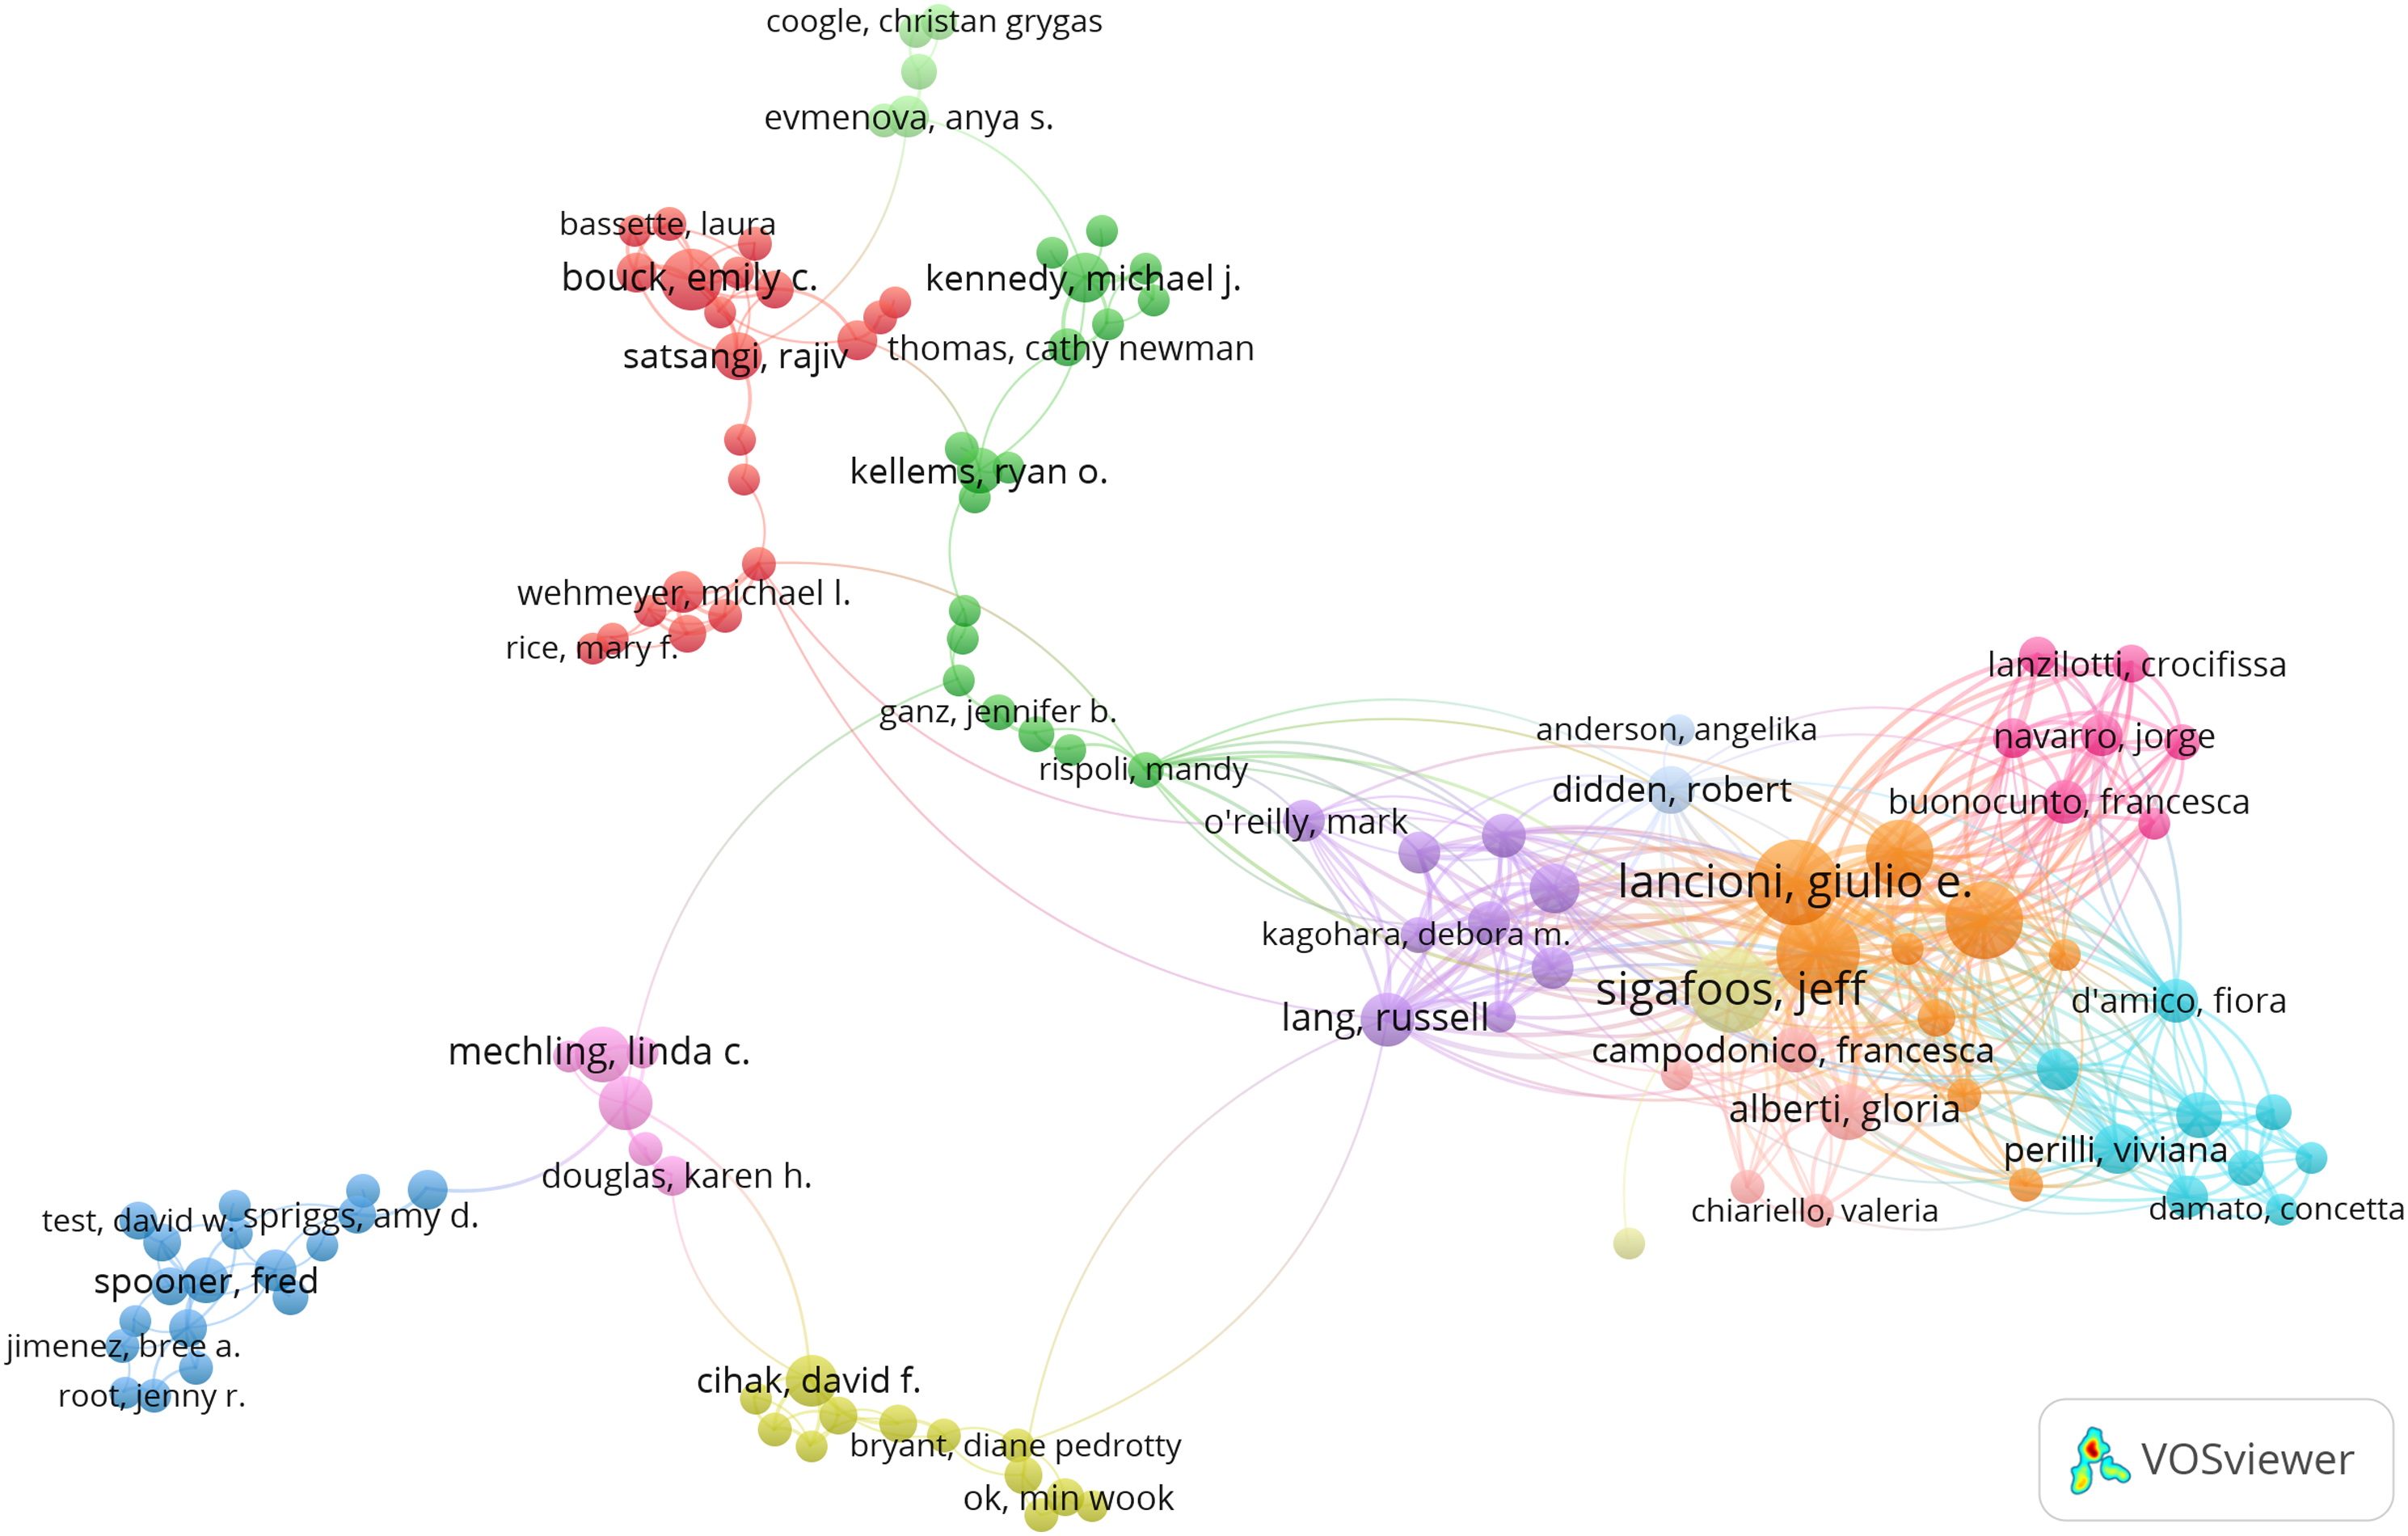
Conceptual Structure: Topical Foci Addressed in the Literature Between 1980 and 2022
In the co-occurrence analysis based on keywords of reviewed articles, only the most frequently occurring concepts (at least five occurrences) were considered. As a result of the analysis, research foci that are commonly studied in the field were determined. Figure 6 depicts the topical foci of scientific articles on special education and technology published between 1980 and 2022 (August). In a broader sense, the map’s clusters summarize the 42-year focus of special education and technology studies and map their chronological development. These concepts that emerge from the analysis constitute a conceptual map of the special education and technology field. Topical foci addressed in the literature between 1980 and 2022.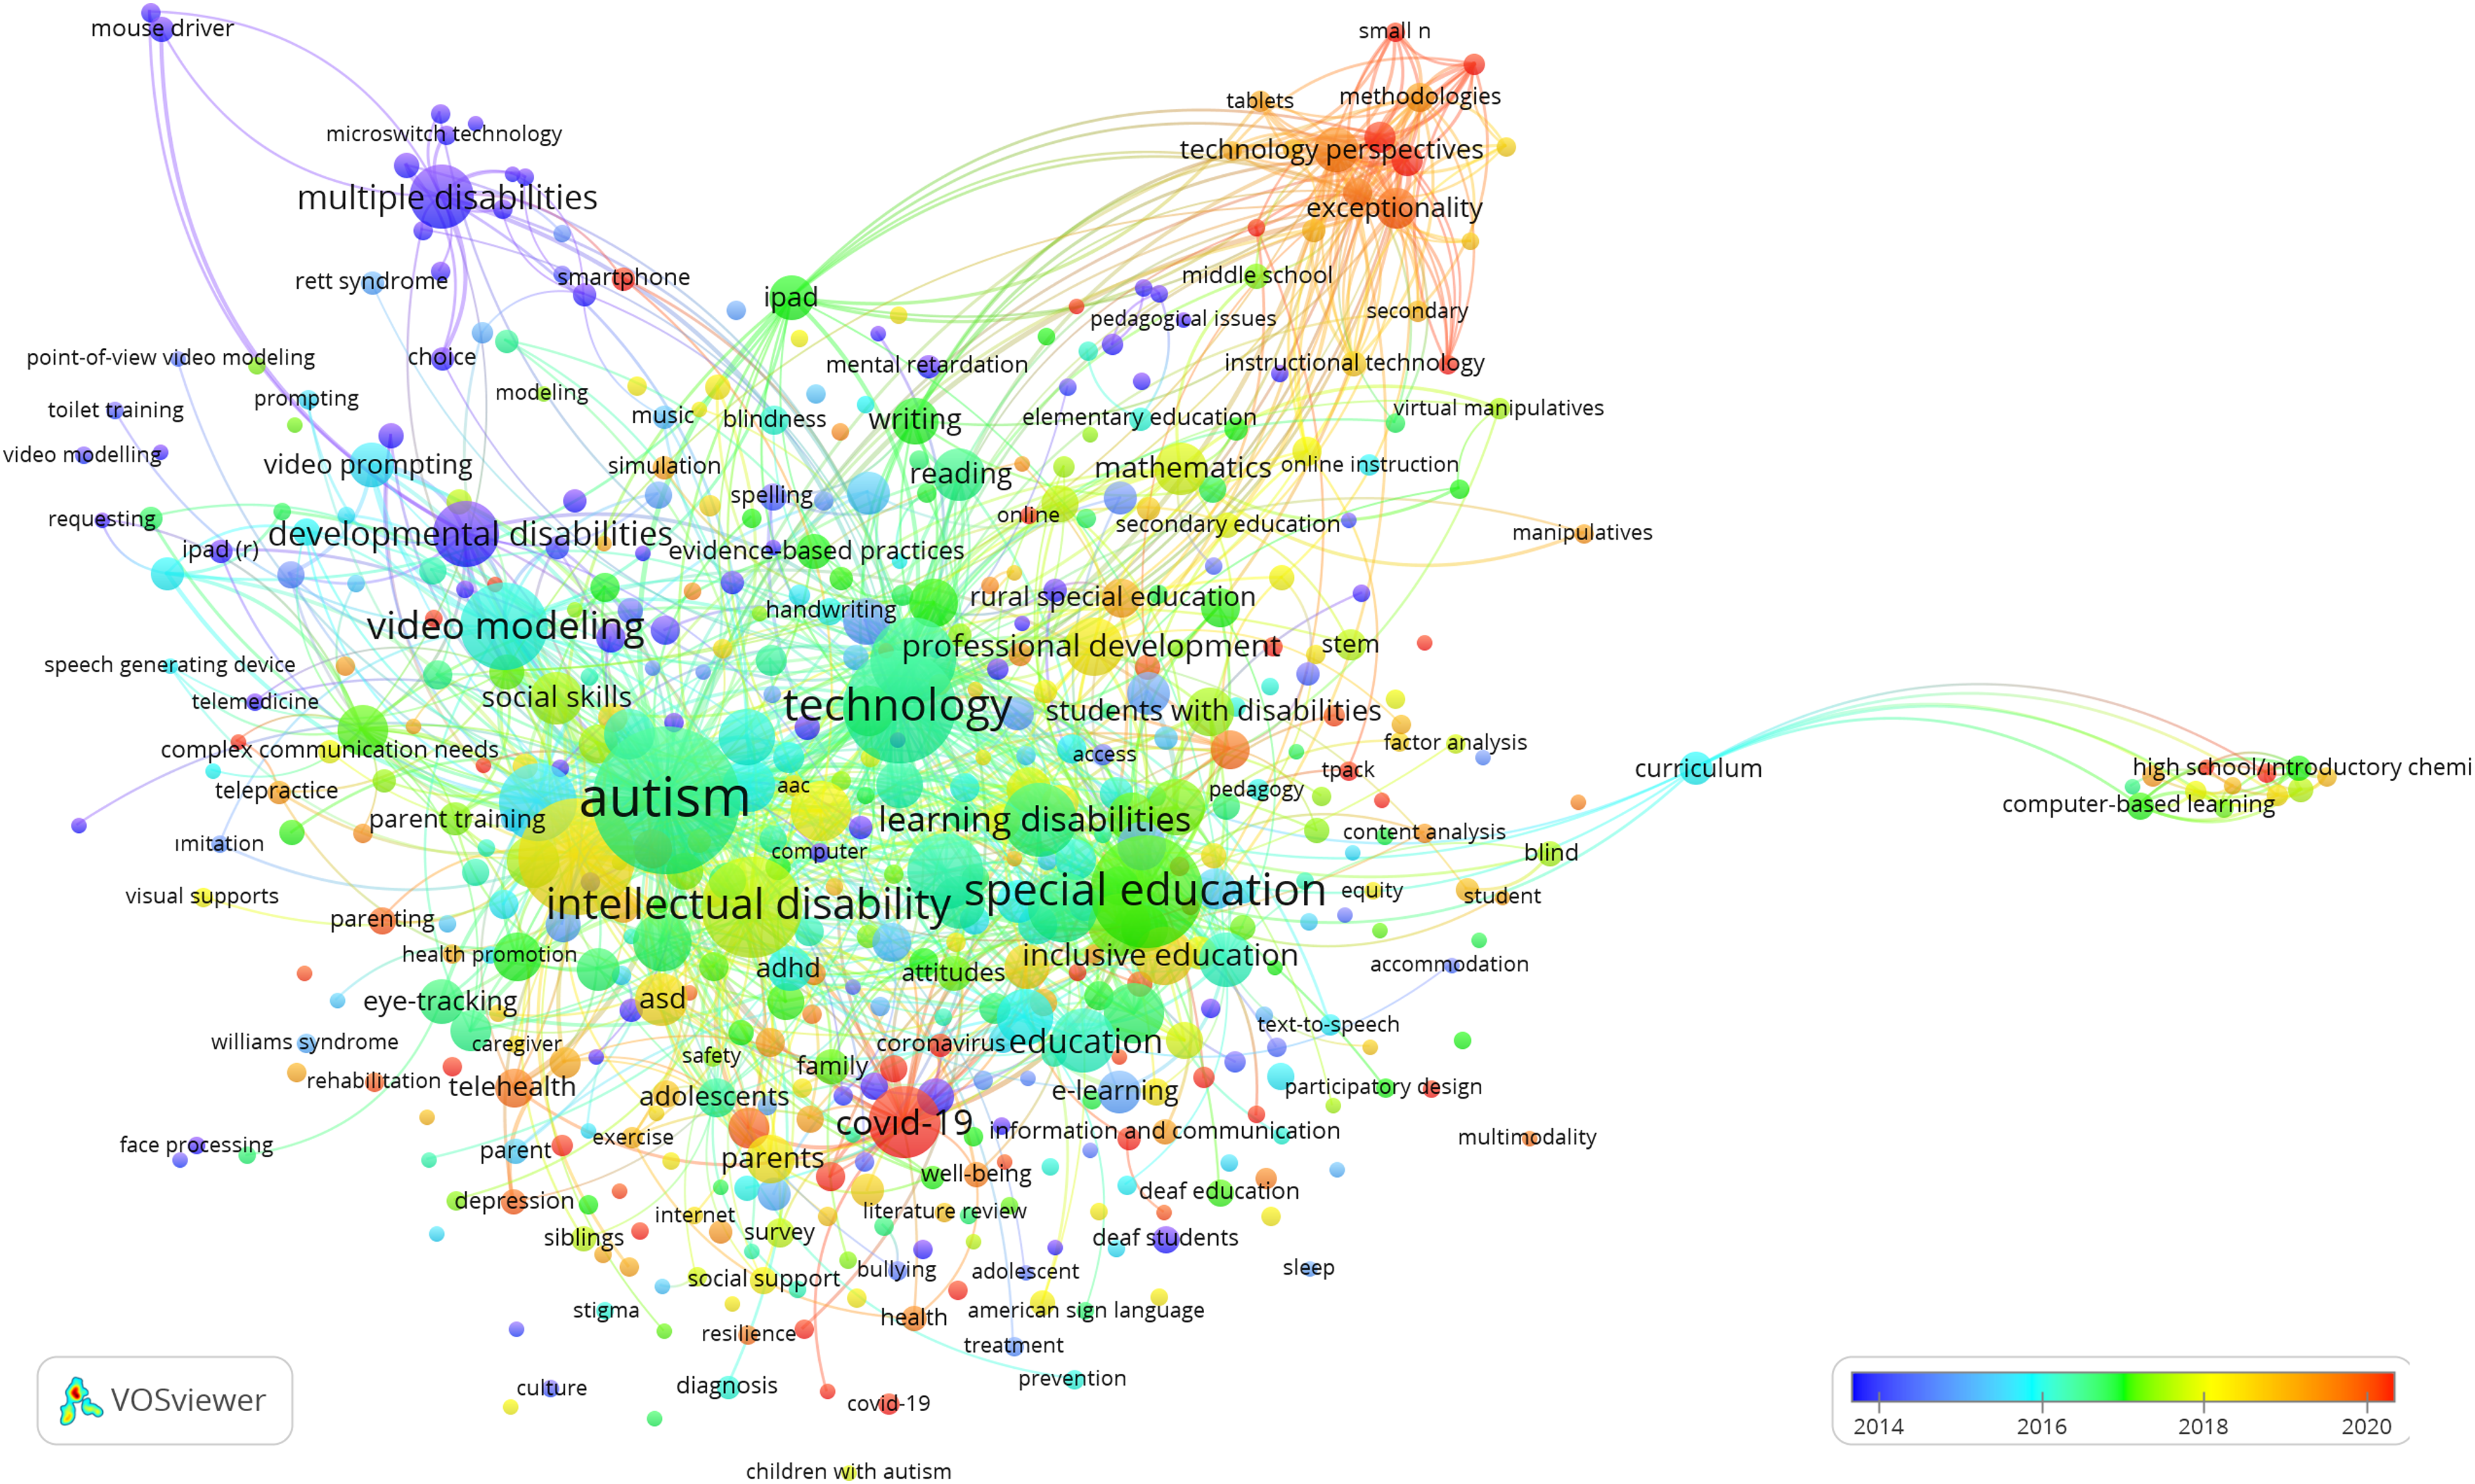
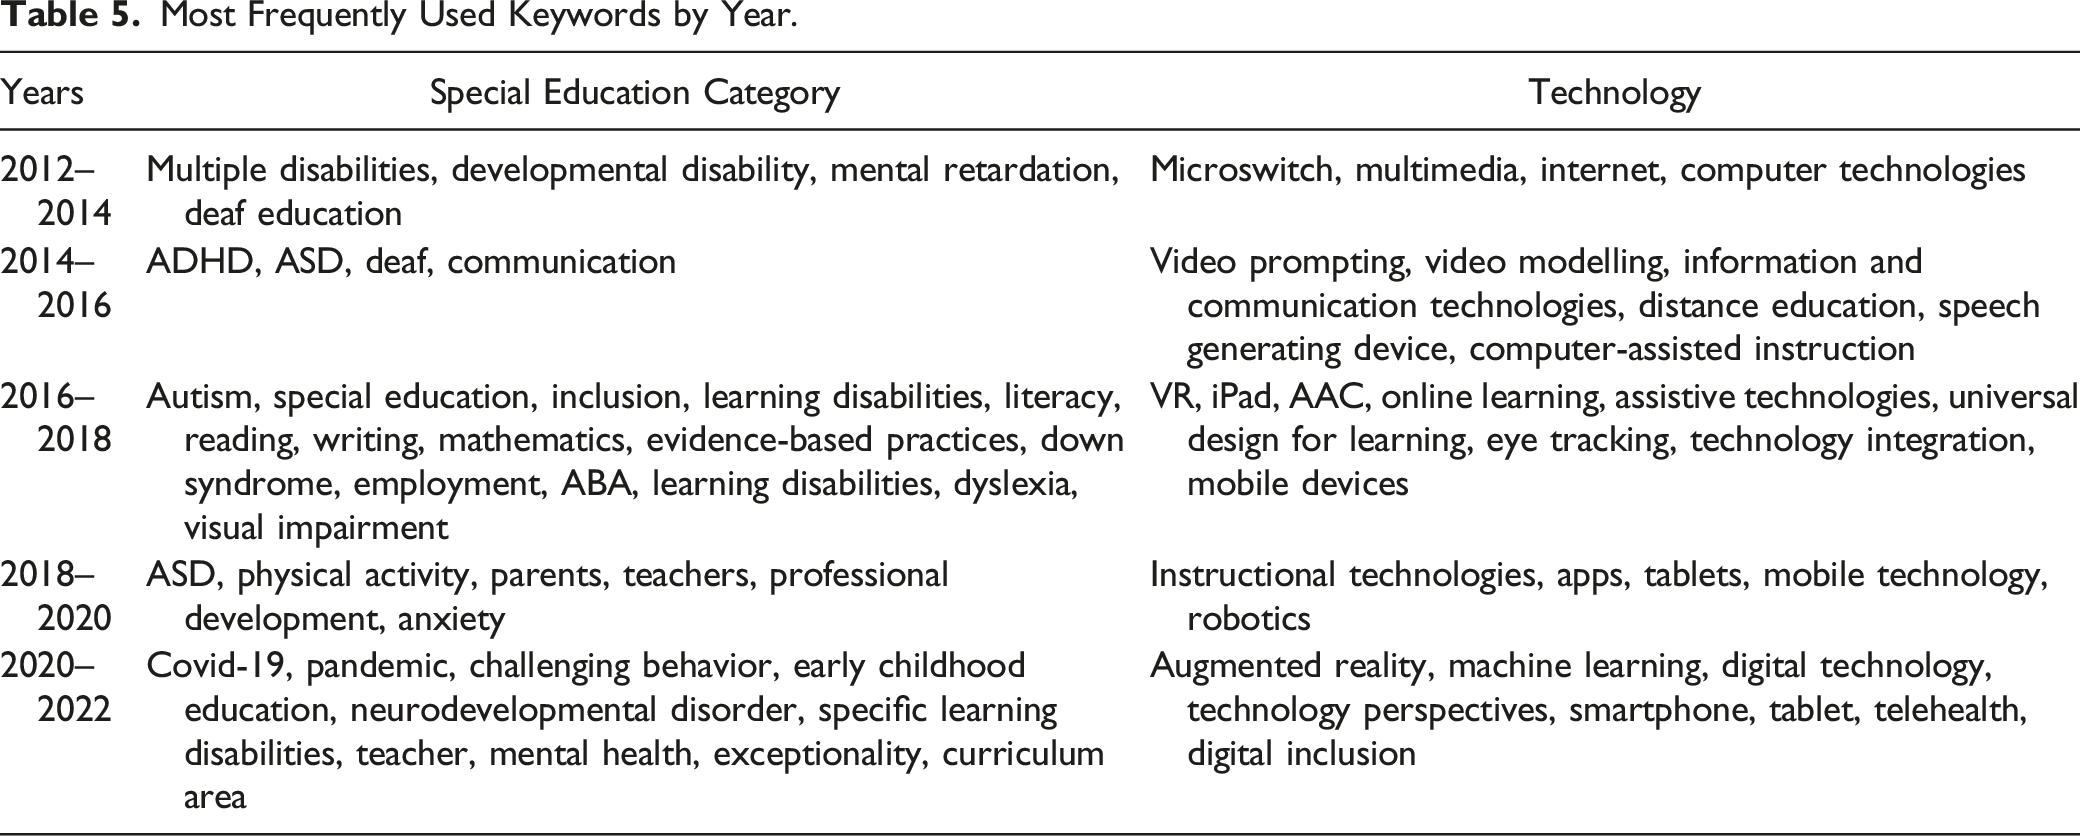
Most Frequently Used Keywords by Year.
Discussion
This study used bibliometric analysis methods to reveal the findings of special education and technology research published in WoS databases. According to the findings regarding the number of publications and citations by year, the number of publications and citations has increased since the first publication in 1980. This increase has been observed to have accelerated, particularly since the 2000s. It shows that the widespread use of internet access and high-tech mobile devices such as smartphones and tablets (Qahmash, 2018) and the legal regulations and investments made by governments in educational technologies since the 1990s (Halverson & Smith, 2009) reflect the results of research on technology use in special education.
The “No Child Left Behind” (NCLB) law enacted in the United States of America in 2001 emphasized the importance of making necessary arrangements for individuals with special needs to access general education programs. This law mandated using technological tools and equipment to help individuals with special needs access general education and integrate them into daily life. Once more, in 2004, the “Individuals with Disabilities Education Act [IDEA]” enforced the use of technology in individualized education. Furthermore, the Assistive Technology Act passed in 2004 made it mandatory to provide assistive technology to people with special needs to participate more independently in education, employment, and daily activities. It is claimed that the widespread use of technology in special education is enabled by special education laws, practices based on these laws, and increased investments in technology (Florian, 2004). This kind of advancements accelerated growth in the field since the middle of the 2000s is also evident in other bibliometric analyses of technology use in education (Goksu, 2021; López-Belmonte et al., 2021; Rodriguez Jiménez et al., 2019). Another reason for this significant increase in publications and citations is the emergence of new journals in the early 21st century that publish research on special education and technology, such as the Journal of Special Education Technology (JSET) or Research in Developmental Disabilities. Furthermore, one of the reasons for this increase can be attributed to the ease of access to databases.
The highest productivity year in the field is 2021, with 476 articles and 7694 citations. One of the most plausible explanations for this circumstance is the educational impact of the Covid 19 pandemic. The coronavirus pandemic has resulted in the global closure of schools, and strict social distancing measures have resulted in rapid and widespread changes to education and training patterns (Yılmaz et al., 2021). In fact, the lockdown situation has necessitated the development of online and distance learning environments. This situation indicates a growing interest in technology research in special education.
The analysis in this study determined the ten most influential journals indexing in WoS databases. Of these journals, only JSET is among the 31 journals Edyburn (2004) reviewed in his study. The journal ranked high in both studies. The review should have included the remaining nine journals in the Top 10 list of the current study. The reason may be that different data collection strategies were applied in the two studies. Edyburn reviewed by manually scanning the journal list in the ERIC database and from local libraries to include the journals. In contrast to him, we analyzed every article in the WoS database that included the keywords and met the inclusion criteria. In other words, no journal selection procedure was used in the current study.
According to research data, the journal with the most publications and citations in the field is Research in Developmental Disabilities. Even though it ranks second in publications and citations, JSET has the highest total link strength among all journals. Total link strength indicates the total strength of co-authorship links between a researcher, journal, or country (Van Eck & Waltman, 2014). In other words, this journal’s citation power relative to other journals is relatively high despite the number of articles and citations. That is, this circumstance indicates the high impact power of the journal. The journal’s direct focus on special education and technology can be considered among the significant reasons for the circumstance. Researchers can find journals with strong link strength in addition to indicators such as impact size or h-index. These are usually journals that target a broader audience than a specific disability. As a result, identifying such journals can assist researchers in making their works available to readers across various fields. Visibility among academics from many areas may also lay the groundwork for new interdisciplinary cooperation networks.
Nine of the top ten journals in Table 2 draw attention as directly based on special education. In addition, three out of ten journals focus on autism. Autism, one of the most frequently repeated keywords, is also the primary focus of research on technology in special education, as indicated by Figure 4’s map of topical research foci. Subakan and Koç (2019), who systematically examined research on technology support in special education, concluded that Autism Spectrum Disorder (ASD) is the disability that benefits most from technology support. It is because the opportunities afforded by technology, particularly information technologies (IT), overlap with autism’s requirements (Yee, 2012). Individuals with ASD typically do not wish to learn in such settings because they find social environments unreliable and are uneasy in such an environment (Kousar et al., 2019). These options generally include ensuring the consistency of a well-defined task and providing a learning environment with no distractions caused by unnecessary stimuli. Unlike the typical social setting, computers and other IT devices do not impose social demands that are often difficult and confusing for individuals with ASD. They can provide immediate, repeatable, and predictable responses. Graphics provided by IT are abundant in the visual stimuli required by those with ASD (Grynszpan et al., 2014). Individuals with ASD can be provided with a suitable, encouraging, consistent, and dependable learning environment with technology. Considering these technological opportunities and the specific learning needs of individuals with ASD, it is evident that individuals with ASD have the greatest need (Eliçin, 2016).
According to the co-authorship analysis of institutions, geographically adjacent institutions collaborate more frequently. However, strong collaborations have been established between institutions in distant geographies. Examining the co-authorship analysis to reveal cooperation between countries is reviewed, it is seen that researchers working on special education and technology are from 103 countries. However, the United Nations consists of 193 member states. In total, there are 208 countries in the world. This might be because underdeveloped countries need more access to special education research, services, or technology.
When examining international cooperation, it is evident that the United States occupies a central position. It means the United States is at the center of robust cooperation networks. The United States has collaborated extensively with both Italy and New Zealand. These countries are home to the authors who occupy the top third position on the most influential authors list. Moreover, the collaboration between these three writers is considerable. The fact that the authors conducted many studies together contributed to the strong cooperation between their countries. Of course, this collaboration map is specific to special education technologies. Cooperation patterns in different fields may differ. For example, in their bibliometric study on Augmented Reality Research in Education, Karakus et al. (2019) determined that the largest cooperation network is between Spain, Taiwan, and Turkey, while the United States frequently collaborates with Italy and the United Kingdom.
According to the analysis of co-authorship between the authors, there are numerous scientific cooperation networks between special education and technology studies researchers. The orange cluster displays the largest network of collaboration. Most researchers in this cluster are also listed in the leading authors’ table (Table 3). For instance, Sigafoos, Lancioni, and O’Reilly rank among the top three in the solid collaborative network cluster (Figure 5) and the leading author’s list (Table 3). It would be helpful to examine their collaborative efforts to demonstrate the effectiveness of collaboration between the authors on technology in special education. There are 325 publications that researchers have been working with since 2004 in SCI-Expanded, SSCI, AHCI, and ESCI databases. In addition, the number of articles published in journals in the special education category is 138. The average number of citations in these articles is 20.22. This may demonstrate that the writers’ strong collaboration facilitates the production of high-quality works. Although the authors are from different organizations and even geographically distant countries, it is evident that they work well together, and this collaboration contributes positively to the field. Thanks to this information showing the collaboration networks between authors, special education researchers can identify influential authors publishing on the topics of their interest, follow their works, keep up to date on the subject, and develop new collaboration networks. Researchers may also evaluate the interaction dynamics in different disciplines. It can help to create possible collaborations in different disciplines.
The most frequently used keywords by year are displayed in Table 4. Examining the evolution of keywords over time reveals that the effects of current events have shaped the research focus of recent studies. For instance, it is noteworthy that the keywords Covid 19, pandemic, and coronavirus are included in the red cluster, representing the research foci from 2020 to the present. Examining the map reveals a second remarkable discovery: the technological advancements parallel the research topic over time. While concepts such as micro switch, multimedia, internet, and computer technologies rose to prominence between 2012 and 2014, it is evident that with technological advancements, machine learning, smartphone, tablets, augmented reality, and digital inclusion have become the focus of studies close to the present. These areas also indicate possible popular research topics for researchers. This indicates that by concurrently introducing innovative technologies into our daily lives, special education researchers are seeking ways for individuals with special needs to benefit from the potential of these technologies. However, the findings show: Although some innovative technologies such as the internet of things, artificial intelligence, virtual classroom, and metaverse have found a place in education disciplines, it is seen that they have yet to take place in special education studies. Therefore, these technologies can be seen as potential special education research topics shortly.
In conclusion, this study provides an overview of technology research’s development and the current state of special education. When our study’s findings are analyzed, it becomes clear that there has been a growing interest in this topic, particularly over the past few decades. In addition, the most influential authors in the field are those who form author clusters with a high level of cooperation. It demonstrates that while there are several research groups in the field, most research is conducted in a few nations, and geographical, cultural, and linguistic factors influence most collaborations. Furthermore, it can be seen that the field has a very dynamic structure. The research topics are shaped by changes in special education, legal regulations, important international events, and technological advances.
Suggestions
This research was conducted by analyzing the articles in the journals scanned by the SSCI, SCI-expanded, ESCI, and AHCI indexes. Similar studies may be carried out on databases such as ERIC and SCOPUS to access and analyze more publications. In this study, we attempted to analyze all studies that examined the use of technology in special education without limiting it to any particular disability or technology. In this respect, it helps us view the field’s status and developments broadly. To examine the trends in the field in greater detail, however, bibliometric research on the technologies for a particular type of disability (e.g., physical disability) is required. Also, the bibliometric analysis of studies examining a specific technological tool (e.g., artificial intelligence) in special education will significantly contribute to the field.
Despite the high level of international cooperation between authors or institutions, networks tend to be limited to certain countries, regions, or cultures close to each other. However, we noticed that solid collaborations between researchers from various regions contribute positively to the field. In addition, it is understood that there is a correlation between cooperation and productivity. Therefore, we suggest that researchers who study technology use in special education develop international cooperation networks. Specifically, the collaboration of experts in fields such as engineering, educational technologies, material development, and instructional design improves the quality of the studies.
The rapid increase in research shows that the literature will reach a substantial volume soon. Therefore, studies can be conducted to determine evidence-based practices on which technological tools are effective for which type of disability, skill, and age group. Identifying and disseminating evidence-based practices is critical to improving the quality of education for students with special needs, their teachers, and their families. Next, flexible instructional materials and procedures can be developed in the light of scientific evidence and made available for everyday use. In this way, the field’s accumulated knowledge illuminates the practice and can have a widespread impact. In addition, adding technology classes to programs that train teachers can make it easier to put the results of studies into practice.
Another significant conclusion of this study is that the technologies the field focuses on have shifted throughout time. Accordingly, technological advancements impact the field. In this context, researchers should actively follow innovative technologies and study how these technologies might be utilized to provide better educational opportunities to individuals needing special education. Adopting an interdisciplinary approach while working with such technologies and collaborating with experts from technical sciences such as engineering will increase the quality of the studies. We also recommend that researchers pay attention to quality indicators and design standards, essential for identifying evidence-based practices. We believe that individuals with special needs will benefit from the possibilities of technological developments to a greater extent, thanks to evidence-based practices.
Limitations and Delimitations of the Study
This research has several limitations and delimitations. First, this study’s findings are limited to the WoS database articles that used the keywords listed in Table 1. Although we try to identify all possible keywords by reviewing the literature on technology use in special education and legal regulations about special education, some special education technology studies that do not include these keywords may be excluded from the analysis. In addition, the database’s bibliometric data was directly inserted into the data analysis procedure. In other words, the authors should have evaluated the titles and abstracts of the 4493 publications before conducting the analysis. This situation eliminates author bias in bibliometric data collecting and makes screening more repeatable (Todeschini et al., 2020). However, it may result in the inclusion of some research that is not directly connected to the topic. Lastly, the WoS database does not contain the ORCID numbers of the authors in its bibliometric information.
Therefore, different writers with the same name or changing some authors’ surnames likely influenced the results. However, we think this effect is low and will not drastically affect the general view of the field. To the extent allowed by VOSviewer, researchers also checked possible author name issues and made the required adjustments to mitigate these effects.
Footnotes
Declaration of Conflicting Interests
The author(s) declared no potential conflicts of interest with respect to the research, authorship, and/or publication of this article.
Funding
The author(s) received no financial support for the research, authorship, and/or publication of this article.