
Abstract
This study examined characteristics of 458 Grade 10 students who earned a Bachelor of Science degree in computer science while completing their secondary school studies. Cluster analysis of SAT-M and Raven Progressive Matrices Test scores identified four distinct groups: G-EM: generally gifted, excelling in mathematics; AG-AEM: averagely gifted, average mathematical excellence; AG-NEM: averagely gifted, non-excelling in mathematics; NG-AEM: not generally gifted, average mathematical excellence. The G-EM group demonstrated significantly higher general and mathematical creativity compared to all other groups. Post-hoc analysis revealed cluster-dependent and task-dependent correlations between measured criteria. Results suggest creativity levels could serve as an effective criterion for program enrollment decisions.
Keywords
Background
Although the importance of STEM professions is growing exponentially, student interest in STEM professions remains less than optimal (Ardianto et al., 2023; Gallagher, 2000; Wai, 2015; Wai et al., 2010). Educational opportunities in these areas are essential not only for a prosperous society, but also for helping children transform their academic talents into professional achievements (Warne et al., 2019). Despite awareness of the personal and societal value of STEM professions, many students choose this career pathway late in life (Constan & Spicer, 2015; Miller et al., 2007; Sadler et al., 2012). Early high achievement in mathematics and science supports later success, and participation in high-quality STEM courses can strengthen students’ inclination to pursue these directions for their future (Young et al., 2017). Lichtenberger and George-Jackson (2013) noted that academic qualification and preparation for STEM are associated with the mathematics and science courses students take, as well as the grades they receive in these courses. This study addresses the initial phase of longitudinal research designed to track students throughout their academic journey, aiming to identify the characteristics that most effectively predict success in STEM education.
Educational programs especially designed for gifted students aim to provide opportunities that are not typically available in traditional classrooms (Young et al., 2017). University programs and courses for high school students designed for talented youth offer new challenges and support them in fulfilling their intellectual potential (Leikin, 2009a). Furthermore, these programs cultivate human assets to meet the needs of society and make higher education more accessible to a diverse range of gifted and talented students, regardless of their socioeconomic status (Weisblay, 2018). Engagement in out-of-school programs may play a critical role in helping students realize their intellectual potential (Greene et al., 2013). These programs are increasingly recognized as effective tools for promoting positive youth development (Eccles & Templeton, 2002; Goerge et al., 2007; Heath et al., 2022).
Advanced Placement (AP) courses are a well-established format that provide students with the opportunity to begin college-level academic studies while still in high school. The AP program offers college-level coursework to high school students, easing their transition to higher education (Dougherty et al., 2006; Hoepner, 2010; Warne et al., 2019). Research shows that students who take AP courses tend to perform better in both high school and college, particularly in the subjects in which they completed AP coursework (Ackerman et al., 2013). These college-level courses both ease the transition to postsecondary education and contribute to the development of human capital (Conger et al., 2021). Success in AP courses is associated with improved academic outcomes (Mo et al., 2011) and serves as an indicator of college-level readiness prior to high school graduation. Moreover, students who participated at the highest levels of AP coursework demonstrated lower failure rates in core university subjects, particularly in mathematics and science (Goerge et al., 2007). Participation in AP courses can serve to motivate students to pursue STEM careers by offering a college-level academic experience during high school (Warne et al., 2019). Research suggests that participation in AP STEM courses is associated with selecting a STEM major in college as well as career STEM achievement (Ackerman et al., 2013; Wai et al., 2010).
Motivation is a key predictor of academic performance (Dogan, 2015) and long-term academic achievement (Kori et al., 2016). Hence, to maximize educational success, young people must be motivated and willing to work hard (Jerrim et al., 2020). Motivation is often a result of strong implicit beliefs about one’s own abilities (Ommundsen et al., 2005; Wang & Eccles, 2013). Implicit beliefs about ability are defined as individuals’ perceptions of the differences they perceive between ability and effort; if an ability is seen as stable, it cannot be changed by effort, yet, when the ability has been acquired through training, then it can be improved by making greater effort (Li & Lee, 2004).
Adolescent motivation plays a critical role in shaping educational pathways and influencing the decision to pursue a STEM career (e.g., Musu-Gillette et al., 2015; Wang & Eccles, 2013). Therefore, increasing student participation in STEM fields requires intentional efforts to foster and sustain motivation (Rosenzweig & Wigfield, 2016). During adolescence motivation tends to decline more sharply in mathematics and science than in other academic domains (Wigfield et al., 2015). Research indicates that students’ educational environments can positively influence their motivational beliefs as well as their attitudes towards science (Fortus & Vedder-Weiss, 2014; Vedder-Weiss & Fortus, 2011). One effective way to enhance student motivation is through specially designed curricula that promote active engagement in the learning process (Chittum et al., 2017; Cutucache et al., 2016). Participation in an afterschool STEM program was associated with strengthened motivational beliefs and greater resilience against declines of motivation (Chittum et al., 2017).
It is widely believed that students who participate in AP and other out-of-school programs have high intellectual potential. Intellectual potential (Leikin, 2009a) comprises four elements: cognitive abilities (e.g., intelligence, domain-general and domain-specific skills, general and domain-specific creativity), affective characteristics (motivation, attitudes, beliefs, emotional responses), personality traits, and learning opportunities. The complex construct of intellectual potential framed our study design.
Research consistently highlights that student motivation is a key factor that influences academic success (Chowdhury et al., 2013). Highly motivated students tend to engage more actively in their learning and achieve higher academic outcomes (Chittum et al., 2017). Whereas previous studies have shown that STEM programs enhance engagement by fostering interest and motivation (Chittum et al., 2017; Ugras, 2018), the present study investigates the relationships between cognitive characteristics (intelligence and creativity) and student motivation.
Creativity is widely regarded as one of the most essential skills for success in the 21st century (Henriksen et al., 2019). Creativity involves generating ideas that are both novel and useful, and it is widely considered an intrinsic component of human intelligence (Sternberg & Lubart, 2000). Creativity is a critical asset across nearly all modern fields and is defined as a complex cognitive process that results in the production of novel ideas (Simonton, 2000). It is a particularly important skill for STEM education (Ugras, 2018). Students who can apply their knowledge creatively are better equipped to solve complex, real-world problems (Leikin, 2018). Several studies over the past decade have demonstrated that mathematical creativity is closely linked to mathematical achievement (Haavold, 2020; Leikin & Lev, 2013; Schoevers et al., 2020). In many of these studies, higher levels of mathematical achievement were positively associated with greater mathematical creativity. To examine mathematical creativity, most of these studies employed Multiple Solution Tasks (MSTs; Leikin, 2009b), with the mathematical problems used by researchers differing in terms of topics, levels, and skills required from study participants.
The Study
Research Goal
The goal of the current study was to examine the characteristics of high school students who are motivated to pursue a Bachelor of Science (BSc) degree in computer science. Admission cut-off criteria for the program were determined by program leaders and based on assessments of intelligence and mathematical competence. The study investigated general and mathematical creativity, mathematical competence, general intelligence, and motivation among students before entering the BSc computer science program. Cluster analysis was conducted to explore differences in motivation and creativity among participants categorized by the existing cut-off criteria. We asked the following research questions: How do groups with different combinations of general intelligence and mathematical competencies differ in motivation and creativity? What correlations can be found between the cut-off criteria, motivation, and creativity components?
The Context
The Challenge Program is a 4-year program that offers gifted adolescents the unique opportunity to earn a BSc degree concurrently with their high school studies. This is a highly competitive program that offers challenging academic learning experiences for students seeking studies beyond the standard high school curriculum. Its goal is to fully cultivate students’ intellectual potential, allowing them to earn a prestigious degree in computer science at an early age and providing a strong foundation for future career success.
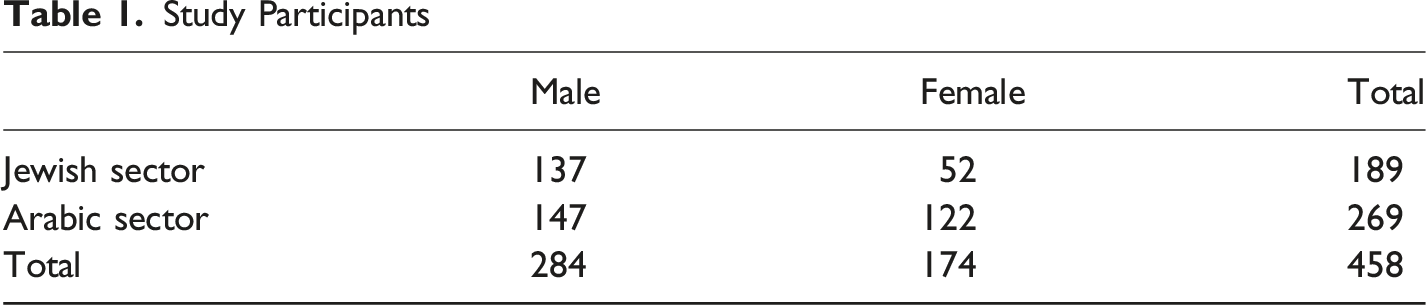
Study Participants
Study Participants
Tools and Data Collection
This study used data from admission tests administered following the initial screening phase in the application process. The following measures were used to address the goals of the current study.
The Raven Progressive Matrices Test (RPMT) was used to evaluate the level of students’ general intelligence (Raven et al., 2000). A shortened version of the test, adapted and validated by Zohar (1990), was used. This version consists of 30 items allotted with a 15-minute time limit. Each item included 3 × 3 matrices with a missing image, and participants were required to select the correct image from 6 to 8 alternatives. Successfully solving this test involves identifying the underlying rules that explain the progression of shapes. Black items are presented on a white background, with difficulty increasing throughout the test. The scores range from 0 to 30, representing the number of correct responses.
The math section on the SAT (SAT-M) was used to evaluate mathematical competencies. This standardized test is widely used for college admissions in the United States. A shortened version developed and validated by Zohar (1990), was used in this study. Participants were asked to answer 35 mathematical multiple-choice questions within a 30-minute time limit. The test contains questions from various mathematical topics and is designed as a multi-component assessment. Scores range from 0 to 35, representing the number of correct responses.
Multiple Solution Tasks were used to assess both general and mathematical creativity. A scoring model and scoring scheme validated by R. Leikin (2009b, 2013), was applied. The tasks explicitly required participants to generate multiple solution strategies. Although the model was initially developed to assess mathematical creativity, research demonstrates its utility for evaluating general creativity as well (R. Leikin, 2013). Each solution strategy was scored across four domains: fluency, flexibility, originality, and creativity. Fluency was measured by the number of appropriate solution strategies generated. Flexibility reflected the variety of strategies used and the participant’s ability to “be different from themselves.” Originality of the solution strategies was based on the rarity of a solution strategies within the sample, capturing the participant’s ability to “be different from others.” The Creativity score for each solution was calculated by multiplying its flexibility and originality ratings. The full model and the scoring scheme are presented in the Appendix.
The Pictorial MST was used to assess general creativity (Leikin, 2009b, 2013, M. Leikin, 2013). In this test, participants are presented with a black-and-white image depicting a small, child-like raccoon attempting to retrieve its hat from a high hanger but unable to do so (see Figure 1). Participants were instructed to “help the raccoon to get its hat in as many ways as possible.” Students were given 10 minutes to complete the test. MST-1 Pictorial MST.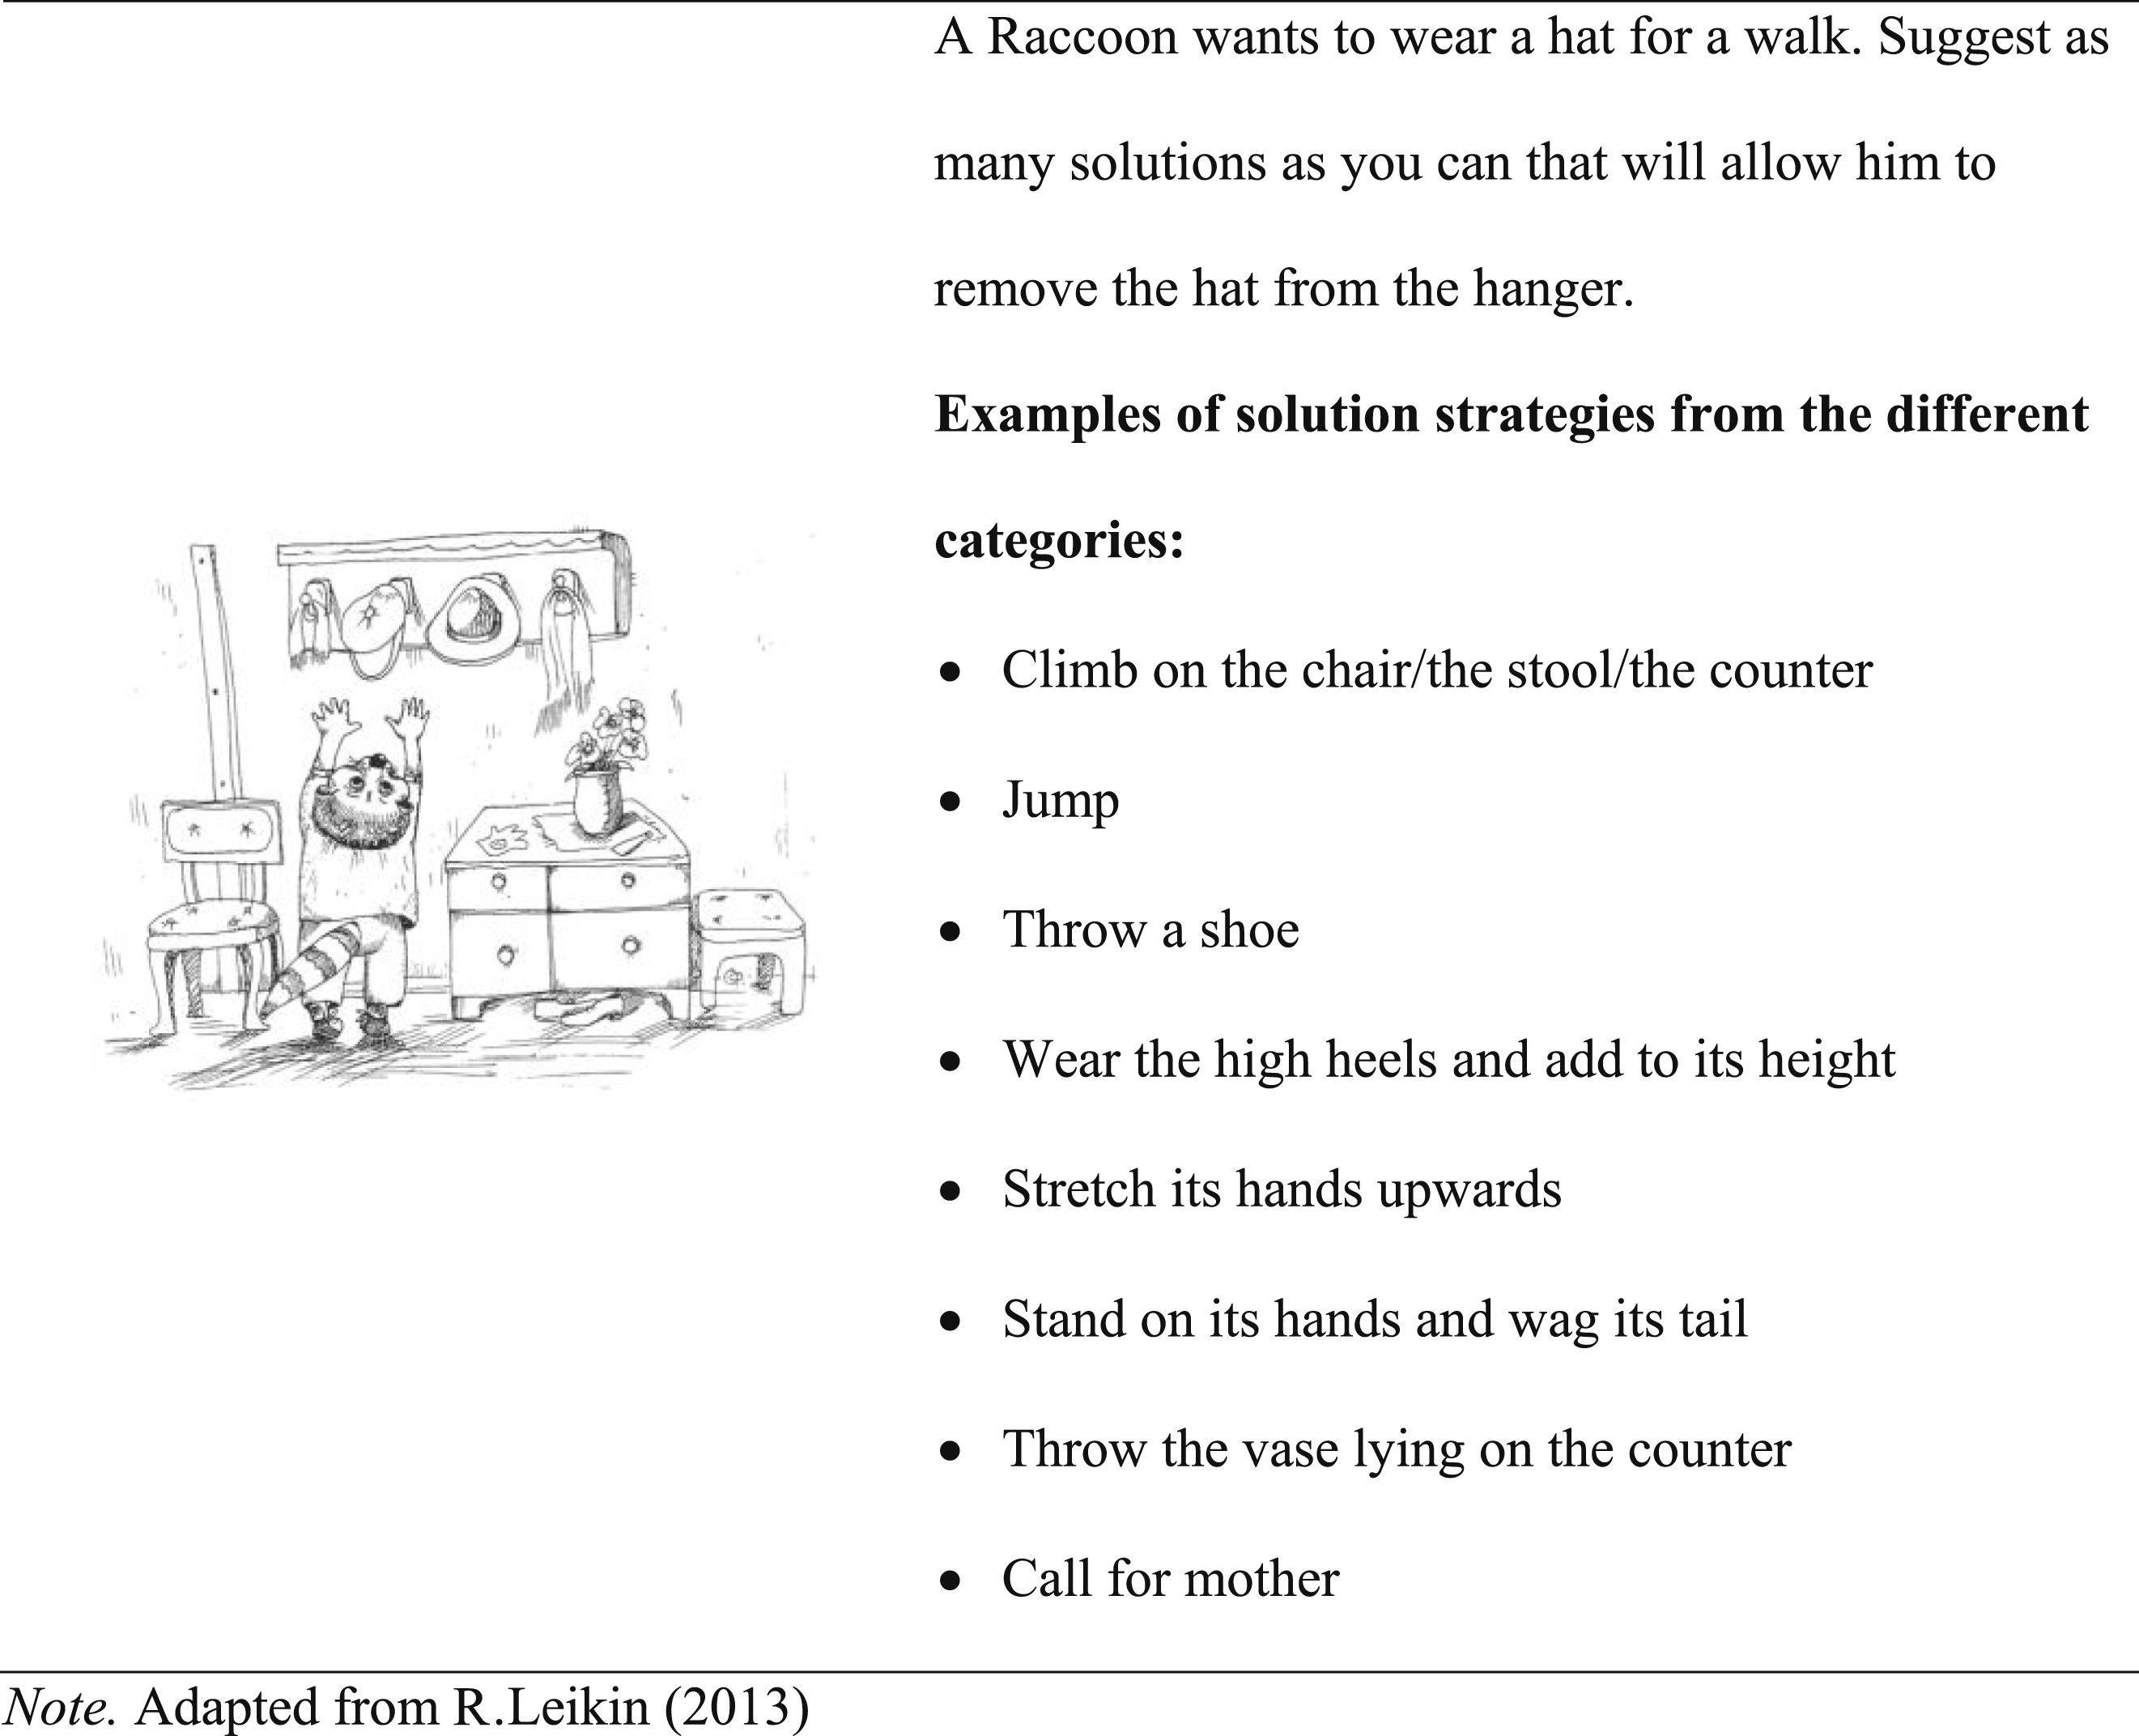
The Mathematical MST Test was used to assess students’ mathematical creativity (Leikin, 2009b, 2013; see Figure 2). The test included four problems: an arithmetic calculation, a system of equations, a word problem, and a geometry problem. These problems, seemingly simple for high-achieving mathematics students, were made challenging by requiring participants to create as many different solution strategies as possible. Students were given 40 minutes to complete all four problems. The tasks were adapted from R. Leikin (2013) and Leikin and Guberman (2023). Mathematical Problems for the Evaluation of Mathematical Creativity.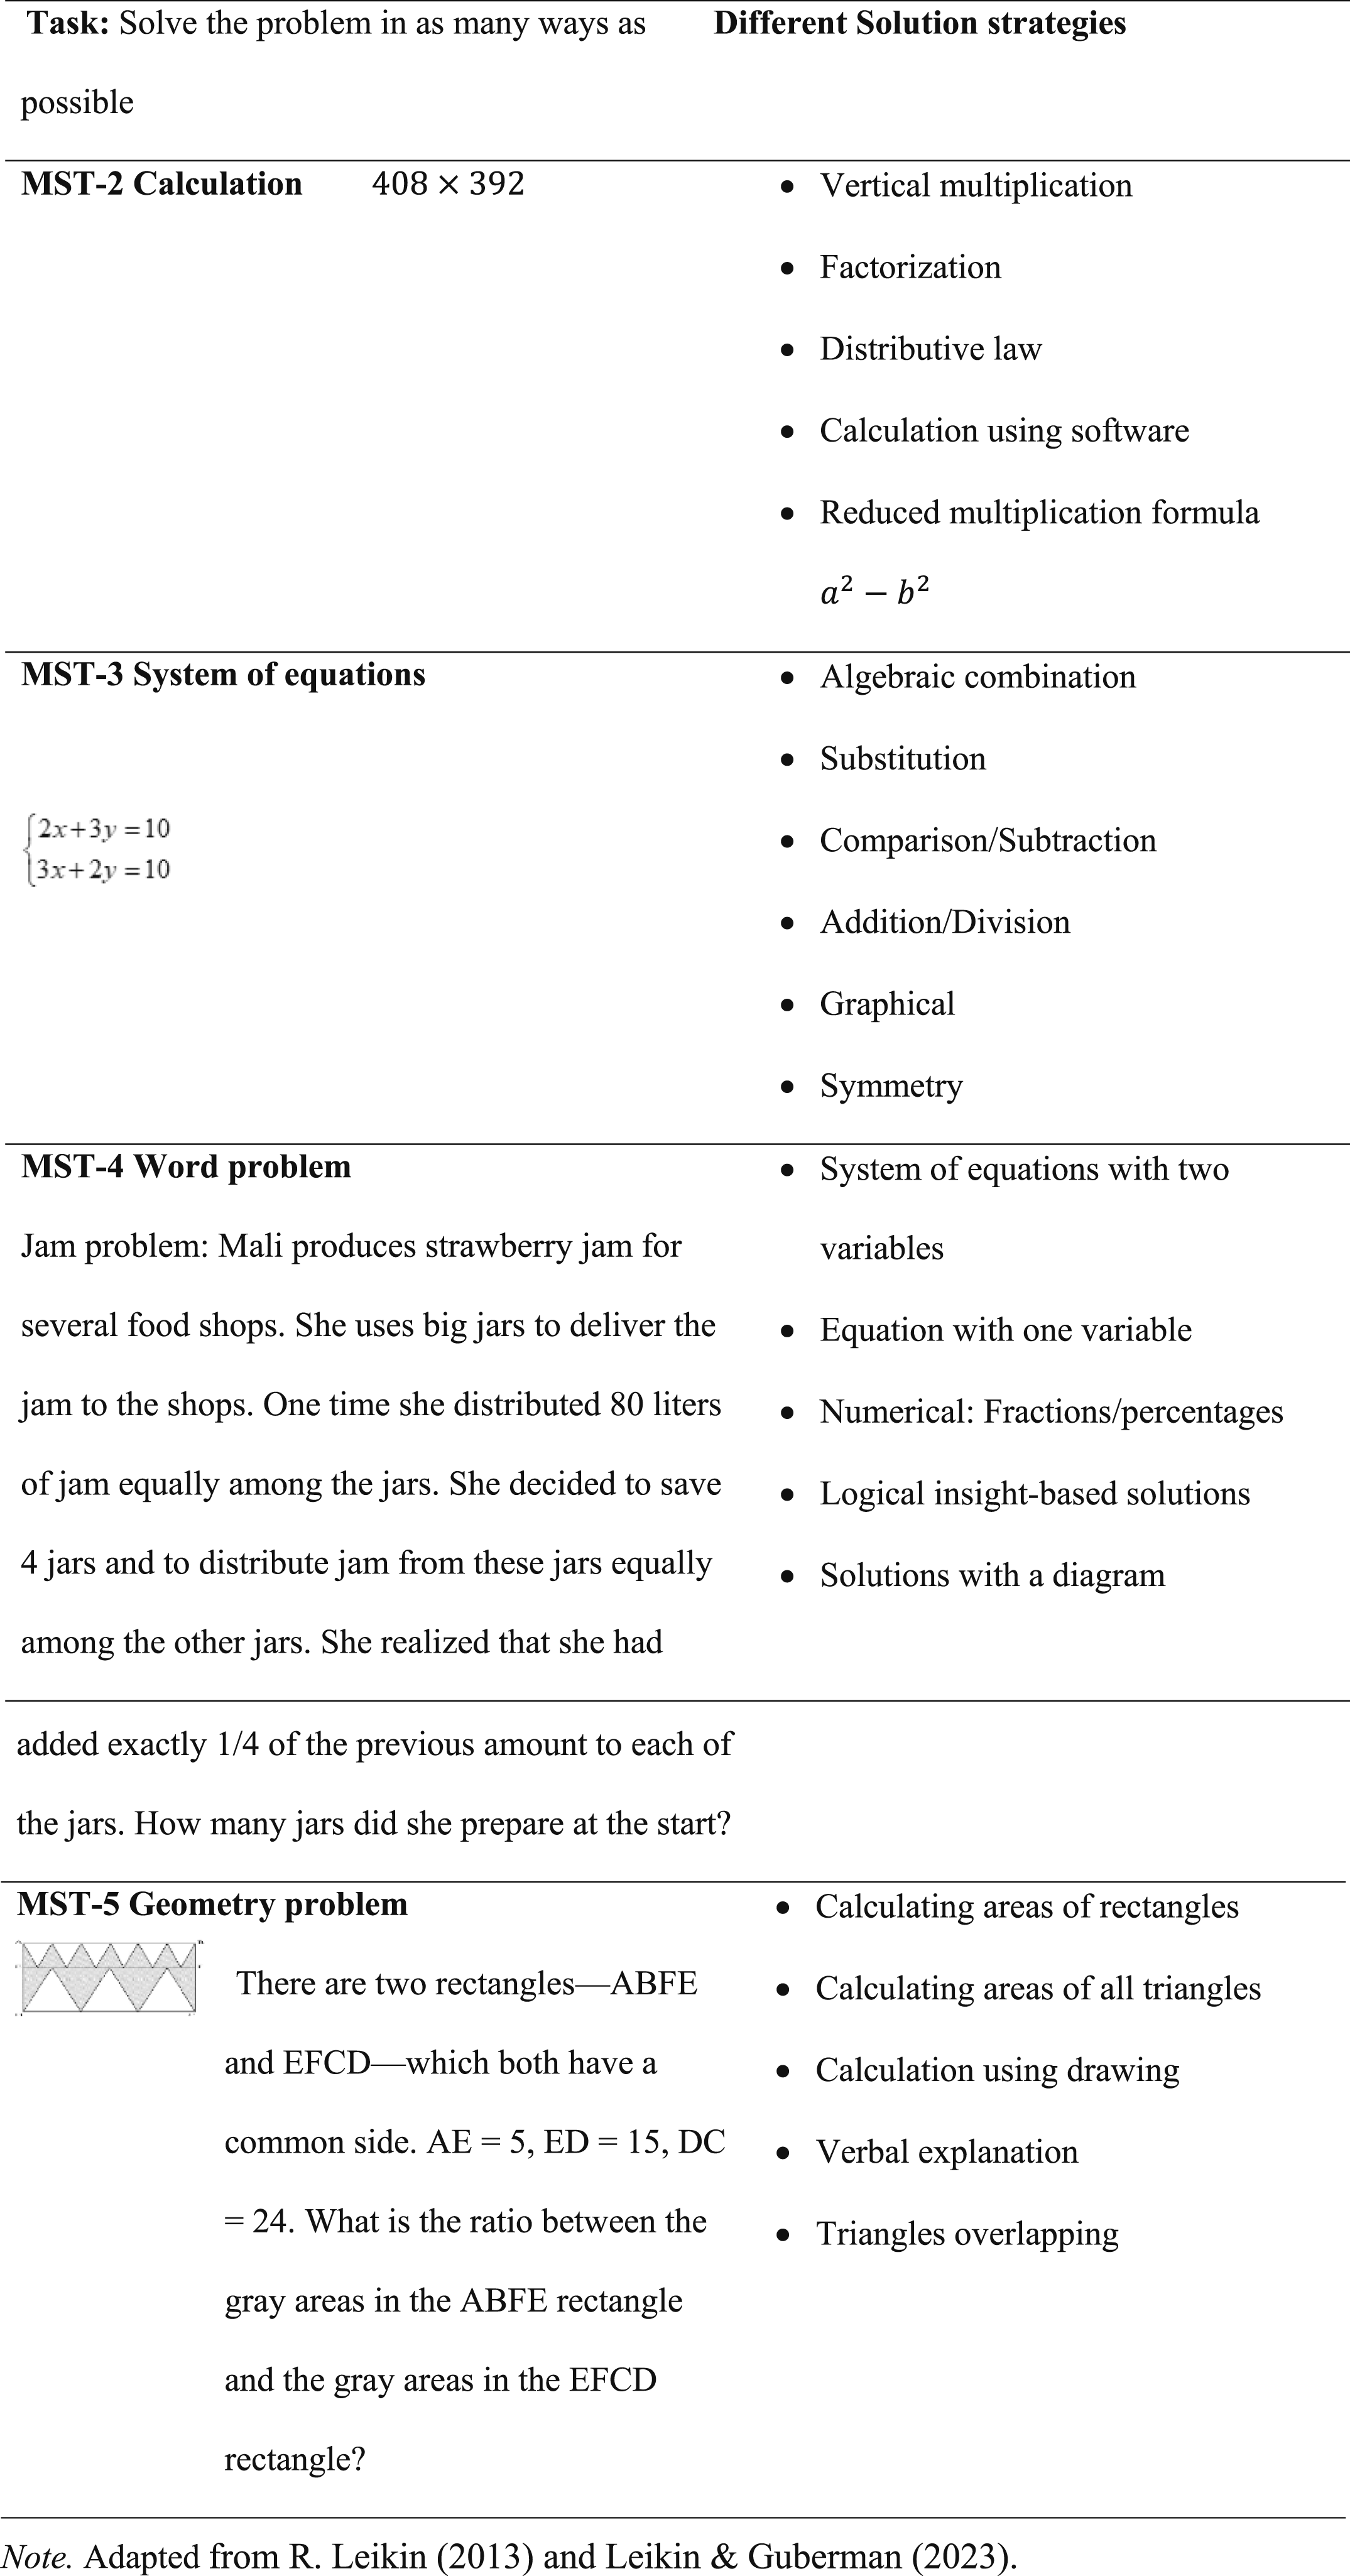
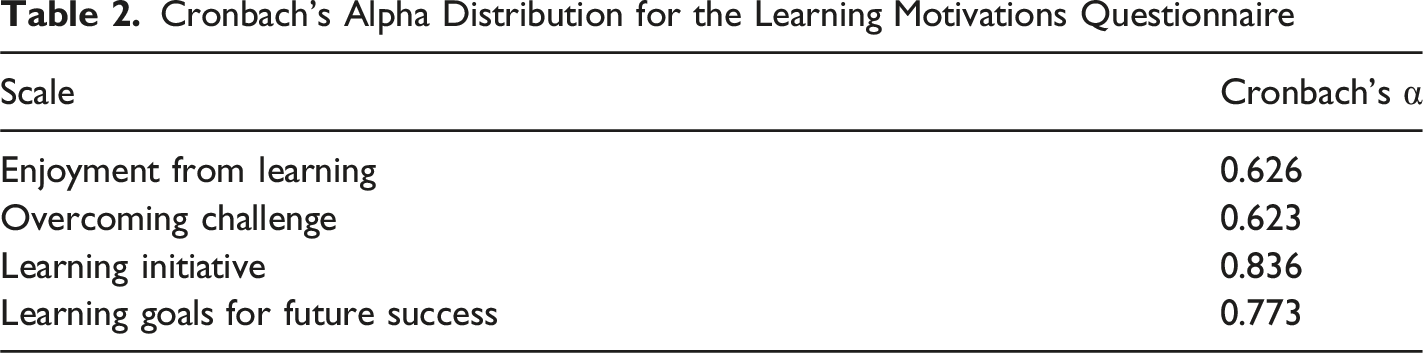
Cronbach’s Alpha Distribution for the Learning Motivations Questionnaire
Data Analysis
A cluster analysis was conducted to identify common participant profiles based on general giftedness and mathematical competencies. The cluster analysis was performed using z-scores from the SAT-M and RPMT. Silhouette values, which range from −1 to +1, were used to evaluate cluster quality. Higher values indicate stronger cohesion within clusters and weaker similarity to neighboring clusters. A silhouette score of 0.5 is generally considered indicative of fair cohesion and separation. Predictor importance was also assessed, standardized on a scale from 0 to 1, with the most influential predictor set to 1. Both variables were found to be predictors, with the SAT-M contributing the most significantly to cluster formation.
A multivariate analysis of variance (MANOVA) was conducted to examine between-group differences in creativity components for each of the MSTs. Post-hoc pairwise comparisons were performed using Bonferroni adjustment. Only statistically significant findings are reported. Additionally, Pearson correlation coefficients were calculated to explore the relationships between the clustering criteria and creativity levels exhibited by students in the different clusters.
Findings
Four Clusters of Participants
Descriptive Statistics for the Four Clusters of Participants
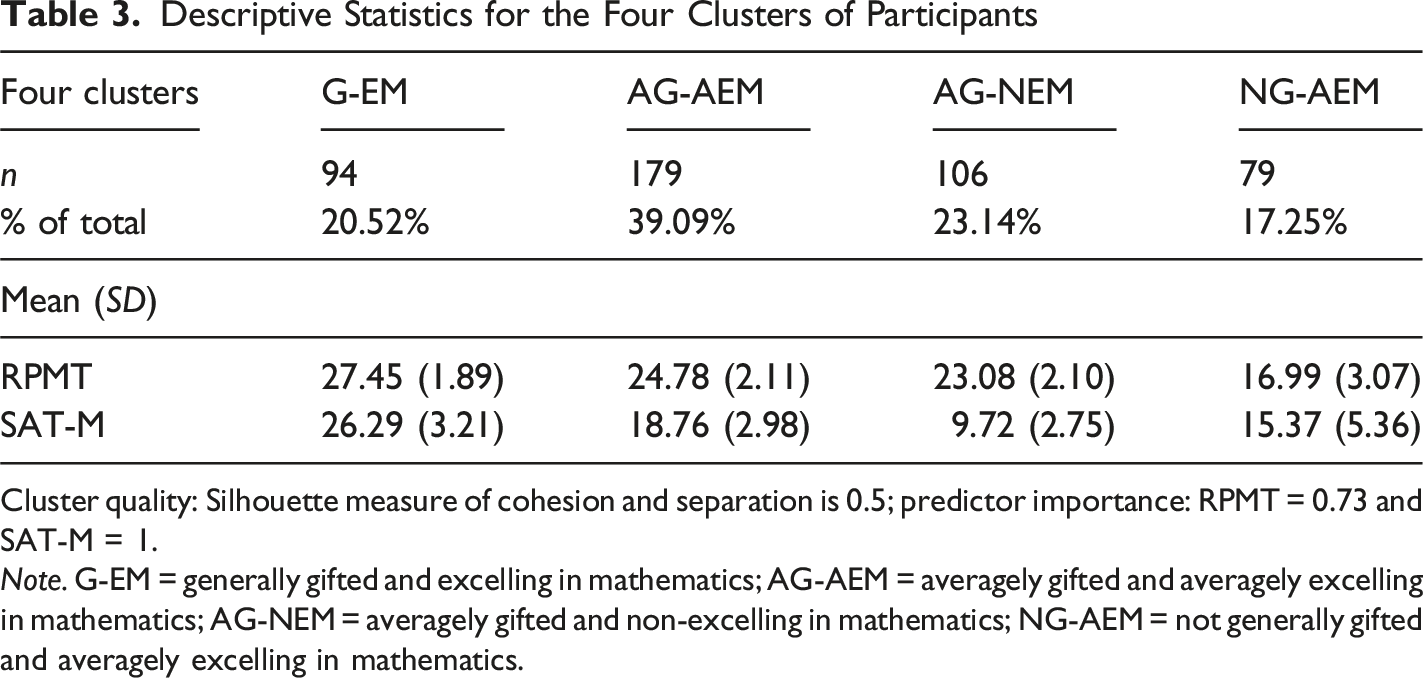
Cluster quality: Silhouette measure of cohesion and separation is 0.5; predictor importance: RPMT = 0.73 and SAT-M = 1.
Note. G-EM = generally gifted and excelling in mathematics; AG-AEM = averagely gifted and averagely excelling in mathematics; AG-NEM = averagely gifted and non-excelling in mathematics; NG-AEM = not generally gifted and averagely excelling in mathematics.
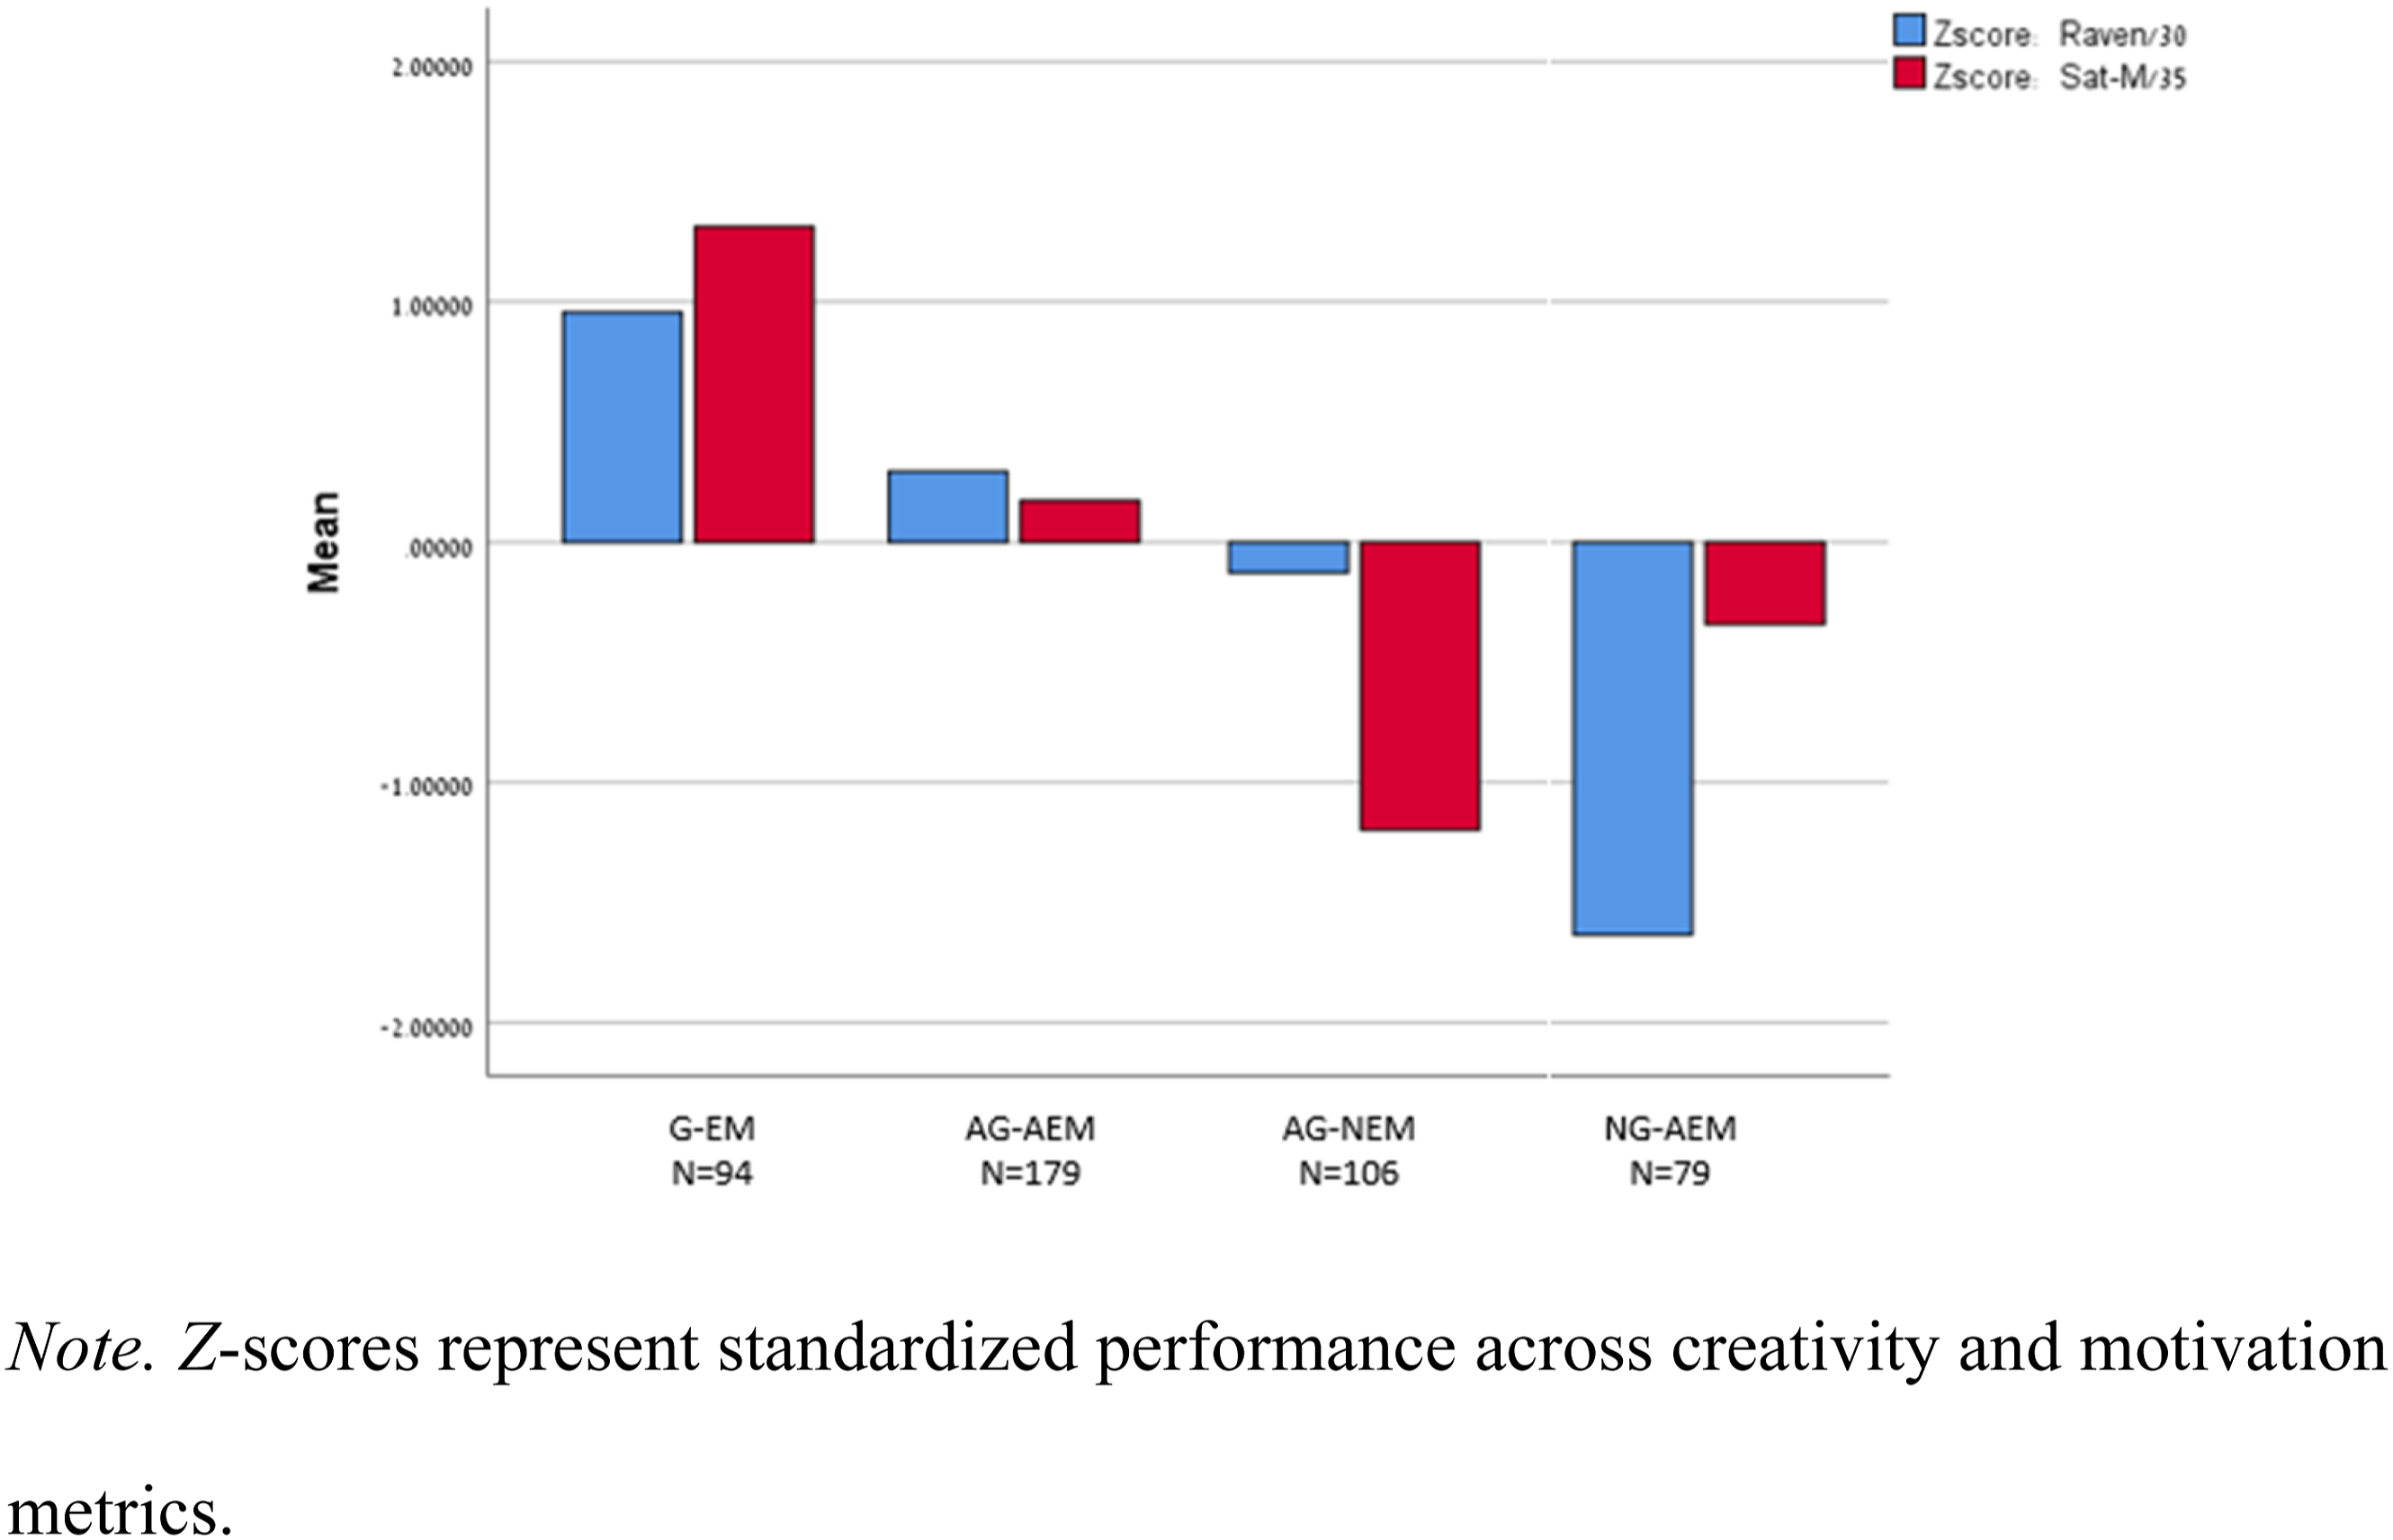
Z-Scores in the Four Clusters of Participants
A cluster analysis of 458 participants, based on their SAT-M and RPMT scores, identified four distinct groups (see Figure 3 and Table 3): • The G-EM group included students who were generally gifted and excelled in mathematics, as reflected in their high RPMT and SAT-M scores. A total of 94 participants (20.52%) were classified into this group. • The AG-AEM group included students who were averagely gifted and averagely excelling in mathematics, with mid-level scores on both the RPMT and SAT-M. A total of 179 participants (39.09%) were classified into this group. • The AG-NEM group consisted of averagely gifted non-excelling in mathematics students who attained mid-level RPTM scores and low SAT-M scores (despite excelling in high school mathematics). A total of 106 participants (23.14%) were classified into this group. • The NG-AEM group included students who exhibited low RPMT scores and mid-level AST-M scores and thus were identified as averagely excelling in mathematics but not being generally gifted. A total of 79 participants (17.25%) were classified into this group.
Because all applicants to the Challenge Program had excelled in high school mathematics, the cluster analysis did not generate a not generally gifted and not excelling in mathematics (NG-NEM) profile. Interestingly, the analysis did not identify an averagely gifted and excelling in mathematics (AG-EM) cluster. We assume that the general intelligence (G) factor plays a significant role in the self-esteem of excelling mathematically (EM) students, which may have discouraged AG-EM students from applying to the program. Because the participants come from a wide variety of high schools with diverse requirements and teaching levels, the group was quite heterogeneous, and thus, the AG-AEM group included the largest amount of students (39.09%).
Motivation of the Participants in the Four Clusters
Means and Standard Deviations of the Motivation Scales in the Four Clusters of Participants
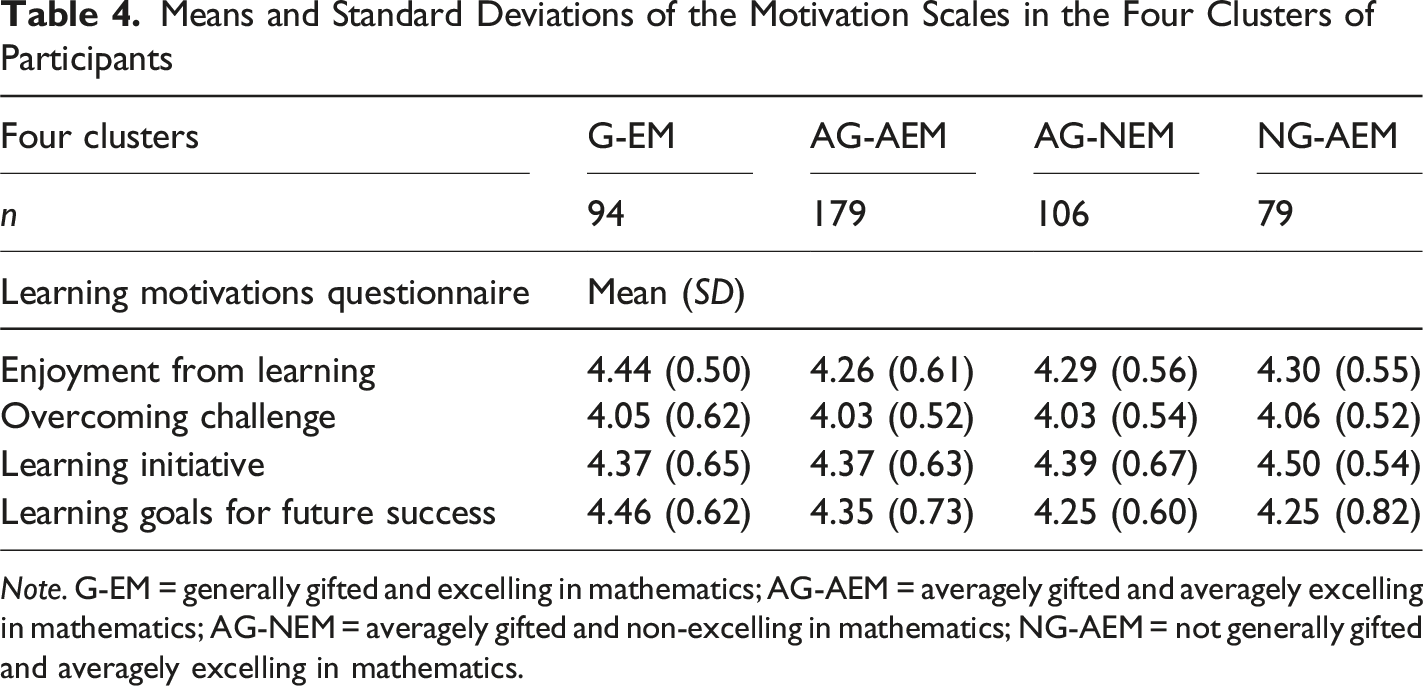
Note. G-EM = generally gifted and excelling in mathematics; AG-AEM = averagely gifted and averagely excelling in mathematics; AG-NEM = averagely gifted and non-excelling in mathematics; NG-AEM = not generally gifted and averagely excelling in mathematics.
Creativity of the Participants in the Four Clusters
Means and Standard Deviations of the Creativity Components in the Four Clusters of Participants
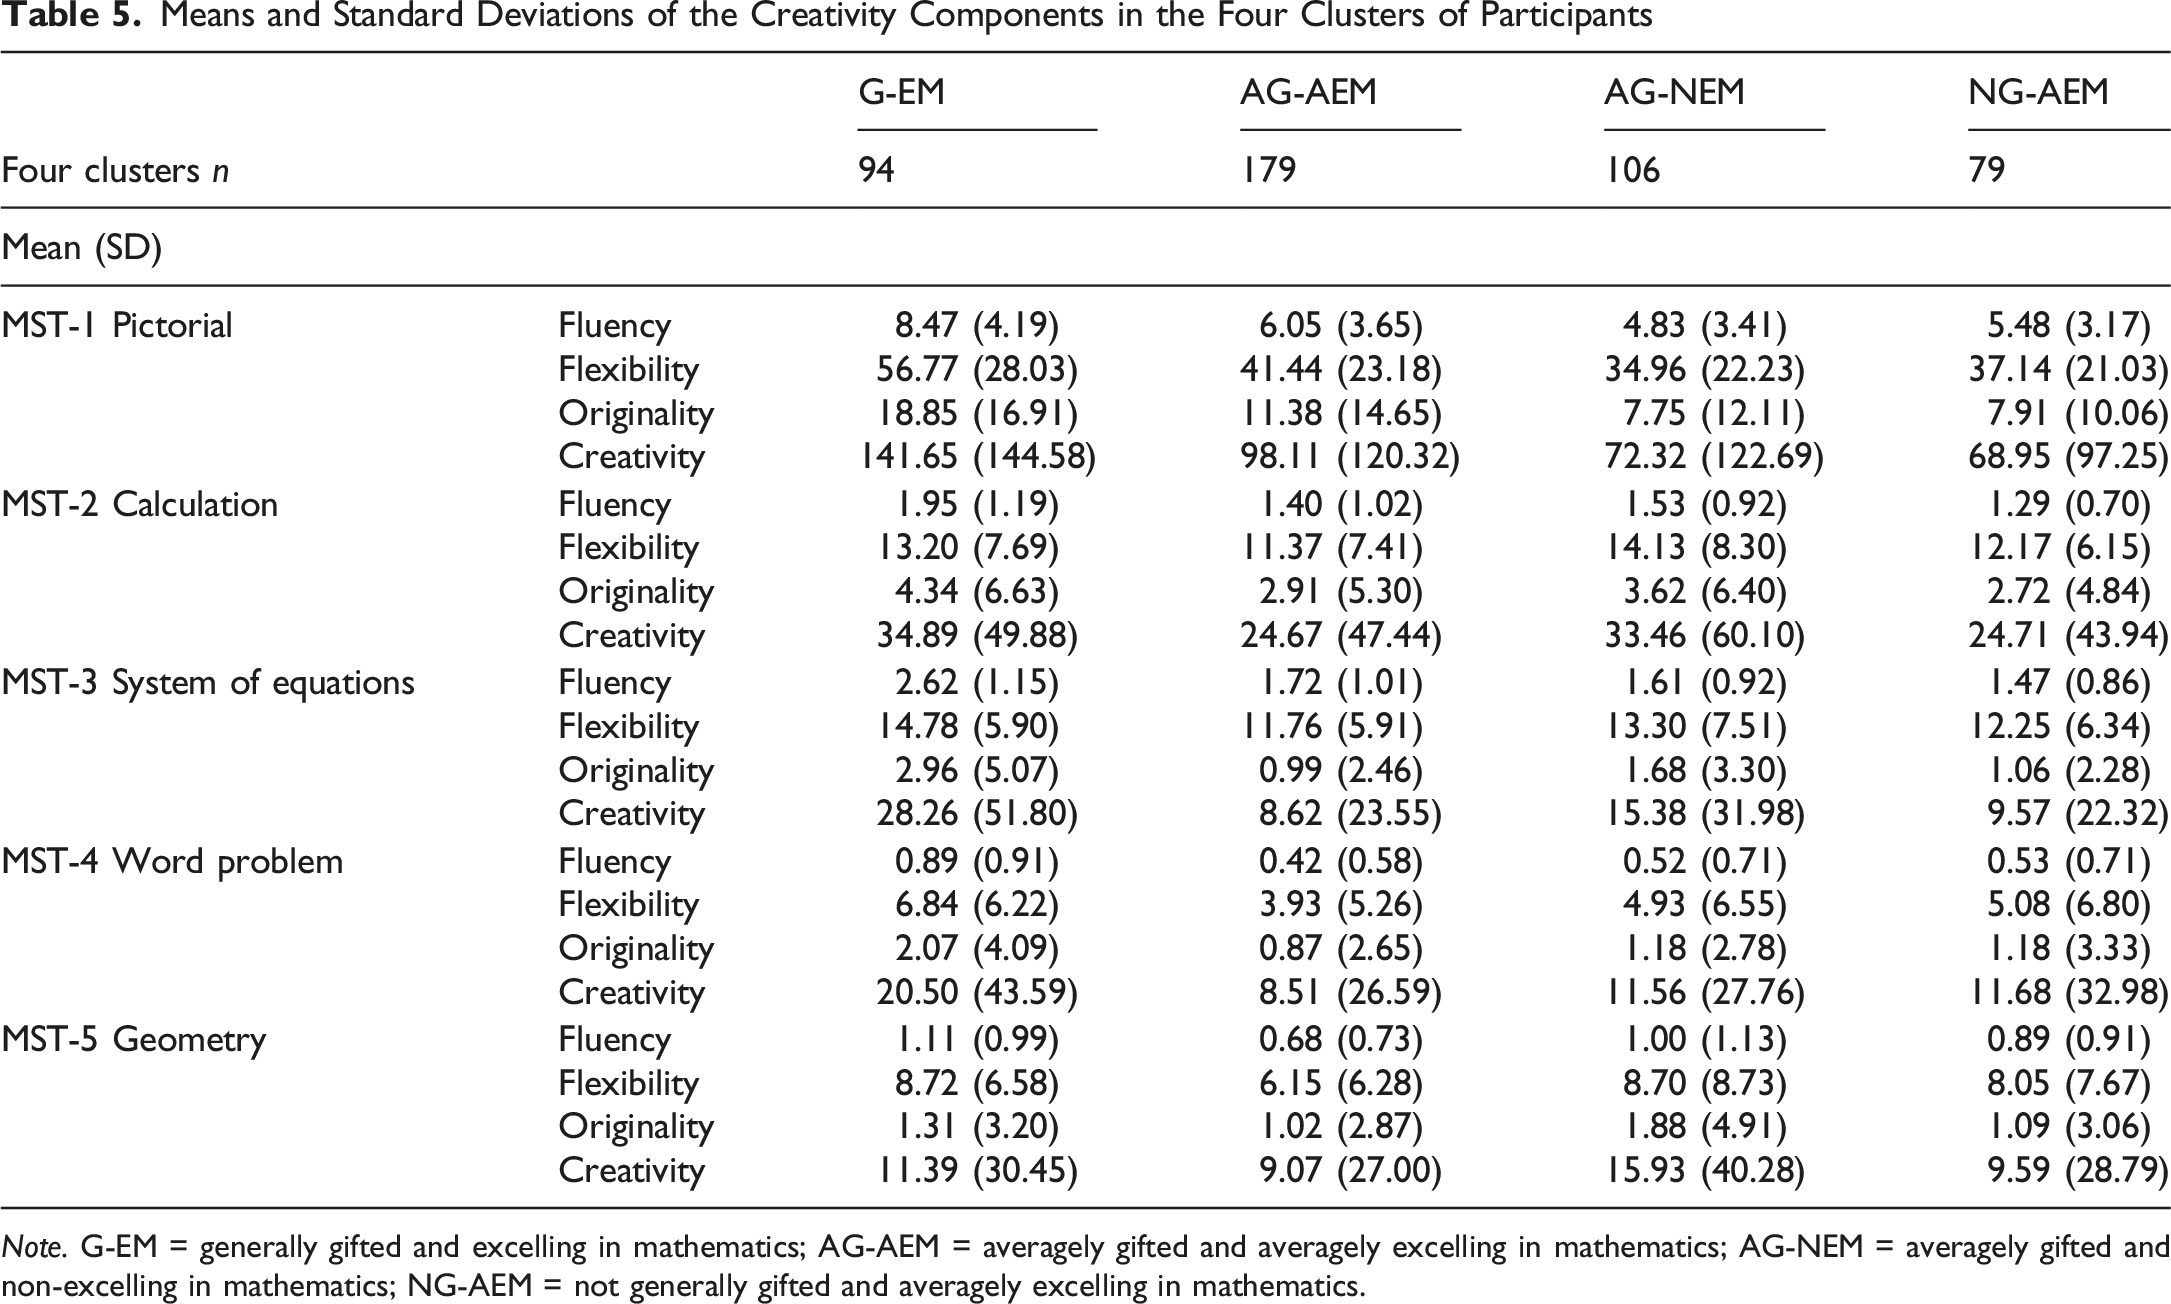
Note. G-EM = generally gifted and excelling in mathematics; AG-AEM = averagely gifted and averagely excelling in mathematics; AG-NEM = averagely gifted and non-excelling in mathematics; NG-AEM = not generally gifted and averagely excelling in mathematics.
Between-Group Differences in Creativity Components in the Four Clusters of Participants
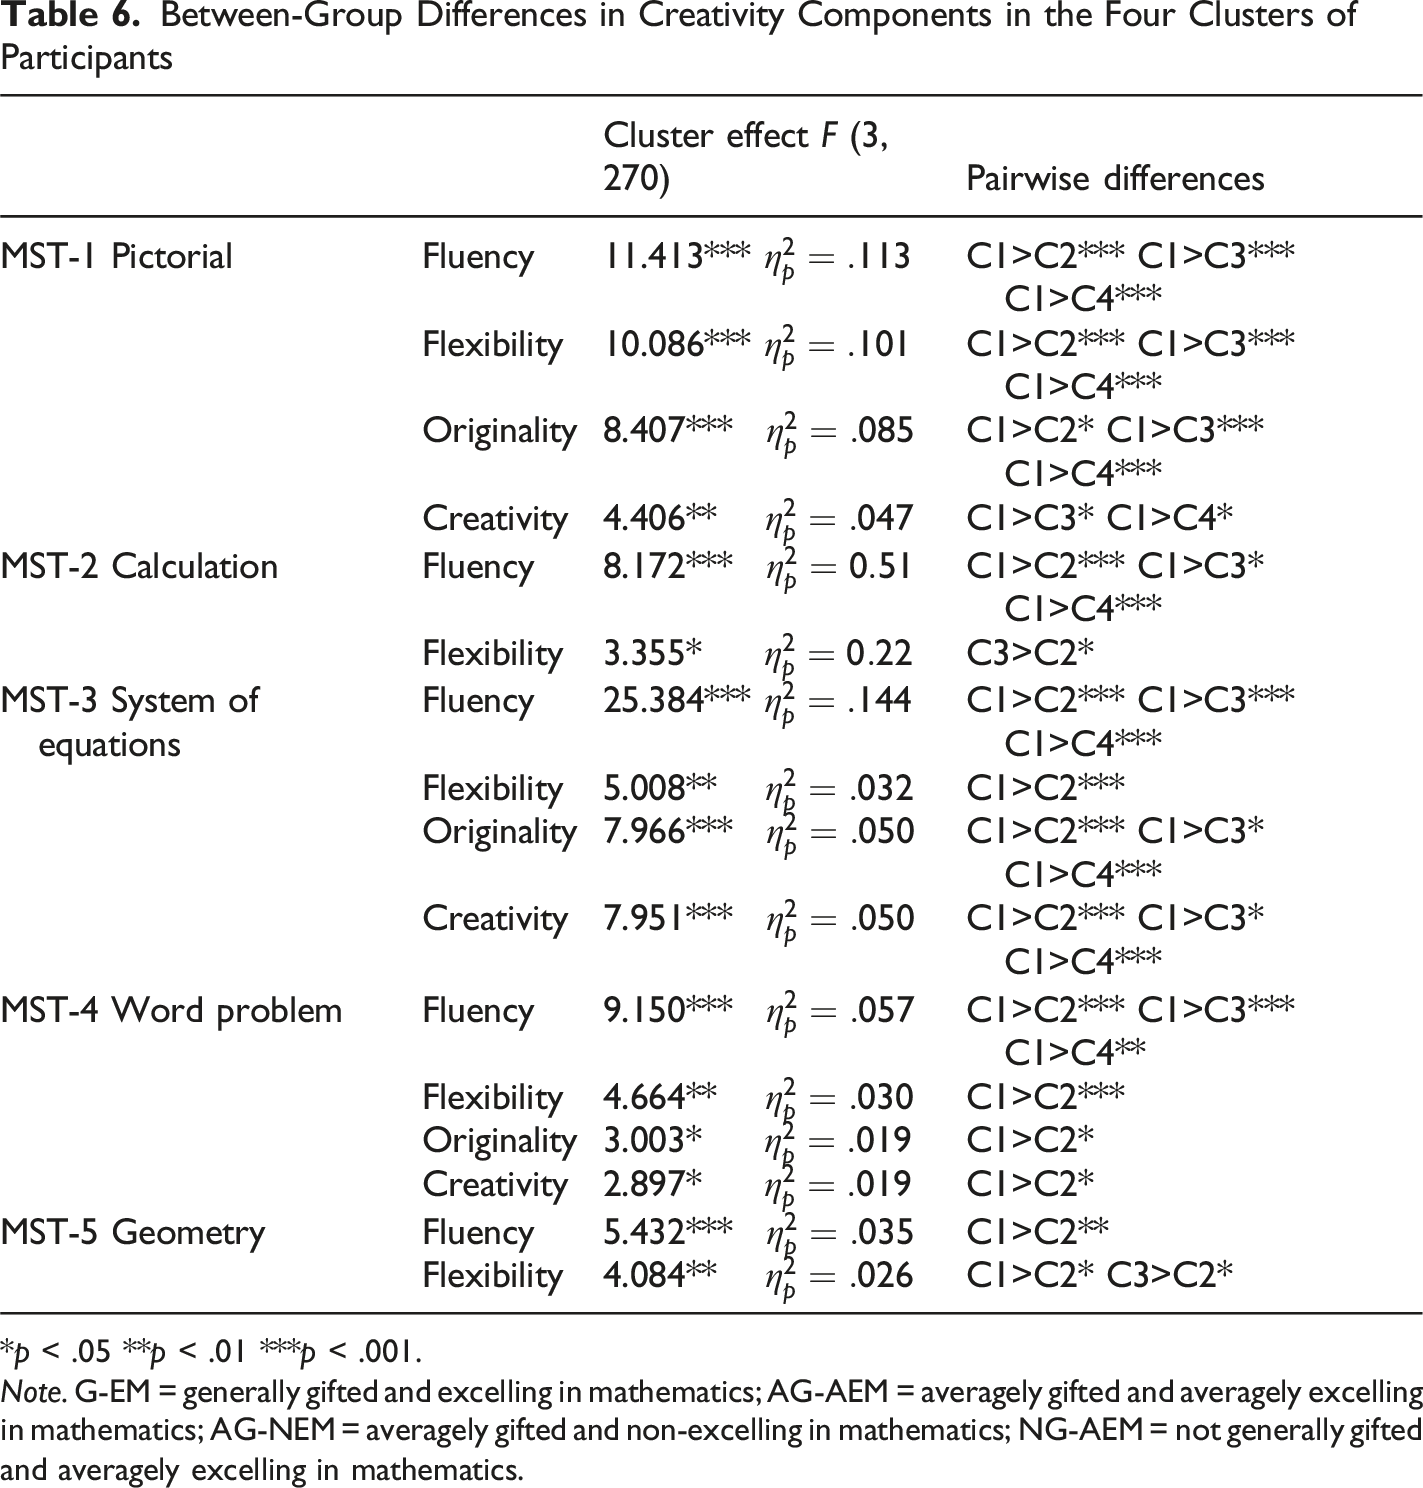
*p < .05 **p < .01 ***p < .001.
Note. G-EM = generally gifted and excelling in mathematics; AG-AEM = averagely gifted and averagely excelling in mathematics; AG-NEM = averagely gifted and non-excelling in mathematics; NG-AEM = not generally gifted and averagely excelling in mathematics.
MST-2, a calculation-based problem drawn from the elementary school curriculum, required basic formal mathematical knowledge. In this task, the G-EM group outperformed all other groups significantly, but only in the fluency component. Surprisingly, no significant differences were observed between the G-EM group and other groups in the remaining creativity components for this problem. In the word problem (MST-4), G-EM participants differed significantly in the fluency component compared to all other groups. However, for the remaining three creativity components, the G-EM participants scored significantly higher only in comparison to the AG-AEM group. Interestingly, the students in the AG-NEM group demonstrated higher mathematical flexibility than those in the NG-AEM group when solving calculation and geometry problems. This finding suggests that general intelligence may play a more significant role than mathematical competencies in supporting flexibility when solving relatively simple mathematical problems.
In MST-5, significant between-group differences were found only in fluency and flexibility, indicating that geometry problems are generally more challenging for high school students. Additionally, given that the participants in this study are oriented toward computer science, they may prefer word problems and calculation-based problems.
Correlations in the Four Clusters
Pearson correlation coefficients were calculated for each participant group to examine the relationships between the clustering criteria and the creativity components across the five MST tasks. Table 5 presents the creativity components for which significant correlations were identified.
Significant Correlations Between Creativity Components and Clustering Criteria
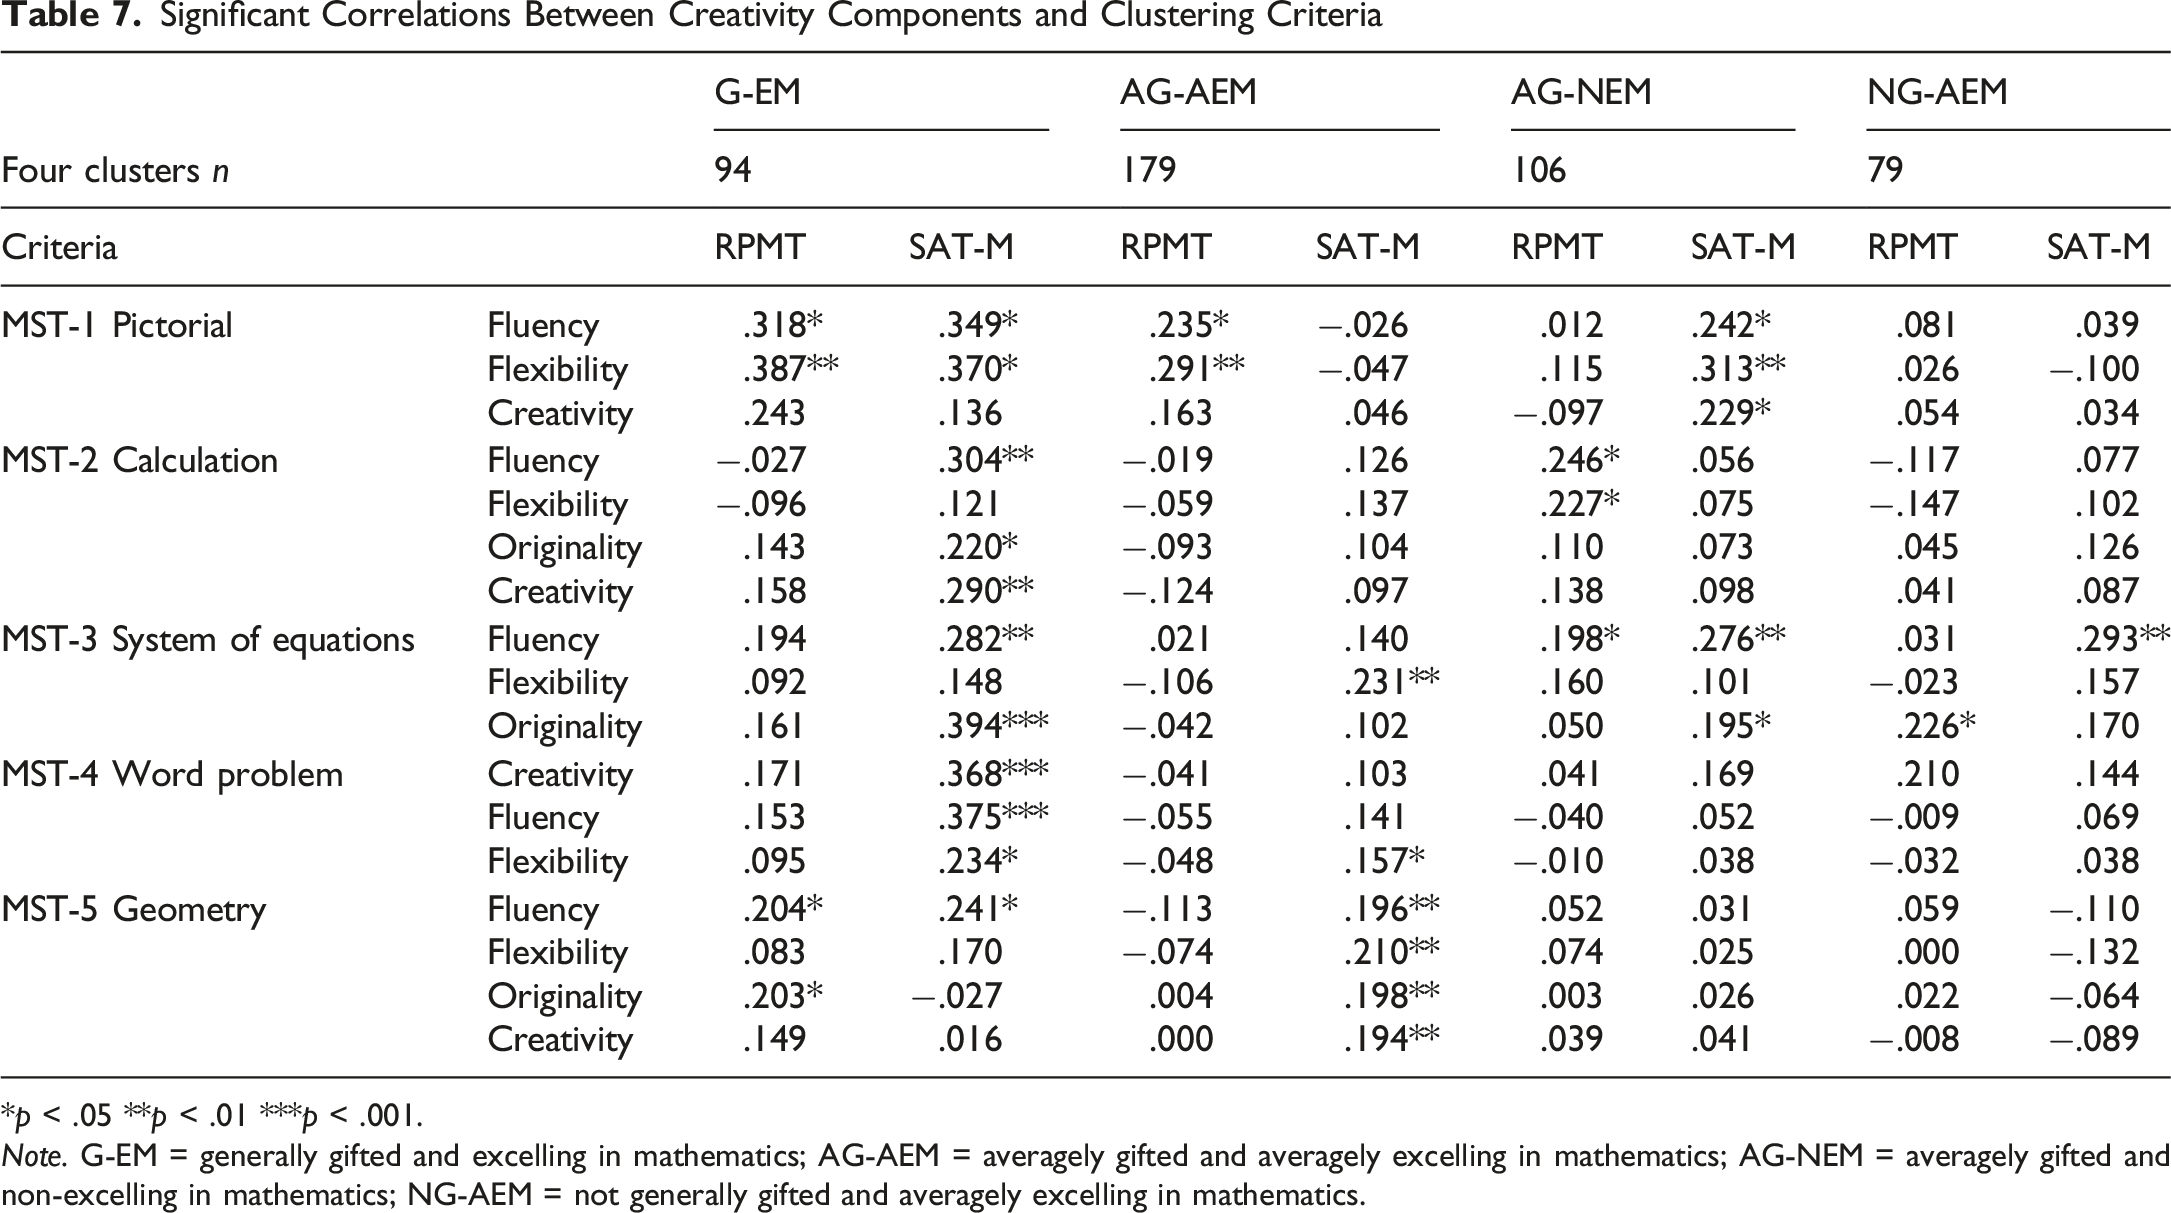
*p < .05 **p < .01 ***p < .001.
Note. G-EM = generally gifted and excelling in mathematics; AG-AEM = averagely gifted and averagely excelling in mathematics; AG-NEM = averagely gifted and non-excelling in mathematics; NG-AEM = not generally gifted and averagely excelling in mathematics.
Summary and Discussion
The goal of the study described in this paper was to examine characteristics of high-achieving high school students in mathematics who were motivated to participate in a BSc in computer science program. Specifically, the students’ general and mathematical creativity, mathematical competencies, and general intelligence were examined. Students (N = 458) applied to the program and completed the program’s admission assessments, which included the RPMT, which was used for examining general giftedness; the SAT-M, which was used to evaluate mathematical competencies; and MSTs, which were used to assess both general and mathematical creativity (Leikin, 2009b, R. Leikin, 2013). Cluster analysis was conducted using participants’ RPMT and SAT-M scores, resulting in the identification of four distinct groups based on different combinations of general giftedness (G-factor) and mathematical competence (EM-factor; e.g., Leikin et al., 2014, 2017).
To the best of our knowledge, this study is the first to apply this type of cluster analysis among students pursing computer science degrees. The findings revealed that students of varying levels of abilities, both in general and in mathematics, exhibited similarly high levels of motivation to enroll in a STEM acceleration program. However, despite comparable motivational levels, these students differed in both general and mathematical creativity. The four groups that were identified using clustering procedure were: (a) G-EM group, which included generally gifted (high RPTM scores) and excelling in mathematics (high SAT-M scores) students; (b) AG-AEM group, which included students who were averagely gifted (with mid-level RPTM scores) and averagely excelling in mathematics (with mid-level SAT-M scores); (c) AG-NEM group, which consisted of averagely gifted non-excelling in mathematics students who attained mid-level RPTM scores and low SAT-M scores (despite their excellence in school mathematics); and (d) NG-AEM group, which included nongifted students averagely excelling in mathematics (i.e., students who attained low RPTM scores and mid-level SAT-M scores).
Students who applied to the Challenge Program demonstrated high levels of motivation and self-confidence in their ability to succeed in computer science studies while continuing their high school education. No significant differences in motivation levels were found among the four participant groups. These consistently high levels of motivation align with previous research indicating a strong association between motivational beliefs and active participation in academic challenging STEM programs.
Participants’ creativity was assessed using five different creativity problems. Overall, students in the G-EM group outperformed all other groups, demonstrating significantly higher levels of creativity when solving both general and mathematical problems. In most cases, the differences between the groups were significantly greater in favor of the G-EM group. In the case of MST-1 and MST-3, students from the G-EM group scored higher across all creativity components, with all between-group differences reaching statistical significance. Interestingly, students from the AG-NEM group, although not identified as gifted, demonstrated significantly higher levels of flexibility in the calculation problem (MST-2) than other groups. In the word problem (MST-4) the G-EM group showed higher scores in all creativity components except fluency, but these differences were only significant when compared to the AG-AEM group. In the geometry problem (MST-5), significant differences between groups were found only in fluency and flexibility. In both cases, the G-EM group outperformed the AG-AEM group. Surprisingly, in terms of flexibility, the AG-NEM group also performed better than the AG-AEM group, suggesting that factors beyond general giftedness may influence creative performance in certain types of mathematical tasks.
Furthermore, the G-EM group exhibited the highest number of significant correlations between creativity components and both clustering criteria: RPMT and SAT-M. The strongest associations with RPMT were observed in MST-1, with a smaller number of significant correlations also found with SAT-M in this problem. In contrast, MST-3 revealed the highest number of correlations with SAT-M. Overall, more significant correlations were found with SAT-M than with RPMT, which was expected given that all problems, apart from MST-1, are mathematical in nature. Notably, with MST-4, no significant correlation was found with RPMT, an unexpected finding considering that word problems often require reading comprehension in addition to mathematical reasoning. In general, RPMT was linked to levels of general creativity among students in the two higher performing groups (G-EM and AG-AEM) and showed no significant relationship to either mathematical or general creativity among students in the two lower performing groups (AG-NEM and NG-AEM). These findings suggest that the relationship between cognitive ability and creativity is both cluster-dependent and task-dependent.
Based on the results of our study, we argue that effectively teaching diverse groups of students requires integration of varied task types tailored to their cognitive profiles. The results clearly demonstrate that the development of mathematical creativity is essential for success in STEM studies. Although prior research has consistently highlighted the relationship between mathematical creativity and mathematical ability, our findings suggest that general creativity is equally important. Therefore, incorporating activities that foster general creativity is just as critical as those that develop mathematical skills in preparing students for success in STEM education.
Our findings align with previous research demonstrating a positive relationship between intelligence and creativity (Cramond et al., 2010). Although most prior studies that examined relationships between creativity and STEM programs focused on how such programs cultivate creativity, the present study took a different approach. The current study sought to characterize students who are highly motivated to enroll in a STEM acceleration program by examining their general and mathematical creativity profiles.
The findings of this study demonstrate that students with high levels of both general giftedness and mathematical competencies perform better than all other groups in creativity tests, exhibiting higher levels of creativity. This finding is consistent with previous studies (e.g., Leikin et al., 2014, 2017). Prior research focusing on the cognitive characteristics of generally gifted (G) students has shown that they consistently outperform their nongifted (NG) peers in applying diverse problem-solving strategies (Steiner & Carr, 2003). In this study, we obtained unanticipated findings for the AG-NEM group, which demonstrated a significantly higher level of flexibility in two mathematical problems, suggesting that, to some extent, giftedness compensates for a lower level of mathematical competence. We agree with Leikin et al. (2017), who argued that the combination of G and EM is a necessary condition for success in solving insight-based mathematical problems. This combination of abilities has been linked to neural efficiency in learning-based problem-solving tasks (Waisman et al., 2016).
Based on the findings from this study, we suggest that both general and mathematical creativity can serve as criteria for students’ enrollment in STEM programs. Fostering creativity in school settings may increase students’ likelihood of both enrolling in and succeeding within such programs. To better identify students most suited for accelerated STEM tracks, we recommend incorporating MSTs into the admissions process. This study represents the initial stage of a longitudinal investigation that follows students from their application to the computer science acceleration program through graduation. The goal of the follow-up study is to identify the components of STEM-related intellectual potential that most accurately predict long-term success in the program.
Footnotes
Acknowledgments
This study was made possible through the support of a grant by the Israel Science Foundation grant 1475/18, Grant No. 2018141 from the United States-Israel Binational Science Foundation (BSF) and the Aaron Gutwirth Foundation. This publication reflects only the views of its author(s) and not necessarily those of the Foundations. Our sincere thanks go to the University of Haifa for its generous support of this study.
Funding
The author(s) disclosed receipt of the following financial support for the research, authorship, and/or publication of this article: This study was made possible through the support of a grant by the Israel Science Foundation grant 1475/18, Grant No. 2018141 from the United States-Israel Binational Science Foundation (BSF) and the Aaron Gutwirth Foundation.
Declaration of Conflicting Interests
The author(s) declared no potential conflicts of interest with respect to the research, authorship, and/or publication of this article.