
Abstract
Thyroid cancer is one of the common types of cancer worldwide, and Ultrasound (US) imaging is a modality normally used for thyroid cancer diagnostics. The American College of Radiology Thyroid Imaging Reporting and Data System (ACR TIRADS) has been widely adopted to identify and classify US image characteristics for thyroid nodules. This paper presents novel methods for detecting the characteristic descriptors derived from TIRADS. Our methods return descriptions of the nodule margin irregularity, margin smoothness, calcification as well as shape and echogenicity using conventional computer vision and deep learning techniques. We evaluate our methods using datasets of 471 US images of thyroid nodules acquired from US machines of different makes and labeled by multiple radiologists. The proposed methods achieved overall accuracies of 88.00%, 93.18%, and 89.13% in classifying nodule calcification, margin irregularity, and margin smoothness respectively. Further tests with limited data also show a promising overall accuracy of 90.60% for echogenicity and 100.00% for nodule shape. This study provides an automated annotation of thyroid nodule characteristics from 2D ultrasound images. The experimental results showed promising performance of our methods for thyroid nodule analysis. The automatic detection of correct characteristics not only offers supporting evidence for diagnosis, but also generates patient reports rapidly, thereby decreasing the workload of radiologists and enhancing productivity.
Keywords
Introduction
Thyroid cancer is one of the most lethal cancers globally. 1 The incidence rate in women is three times higher than that in men; in 2018 alone, one in 20 women diagnosed of cancer had thyroid cancer. 1 Different imagery systems have been used for diagnosis. US imaging has the advantages of being non-invasive, non-radiative and of low-cost. However, recognizing thyroid nodule and detecting cancer characteristics from US images are challenging due to the demanding skills required in image acquisition and low image quality caused by speckle noise and artifacts. To tackle the issues and maintain consistency in clinical settings, doctors often use standard guidelines in describing thyroid nodules. The original TIRADS principles were first proposed in Horvat et al. 2 It was later standardized by Kwak et al. 3 as the first reporting scheme for classifying thyroid nodules to risk levels of malignancy using US nodule characteristic descriptors. The most recent ACR TIRADS further standardizes the descriptors to five categories. 4 Although radiologists have been using the guidelines to report thyroid nodules under different conditions, accurate diagnosis based on TIRADS remains challenging because of inter- and intra-observer variabilities.
Several studies have been conducted to analyze US image characteristics of thyroid nodules, but most of them extracted such characteristics for classifying a nodule as benign or malignant rather than accurately detecting and evaluating the characteristics for report generation.5–7 In this paper, we present a comprehensive translation of the US TIRADS characteristics, aiming at an automated process of describing clinical findings in thyroid nodules. The proposed methods provide an effective, efficient, deterministic, and consistent annotation of the TIRADS terms to reduce subjectivity and increase precision in nodule examination and reporting. In particular, the paper is intended to make the following key contributions: (1) a new method for nodule irregularity detection by utilizing convexity, ellipticity, lobulation, and angulation features; (2) a new method for smoothness detection using texture features and super-pixels; (3) an optimized CNN classification model (CaNet) for calcification by using Bayesian Optimization; and (4) a new method that combines CaNet and super-pixels for more accurate calcification classification.
The remaining part of the paper is organized as follows. The paper first reports on the key TIRADS US characteristics and reviews existing methods for nodule characteristics analysis in US images. The paper then presents the proposed methods for detecting margin irregularity, margin smoothness and calcification. This is followed by an evaluation of the proposed methods through experiments on datasets collected from clinics. The paper further discusses possible ways of optimizing parameters of the proposed methods, conducts a brief ablation study on the extracted features for some of the methods and outlines ideas for nodule shapes and echogenicity before summarizing the main findings and concludes the paper.
Background and Related Work
The ACR TIRADS scheme characterizes a thyroid nodule from five aspects: composition, echogenicity, shape, margin, and echogenic foci. 4 Each aspect contains a set of descriptive terms with associated points. Based on the observation, the associated points are added to a total score and then mapped to one of five ordinal bands (from TR1 to TR5). A benign nodule within the TR2 category can exhibit a regular oval shape, an anteroposterior transverse ratio (AP/T ratio) that is wider than tall, a smooth margin, anechoic properties, and the absence of calcification. On the other hand, a malignant nodule falling under the TR5 category may show a lobulated shape with an irregular margin, an AP/T ratio that is taller than wide, hypo-echogenicity, and the presence of micro-calcification. The borderline TR4 band is further divided into 4a, 4b and 4c sub-bands. It is also the band where most inter-observer variability occurs, and hence there is a greater need for nodule characteristics for correct decisions. Besides the ACR TIRADS, other guidelines also exist,8–10 all of which indicate similar nodule characteristics of suspected malignancy. 11 Therefore, in practice, hospitals normally use common categories of thyroid nodule characteristics across the different guidelines. It must be said that a TIRADS score is still an observer’s subjective judgment and may lead to different diagnosis outcomes. Rigorous definitions of the terms and reviews of the guidelines may help reducing but not avoiding such variability. Having an automated computer-based solution to categorize the thyroid nodules may help reducing such non-deterministic outcomes. Using the detected characteristics as evidence will enhance comprehensibility of the final diagnostic decisions and gain trust from the medical profession.
Several studies to automatically quantify features based on the standardized TIRADS categories for classifying thyroid nodules have been reported,12,13 but the work on extracting correct TIRADS features from ultrasound images for annotation purposes remains limited. Zulfanahri et al. 5 analyzed and classified the margin irregularity of thyroid nodule into regular or irregular class using rectangularity, convexity, and tortuosity features with an SVM classifier. The study reported an accuracy of 91.52% (91.80% sensitivity and 91.35% specificity) over a set of 165 images. Wang et al. 12 automated the extraction of four thyroid nodule characteristics: composition using average image brightness, echogenicity pattern using relative brightness, calcification with top-hat morphological filter, and boundary regularity with acutance. The study used a semi-supervised fuzzy C-means ensemble (SS-FCME) model to classify the thyroid nodules into a TIRADS score band with 70.77% overall accuracy. Nugroho et al. 7 trained an SVM to determine the margin of a thyroid nodule using compactness, convexity, circularity, dispersion, aspect ratio, rectangularity, solidity and tortuosity as features, with an accuracy of 92.30% on 144 test images. In a later study, Nugroho et al. 6 further added the orientation feature and achieved an accuracy of 98.00% but only on 51 test images. Although the previous two studies reported promising performances, the features extracted can be too excessive for the problems. Zhuang et al. 14 used cystic growth rate and the variance of the grayscale distribution for composition, compactness for margin irregularity, and the aspect ratio for nodule shape. A deep learning algorithm was used to classify calcification based on Region of Interest (ROI) image, but the paper lacks detailed explanations. For margin smoothness, the method first locates a 10-pixel ribbon around the nodule boundary (inside and outside regions) via morphological dilation and erosion. Average grayscale difference (or mean separability), derived from the number of pixels, mean and variance of intensity in each region, was used to quantify margin smoothness. Weights were assigned to the derived quantities and feature scores that were then accumulated to the total TIRADS score. All malignant cases and 94.87% of the benign cases were classified into the correct TIRADS score bands.
Materials and Methods
Dataset Collection and Annotation for Nodule Characteristics Analysis
Thyroid cancer has various subtypes. Malignant tumors have more diversity in their cellular and molecular structures than benign tumors. Therefore, including a larger number of malignant cases in a dataset is important to ensure sufficient representation of the diverse subtypes for developing accurate models. Hence we purposely included more malignant cases of various pathologies in this study. During the image acquisition, one radiologist with more than 15 years of experience manually cropped every nodule in each original image by identifying coordinate points on the nodule boundary. The delaminated boundaries were further validated by the second radiologist with a similar amount of experience. Images with disagreed nodule boundaries were excluded from the final data collection. The verified nodule boundaries form polygons for the ROI. Figure 1 shows two examples from the dataset.
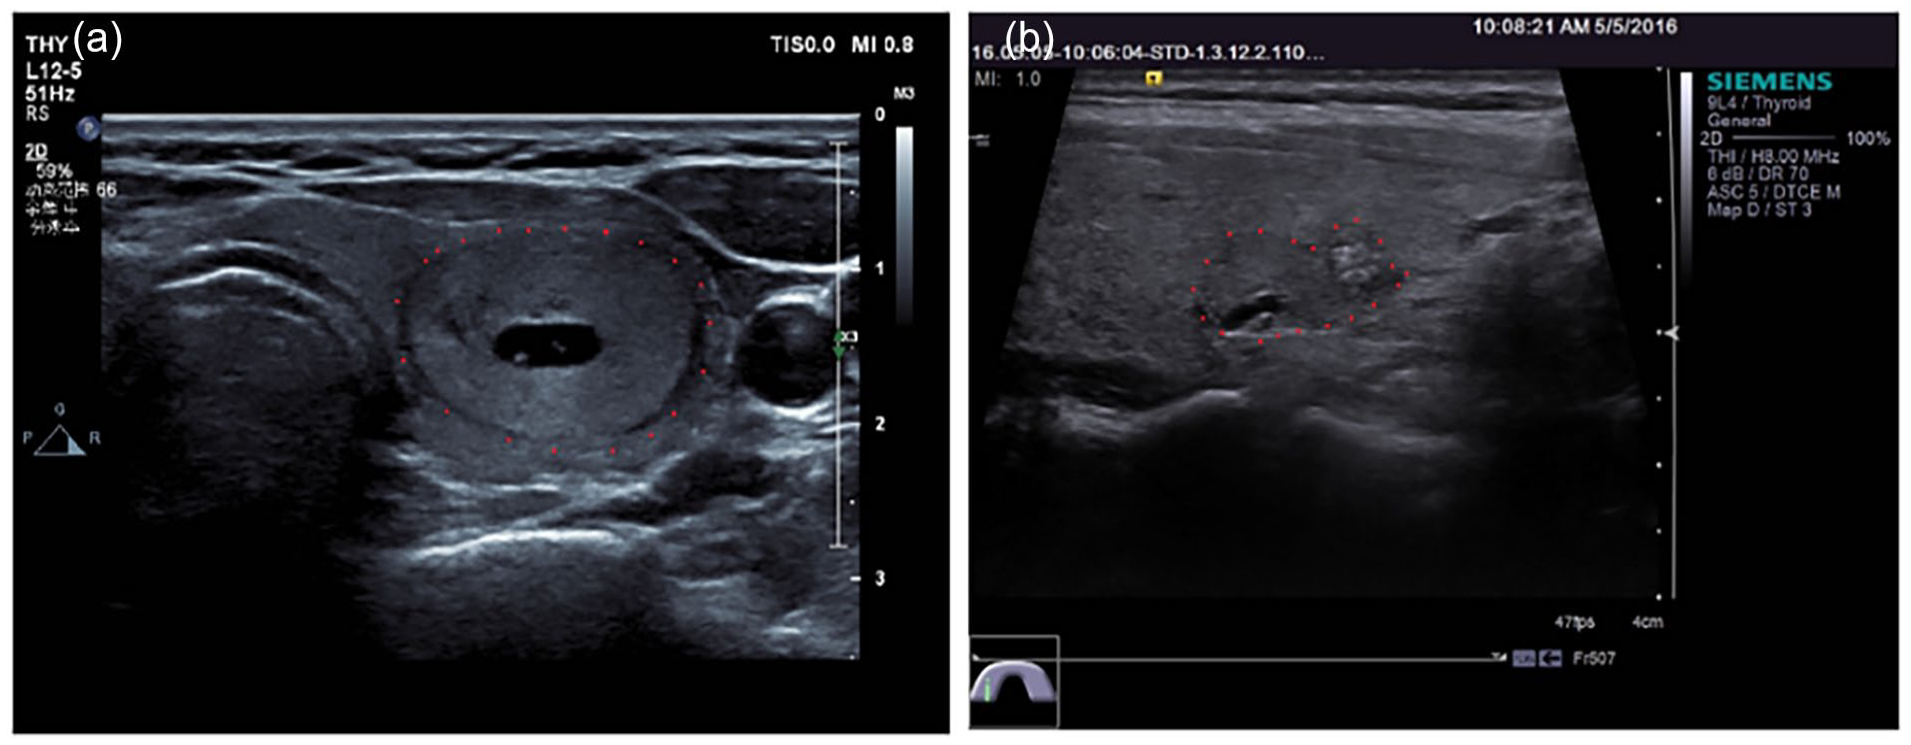
Example US images with labeled ROI (red dots on nodule boundaries): (a) isoechoic/hyperechoic, wider-than-tall, clear, regular and no calcification and (b) isoechoic/hyperechoic, wider-than-tall, not clear, irregular, micro calcification.
Our dataset was labeled by three radiologists with 10, 15, and 30 years of experience respectively. For each ROI identified, US image descriptors of the nodule were assigned by at least 2 radiologists following the ACR TI-RADS guideline, one of whom is ensured to have at least 15 years of experience. When labeling the margin and echogenicity foci, the radiologists made modifications to align with the current clinical practices and reduce the observer viabilities. In particular, the classification of margin is refined into two subcategories as margin irregularity (irregular or regular) and margin smoothness (not-clear or clear). The echogenic foci is simplified as “no calcification,” “microcalcification” or “macrocalcification.” Nodules containing both micro and macro calcifications is classified as microcalcification as it indicates a higher risk of malignancy. In the end, a dataset of total 471 thyroid ultrasound images from two local hospitals in Shanghai, China was obtained and labeled. The dataset contains 140 benign cases and 331 malignant cases, where the pathology result of each image was confirmed by a Fine needle Aspiration (FNA) test.. All the personal details of the patients were excluded. The collected dataset was randomly divided into three equal size patches (157 each) respectively for training, validation and testing purposes (to be further explained in the next section). Both agreed and disagreed labels are recorded without additional bias for performing multi-observer studies in the later experiment.
Nodule Characteristics Detection Methods
Despite some literature suggestions at possible transferring learning when analyzing thyroid and breast tumors as they are both superficial organs, 15 it may be rather difficult to adapt models from other types of organs directly for characteristics analysis for thyroid nodules as they share different definitions. Some characteristics such as calcification can be difficult to analyze for breast tumors due to the limitation of ultrasonography. 16 Nevertheless, some characteristics such as margins do share similarities when used for classifying cancer malignancy, 17 but their characteristics can still vary as they are growing on different mediums with possibly different cell types. Therefore, we have proposed a list of novel methods for analyzing thyroid characteristics with insights from existing literatures.
Margin irregularity
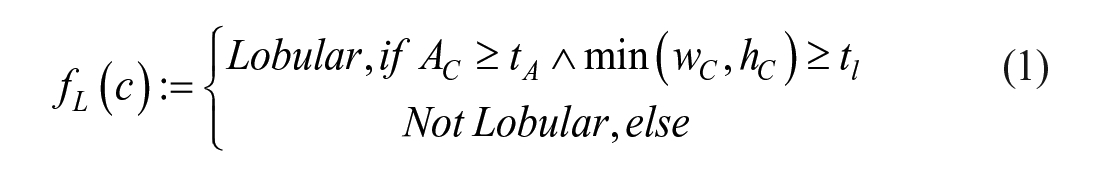
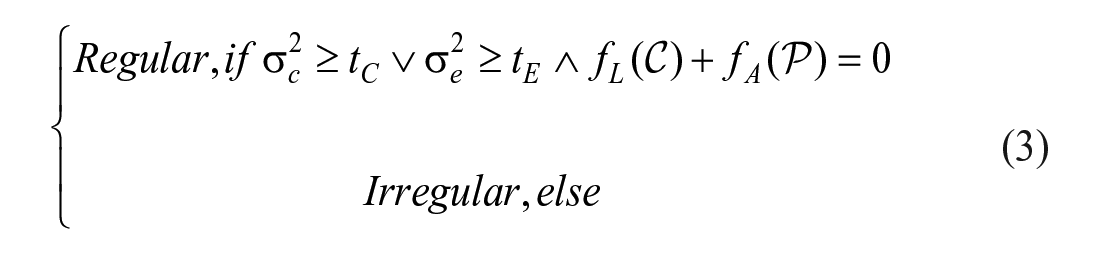
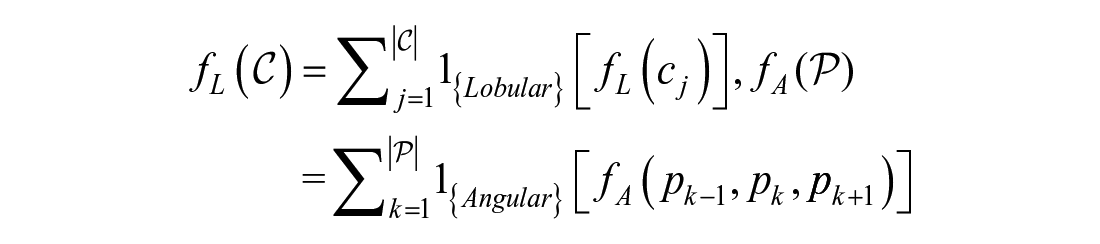
Margin irregularity is a characteristic that studies the geometric shape of the nodule margin. Figure 2 shows an example of a nodule with an irregular margin. Based on the nodule boundary coordinates, the algorithm derives the convex variance, elliptic variance, lobulation, and angulation from the ROI margin; each of them captures a unique feature for measuring margin irregularity and contributes to a final decision.
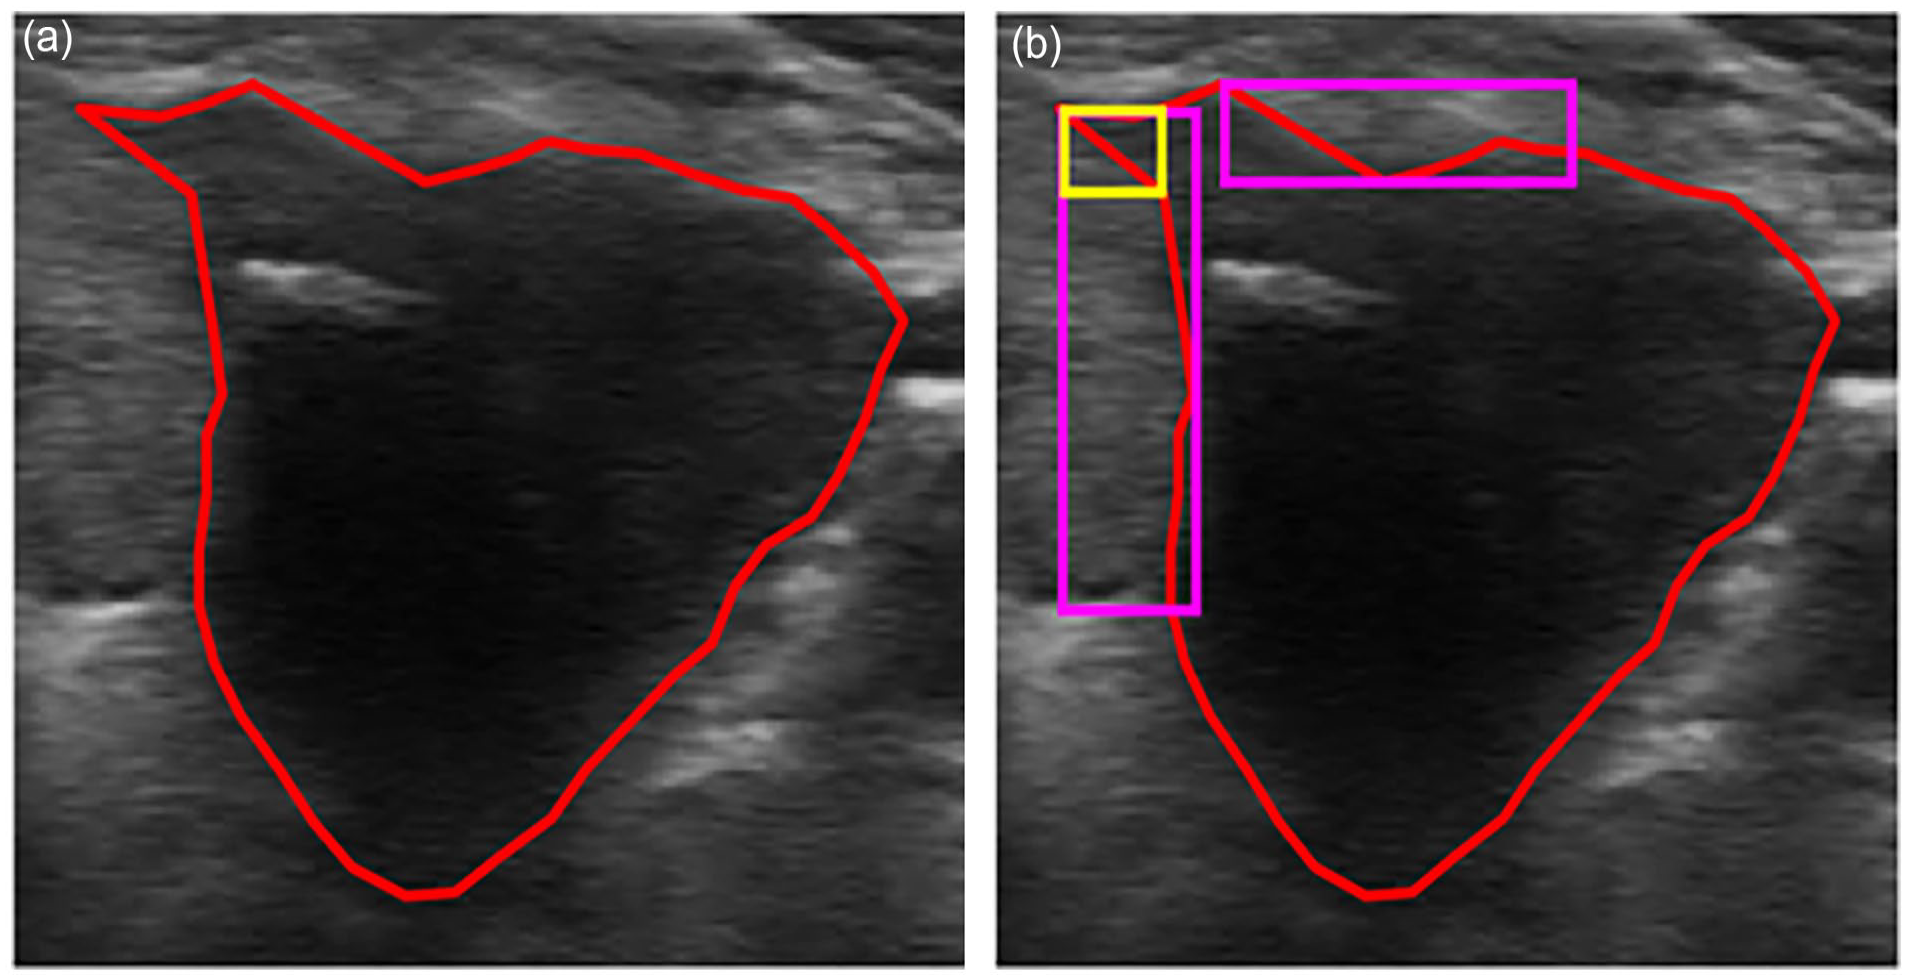
Illustration of margin irregularity detection: (a) nodule ROI with coordinates (red) and (b) an irregular nodule with lobulation (magenta) and angular (yellow) regions.
where
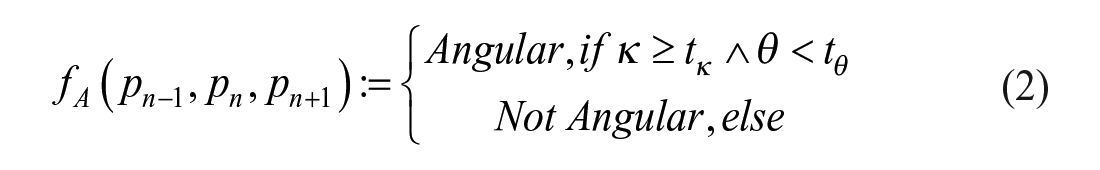
Angulation is also an important factor for margin irregularity. Angulation analysis focuses on the extension around the margin. Therefore, the algorithm examines the spikiness, roughness and distortions of the margin by using a set of three consecutive coordinates,
where
where
and
Our irregularity method and the methods developed in5,7,12,14 both measure global irregularity of the nodule, but our method uses convexity and ellipticity variance, providing a more robust and accurate assessment of nodule irregularity without being excessive. Furthermore, our method has a new feature extraction step that incorporates and measures of local irregularity of margin such as lobulation and angulation. This feature extraction step has shown an improved sensitivity of margin irregularity demonstrating the better effectiveness of our method.
Margin smoothness
Margin Smoothness represents the clarity of the nodule margin that is reflected the intensity contrast. The higher the contrast between regions inside the nodule boundary and the regions outside, the clearer the margin is. For better results, we first pre-process the US images to suppress the speckle noise and enhance the images. An adaptive median filter
8
is applied first for reducing the noise. This is then followed by bilateral filtering with Gaussian kernels
9
to enhance edges. The pre-processed image is then masked by the ROI delimitated by the radiologists to determine inside and outside ribbons around the nodule margin with the assistance of morphological operations (see Figure 3(a)). These ribbons are further divided into
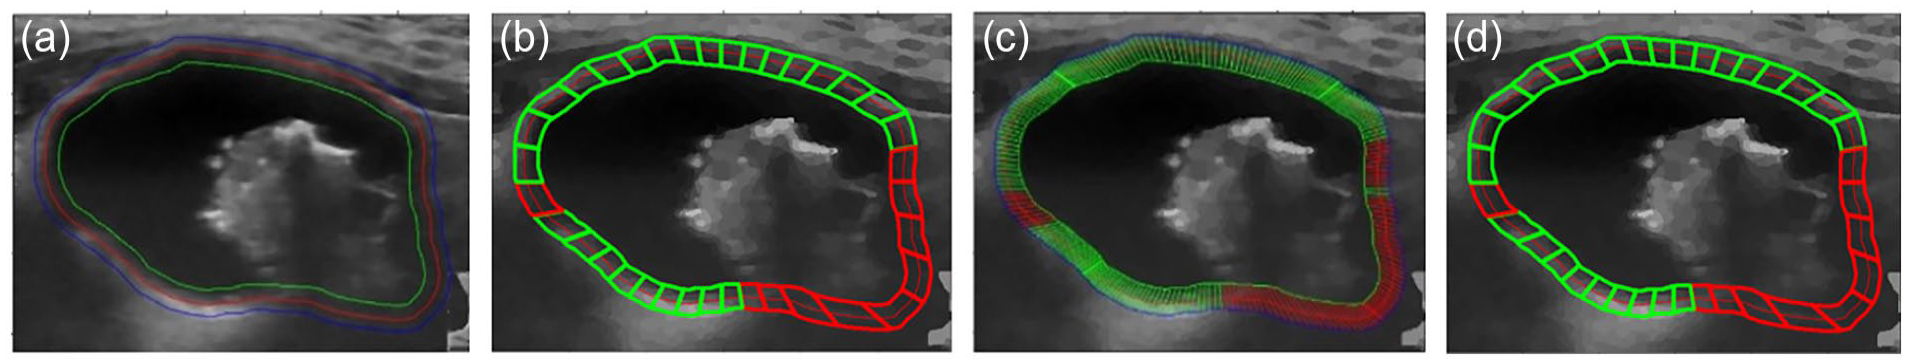
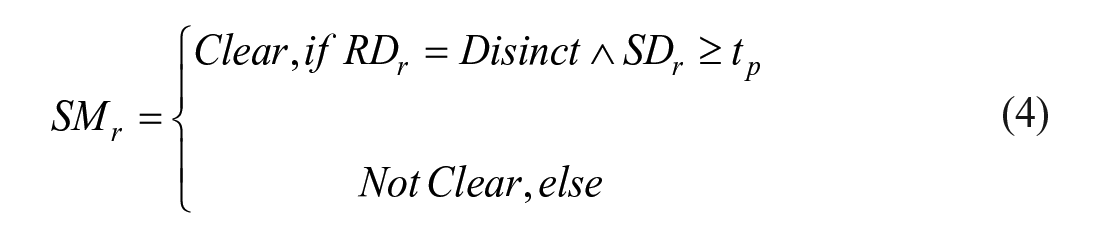
Illustration of margin smoothness detection: (a) nodule ROI with outer (blue)/original (red)/inner (green) ribbons, (b) global detection results (distinct (green)/indistinct (red)), (c) local detection results (distinct (green)/indistinct (red)), and (d) final smoothness prediction (distinct (green)/indistinct (red)).
where,
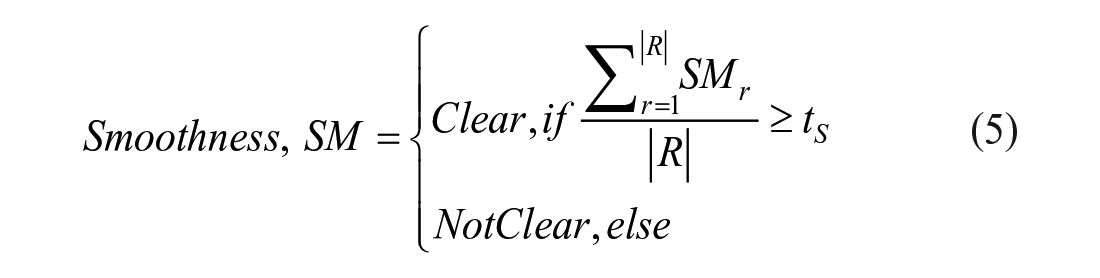
where,
Both our margin smoothness prediction method and the approach proposed by Zhuang et al. 14 use a ribbon (inner and outer) around the nodule boundary and the mean difference in intensity to predict the margin smoothness. However, our method includes additional features in the form of local texture descriptors that capture local intensity variation. These additional features have shown to the improved performance and robustness of the margin smoothness prediction.
Calcification
Calcification in US image is defined as a small and bright fleck in the image reflecting calcium growth on or inside the nodule. Identifying calcifications is known to be challenging due to their variant size, shape and brightness. Certain types of benign characteristics such as the colloids can be easily confused with calcifications in US images. To meet the challenge, we develop a two-stage process where possible candidates for calcification are first detected, and then classified into different classes.
The initial backbone architecture of CaNet consists of an Input Layer (IL), Convolution Block (CB), Max-Pooling Layer (PL) with stride 2 × 2, Average Pooling Layer (GAP), Fully Connected Layer (FCL), Softmax Layer (SL), and Classification Output Layer (COL) for two classes (calcification or none-calcification). The CB consists of three layers in the following order: 3 × 3 Convolutional Layer (CL) with stride 1, Batch Normalization Layer (BNL), and Relu Layer (RL). The IL is set to the size of 32 × 32× 1 to accommodate the small size of the calcification ROI proposed by the weak detector. The hyperparameters were carefully set as follows: initial learning rate to
CaNet architecture (Figure 4) and model were optimized and trained on a specifically collected dataset of 405 images, where the locations of all calcifications are pinpointed by a radiologist with 15 years of experience. Calcifications in the training set were augmented using mirroring and Singular Value Decomposition (SVD) method 15 with three compression ratios (25%, 35% and 45%), finally resulting in 888 calcification candidates and 1723 none-calcification candidates at a ratio of roughly 1:2. The first fold was used to find the optimal CaNet network and Figure 4 shows the details of the optimal architecture with the optimized L2 value of 5.1540e-4 . For the second task, CaNet achieved 81.5% overall accuracy over fivefold cross-validation, 89.1% specificity (no calcification) and 80% sensitivity (calcification). CaNet model with the highest combined sensitivity and specificity was selected and used in the later stages of identifying micro and macro calcification.
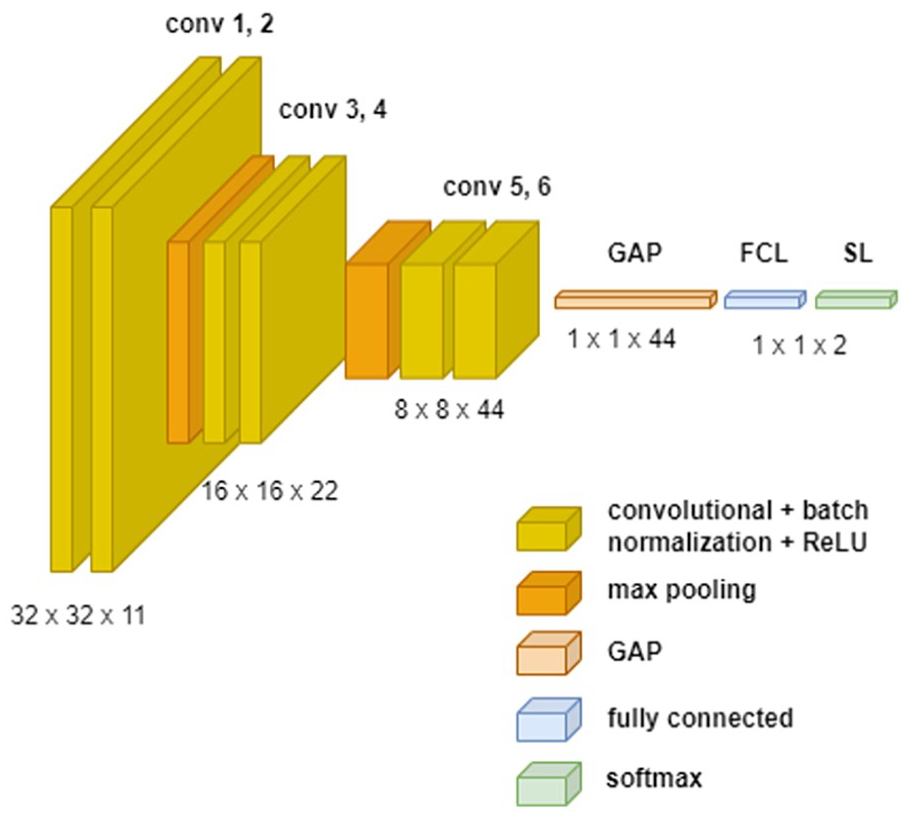
Optimal CNN architecture for calcification classification.
Finally, the grown candidates are classified into micro or macro calcification using the rule in equation (6):
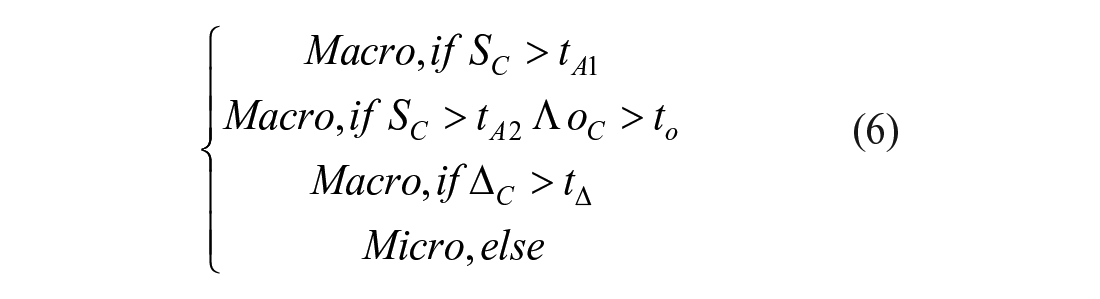
where
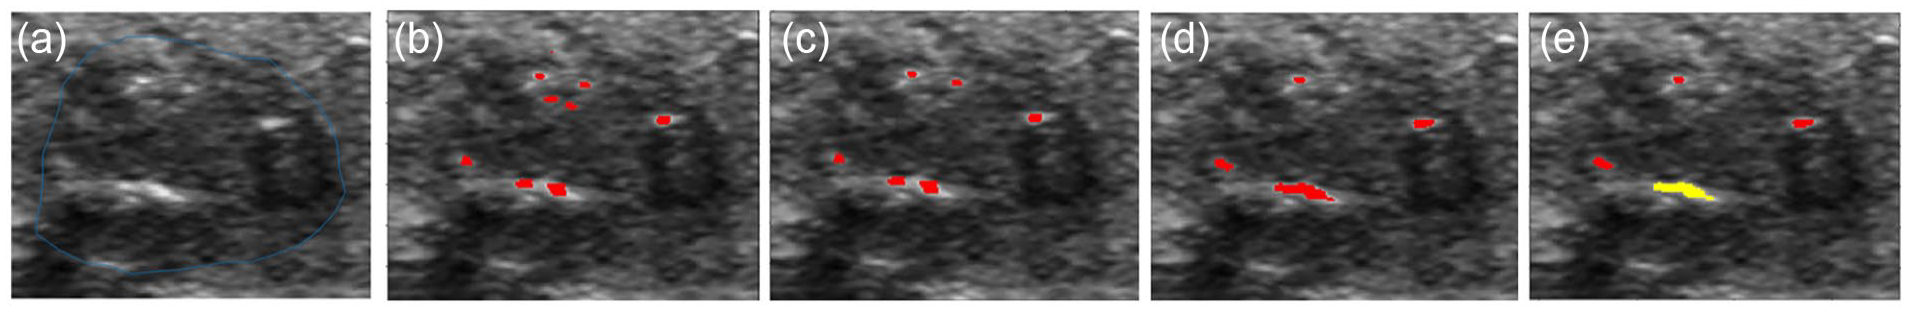
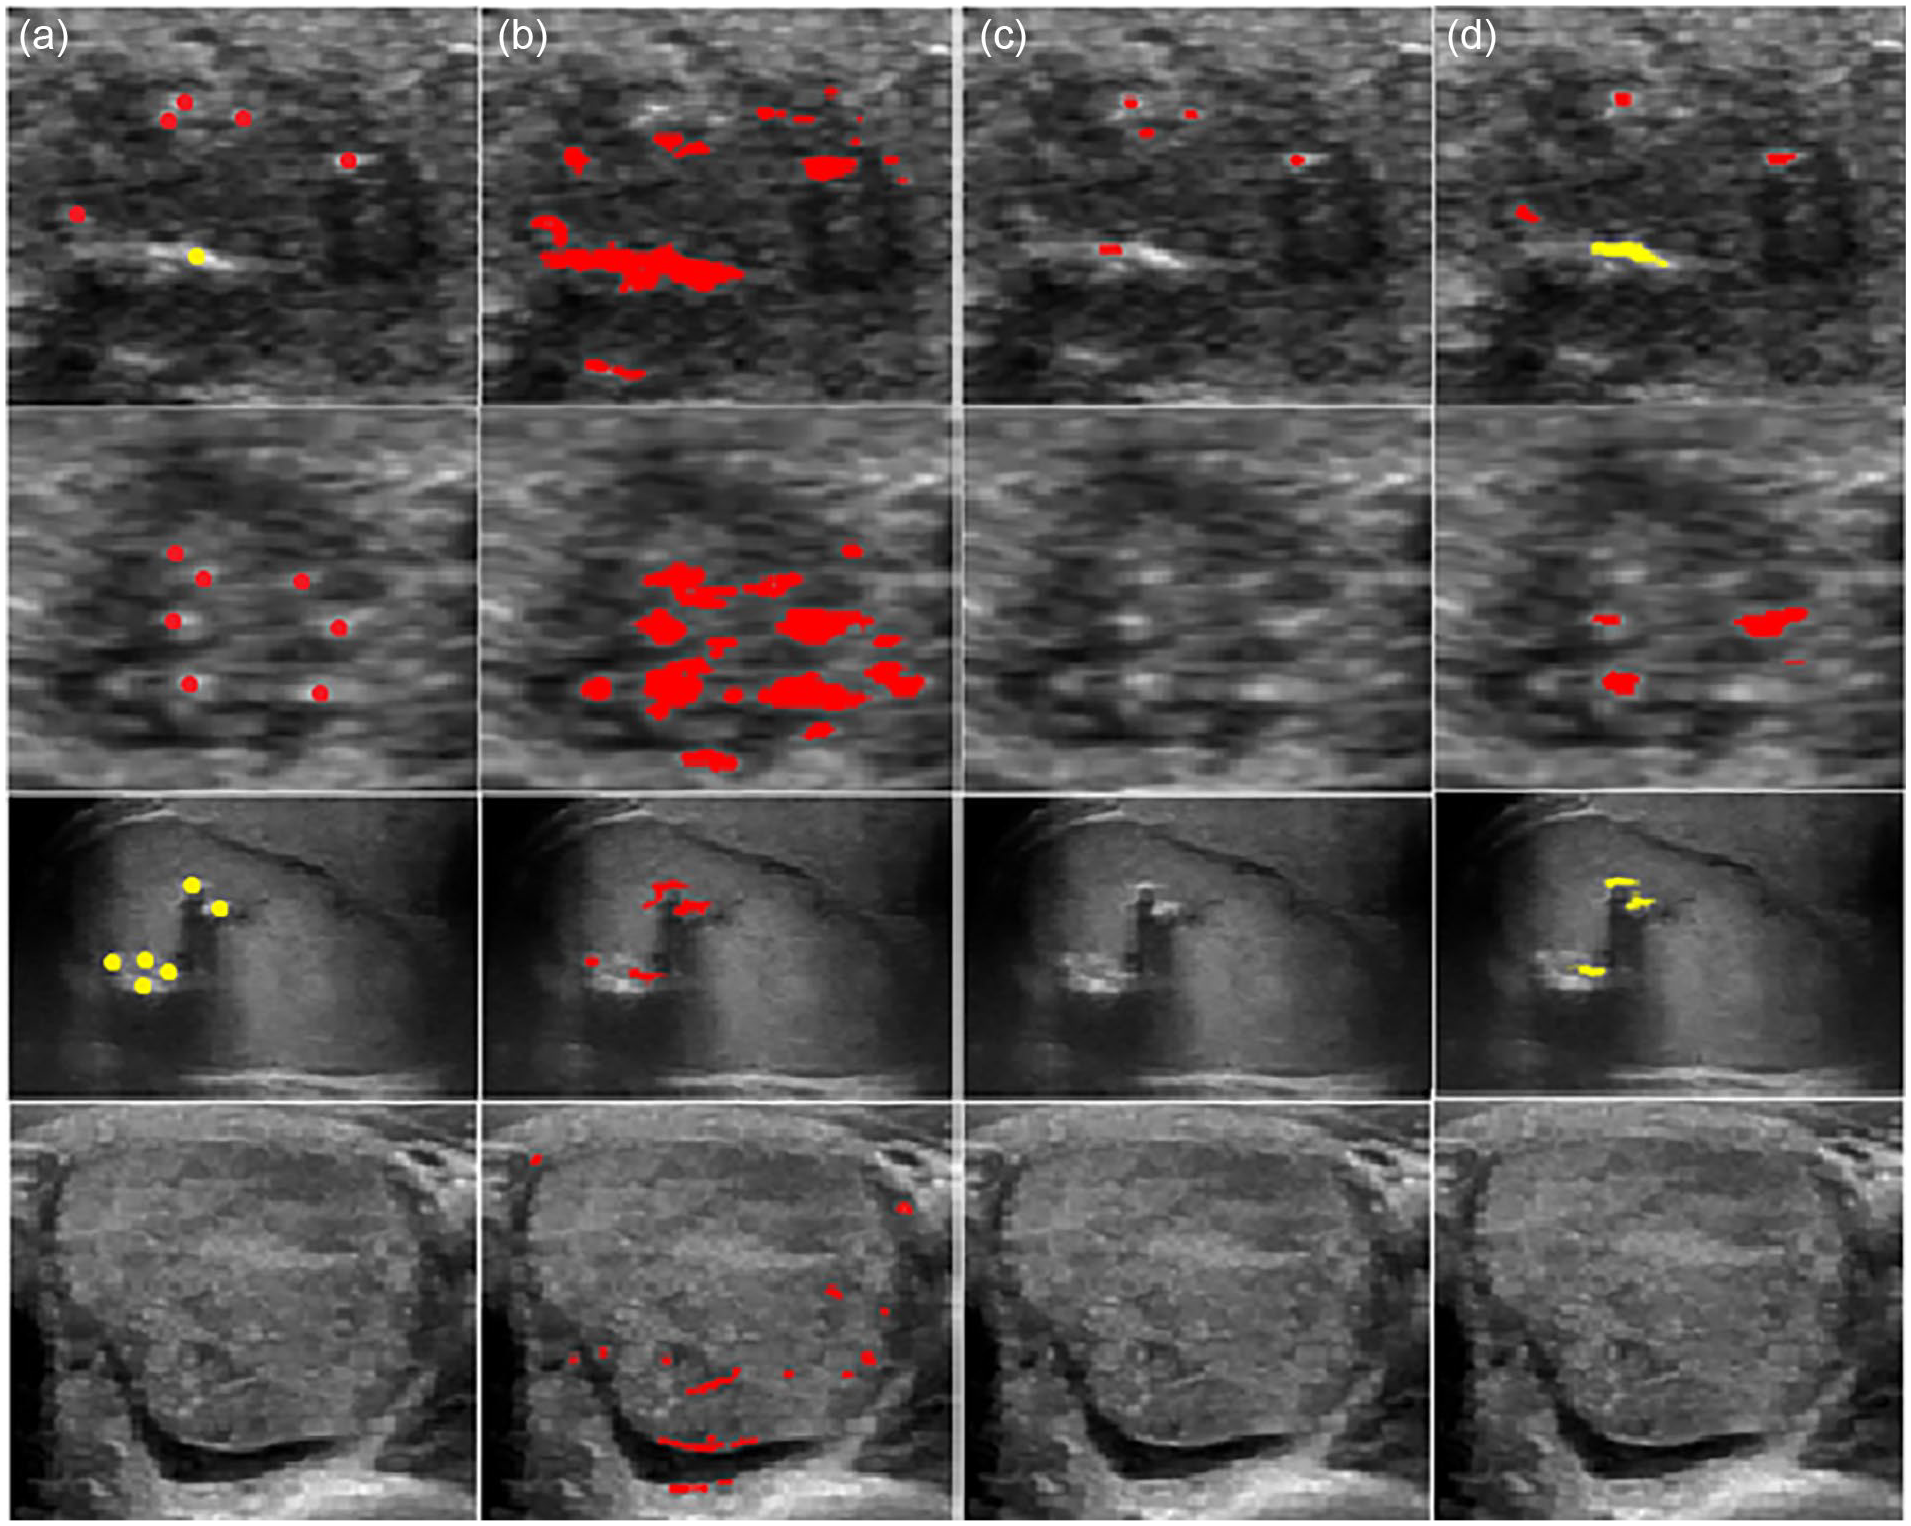
Illustration of calcification detection: (a) ROI image, (b) calcification candidates proposed by the weak detector, (c) calcification candidates validated by the CaNet, (d) calcification candidates after growing, and (e) classification outcome; red: microcalcification, yellow: macro calcification.
Comparing to the existing methods in the literature, our proposed method strikes a balance between the detected two types of calcification, false alarms and missed cases through the three stage detection process. As shown by examples in Figure 6, the morphology-based method 16 is over sensitive, severely suffering from false positive detections whereas the superpixel-based method 18 tends to be under sensitive, failing to detect calcifications in some images.
Experiment Results
This section presents the experiment results for evaluating the effectiveness of the various methods proposed in Section 3. All experiments were conducted on an Intel Xeon workstation with CPU@2.90GHz, 16 GB RAM, NVIDIA RTX A2000 GPU, and running MATLAB R2020b 64-bits version. With the three patches of images, we used the training patch as the main reference for developing the proposed methods. We then use the validation patch to validate the robustness of the proposed methods and fine-tune the algorithm parameters and the relevant thresholds. For the special characteristic that involves training classification models, such as calcification, to fully utilize the data, we merged the training and validation patches in a 10-fold cross-validation process for model training, evaluation and then selection.
Our experiment consists of two tests. In Test 1, we evaluated the proposed methods against the labels given by one radiologist with 15 years of experience. In Test 2, we evaluated the methods against the labels given by the first radiologist and then confirmed and agreed by another radiologist with similar years of experience. The test results are presented in Table 1.
Performance Summary of the Propose Methods in Tests 1 and 2.
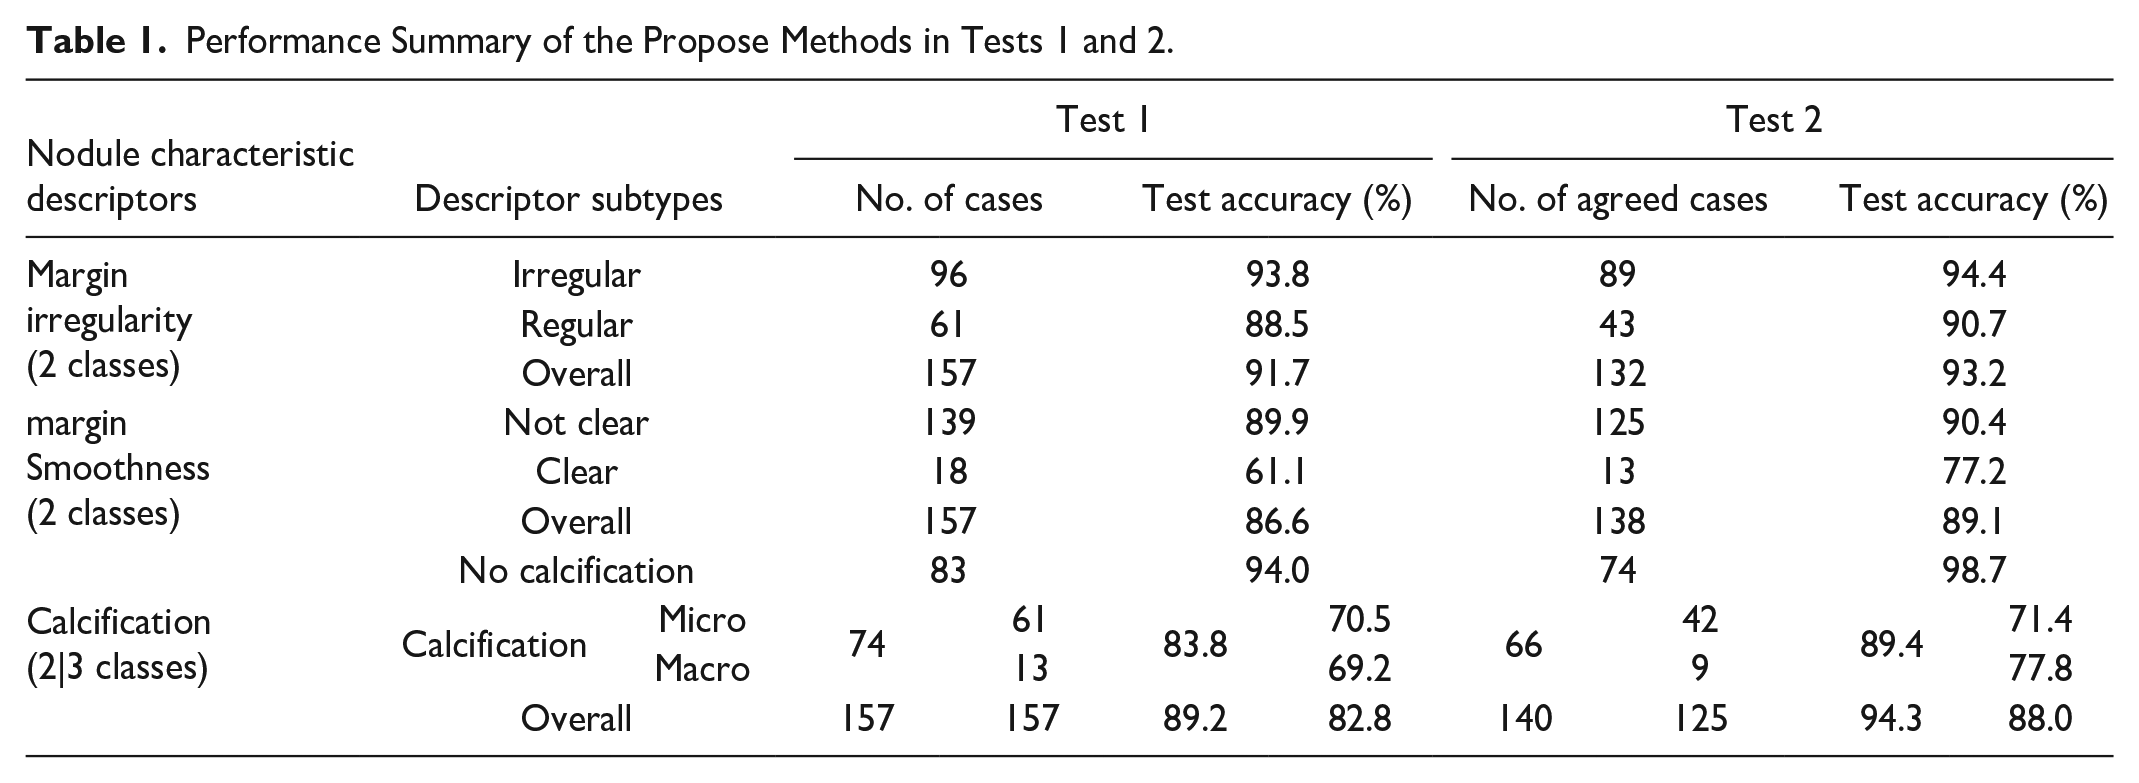
The table shows our algorithms achieved overall accuracy well above 80% for all three nodule characteristics. The methods perform better on the agreed cases by multiple radiologists than cases labeled by a single radiologist. In general, the algorithms perform better on characteristics that are clearly defined than those where there is more room for different interpretations. For instance, high levels of accuracy are achieved for Margin Irregularity whereas the algorithms’ performances on margin smoothness and calcification are relatively lower.
At subtype level, the algorithm performances vary substantially due to uneven distributions of the subtypes particularly for those characteristics with a greater degree of subjectivity. The difficulty faced by the algorithm development is which radiologist’s labels should be based on as the ground truth. The difficulty is more severe when the number of cases of a subtype is small. Margin characteristics are also known for their subjective nature, where we found that radiologists agree more on irregular (89 of 96, 92.71%) and unclear cases (125 of 139, 89.93%) than on regular (43 of 61, 70.49%) and clear cases (13 of 18, 72.22%). This is because boundaries of malignant nodules tend to have more distinctive appearances than those of benign nodules, and hence radiologists often have differences when classifying boundaries of “benign-looking” nodules. Despite these subjective factors, the proposed methods still achieved good performance on the margin characteristics.
The test results on calcification show that our calcification method achieved good overall accuracy, but better performance on none-calcification than calcification at subtype level. This performance bias is understandable as none-calcification cases appear more frequently in clinics. The results also show that inter-observer variability is quite substantial for calcification; the radiologists agree more in calcification and none-calcification (140 of 157, 89.17%) than in micro and macro calcifications (51 of 74, 68.92%). It is worth noting that radiologists often use the measurement scale marked on the side of US image as an aid when classifying micro and macrocalcifications whereas the algorithms have not made such a reference.
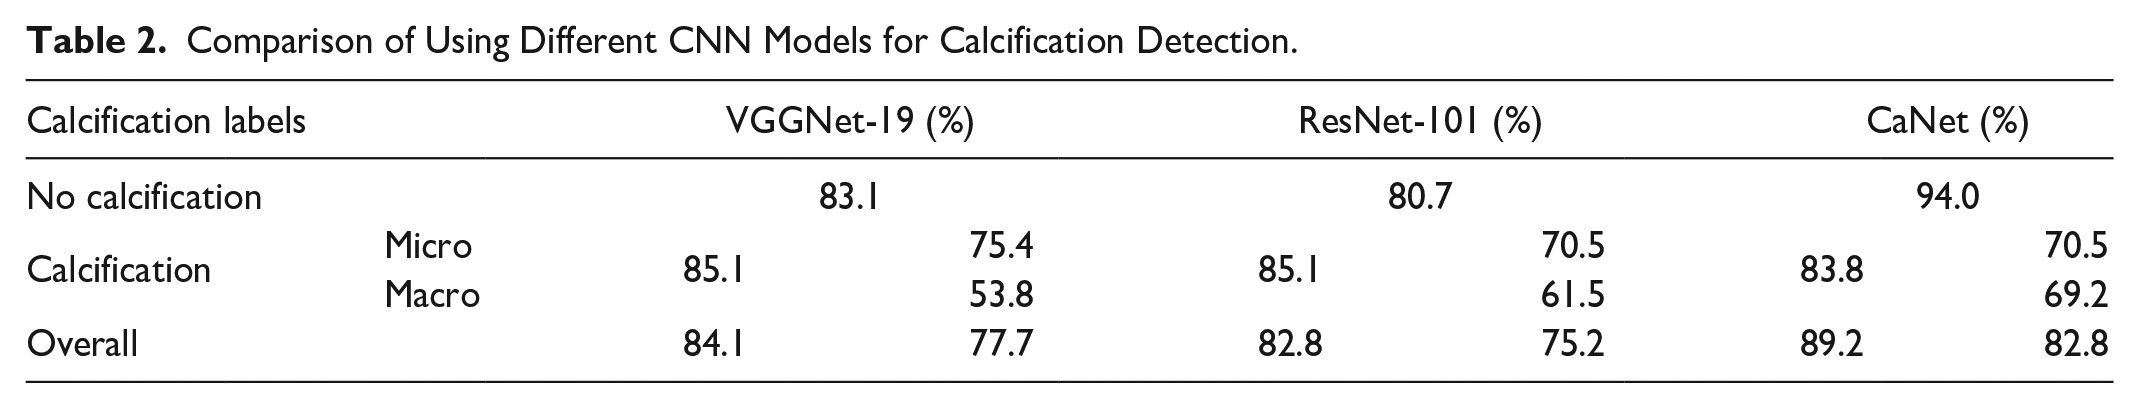
We have also compared our proposed CNN model against other novel CNN models adapted for calcification detection. In particular, we tuned two powerful CNNs, VggNet19 and ResNet101, using transfer learning approach for calcification image classification. The architectures of VggNet19 and ResNet101 were adapted by replacing and fine-tuning the last fully connected layer and the softmax layer of each network. The last fully connected layer was also replaced by a new fully connected layer for two classes (calcification, no calcification). For a systematic and fair comparison, we set the network parameters for both models as follows: 20 epochs, initial learn rate = 0.0001, and mini-batch size = 4. The other parameters were set as default values of each networks. The results in Table 2 show that our proposed CaNet model achieved better specificity. Although CaNet model has lower sensitivity than the other two models, it is worth mentioning that our CaNet achieved less biased results when classifying micro and macro calcifications. It is also worth noting that both transfer learning models had a required input size of 224 × 224× 3, which did not fit most of the calcification candidates due to their small sizes. To resolve the issue, the candidates were resized using bicubic interpolation. However, it is a known fact that up-samplings may easily cause overfitting and fuzziness in the model trained. We believe that this explains why our proposed model has achieved better and less biased results as it fits better to the small input size.
Comparison of Using Different CNN Models for Calcification Detection.
Discussions
Our tests in the experiment section have shown promising results from our proposed method. In this section, we will discuss several issues concerning optimization of our models and algorithms, including the optimized thresholds, other TIRADS characteristics and constructing robust models.
Threshold Tuning
The proposed methods for margin and calcification use several thresholds. To determine the best configurations empirically, we conducted a gradient descent-based search on the validation set. The search aims to maximize the overall validation accuracy while maintaining a balance between the sub-class accuracies. Figures 7 to 9 illustrate how threshold setting may affect modeling performance.
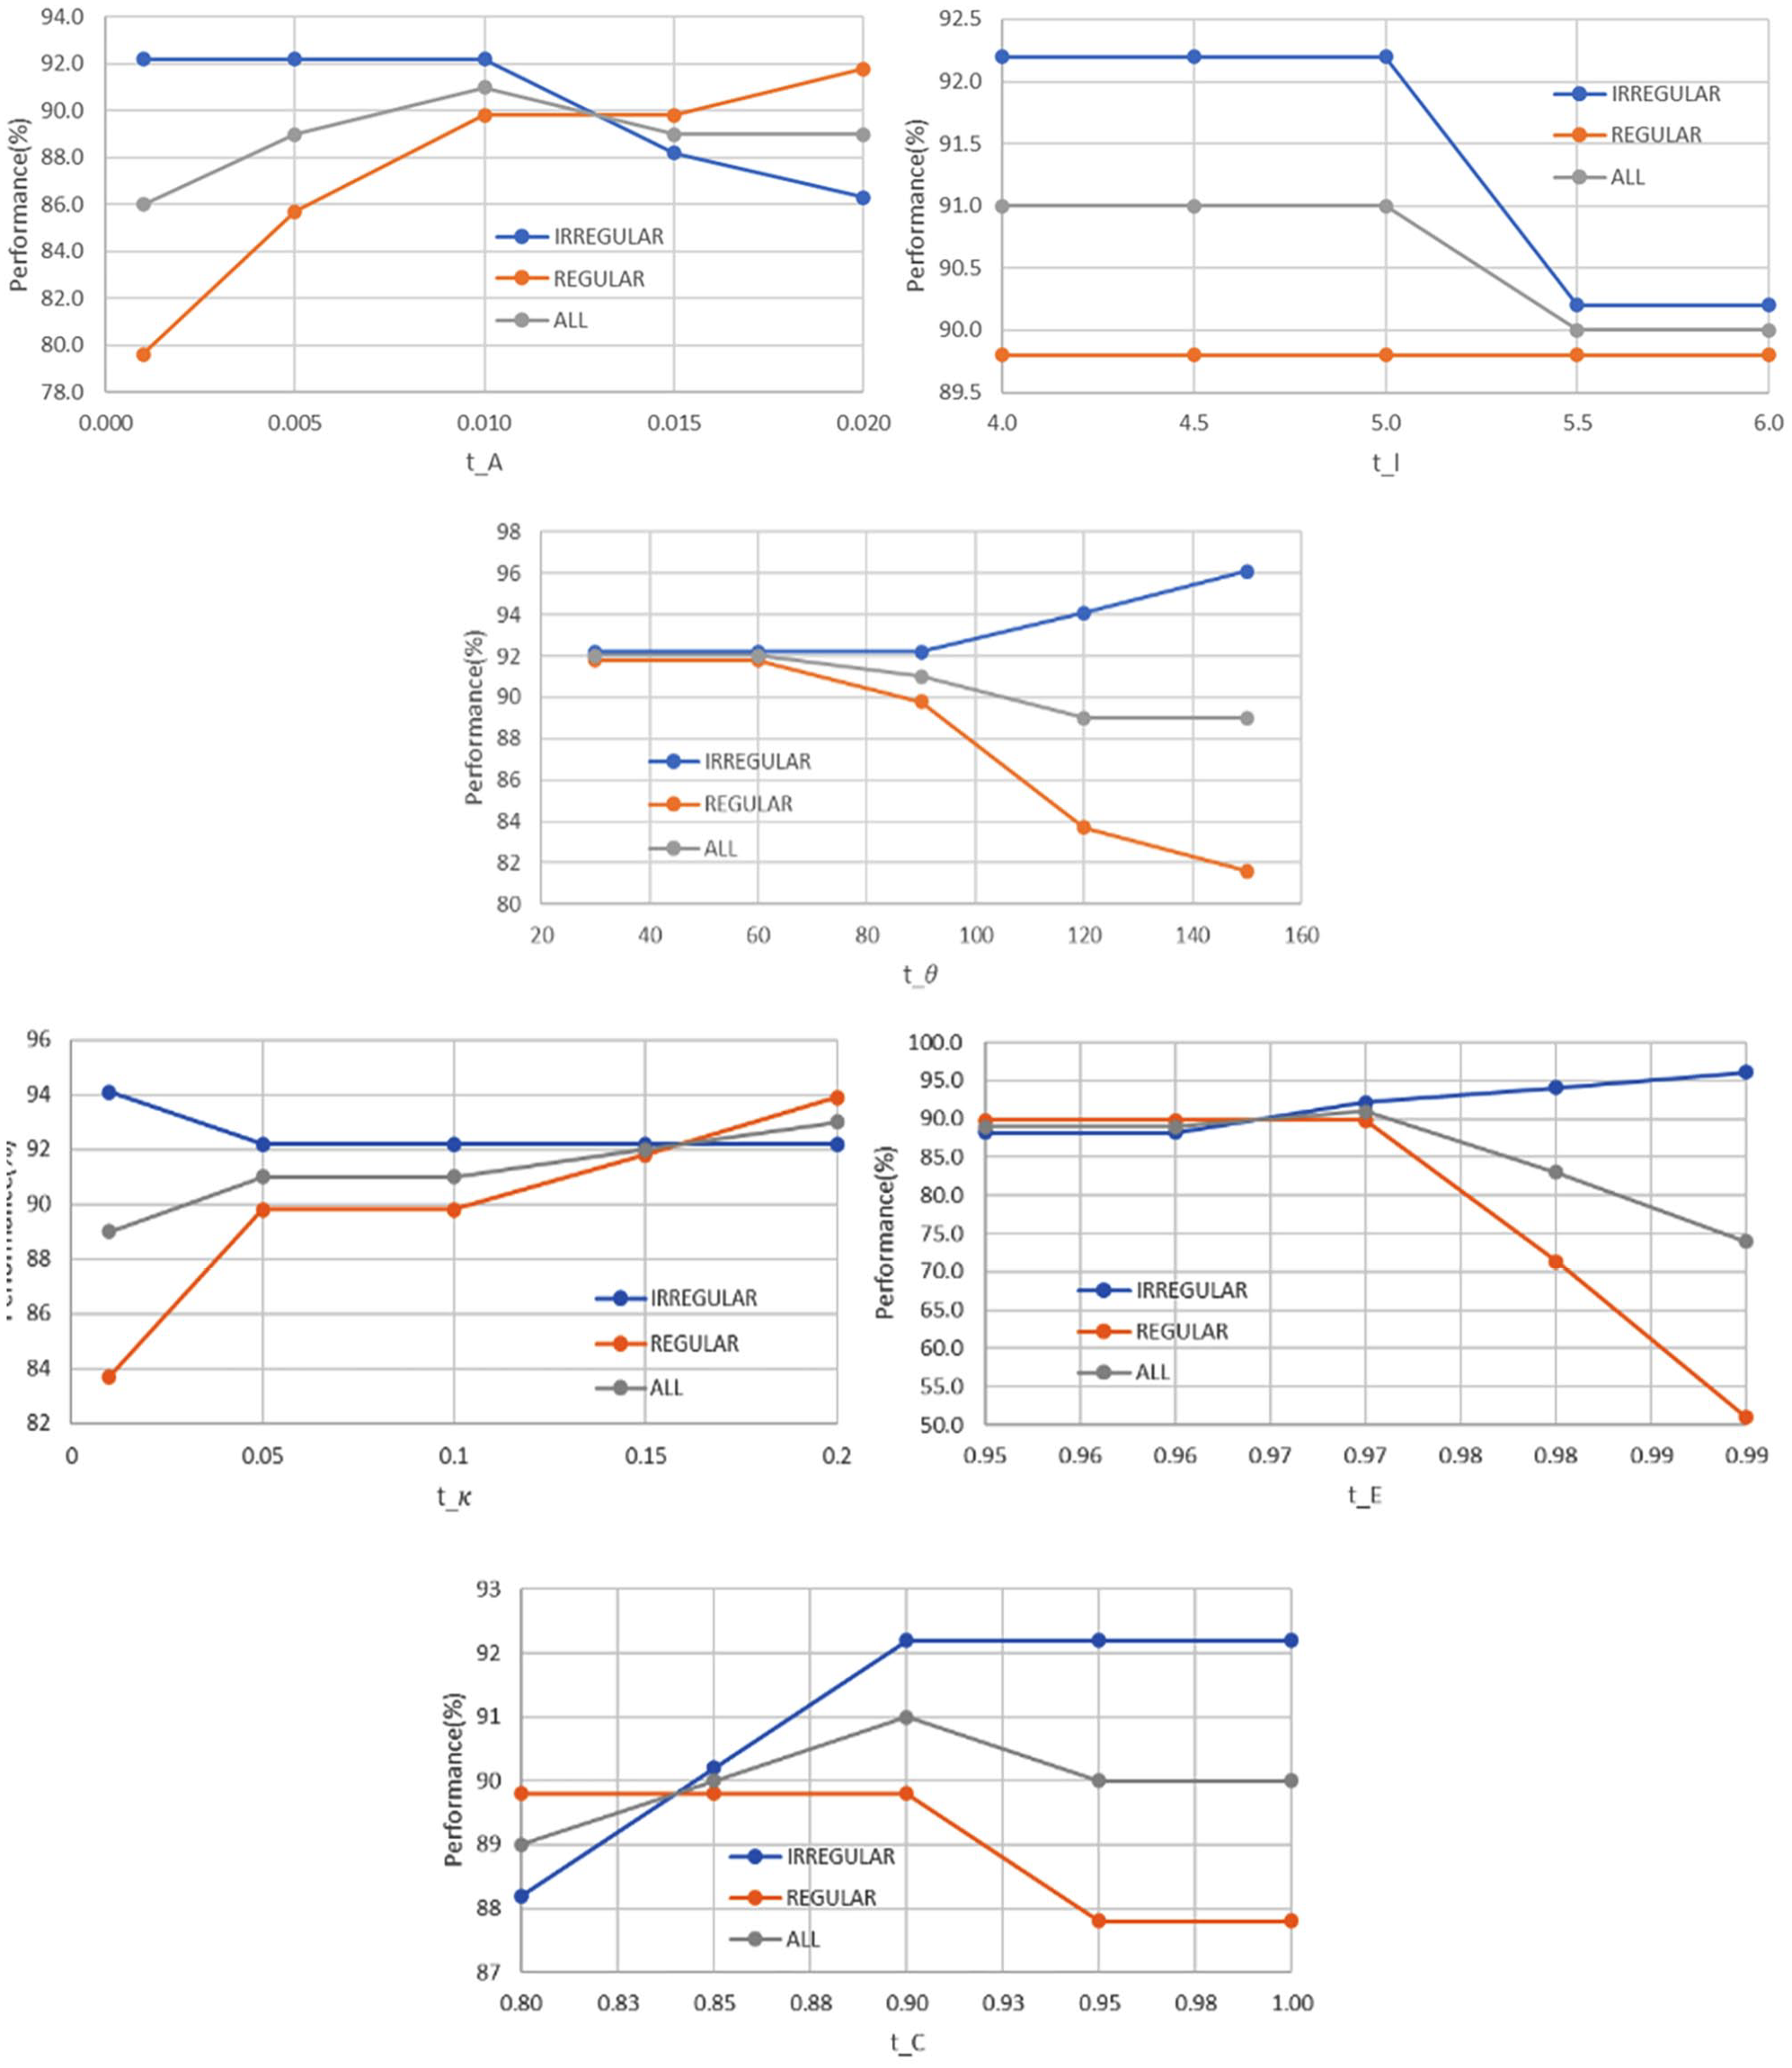
Performance of different thresholds used in margin irregularity analysis.
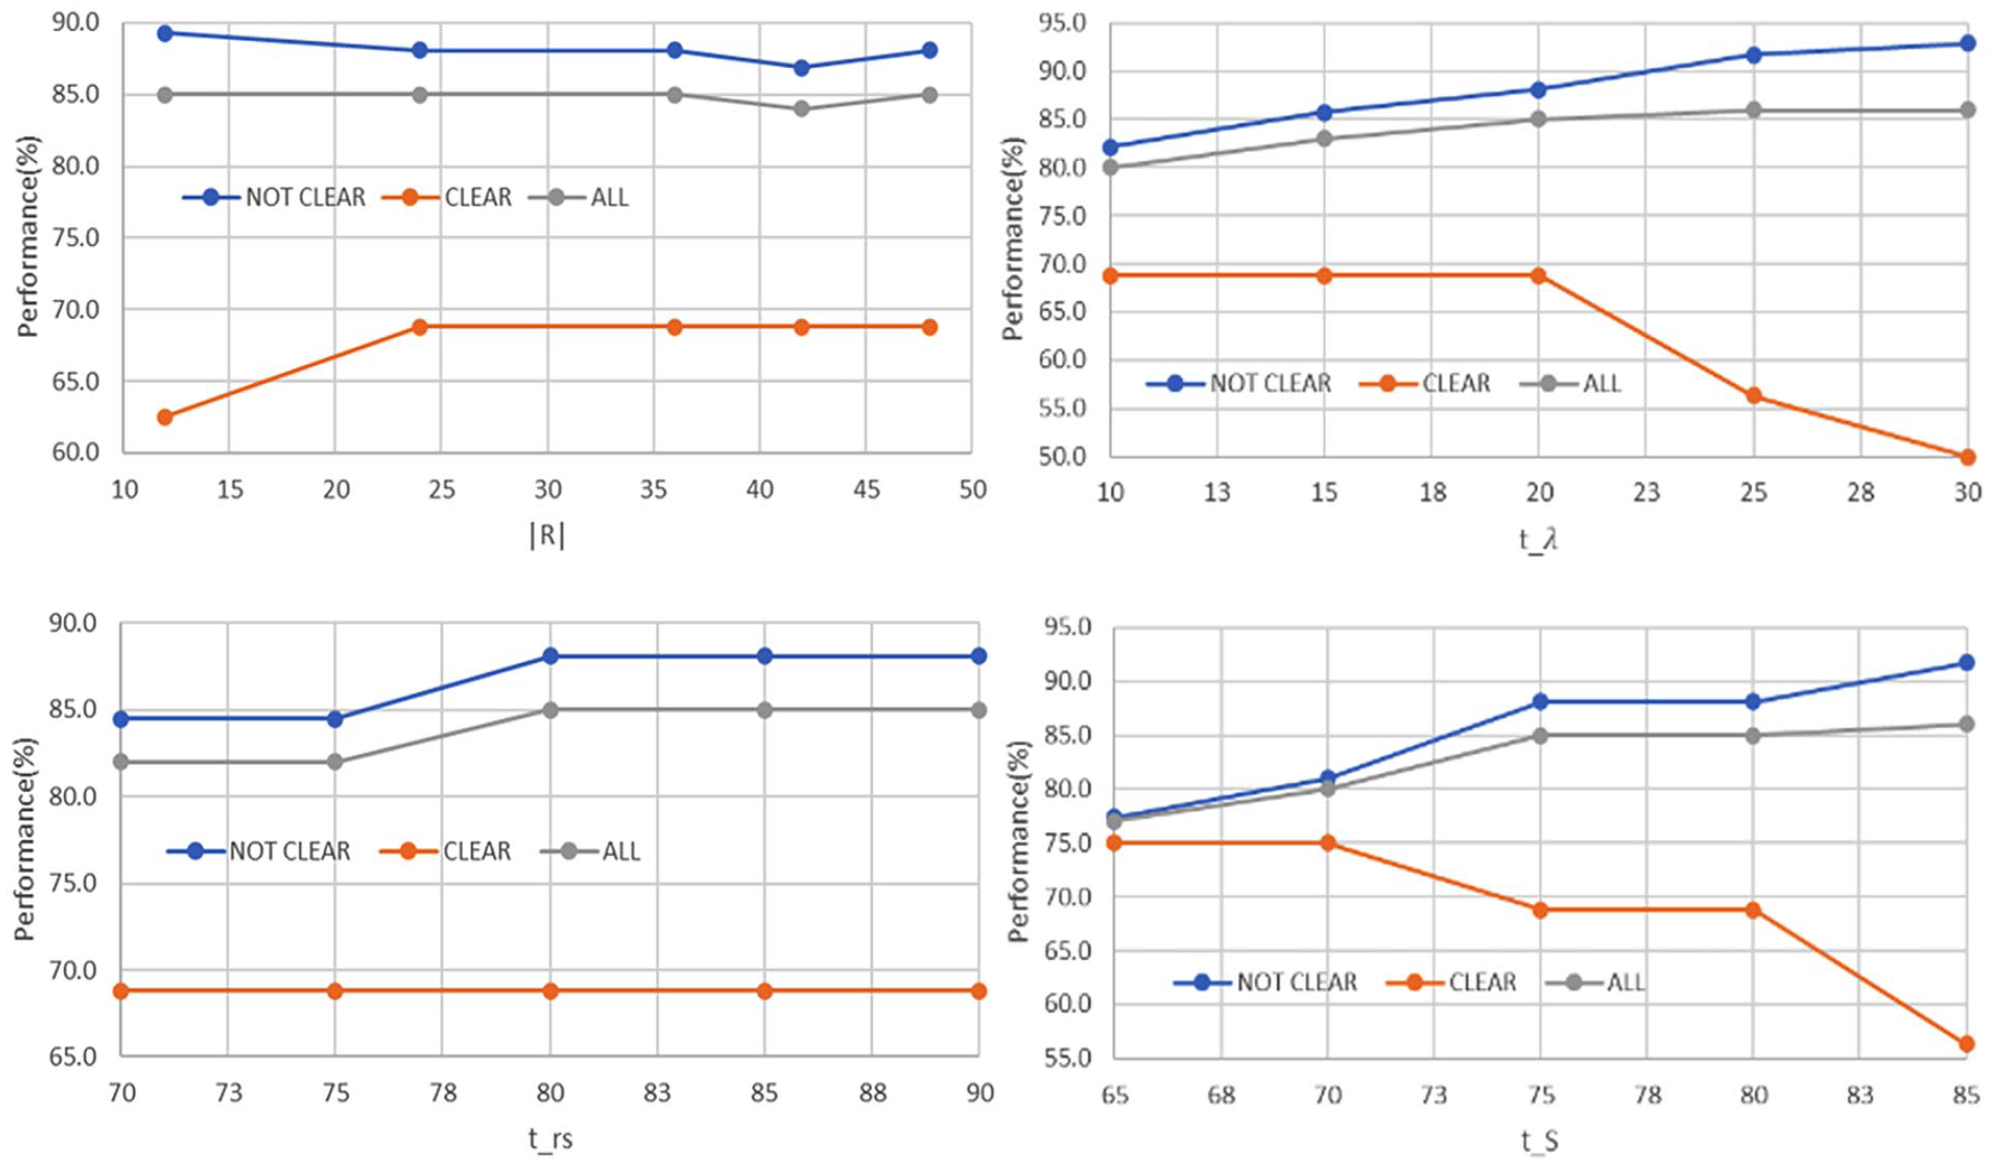
Performance of different thresholds used in margin smoothness analysis.
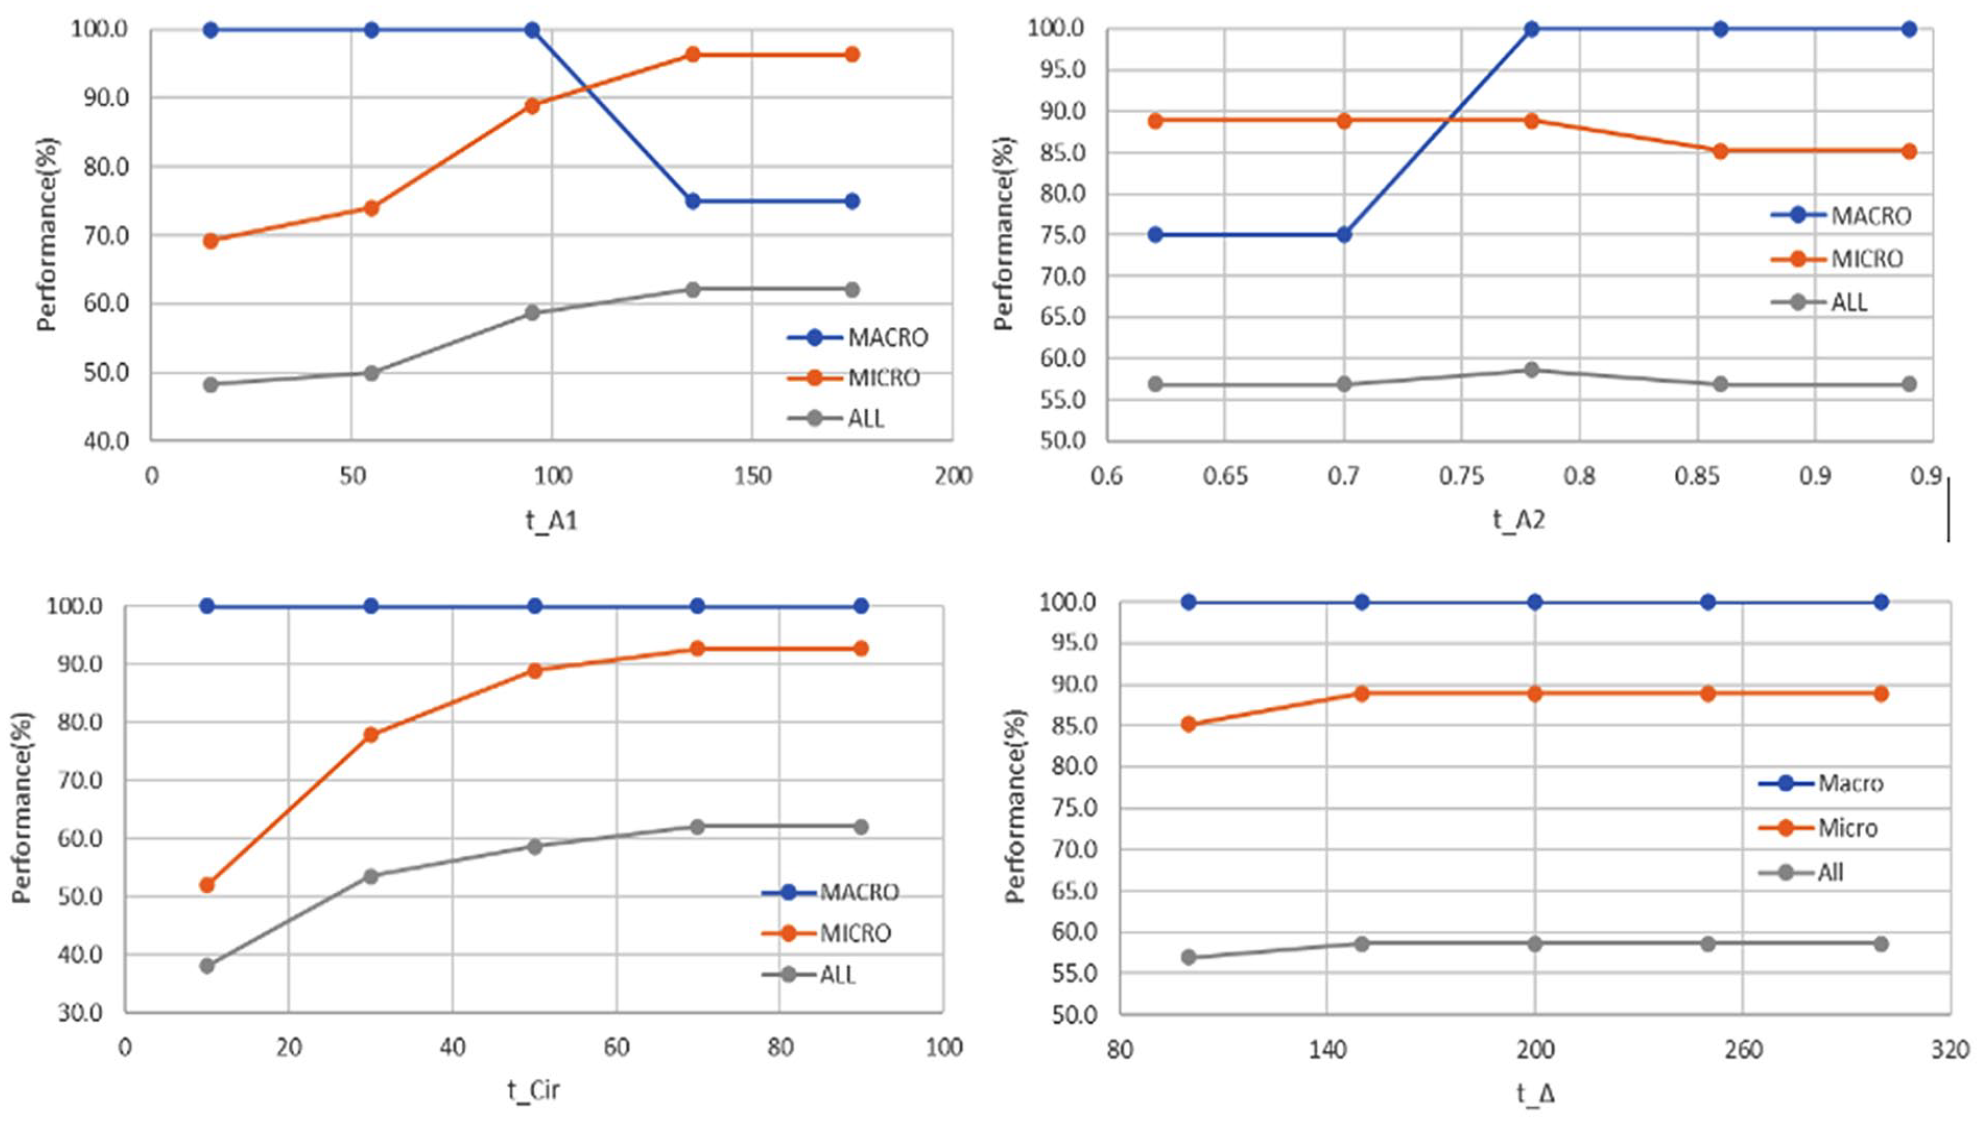
Performance of different thresholds used in calcification analysis.
We also found that the size of a nodule in an image may affect radiologist’s decisions when classifying margin characteristics. Lobulations in large nodules for example may appear less severe than the same kind of lobulations in smaller nodules. Therefore, we have further altered some thresholds according to the size of the nodule for better robustness. In particular for margin irregularity, we set
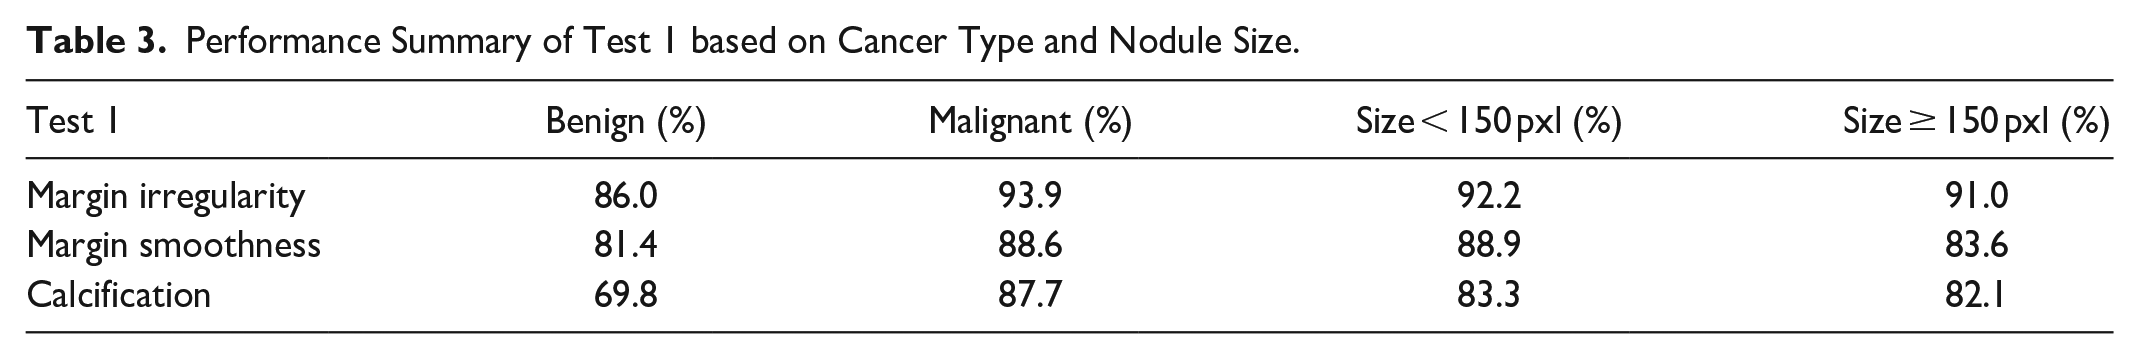
As presented in Table 3, we found that the proposed methods tend to perform better for malignant nodules than benign ones. The performance bias may be partially caused by the unbalanced training dataset, which can be improved by enrolling or augmenting more benign cases. We also have relatively poor accuracy for calcification on benign nodules. It is worth noting that calcification is often associated with malignancy and rarely appears in benign nodules. Also, fibrosis in benign tumors can be easily confused with microcalcifications. Further research is needed to better understand such rare and confusing cases for developing better solutions. Additionally, the experiment results also show that the margin irregularity measure performs well and is robust across different nodule sizes because our method has considered both global and local margin irregularities. Margin smoothness also performs well but is slightly better toward small nodules. We believe the performance deterioration for large nodules is due to the excessive space covered by each region, indicating that it may be appropriate to increase the value of when analyzing large nodules.
Performance Summary of Test 1 based on Cancer Type and Nodule Size.
Shape and Echogenicity Analysis
Besides margin and calcification, the TIRADS guidelines also define other US characteristics such as shape and echogenicity. Shape describes the orientation of the nodule growing. To provide a complete automated solution, we proposed a simple shape classification algorithm consisting of three steps. First, a polygon shape (or bounding box) is constructed based on the set of coordinates on the ROI boundary. An exhaustive search is then conducted horizontally and vertically within the polygon to locate the maximum width
Another important US characteristic is echogenicity which is reflected by the pixel intensity values in the nodule region of the image. We proposed a simple algorithm to identify the echogenicity type by comparing the intranodular intensity with that of the surrounding areas. The algorithm first divides the areas around the nodule into sub-bands (or small regions) and studies the mean and variance on their intensities. Sub-bands that being over dark/bright/inconsistent are consider as non-gland area and being excluded from consideration. The median of the remaining ones is then used as the isoechoic reference and the other echogenicity types are determined accordingly using a set of dependent thresholds. At the end, we compare the percentage of the echogenicities contained and chose the most dominant one as the final echogenicity class. Figure 10 shows some example echos within a nodule.
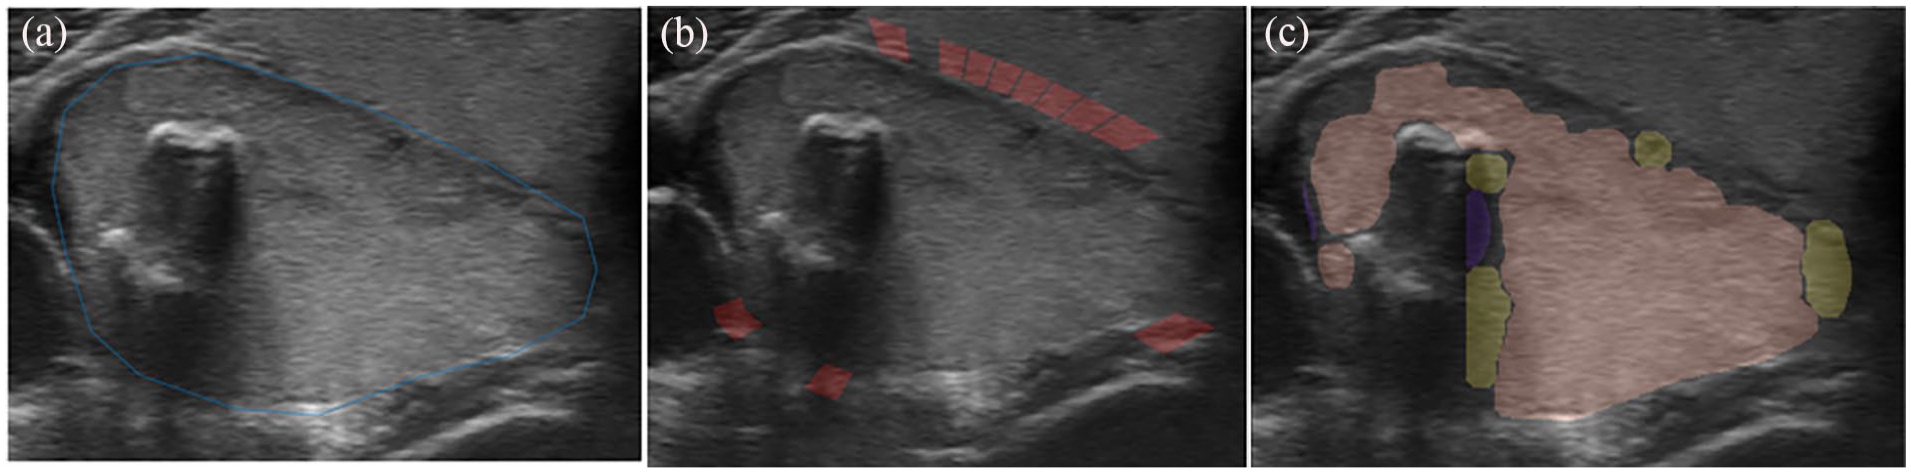
Illustration of echogenicity detection: (a) original ROI, (b) valid reference regions detected, marked in red, and (c) echogenicity classification result (purple: very-hypoechoic; yellow: hypoechoic; pink: isoechoic).
The test results also show that our proposed algorithm achieved an overall accuracy of 87.7% against one radiologist labels, and a higher overall accuracy of 90.6% when it was tested against the agreed cases by two radiologists. However, since some rare subtypes such as hyperechoic and very-hypoechoic are extremely difficult to obtain from clinical practice, the test set was too small in the current data collection. Further evaluations are needed to test the reliability of our proposed methods for echogenicity.
Ablation Study
We used 100 randomly selected images and conducted two small scale ablation analyses on margin-smoothness and margin-irregularity to evaluate the contribution of individual features and their combinations to the overall performances of the methods. The test results are shown in Tables 4 and 5.
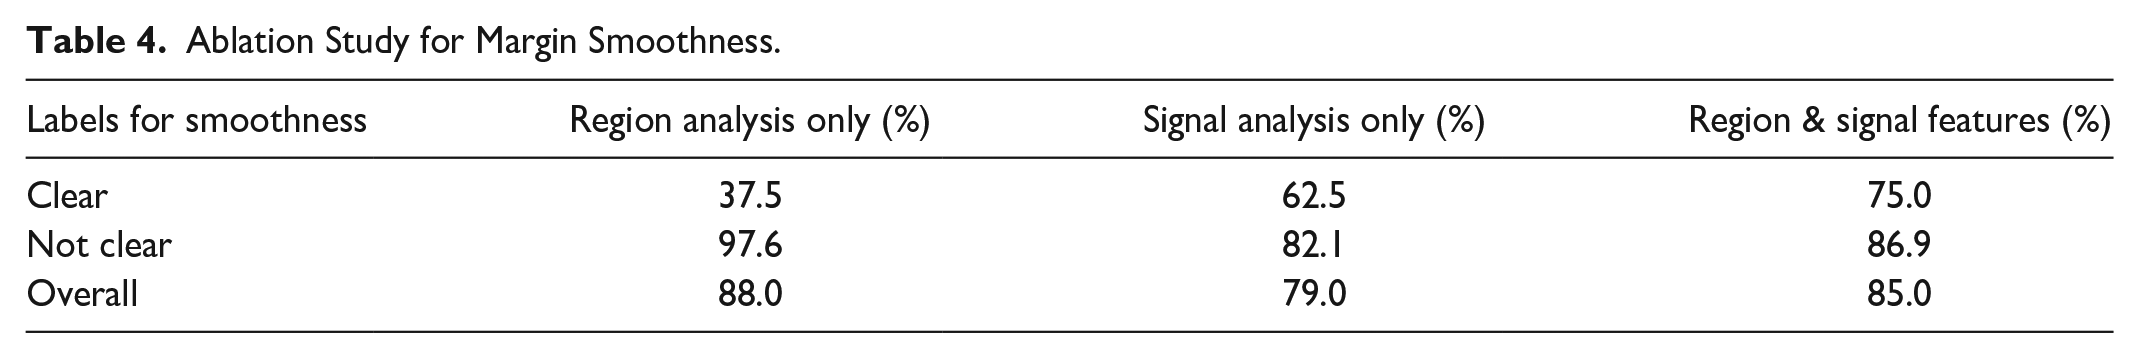
Ablation Study for Margin Smoothness.
Ablation Study for Margin Irregularity.
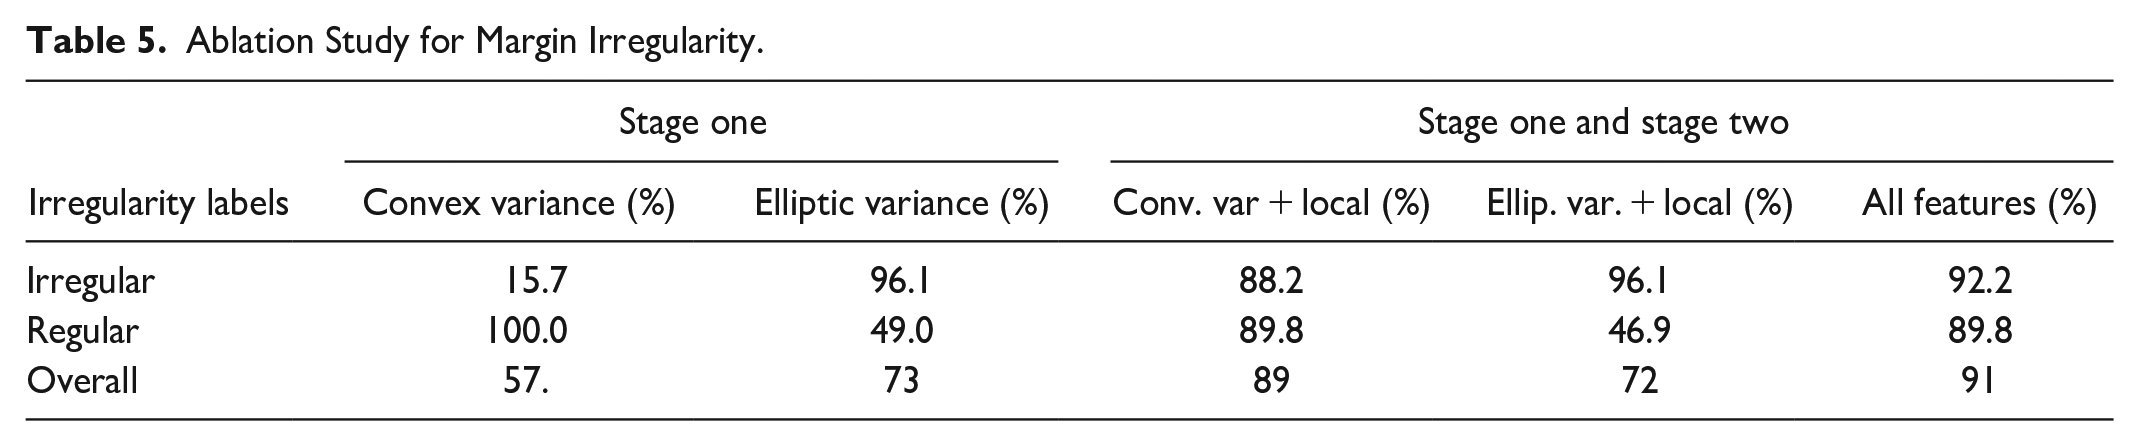
The margin-irregularity analysis revealed that between the stage one features elliptic variance (73%) contributes more to the prediction than convex variance (57%). The result also indicates the bias of the features toward different subclasses. However, adding the local features (lobulation and angulation), convex variance performed 17% better than elliptic variance with local features. The evaluation of the combined feature showed an improvement in the performance, with a performance increase of 2% compared to the highest-performing individual feature. Therefore, the features complement each other and enhance the method’s performances.
The margin-smoothness results showed that Signal Analysis had a higher contribution compared to Region Analysis. The analysis also demonstrated that the combination of Region and Intensity improved the model’s robustness compared to the individual features, suggesting that the two features complement each other.
To analyze the essence of each step of our proposed three-stage calcification detection method, we have performed an ablation study using the 157 images from test 1. Test results showed that the weak detector, CaNet and SURF filter had a 16% impact on average when identifying calcifications. The weak detector was mostly affecting calcifications detections. In comparison, both CaNet and SURF filters were mostly improving false detections. The region-growing method did not contribute much when identifying calcifications but improved the macro calcification classifications significantly (see Table 6).
Ablation Study for Calcification.
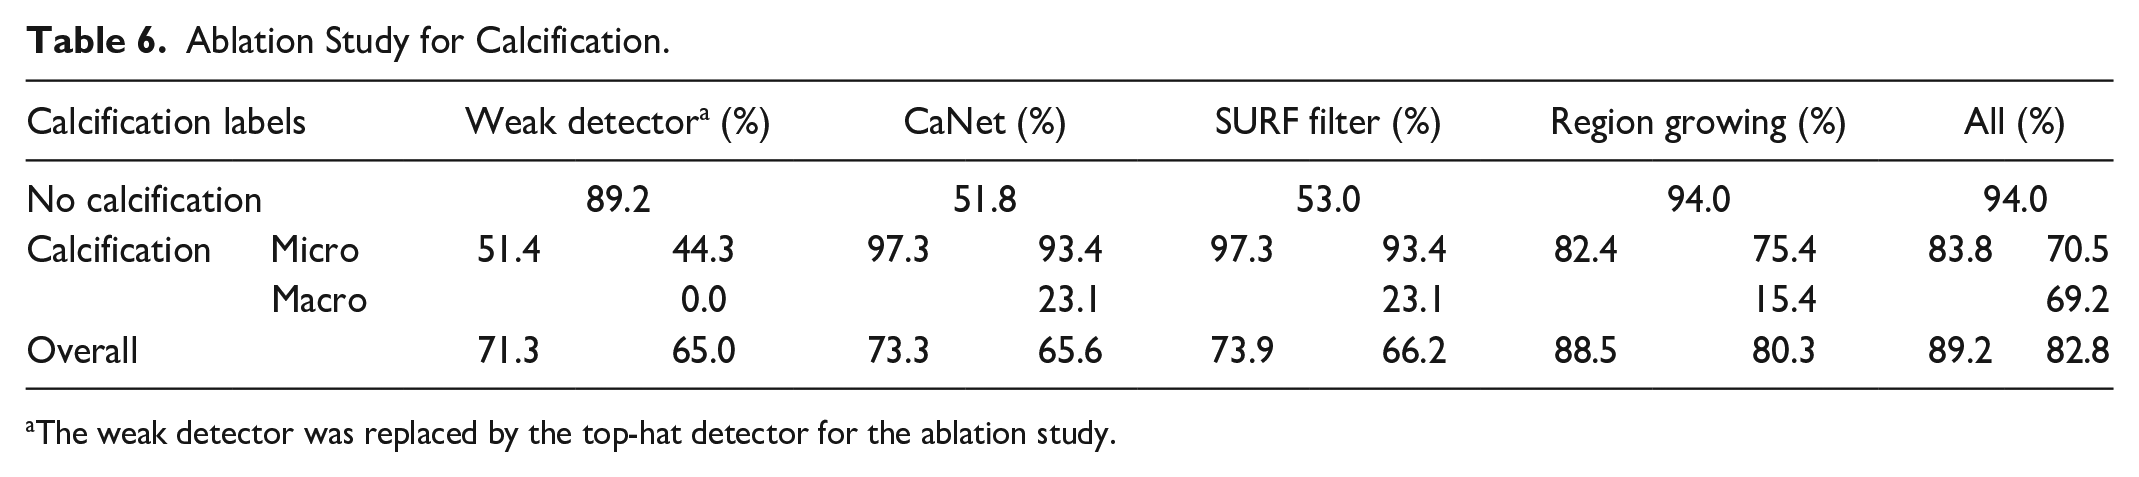
The weak detector was replaced by the top-hat detector for the ablation study.
Margin Smoothness Sensitivity Analysis to the Precision of the Region of Interest (ROI)
Whilst we are unable to apply other margin smoothness methods to our dataset due to the differing objectives between the studies as mentioned in Section 2, we have conducted an analysis about the sensitivity of our method when the delineated ROI does not precisely align with the lesion boundary. We purposely introduced various degrees of misalignment by applying random shifts to the initial ROI. The process begins with determining the ribbon width for each lesion (refer to Margin Smoothness section for the ribbon’s definition) with a defined shift range of ±20%. For each lesion, a random shift value is chosen from the predetermined range. This process is repeated 10 times on the 100 randomly selected images, and the performances are presented in Table 7.
Sensitivity Analysis of Margin Smoothness Method to the Precision of the Delineated ROI That is, the Performances When the Region of Interest Does Not Precisely Align With the Boundary of the Lesion.
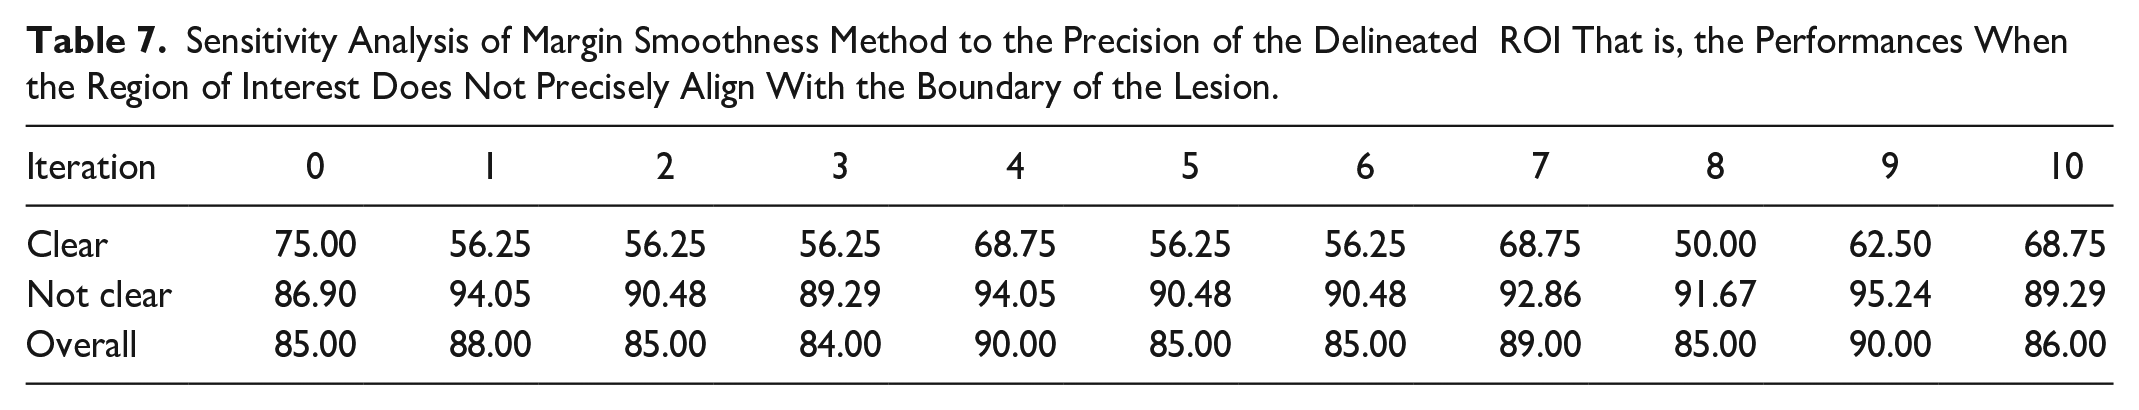
Table 7 highlights 10-iteration performances of the ROI precision analysis. Iteration 0 shows the performance with the original delineated ROI, while iterations 1 to 10 show the performances after applying the random shifts to the ROI. The overall performance indicates the method is not over sensitive to variations in ROI precision that is, the performance is relatively stable even with imprecise ROI. The performance has a standard deviation of 2.25. This conclusion is consistent with “Not Clear” performance which also has a standard deviation of 2.50. However, the “Clear” performances indicate high variability with a standard deviation of 7.82. This variability is attributed to the smaller sample size of “Clear” cases, where any misclassification will significantly impact the performance.
Conclusion
In this paper, we presented several methods for detecting US image characteristics of thyroid nodule for margin irregularity, margin smoothness, and calcification. The proposed method for margin classification have exploited new geometrical and texture features effectively. Our novel three-stage approach for calcification identification utilizes super-pixels and a convolutional neural network optimized for this purpose. Finally, a simple method for nodule shape and an initial algorithm for echogenicity using the thyroid gland as the main reference have been described. Our methods have shown good performances in identifying the US image characteristics of thyroid nodules with overall accuracies from 82.8% to 98.1% when tested on US images collected from two hospitals and labeled by multiple experienced radiologists. Encouraged by the results, we will continue improving our algorithms for thyroid characteristics analysis and expand our work to estimating TIRADS scores for the nodule and identify level of malignancy. Furthermore, we plan to adapt the methods for identifying characteristics for other kinds of lesions such as breast lesions and lymphoma. Finally, we will compare the performance accuracies of our methods with nodule contour extracted from automatic segmentation.
Footnotes
Declaration of Conflicting Interests
The author(s) declared no potential conflicts of interest with respect to the research, authorship, and/or publication of this article.
Funding
The author(s) disclosed receipt of the following financial support for the research, authorship, and/or publication of this article: This research is sponsored by TenD.AI Medical Technology.